

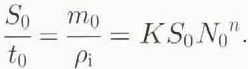
1. Introduction
Jökulhlaups are subglacial floods which occur, typically from ice-dammed lakes, at regular intervals. Possibly the best-known example is that of the jökulhlaups which emerge at intervals of 5-10 years from the outlet glacier Skeiarár-jökull, which drains the ice cap Vatnajökull in southeast Iceland. This ice cap was recently made famous by the subglacial eruption in 1996, which caused extensive collapse of the ice cover, and eventually a massive jökulhlaup over the proglacial outwash plain, Skeiarársandur. These jökulhlaups are due to the existence of a subglacial lake, Grímsvötn, which lies above the caldera of a volcano underneath Vatnajökull (Fig. 1). The lake exists due to the high geothermal heat flux which maintains a layer of water underneath the ice. As can be seen from the vertical sectional view in Figure 2, the lake level is well above the level of the caldera rim. However, it is confined by a "seal" which under normal circumstances is maintained by the overburden pressure of the ice surrounding the caldera. As explained by Reference BjörnssonBjörnsson (1976) and Reference NyeNye (1976), and as indicated in Figure 3, the excess ice pressure causes the hydraulic potential driving the water flow to have a maximum slightly down-glacier of the lake margin. Note that the seal is indicated by a maximum of the difference between the curves labelled zi and Zb in Figure 3. We will refer to this point (actually a line on the bed) as the seal (Fig. 2 or 3). It is important to remember that even while the lake is filling, there are conduits leading from the seal region both upglacier to the lake and down-glacier to the outlet. These conduits are formed and maintained by water generated by local geothermal and frictional heat sources. As time passes, the lake fills until eventually it becomes deep enough to break through the seal. The resulting floods (the Icelandic word jökulhlaup means "ice-leap") emerge 50km downstream after passing under the ice, and typically last 2-3 weeks, with peak discharges on the Order of 104 m3 s−1. Extensive descriptions of these jökulhlaups are provided by Reference RistRist (1973), Reference BjörnssonBjörnsson (1974, Reference Björnsson1988, Reference Björnsson1992) and Reference Tómasson, Pálsson and Ingólfsson.Tómasson and others (1981), and a variety of theoretical analyses have been undertaken (Reference NyeNye, 1976; Reference Spring and HutterSpring and Hutter, 1981, Reference Spring. and Hutter1982; Reference ClarkeClarke 1982; Reference Fowler and Ng.Fowler and Ng, 1996), following the basic drainage theory due to Röthlisberger (1972).
Map of Vatnajökull showing Grímsvötn and its drainage pathway. From Reference BjörnssonBjörnsson (1974).

The geometry of the lake and glacier, Grímsvötn and Skeĭkarársandur. Redrawn by F.S.L. Ng from figure 14 of Reference BjörnssonBjörnsson (1974).

A close-up of the seal region, redrawn from figure 14 of Reference BjörnssonBjörnsson (1974). The figure shows the ice surface zs,the bedrock zb, and a hydraulic potential line zi,for two different values of lake level hw. Inspection of the original figure indicates that this curve is defined by Zi = hw +(pi 0− Pi)/pwg, where Pi 0 is the ice-overburden pressure at the lake margin. if we suppose (Reference NyeNye, 1976) that p ≈ pi, then the hydraulic potential is φ = pi − pi 0 + pwg(zb — zb 0), where Zb = zb 0 at the lake margin, and then zi − Zb = hw - zb 0 - Φ/pwg, so that the maximum of Zb — Zi represents a hydraulic barrier. Alternatively and confusingly, the seal can be conceptualised as a region where the effective pressure N = pi - p is positive, where the water pressure p is calculated on the basis of a constant hydraulic potential (Reference BjörnssonBjörnsson, 1974, fig. 13). In reality, neither assumption is precisely valid, although both are useful interpretable approximations.

These theories have been more or less successful in explaining the basic features of the Grímsvötn jökulhlaups. Specifically, the shape of the flood hydrograph is relatively well (if not perfectly) explained. However, certain features remain puzzling, and the purpose of the present paper is to try to explain some of these.
Most obviously, numerical models have focused on the flood hydrograph, but have not been concerned with the cyclicity of the jökulhlaups. This is associated with a more pressing problem, namely, why the floods are typically initiated when the lake is at a level some 60 m below the flotation level (Reference BjörnssonBjörnsson 1988, p.79), or the level at which it could break the seal by pushing underneath the overlying ice. This is the problem with which we are principally concerned. In fact, one of the more interesting features of the 1996 jökulhlaup was that the flood did not begin until the flotation level was achieved, much to everyone's surprise. (An account of the eruption and subsequent jökulhlaup is given by Reference Einarsson, Brandsdóttir, Gudmundsson, Björnsson and Grínvold.Einarsson and others (1997; sec also Reference Gudmundsson, Sigmundsson and Björnsson.Gudmundsson and others, 1997); much useful information is given on a variety of websites, two useful entry points to which are http://www.hi.is/-mmh/gos/ and http://www.spri.cam.ac.uk/jok/jok.htm.) We will seek to explain the onset at flotation also. In addition, the 1996 flood lasted just 1 day, compared to the more normal flood duration of 2—3 weeks. We will provide a possible explanation for this.
We will begin by reviewing the classical Nye model for jökulhlaups, with some slight modifications. We then show that this model can be reduced, as can Reference ClarkeClarke's (1982), to a pair of ordinary differential equations, whose solution reveals oscillations. The amplitude of these oscillations grows unboundedly. We then analyze more closely the mechanisms of seal formation and breaking, which leads to an enhanced approximation of the Nye model. This model is able to predict periodic outbursts, and seal-breaking before or at flotation, depending on the lake-refilling rate. In this way, we can provide a putative explanation for both the normal mechanics of seal-breaking and the anomalous characteristics of the 1996 jökulhlaup.
2. The Nye Model
The Reference NyeNye (1976) model consists of five equations for the five variables Q, S, p, m and θw , where these are, respectively, the volumetric water flux in the channel, its cross-sectional area, the channel water pressure, the interfacial melt rate, with units of mass per unit length of the channel per unit time, and the water temperature. The primary limiting assumption is that the channel has a semicircular cross-section, cut upwards into the ice. In reality, it seems more likely that channelled flow will occur through a broad, low-ceilinged conduit (Reference Hooke., Laumann and KohlerHooke and others, 1990), and that sediment erosion (Reference Boulton and Hindmarsh.Boulton and Hindmarsh, 1987) will play an important part in controlling the channel shape. These points have been investigated to some extent by Reference Fowler and Ng.Fowler and Ng (1996), particularly as they affect the shape of the predicted flood hydrograph, but we do not pursue them here, as our primary purpose is to understand the mechanism whereby flood initiation occurs, and this can be done satisfactorily in the context of the familiar Nye model.
The equation for S is

and represents the rate of change (t is time) of cross-sectional area due to meltback of the channel walls (the first term) and viscous closure of the ice (the second term). In terms of its provenance, this equation is actually a kinematic boundary condition for the external viscous ice-flow problem, since the ice/water interface is a free boundary. pi is the ice-overburden pressure, ρi is the ice density, K is proportional to the flow constant in Glen's law, and n is the flow-law exponent, often taken as n = 3. A further equation for S follows from mass conservation of water in the channel, which takes the form

where s is downstream distance along the channel from the lake margin, ρw is the water density, and, apart from the melt rate m (which is actually insignificant in this equation, although of primary importance in Equation (2.1)), we include a supply term M which describes the base flow, derived from surface melt, rainfall or other subglacial melt. This term, although irrelevant during floods, turns out to be of great significance in controlling the seal dynamics between floods.
The momentum equation for the channel flow takes the form of an empirical correlation between flow and turbulent friction, and it is usual to assume a Manning law:

where g is gravity, α is the downslope angle and f is a friction factor which is related to the Manning roughness. The energy equation can be written in the form

where θi is the interfacial ice temperature, assumed to be equal to the freezing point, cw is the specific heat of water and L is the latent heat. The advection of heat on the left of Equation (2.4) is balanced on the right by the viscous dissipative heating term, and the losses due to latent- and sensible-heat supply to the interface. θw is the mean bulk water temperature, which may (and indeed must) be larger than the interfacial ice temperature θi There is then heat transfer across a turbulent boundary layer at the wall, and this is given by the relation (Reference Dittus and Boelter.Dittus and Boelter, 1930)

where a1 (≈0.2) is a constant, ηw is the viscosity of water and k is its thermal conductivity.
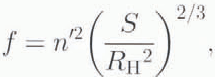
These five equations must be supplemented with an initial condition for S, and suitable boundary conditions, consisting of a flow or pressure condition at the channel inlet and outlet. In practice, the water pressure, and hence the effective pressure, defined as N = Pi — p, is prescribed at each end. (Note that in Reference NyeNye's (1976) notation, N denoted a friction constant. In this paper, its use is restricted to the effective pressure.) We take the origin of s (i.e. s=0) to be at the inlet to the channel, and we suppose the channel outlet at the snout of the glacier is at s = so. We thus choose
while at the inlet, conservation of mass requires that

where V is the lake volume and mL represents the geothermal melt rate, or more generally the lake-refilling rate (as in 1996, when the lake refilled rapidly due to inflow of melted water from the site of the fissure eruption (Reference Einarsson, Brandsdóttir, Gudmundsson, Björnsson and Grínvold.Einarsson and others, 1997). Suppose the lake level is z = zw, where z is height above sea level. We assume V = V(zw), and in fact V'(zw) = AL is the effective lake surface area (which may depend on zw). Now the water pressure at the inlet is pwg(zw −zb), where Zb is the height above sea level of the bedrock at the lake margin s = 0, and this is equal to Pi − N.Therefore (if zb and pi do not vary)

and thus the boundary condition at the lake inlet is

2.1. Non-dimensionalisation
The geometry of the lake and outlet glacier as described and drawn by Reference BjörnssonBjörnsson (1974) is shown in Figure 2, and a closeup of the seal region is shown in Figure 3, which also indicates how the seal is maintained. The geometry defines natural distance scales s0 ~50km and h0 ~ 1500 m for the variables s and z. In addition, we choose scales for the other variables by writing

Thus, the asterisked variables are dimensionless.
We choose the scales N0, θ0,t0,S0, m0 and Q0 as follows. We balance all three terms in Equation (2.1) by writing
Next, we define the basic hydraulic gradient ψ as
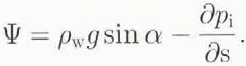
This quantity is the hydraulic gradient that exists if the basal water pressure is equal to the overburden ice pressure. As such, it corresponds to that discussed by Reference NyeNye (1976), and we associate the existence of the seal with the fact that ψ is negative near the lake. In terms of this, the actual hydraulic gradient is defined by

A natural scale for ψ is
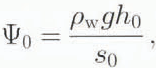
Since sinα~ h0 / s0, and so we scale ψ by writing
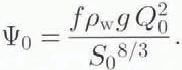
A balance of terms in Equation (2.3) is now effected by having ψ ~ fρwGQ2/S8/3 ; thus
In Equation (2.4), we balance the two terms on the right; thus
We choose θ0 by balancing the latent-heat term in Equation (2.5) with the term on the lefthand side:

Finally, it would seem natural to choose the scale for Q0 to balance the first and third terms in Equation (2.9); if we do this by prescribing

then we find, using values prescribed below, that Q 0≈ 1.2 × 10⁵ m3s−1, which is about 15 times the normal peak discharge. This can partly be ascribed to the fact that these are only scales, but it may also partly reflect the fact that the Nye-Röthlisberger model with semicircular channels is known to predict peak discharges larger than those observed (Ng, 1998). Since we do not want to unduly distort the relevant values of the parameters defined below, we instead choose Q0 to be a typical observed peak discharge.
The five relations in Equations (2.11) and (2.16–2.18) define the five scales S0, m0,t0, N0, θ0 in terms of Q0, and we find

The dimensionless model equation can then be written in the form (dropping the asterisks on the variables and taking n = 3)

Together with boundary conditions

where the parameters in Equations (2.21) and (2.22)are given by

We assume typical values ρi~0.9×10³kg m−3, ρw~103 kg m−3 ,ρw~2×10⁻³kg m−1s−1, k~0.6×Wm−1K−1,cw~4.2kJ kg−1K−1, L~3.3×10²kJkg−1,K=10−24 Pa−3s−1, g~10ms−2.
(The definition of the friction factor f in Mannings roughness law as written here is
where ń is the roughness coefficient and RH is the hydraulic radius (= S/l, where l is the perimeter). For a circular channel (S/RH 2)2/3 =(4π2/3)≈ 5.4, so that if n’ = 0.1 m −1/3s, then f~0.05 m −2/3s2.
We also take s0 = 50 km, h0 = 1.5 km. whence we find ψ0~300Pa m−1, and we suppose AL =32km2 = 3.2x10⁷ m2, based on Figure 4 of Reference Gudmundsson, Sigmundsson and Björnsson.Gudmundsson and others (1995), which indicates a typical range of 17-33 km2. An estimate of the refilling rate can be obtained from Figure 5 of the same paper, which indicates that the lake level rises between hlaups at about 20 m a −1. Together with the lake-level area, this indicates a typical refilling rate of 6.4 x 10¹¹ kg a−1, which is consistent with the independently inferred values over the past century based on flood-discharge magnitude (Reference BjörnssonBjörnsson, 1988, p. 100). If we anticipate that a typical value of Q0 = 104 m3 s−1 (from observations), then we find successively that

and the dimensionless parameters are of typical sizes

where for Ω we assume a base flow rate of MS0 = 102 m3 s−1, which represents typical discharges between jökulhlaups. Base flow is not often reported, but Björnsson (1998, p. 114) gives values in the region of 100 m3s−1 for the rivers Skaftá and Tungnaá draining western Vatnajökull, while Reference RistRist (1977, Reference Rist1984) and Sigursson and others (1992) repeatedly estimate base flow of the Skeiarárjökull stream system to be of the same size. We then see that these parameters are ≤O(1), which indicates that the scales we have chosen are sensible. The choice of Equation (2.19) for Q0 would correspond to choosing λ = 1.
(N,Q) phase portrait of the solution of Equation (2.30). Parameter values λ = 5 and v =0.1. Logscale(upper) and normal scale (lower).

Time series of the solution in Figure 4: Q(t) (upper) and N(t) (lower).

2.2. Model simplification
The parameters ε, δ and Ω are all relatively small. If we neglect them, it follows that

and hence that
and thus

We see from this that θ approaches a limiting value such that m = ΨQ over a dimensionless distance of over γQ1/2 . Now since Q was scaled with a typical peak discharge, it is clear that in general this distance will be very short. To accommodate this observation, we simplify the model by assuming that m =ψQ holds at all times, even though this will be inaccurate fora short time during maximum discharge. We do not consider this a disadvantage since our primary concern below is not with the shape of the hydrograph, but with the seal dynamics between floods.
For simplicity, let us suppose that ψ is constant, equal to 1. It then follows that N ≈ N(0,t) =N(t), and N and Q satisfy

where ![]() = dN/dt. The model thus reduces in this case to the solution of two ordinary differential equations!
= dN/dt. The model thus reduces in this case to the solution of two ordinary differential equations!
It is trivial to analyze these equations. There is a fixed point at Q = v/λ, N = Q1/12, corresponding to steady Röthlisberger drainage, but the lake-refilling equation renders this always unstable; the fixed point is an unstable spiral if v > 3.8× 10⁻⁴λ−1/2, otherwise it is an unstable node.
Figure 4 shows a numerical solution of Equation (2.30). Clearly the spiral structure continues for (N, Q) away from the unstable fixed point. The time series corresponding to this diagram (Fig. 5) shows a sequence of jökulhlaups of growing discharge, with long intervals (ofO(l/V)) between the floods. If we focus on a single flood, there is clearly no criterion for picking which hydrograph will occur, and this is a drawback of the model. In fact, this is another reason why the choice of Equation (2.19) for Q0 would be premature. Control of the peak discharge must depend on the initial conditions, which in turn must depend on the seal-breaking mechanism; therefore the choice of Equation (2.19), while appealing, must in fact be irrelevant.
3. Breaking the Seal
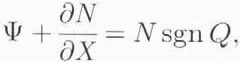
We now return to the full Nye model, in the form

We have seen that this model can describe the flood hydrograph reasonably well, in its approximate form. The question now arises whether the complete model is also able to describe the dynamics of the system between floods, or whether some further physical process must be included. Clearly the approximations introduced in section 2 will not allow for a proper study. In fact, the reason there is a seal at all is that the ice at the caldera rim causes a negative hydraulic gradient there. In other words, ψ is not only not constant, it is in fact negative near the rim. Pretty clearly, the model needs some adjustment there. In order to examine this region more closely, we define a rescaled distance variable X measured downstream from the point where the channel (or channels) from the divide enter the lake as
where δ is as given in Equation (2.23). We neglect γ as before, because the advection will certainly be negligible between floods. Ignoring terms in ε, the equations are then approximated by

It is essential to retain ω = δΩ ~ 1.4 x 10 −3 even though it is small, and it is also appropriate to do so when Q « 1. Similarly, it is valid to neglect the advection term for θ if Q «δ/γ, as is likely to be the case. Equation (3.3) are supplemented by the lake-refilling equation
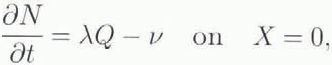
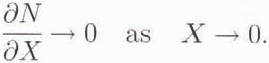
and we also require that N match to the outer solution as X →∞: this is effected by requiring that
This technical condition ensures that the solution in the seal region blends to the approximate solution away from the seal, which as before is obtained by taking ψ = 1. Equation(3.3)1 applies also if N<0 (though, in reality, hydrofracturing would then cause much more rapid opening of the channel), but if a different power law is used, say closure αNα , then the correct closure term in Equation (3.3)1 replaces N3 by │N│α−1N.
3.1. An approximate analysis
Before we solve this model numerically, we aim to understand its likely behaviour. Firstly, when Q«1, Equation (3.4) indicates that N varies slowly, so that Equation (3.3)1 implies that S rapidly (on a time-scale of 0(1)) approaches (quasi-) equilibrium, i.e.

Using Equation (3.3)3 , this leads to

(note that this allows for both positive and negative Q, supposing N > 0; if N « 0, then the comment after Equation (3.5) would apply, but in fact a flood is then initiated, and Equation (3.6) is inappropriate). The solution for Q is
where X* gives the dimensionless distance of the seal downstream from the lake. (Note, however, that the asterisk here no longer connotes a dimensionless rather than a dimensional quantity; all variables are dimensionless, and the asterisk denotes a particular value of X.) This equation (indeed the whole model Equation (3.3)) also applies during the flood, when X* « 0 (of course there is then no water divide, and —ωX* simply gives the dimensionless water flux at the inlet). By assumption, ψ(X) satisfies ψ(0)<0,ψ() > 0, and Equation (3.7) is to be solved subject to Equations (3.4) and (3.5), the extra condition serving to determine the unknown X*.
3.2. A particular example
To gain some analytic insight, we choose
to represent the negative value of ψ near X = 0, and also so that ψ→1 as X → (As we will see below in Figure 6,this is in fact a realistic representation of the data.) We also choose to replace the exponent 24/11 in Equation (3.7) by 1, and ignore the denominator │Q│2/11 , for the purpose (only) of illustration. (This can be realised by choosing closure proportional to │N│ α−1N to Equation (3.3)1 ,and the friction term on the right of Equation (3.3)3 to be Q│Q│/Sβ, with α = 1.5, β = 2.) We then have to solve
where
and we require that

Equation (3.10) describes the variation with distance near the seal of the dimensionless effective pressure. Since N is constrained both by the lake-refilling boundary condition and by the necessity that it match to the far field value, it is necessary to choose the water flux into the lake from the seal region, and hence also the location X* of the divide, in order to find a solution. In particular, the divide is determined in principle by the lake effective pressure, and it is consistent with the slow variation of N that X* can vary (slowly) with t.
The function ψ(X) computed via interpolation from observations of bed and ice surface, and the approximating function 1 — 4exp( —4X).

One finds generally that it is necessary that X* > 0 ( there is a seal) in order that N does not grow exponentially at +∞, which would prevent satisfaction of the first condition in Equation (3.12). The solution is then

where NL denotes the dimensionless lake effective pressure, as yet unknown. Since N must be continuous at the divide position X* we find that its value there, N*, is given by

It follows from this that the lake effective pressure is related to the divide position X* by

For this simplification of the non-linear model Equation (3.7), we see that the lake effective pressure NL and the divide effective pressure N* can both be written as functions of the divide location X* (all quantities being dimension-less). Equivalently, X* is given in terms of NL In particular, since dNL/dX* = 2eX*N*, it follows that while N* > 0,X' is a monotonically increasing function of NL. Thus Equation (3.12)3 implies that NL decreases slowly in time as the lake fills towards the flotation level.
We consider that a flood is initiated when N reaches zero anywhere; when this happens, channel enlargement begins to occur, and in practice this would happen more rapidly than in the model due 10 lift-off of the basal ice. The most obvious way in which flotation can occur is by having NL, reach zero, as happened in 1996.
However, it is also conceivable that N reach zero some way downstream of the inlet. The profile of N vs X given by Equation (3.13) is either hump-shaped or monotonically decreasing in X<X* and increasing in X > X*. As a consequence, if flotation is to occur (N reaches zero) downstream of the inlet, then it must be because N* reaches zero while NL is still positive.
Finally, there is a possible third mechanism for flood initiation, and this is if the divide location X* (which migrates backwards as the lake fills) reaches zero while NL and N* are positive. If this happens, then the discharge at the inlet becomes positive, and the quasi-static assumption used above becomes inadmissible. When the inlet discharge becomes positive, the positive feedback of the flow rate becomes operative, and a flood is initiated.
The violence of the resulting flood is associated with the minimum effective pressure which is reached. This is because if flotation occurs, then the glacier will lift off its bed, enabling much more rapid enlargement of channel area than is catered for in the Nye model. Equivalently, when the flood is initiated below flotation, the onset will be more gradual.
Thus, as the lake refills, a flood will be initiated when either the lake effective pressure NL, the water-divide effective pressure N* or the seal location X* reaches zero. Since NL and N* are monotonic ally increasing functions of X*, the various possibilities can be distinguished simply by finding where the graphs of these functions intercept the X* axis.
Note from Equation (3.14) that N* increases monotonically with X*, and thus as NL decreases according to Equation (3.12), so also do N* and X*. Now if X* = 0 in Equation (3.15), NL = 1 - [a/(b + 1)], and this is positive if a b+l. That is to say, as X* and NL decrease, then the divide location X* reaches zero while the lake effective pressure NL is still positive, if a<b+ 1. Furthermore, Equation (3.14) indicates that also N* remains positive in this ease. We call a seal of this type a "weak" seal, and it corresponds to the normal Grímsvötn flood initiation. The flood is initiated because the rising lake level causes the position of the water divide to migrate back towards the lake, reaching it while the lake level is still below flotation level.
Conversely, we define (for this simplified linear model) a "strong" seal to be one for which a > b + 1. In this case, the functions NL(X*)and N*(X*) are both negative when X* = 0, and since both increase monotonically with X*, the graph of each intercepts the X* axis at a positive value. That is to say, either NL or N* must reach zero, and hence flotation will occur, while X* is still positive, so that the divide is still downstream from the lake. In fact, it is always the case that NL reaches zero while N* > 0 if b > 1. This follows because NL is a monotonically increasing function of N* (since both increase monotonically with X*), and it is straightforward to show that when N* = 0, i.e. X* = b−1 ln[a/(b +1)], then NL <0.
To summarise: we characterise a strong seal (in the context of Equation (3.9)) as one with a value of a>b+1, and a weak seal as one with a<b+l. When the discharge at the lake inlet is small (and negative, or back into the lake) then there is a water divide a dimensionless distance X* downstream from the lake inlet. The position of this divide varies monotonically with the dimensionless lake effective pressure NL; this relationship arises through the determination of the discharge to the lake (which is proportional to the downstream divide distance) in terms of the effective pressure at the lake and the hydraulically controlled value further downstream. For a strong seal, the lake level rises to flotation while the divide is still downstream of the lake, while for a weak seal, the drainage divide slowly migrates backwards as the lake refills, and reaches the lake when it is still below flotation. In either case, the seal is then broken and the next flood is initiated.
Thus we see that seal-breaking when NL > 0 is consistent with the model, providing the reversed hydraulic gradient is not loo large at the inlet. With the scale N0 = 20 bar and failure normally observed to occur at 6 bar, this suggests that the dimensionless effective pressure NL =0.3 when X* = 0, which corresponds in this linearised model to a value a ≈ 0.7(b + 1). Figure 6 shows that in fact Equation (3.9) is a good fit to the measured hydraulic gradient, with a = b = 4. This gradient was computed from data provided by F. S. L. Ng, which in turn were derived from measurements reported by Reference BjörnssonBjörnsson (1974, Reference Björnsson1988). Measurements of ice surface and bedrock elevation along an assumed flowline were taken from maps 3 and 4 of Reference BjörnssonBjörnsson (1988), while independent values of the same quantities (at different locations) were taken from Figure 14 of Reference BjörnssonBjörnsson (1974). These two datasets were concatenated, and the computed value of ψ was calculated, using linear interpolation for the ice surface or bedrock elevation where necessary (since surface and bed elevations were not all measured at the same locations). The hydraulic gradient, computed as a simple finite difference between two adjacent points along the flowline, is then allocated to the point midway between them. With a = 4, the value corresponding to failure at 6 bar is b = 4.7, which also fits the data reasonably. There is little point being too precious about this, in view of both the roughness of the data and the gross simplification of Equation (3.7). Essentially, the theory thus far is entirely consistent with observation.Footnote ‡
3.3. Numerical method
We wish to validate the qualitative results by solving Equations (3.3) numerically,in the following form:

together with Equations (3.4) and (3.5). One might surmise that since in fact the glacier snout is at X = 1/δ ≈ 7, it might be easier to put N = 0 there. It will become clear that this is not so.
Our time-stepping procedure is this. If we have the solution at time-step j— 1, we use Equation (3.16)1 to estimate S at time-step j. Next, we step N at X = 0 forward via Equation (3.4); then we choose X* at step j so that ψ = Q│Q│/S8/3 at X = M, which is our end integration point: this forces ∂N/∂X = 0 there. Finally, we compute N at step j via quadrature, satisfying the boundary condition at X = 0. This first-order stepping procedure is then iterated using an improved Euler step for S. In principle, iteration can be carried on until convergence. In practice, a fixed number of corrective iterations (five for the results shown) is used.
It is inadvisable to try to shoot for N = O at X = 1/δ because Equation (3.7) has solutions which blow up at finite X. Direct numerical solution of Equation (3.16) with this boundary condition would require a slightly different approach.
While this approach is designed to understand the dynamics between floods, it is evident that the same model should also describe floods.
3.4. Results
Some results of solving Equation (3.16) are shown in Figures 7–14. It is well known that the Nye model has difficulty simulating the 1972 Grímsvötn flood hydrograph (Reference Spring and HutterSpring and Hutter, 1981); Reference BjörnssonBjörnsson (1992) showed that Reference ClarkeClarke's (1982) modified model can provide reasonable fits in some but not all cases. So we should not be surprised that realistic values of the parameters fail to yield quantitative results consistent with observations. One reason for this may be the unrealistic assumption of a semicircular channel (Reference BjörnssonBjörnsson, 1992), and we imagine that (but have not yet examined whether) a wide-channel theory will do much better in this respect. The important features here are the qualitative features of the results, which we consider to be robust.
Solution of Q0(t) of Equation (3.16) using ω = 0.1,v = 0.1,λ= 1,α = 4,b = 4.

The solutions of Equations (3.4) and (3.16) depend on the two parameters ω and v. These parameters are dimensionless measures of the base flow due to subglacial melting, and the lake-refilling rate, each of them measured relative to a typical peak flood discharge. Figures 7 and 8 show that at relatively high values of ω and v, the steady drainage state is in fact stable, in contradiction to the results in Figures 4 and 5, which are not controlled by the lake-inlet boundary condition. When both parameters are reduced, the steady state becomes unstable via a Hopf bifurcation, and Figures 9 and 10 show the resulting oscillation. Notice that the minimum value of NL is negative; there is nothing inconsistent with this in theory. the model applies perfectly well if N « 0, since the ice would certainly be pushed back viscously in this case. In practice, however, the model is inappropriate, since in reality we would expect lateral and forward-propagating hydraulic fracture, which would result in much more sudden floods.
Solution for NL(t) of Equation (3.16) using ω = 0.1, v = 0.1,λ= 1,a = 4, b = 4.

NL(t) with ω = 0.03, v = 0.03, λ = 1, a = 4, b = 4.

Q0(t) with ω = 0.03, v = 0.03, λ = 1, a = 4, b= 4.

In our analysis above of the simplified system (Equations (3.10–3.12)), we surmised that the condition for a weak seal was that (in terms of Equation (3.9)) a was sufficiently small. Although the (crudely) fitted values a = b = 4 determine a weak seal for the linearised problem (Equation (3.10)), this is not so for the non-linear model (Equation (3.16)). However, Figures 11 and 12 show that if a = 2 instead, then periodic floods are initiated when the lake effective pressure is positive, as normally observed.
NL(t) with ω = 0.0014, v = 0.002, λ = 5, a = 2, b = 4.

Q0(t) with ω = 0.0014, v= 0.002, λ = 5, a = 2, b = 4.

Finally, we observe in Figures 13 and 14 the effect of a sudden change in lake-filling rate, such as that following a volcanic eruption. Consulting Figures 11 and 12, we see that at t= 200, the lake level is about halfway between jökulhlaups, and we mimic the effect of the eruption by changing v from its "normal" value of 0.002 in Figures 11 and 12, to a value of 0.02 for 200< t < 220. The effect of this change is dramatic. Despite the "normal" flood onset at NL ≈ 0.17, the sudden filling causes an abrupt drop of NL towards and below zero, and the flood is initiated as the lake pressure reaches flotation level.
Lake effective pressure. Parameters as for figure 11, but V= 0.02 for 200<t<220.

Flood hydrograph. Parameters as for Figure 12, but v = 0.02 for 200<t<220.

4. Conclusions
The Nye-Röthlisberger theory of jökulhlaups gives an extremely successful account of the physics of subglacial floods, but in previous renditions it falls short of providing a full account of them. It is unable to provide a satisfactory fit to observed data, a shortcoming which has been associated with the likely non-circular shape of the channel (Reference BjörnssonBjörnsson, 1992), but one which we do not address in this paper. More importantly in the present context, it has not been used to predict (except in a colloquial way) the cyclic occurrence of jökulhlaups, nor their normal onset at sub-flotation lake pressures; nor can it distinguish a reason why the 1996 flood should have been delayed until flotation was reached.
We offer the following answers to these puzzles through an examination of the Nye model. First, as extensively discussed by Reference BjörnssonBjörnsson (1976) and Reference NyeNye (1976), the reason there is a seal at all is that the hydraulic gradient ψ is negative at the caldera rim. In consequence of this, the simplification afforded by the '"outer" approximation, wherein the basic hydraulic gradient is taken as constant, as a consequence of which the water flux Q is independent of downstream distance, cannot apply near the rim. Indeed, this outer approximation, while it admits regular floods, allows their amplitude to grow without bound. Our first result is to show that the model, with the seal region near the rim described consistently by detailed consideration of the region near the lake where the hydraulic gradient is negative, admits a steady solution which is stable if the lake-refilling and melt-water inputs are large, but as these parameters arc reduced, there is a Hopf bifurcation to a periodic limit cycle, i.e. the steady state becomes unstable, leading to stable periodic solutions. There is no restriction in the model to positive values of effective pressures, and the minimum effective pressure is positive only if the seat is "weak", in the sense that the hydraulic gradient at the rim is sufficiently small. For a weak seal, flood onset occurs when the lake level is below flotation, and is caused by the migration of the seal point (which demarcates where flow is towards or away from the lake) back towards the lake.
Conversely, for a "strong" seal, the lake level reaches flotation while the seal point is still downstream of the margin, and in the Nye model the channel begins to force its way-open by viscously pushing back the ice. In fact, this is unrealistic because if flotation is reached, then in reality the channel will enlarge rapidly through lateral hydraulic fracture at the bed. Similarly, we expect the resulting flood to hydro-fracture rapidly downstream much like a turbidity current (with different physics), and we thus expect that the resulting floods will be violent, as seen in 1996, but we do not include this in our model. Nevertheless, we do see that in a simulation of a jökulhlaup following an eruptive filling of the lake, the resulting flood is significantly more rapid and the discharge is larger, even with the relatively weak viscous opening of the channel. In addition, rapid lake refilling can easily alter the onset from occurring below flotation to occurring at flotation.
Let us try to explain in physical terms how the solutions of Nye's hydraulic model can behave in these two different ways, as illustrated in Figures 11–14. Equations (3.16) are essentially equivalent to Nye's original model. They describe, respectively, channel opening and closure, the discharge in terms of subglacial melt rate and the discharge in terms of hydraulic gradient. The lake-refilling equation, which can be written as (3.12)3, provides an evolution equation for the effective pressure at the lake, which decreases as the lake level rises. The existence of a seal, as shown in Figure 3, is due to the fact that the (dimensionless) basic hydraulic gradient ψ (Equation (2.12)) is negative near the lake. This gradient was computed assuming that the water pressure is equal to the overburden pressure (Reference BjörnssonBjörnsson, 1976; Reference NyeNye, 1976), whereas in fact the effective pressure (equal to the difference between them) will be non-zero. However, if the effective pressure gradient is sufficently small, then the basic hydraulic gradient is a good indicator of the flow direction, so that a seal point will exist, upstream of which subglacially derived melt-water flows backwards towards the lake. Far downstream, the basic hydraulic gradient is essentially constant (see Fig. 6), and the effective pressure essentially follows Röthlisberger's steady drainage characteristic, which has N α Q1/12. Thus even when Q is small between floods, N will not be too small, and in the aftermath of a flood the lake level is low, so that the effective pressure is also high at the lake (as in Fig. 11). Thus, following a flood, the effective pressure is relatively uniform, and a seal will exist as described above.
Now the lake level starts to rise slowly, and as it does so, the effective pressure there drops, causing the gradient ∂N/∂X in Equation (3.16) to increase, and thus also the hydraulic gradient. Remembering that this gradient is negative up-glacier of the seal and positive down-glacier, we see that the increasing lake level causes the point of zero hydraulic gradient (the seal) to migrate up-glacier towards the lake. Because of the slow change in lake level, the channel remains essentially in a balance between opening and closure, which simply determines the channel cross-section. There is now a competition between the dropping lake effective pressure and the backwards-migrating seal, associated with the increasing hydraulic gradient. If the basic hydraulic gradient is sufficiently negative (a strong seal), then the lake effective pressure can reach zero before the seal reaches the lake; flotation occurs, and a flood is initiated. For a weak seal, the seal reaches the lake while the effective pressure there is still positive, and a flood is initiated because the channel discharge is no longer controlled by the seal, but is related primarily to the cross-section, which now begins to grow through the positive feedback operative in the channel-opening term.
What is the effect on this discussion of a rapidly refilling lake? If the lake effective pressure changes on a time-scale similar to that over which the cross-section adjusts itself (days or weeks), then the effective pressure down-glacier from the lake will also decrease rapidly, and this causes the channel-closure rate to decrease more rapidly. Consequently, the channel increases more rapidly in size. As long as the seal exists, so that the water flux is controlled by (unchanging) subglacial melt, this will have the effect of reducing channel friction, and thus the increase of the hydraulic gradient will be slowed down. In turn, this implies that the seal will migrate more slowly up-glacier than usual, and it provides a mechanism whereby the seal can act strongly if flotation is reached before the seal reaches the lake.
We consider that the Nye model provides a robust explanation of the various puzzles associated with flood initiation. But we acknowledge that the model is impaired in its ability to capture accurate quantitative data. Therefore, the numerical values of such quantities as flood-cycle period and peak discharge are seriously inaccurate using realistic values of the parameters. It is no doubt possible to find better simulations by judiciously tweaking parameters, but there is little point to this exercise. We expect that a satisfactory quantitative fit will be obtained through the use of a wide-channel model, whose corresponding investigation awaits future work.
Acknowledgement
I am as ever indebted to F. S. L. Ng for his vigorous scrutiny, and for assistance in analyzing the hydraulic potential data.


