

Implications
Dairy farming is a highly dynamic and integrated production system that requires continued and intense decision-making toward optimal management and therefore computerized data-driven decision support tools are crucial. The University of Wisconsin-Madison Dairy Management program has produced a suite of computerized decision support tools to assist dairy farm management that are openly and freely available at http://DairyMGT.info. Tools are customizable to be farm specific. Dairy farmers and dairy farm advisers are using these decision support tools to make better more informed decision-making. Better decision-making is translated into improved performance, reduced environmental impact and enhanced profitability.
Introduction
Data-driven decision-making is a necessity in today’s dairy farm systems. Dairy farms have embraced technological innovations and procured vast amounts of permanent data streams, but all this information is not integrated efficiently to improve management and decision-making. It is imperative to develop a system that can collect, integrate, manage and analyse on-farm and off-farm data for practical and relevant actions. It is documented that dairy farmers are making important management decisions in a non-programmed manner and relying mostly on intuition and experience (Groenendaal and Galligan, Reference Groenendaal and Galligan2005). These decisions are inefficient in the use of available data because of the lack of proper analysis frameworks and decision support tools. In general, dairy farms are deficient in the use of advanced projection frameworks such as simulation and optimization (Bewley et al., Reference Bewley, Boehlje, Gray, Hogeveen, Kenyon, Eicher and Schultz2010). An efficient decision support system framework is critical for dairy farming management and decision-making (Meadows et al., Reference Meadows, Rajala-Schultz and Frazer2005; Cabrera et al., Reference Cabrera, Hildebrand, Jones, Letson and de Vries2006; Giordano et al., Reference Giordano, Fricke, Wiltbank and Cabrera2011). Recognizing this situation, several research and extension institutions and companies are providing decision support tools based on expert systems and artificial intelligence as an attempt to cover this gap (Chase et al., Reference Chase, Ely and Hutjens2006). One of these initiatives is the University of Wisconsin-Madison Dairy Management research and extension program (http://DairyMGT.info) that since 2008 has been developing and promoting the use of simple, solid, robust, user-friendly, scientific decision support tools for dairy farm management. The objective of this review paper is to describe the development and application of a suite of more than 40 computerized dairy farm decision support tools contained at the University of Wisconsin-Madison Dairy Management website http://DairyMGT.info: Tools. These data-driven decision support tools are aimed to help dairy farmers improve their decision-making, environmental stewardship and economic performance. This paper discusses the development and application of 20 selected (http://DairyMGT.info decision) support tools.
The University of Wisconsin Dairy Management website
The University of Wisconsin-Madison Dairy Management website (http://DairyMGT.info) is an online informational system that highlights the ‘Tools’ section where more than 40 computerized decision support tools are contained along with their scientific supporting information such as research and extension papers, abstracts, presentations, among others. Tools in the website (http://DairyMGT.info) are classified in dairy farm management areas such as: (1) feeding and nutrition, (2) heifers, (3) reproduction, (4) genomics, (5) production, (6) replacement, (7) health, (8) financial, (9) price risk and (10) environment. Next, we briefly describe a selected number of 20 available tools. For each selected tool, the goal is to provide the reader with a clear idea of (i) what it does, (ii) what is the scientific background behind it and (iii) how it could be used for practical decision-making. For other available tools that are not described below, readers could speculate about their function and be motivated to investigate more about them in the website. All these tools are available at http://DairyMGT.info: Tools. Unless indicated differently, all tools are web-based online software; that is, they work directly in a web browser. Adoption of the tools has steadily increased over the years continuing the trend reported in a few years back (Cabrera, Reference Cabrera2012b). Such report includes detailed tool uses statistics and users’ profiles.
Feeding and nutrition
FeedVal
FeedVal tool assesses the actual value of feed ingredients according to their nutrient composition and selected refereed feeds that have a market price. For those feeds that have a market price, it provides a comparison of the predicted price v. the market price and mark those feeds from best to worst purchases. FeedVal helps dairy farm producers, dairy farm nutritionists and dairy farm consultants make economical optimal decisions for purchasing and using feed ingredients for dairy farm feed rations.
FeedVal tool is inspired by St-Pierre and Glamocic (Reference St-Pierre and Glamocic2000) who proposed an approach to solve multiple equations in irregular matrixes composed of feed ingredients (in the rows) and nutrients (in the columns). In brief, the matrix solution is the value of each nutrient that best explains the aggregated market price of all feeds.
User needs to define the feed ingredients, number and which nutrients to be evaluated (e.g. CP, energy, fiber, starch, methionine), the market price of referee feeds and the nutrient composition of all evaluated feeds. By default, FeedVal is pre-loaded with NRC (2001) nutrient compositions of 40 popular dairy feeds and daily feed prices for the Midwest United States (updated automatically every night). However, user is welcome to change any or all the information pre-loaded at start-up.
Grouping Strategies for Feeding Lactating Dairy Cattle
This tool quantifies the economic value of disaggregating lactating cows in more nutritional groups and providing a different diet to each group v. providing only one diet to all lactating cows. As results it reports the economic margin, which is the milk income over feed costs (IOFC)±additional costs or benefits such as management, milk losses and additives when comparing current nutritional grouping strategy and the new one. Results are displayed for four grouping criteria: (1) cluster – protein and energy requirement of grouped cows; (2) days in milk; (3) fat corrected milk production (FCM); and (4) FCM+BW. Nutritional grouping increases IOFC and the economic margin, decreases environmental emissions, and improves herd health (Cabrera and Kalantari, Reference Cabrera, Shaver, Dyk, Salfer, Tranel and Endres2016; Kalantari et al., Reference Kalantari, Armentano, Shaver and Cabrera2016). This tool was conceived to demonstrate and quantify the economic value of increasing the number of diets for the herd, so farmers are motivated to implemented it.
Grouping Strategies for Feeding Lactating Dairy Cattle tool was inspired by McGilliard et al. (Reference McGilliard, Swisher and James1983) who proposed a cluster approach as the best criterion to group cows and demonstrated that nutritional grouping was better than no grouping. The tool ranks lactating cows according to the selected grouping criteria and group them based on the pre-defined group sizes. For the cluster criterion, it first calculates energy and protein density requirement for each cow based on FCM, BW and stage of lactation. Then, the estimated intake according to NRC (2001). Finally, the cow’s nutrient density is the division of nutrient amount by the intake. Consistently, nutrient density of diets is formulated for all comparisons at 83rd percentile requirement of the group (Stallings and McGilliard, Reference Stallings and McGilliard1984). Once the groups and diets are defined, the tool calculates the IOFC for each cow and aggregates it for each group and for the whole herd.
User needs to define nutrients costs, milk price and enter a matrix of all lactating cows with the following fields: identification, lactation, days after calving, milk production, fat percentage and optionally BW. If no BW for cows is available, an estimated average BW for the herd is required. Once the data were entered, user defines current and possible situation on the herd regarding nutritional grouping. For example, a farm providing all lactating cows with only one diet (current) could opt for providing three diets. Next, user defines the size of the groups, the current diet density and additional expected costs and benefits. Possible additional costs could include extra labor and management, and milk production losses due to re-grouping cows. Potential benefits could include savings on feed additives not needed anymore for some groups of cows.
The tool then displays the economic benefit of different group strategies compared with the farm defined current strategy. Results include, for each group and criteria, a list of cows that belong to each group and the recommended nutrient density of their diet.
Optigen® Evaluator
This tool calculates the return on investment of using Optigen® in diets of lactating cows. Optigen® is a non-protein nitrogen, controlled-release urea supplement that concentrates the protein fraction of the diet creating space for more fiber and energy in the diet. As a result, the tool reports the value of using Optigen® as an aggregated of extra costs and benefits including additional milk production and diet re-formulation. This tool could help dairy farmers in the decisions if to use and how much Optigen® or any other controlled-release urea as supplement in the diet to improve the economic margin.
Optigen® evaluator is enthused by Inostroza et al. (Reference Inostroza, Shaver, Cabrera and Tricarico2010) that tested the effect of this product in commercial dairy farms in Wisconsin. Diets are maintained at the same level of protein before and after including the product, which entices a decrease in the main protein ingredient (e.g. soybean meal) and an increase in the energy ingredient (e.g. corn) assuming same level of dry matter intake. The tool adds the value of additional milk produced (if any)+the costs saved by using less protein ingredient and subtracts the investment on the Optigen® and the additional cost of the energy ingredient providing a dollar value of using the additive.
User defines the amount of Optigen® included and its price per unit, the source of protein to be replaced and the source of energy to be added. Pre-loaded dry matter and protein content of alternative feed protein sources and feed energy sources are based on NRC (2001), but user has the opportunity to edit or add to the list. Finally, user defines the additional milk expected and its price. Tool’s associated paper (Inostroza et al., Reference Inostroza, Shaver, Cabrera and Tricarico2010) indicates that average additional milk production because of Optigen® is 0.5 kg/cow per day. The tool then calculates the extra cost of Optigen®, the cost saved in protein feed, the extra cost of energy feed, and the extra value of milk and the sum of all of them as the value of using the feed additive.
Income Over Feed Supplement Cost: Excel Spreadsheet
This tool maximizes the income over feed supplement cost (IOFSC) for a defined amount forage in the diet. The matrix of results are amounts of energy and protein feeds that maximize the IOFSC under the imposed limitations of feed amounts and rumen undegradable protein (RUP) and rumen degradable protein (RDP). The tool also provides a visual representation of IOFSC and milk production when substituting energy and protein feeds in the diet. It is designed to assist producers and consultants select the optimal amount of feed supplements in diets of lactating cows.
The rationale behind this tool is the fact that traditional diet formulation does not consider milk production due to changes in CP and its RUP and RDP components in the diet. Profitability can be improved (Rotz et al., Reference Rotz, Satter, Mertens and Muck1999) and N excretion decreased (Wattiaux and Karg, Reference Wattiaux and Karg2004) by tweaking the protein and its components in the diet. Hence, the tool performs a non-linear IOFSC maximization (Cabrera et al., Reference Cabrera and Kalantari2009), rather than the traditional least feed cost optimization. It uses NRC (2001) equations for intake and milk production in function of RUP and RDP, and pre-defined RUP, RDP and protein available according to standard or user-defined values of forages, energy supplements and protein supplements. The substitution is a sensitivity analysis of increasing a protein supplement while decreasing an energy supplement. The tool uses same equations and information to graph milk production and IOFSC in relation to different levels of diet protein (Figure 1).
Milk production and milk income over feed supplement cost (IOFSC) according to CP on the diet graphed with the Income Over Feed Supplement tool. Crude protein comprises rumen undegradable protein (RUP) and rumen degradable protein (RDP) and milk production is a function of RUP and RDP (NRC, 2001). Maximum milk production is 34.59 kg/cow per day when CP is 17.80% (4.8% RUP, 13.0% RDP), but maximum IOFSC is $4.17/cow per day when CP is only 16.7% (4.4% RUP, 12.3% RDP). Figure demonstrates that the economic optimal level of production does not necessarily coincides with the maximum level of production. Farmers can increase their economic margin and prevent nutrient wastes.

User defines dry matter intake, according to a suggestion based on NRC (2001) milk production, BW and days postpartum. User also defines sources and amounts of forages in the diet. Then, user needs to set the possible sources of energy and protein supplements – and optionally their current usage, along with their prices and upper limits in the diet. Finally, user defines percentage upper limits for RUP and RDP in the diet. The tool then suggests a diet that maximizes the IOFSC.
Dairy Extension Feed Cost Evaluator
This is a benchmarking database tool to allow farmers and consultants store, analyse and compare herd or herds diet details. It calculates the amount of forage and supplement feed purchased or home-grown, the intake and feed cost of all defined diets in a farm, and the IOFC for the lactating cows. The tool can run comparative analyses with previous farm data and/or with other farms and using entered prices and costs or using standardized prices. It is designed to provide producers and consultants an indication of their performance compared with the past farm performance or with other farms. It allows the user to build operational plans of improvement.
The rationale behind this tool is to control profitability through the management of IOFC, which represent the most important economic factors in a dairy farm and it is a proven method to evaluate profitability (Cabrera et al., Reference Cabrera, Shaver and Wattiaux2010). Calculations are based on statistical analyses applied to user-defined filters and could include data from other users. Visual analytics are used to display analysed farm in function of a selected sample of farms.
Access to individual database requires a login account, so first thing user needs to do is to create an account that will save all the data according to date, farm and diets inside a farm. After creating an account, user can define as many farms as desired. Next, for each farm and date, user defines ingredients used, and their prices. User then defines all diets used in a farm and for each one of the diets the amount of each feed ingredient used. Then the tool algorithms calculate the cost of each diet and the IOFC for each lactating cow group. Finally, the users can aggregate and filter their own data or combine with other users’ data for comparative analyses.
Quick Assessment for Diet Formulation
This tool does not replace the full diet formulation software normally used by nutritionists. For instance, this tool has been designed to complement diet formulation software. The motivation behind this tool is to provide a simple and quick assessment of the ingredients that will provide the least cost of a diet under current feed ingredient prices and selected nutrients.
This tool performs an optimization to find out a list and amount of feed ingredients (a diet) that will provide defined acceptable levels of selected nutrients at the least cost (NRC, 2001).
Calculations are standard optimization algorithms with the objective function of minimizing the aggregated cost of the ingredients under the restrictions of providing a concentration of nutrients within a range (a value between a defined minimum and maximum). Since concentration of nutrients depends on the amount of feeds and their dry matter content, there are feedbacks between ingredients tested and change of concentration of all nutrients and therefore the solution requires a non-linear optimization algorithm with iterations.
User defines a matrix of feed ingredients (rows), the nutrients to be used for a solution and feeds’ nutrient contents (columns) along with correspondent dry matter and prices. This is performed by either editing pre-defined default matrix or by downloading, editing and uploading back a spreadsheet. User also defines the acceptable range (minimum and maximum levels) of feed ingredients and nutrients in the solution. The tool is pre-loaded with NRC (2001) nutrient composition of common ingredients. The tool is live connected to Midwest U.S. price data sources and therefore updates prices daily for ingredients that have such information (most of the feeds). Ingredients that do not have such information are loaded with a default value and are noted with a faded color. After solving it, the tool presents a list and amount of ingredients that comply with the nutrient requirements at the least cost together with the final concentration of each one of the nutrients in the diet.
Reproduction
Wisconsin-Cornell Dairy Repro$: Standalone executable software program
This tool calculates and compares the economic value of reproductive programs including timed artificial insemination (AI), heat breeding (HB) and a combination of them. Results show the reproductive performance, its corresponding economic outcome and statistics of the herd demographics. The goal of this tool is help producers and advisers decide on reproductive management decisions that improve current reproductive performance and the farm economics.
Tool’s underline model is a sophisticated Markov chain algorithm described in Giordano et al. (Reference Giordano, Kalantari, Fricke, Wiltbank and Cabrera2012) that simulates daily each cow (and young stock) in a herd and computes the net return associated with reproductive performance. The model follows daily probabilistic events of aging, replacement, mortality, pregnancy, pregnancy loss and calving within a defined reproductive program.
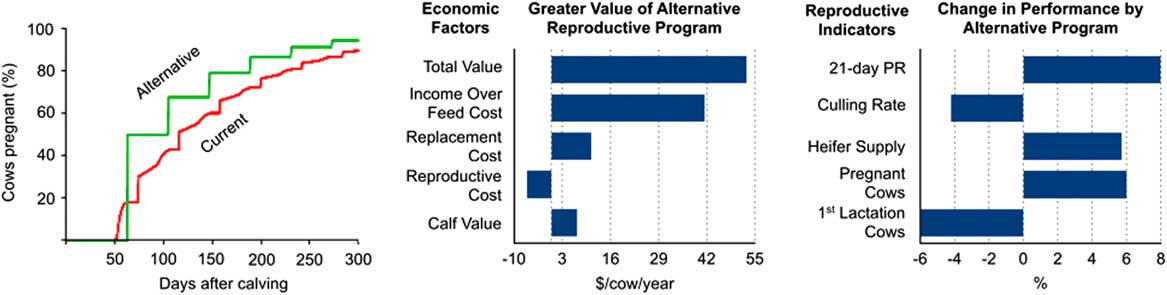
User defines herd and economic parameters, lactation curves and very detailed reproductive programs. The tool allows the user to define a current and an alternative reproductive program, so results can be expressed as a difference of the alternative and the current program and therefore know the expected value of the changes. User define reproductive programs using an interactive menu that was created with the most common reproductive protocols in the dairy industry (Cabrera and Giordano, Reference Cabrera and Giordano2013) and the definition includes economic values of labor for HB and hormones for time AI as well as a calendar of activities within timed AI protocols. Results show the economic difference between the current and alternative program and the economic components of the difference, the reproductive performance and the herd demographics that includes analyses of heifer supply and demand (Figure 2).
Reproductive and economic performance of current reproductive program v. alternative reproductive program. Current program: PreSynch OvSynch-14 (30% conception rate (CR)) followed by OvSynch (30% CR) with heat breeding (HB) of 60% heat detection and 30% CR. Alternative program: Double-Ovsynch (50% CR) followed by OvSynch (35% CR) without HB. Reproductive performance (left panel) indicates faster and greater pregnancies achieved by alternative program. Corresponding economic analyses (middle panel) indicates that with exception of reproductive costs, alternative program outperforms current program in all other economic measures, resulting in a net gain of $52.7/cow per year. The 21-day pregnancy rate (PR), the heifer supply and the percentage of pregnant cows in the herd increased, whereas the culling rate and percentage of first lactation cows decreased with the alternative program (right panel). Using this tool farmers can select the most efficient and profitable reproductive program for their farms.
Economic Value of Sexed Semen Programs for Dairy Heifers
This tool estimates the net present value difference between a sexed semen program and a conventional semen program for dairy heifer. Results show the economic value of various sexed semen programs at different levels of reproductive efficiency. The goal of this tool is to help dairy producers and consultants in deciding if and how many sexed semen breedings would be optimal to use according to their farm and market situations.
The tool performs partial budgets aggregating: revenues gained, saved costs, expenses incurred and revenues foregone (Cabrera, Reference Cabrera2009) after simulating the cumulative pregnancy of heifers under different reproductive protocols using sexed semen and comparing it with conventional semen.
User defines conventional semen minimum, average and maximum conception rate, and expected sexed semen conception rate together with female offspring expected and economic values including semen costs and male and female offspring market values. The tool calculates the economic value of sexed semen when using it for first, first and second, first to third, first to fourth and first to fifth services at the three-defined conventional semen conception rates displayed in a bar graph. User can determine if any and how many of these bars are positive (sexed semen with greater value than conventional semen) and select the greatest positive value that becomes the optimal sexed semen protocol for the farm and market conditions (Figure 3).
The Economic Value of Sexed Semen Programs for Dairy Heifers. The combined expected value (EV) of using sexed semen on dairy heifers was $30.2. This value resulted after considered three possible levels of conception rates (CR) at first service of 34%, 56% and 83% when using conventional semen, and 27.2%, 44.8% and 66.4% when considering sexed semen. Analysis also considered herd and economic parameters as defined in the top panel. Each bar represents the economic net return of different number of services using sexed semen. The maximum value occurred when using sexed semen only in the first service when CR is low ($6.5) and using sexed semen in the first two services when CR is medium ($57.9) or high ($111.6). Using this tool farmers can decide if to use sexed semen on dairy heifers and if so, for how many services in order to have the best economic value.

Dairy Reproductive Economic Analysis
This tool calculates net return associated with the reproductive performance defined by monthly pregnancy rates. Different than the Wisconsin-Cornell Dairy Repro$, this tool is not prepared to define detailed reproductive programs, but the monthly expected reproductive performance and its aggregated cost for all months in all lactations in which cows can be bred. Also, different from the Wisconsin-Cornell Dairy Repro$, this tool lets the user, if desired, to define monthly transition probabilities of culling and abortion. Results show the herd demographics and its economics associated with a defined reproductive performance. The goal of this tool is to help decision-makers have a first assessment of what to expect under alternative changes in reproductive performance. Later, a finer analysis with the Wisconsin-Cornell Dairy Repro$ would be expected. This tool calculates the value of a reproductive program as the sum of five factors: milk IOFC, culling costs, mortality costs, income from new born and reproductive program cost (Cabrera, Reference Cabrera2011) by solving a matrix defined by nine lactations, months in lactation, and months in pregnancy and calculating their associated economic values.
User defines pregnancies per month and lactation; abortion per month in pregnancy and lactation; culling per month in lactation and lactation; a function that defines lactation curves per lactation; and economic factors such as milk price, feed costs, heifer replacement value or salvage value of culled animals. Results show a detailed table that represents the herd structure at steady state and their associated expected net returns. The tool also reports the total herd net return and the contribution to it of the main economic components. User can compare the net return of different reproductive performances or simply calculate the value of improving reproductive performance.
Heifer Pregnancy Rate
This tool calculates the true heifer pregnancy rate of a herd retroactively. Results show the distribution of age at first calving, the speed of heifers becoming pregnant, the average age at first calving and the breeding efficiency. The goal of the tool is to compare heifer herd’s performance with a goal performance and know what the economic and environmental benefits would be when reaching the goals. Environmental outputs are measured as manure and P production, which are estimated based on NRC (2001) functions according to live weights.
The tool introduces and proposes the concept of true pregnancy rate (©Hoffman, 2012) to measure and compare reproductive performance of dairy heifers. In brief, the true pregnancy rate is the speed at which heifers become pregnant from the onset of insemination, which is measured as a percentage.
User enters a matrix with a list of 1-year records of age at first calving of heifers. User also defines the predominant breed of the heifers. Results display two graphs calving age distribution and cumulative pregnancy, both of which also display the suggested goals. Results are also composed of tables of goals comparisons regarding average age at first calving, breeding efficiency, excess rearing cost and excess manure and P production. Based on those results, user can adjust the reproductive program to have a distribution of pregnant heifers and age of first calving closer to the goals.
Premium Beef on Dairy Program
This tool was conceived as an aid to help producers in their decision-making regarding the use of beef semen on dairy cows and heifers. Results show if the produced replacements would be enough to maintain the herd size and the overall net return of the current situation of culling, reproduction and calf mortality. It also calculates the production of calves under a defined protocol of using conventional, sexed and beef semen according to breeding services and genetic makeup.
The rationale of the tool comes from the opportunity of dairy farmers to produce higher value beef calves, so the objective is to analyse the net return of switching inseminations from conventional or sexed dairy semen to beef semen (Lopes and Cabrera, Reference Lopes and Cabrera2014). The tool calculates the number of today’s eligible heifers and cows to be bred and the production of male and female calves according to semen used, distinguishing the genetic makeup of the bred animals. The net return is composed of the calf values, semen costs and ear tag costs.
User enters the number of adult animals, culling rates, use of sexed semen in heifers and reproductive performance and the tool calculates the number of heifers and cows eligible to be serviced and the calves needed as replacements. User then can re-define the number of eligible animals for breeding, split those animals according to their genetic makeup on top and bottom groups (%), assign a semen type to breed each group (conventional, sexed or beef), and the conception rate expected by semen type and animal breeding group. The user then defines, by semen type, the percentage of dairy female calves and its cost. Finally, the user enters the value of calves produced according to calf gender and semen type. The tool calculates the partial and total net return of selected options – together with the replacement calves produced.
Replacement
The Economic Value of a Dairy Cow
This tool calculates the value of each cow in the herd, which has critical implications for decision-making in many areas of dairy farm management. The value of a cow determines how much that cow is projected to contribute to the herd compared to how much a replacement would contribute to the herd. The value of a cow then first establishes if it is better to keep or replace an animal. Nonetheless, this value can be used for other multiple decisions such as if to treat, or if to breed and animal – and if bred, what type of semen. Also, this value can be used to calculate important economic indices widely used in the dairy industry such as the value of a pregnancy, the cost of a day open or the cost of a pregnancy loss.
This tool’s framework introduces a new and simpler formulation of the replacement problem that can include cow-specific and replacement genetic traits (Cabrera, Reference Cabrera2012a). It uses a 2320 states Markov chain model defining 33 months after calving, non-pregnant and one to nine pregnancy months, and 10 lactations. It includes transition probabilities of culling, abortion and pregnancy. It calculates the aggregated net present value of evaluated cow and compares it with the aggregated net present value of a potential replacement and the difference of both values plus the cost of replacement transaction becomes the value of the cow (Figure 4).
Net present value of an average production cow in third lactation, 7 months after calving and 4 months pregnant (evaluated cow) and net present value of a replacement cow (replacement) throughout 100 months in the future. Aggregated net present value of the cow minus aggregated net present value of the replacement minus the replacement transaction cost=economic value of the cow=$497 (all other parameters as defined in Cabrera (Reference Cabrera2012a)). Every dot in the curves is in function of (1) productivity and genetic makeup – here, they are both average cows, (2) the state of the cow – lactation, months after calving, pregnancy status and (3) natural risk of replacement – probabilistically, a cow is composed of the original animal and a timely growing proportion of its surrogates, which is evidenced in the fact that both animals (evaluated and replacement) end up having the same net present value after a long period of time. Note that both curves have a slight negative trend due to the interest (discount) used to convert future values to the present.

User defines for each cow its state=lactation, days after calving and days in pregnancy and its genetic production capacity. Also for the replacement cow, the user defines its genetic production capacity. In addition, the user enters herd production and reproduction parameters such as average herd milk production, culling rate or pregnancy rate. Finally, user enters economic variables such as milk price, feed cost or calf value. Results show the value of the cow and its components. If this value is positive it indicates that keeping the cow in the herd brings more economic value. If this value is negative it is better to replace the animal. This is represented graphically as the discounted monthly net return in the long term (Figure 4). The tool additionally presents the expected herd demographics that respond to the herd culling and reproduction performance and along with it, the tool provides an estimate of the net return of an average cow in the herd together with its components. Applying the net return of an average cow in the herd, users can explore the impact of herd production, reproduction, replacement and economic variables on the herd economics.
Retention Pay-Off Calculator
This tool calculates the individual cow retention pay-off, which is similar and has same implications as the value of a cow. In short, the retention pay-off is the expected profit of a cow compared with a replacement. As with the economic value of a cow, this tool can be used to rank animals in the herd for replacement and other critical decision-making and management.
The retention pay-off is calculated using an optimization technique called dynamic programming (Kalantari et al., Reference Kalantari, Cabrera and Solis2015). The difference with the economic value of a dairy cow above described is that dynamic programming always assumes optimal decisions for the cow or the replacement in the future. The rationale and novelty of this tool was to use Machine Learning algorithms to provide fast and accurate predictions of non-linear and inter-correlated variables resulting from the dynamic programming (Shahinfar et al., Reference Shahinfar, Kalantari, Cabrera and Weigel2014).
User needs to enter a matrix of cows defining for each one lactation, days after calving, days in pregnancy and milk mature equivalent. In addition, the tool allows the user to enter milk price and replacement cost. Results are returned as a matrix with a ranking order of cows’ retention pay-offs.
Herd Structure Simulation
This tool simulates the structure of the herd, heifer and adult animals, projected to certain time in the future to explore the expected change in number of animals and demographics depending of age at first calving, replacement rates and calving interval. The tool is useful to make projections exploring herd size and demographics change over time.
The tool follows monthly Markov chains with transition probabilities of culling. It is a simplified version of Cabrera (Reference Cabrera2012a) where pregnancy time and calving are pre-defined. Projection connects the production of springer heifers with the adult herd and then it shows the change of herd size (adult and young stock) to defined culling rate, percentage of female calf born, replacement rate and calving interval.
User defines the number of adult cows, replacement rates for heifers and cows, age at first calving and calving interval. Also, user enters the number of months for a projection. The tool returns a graph (Figure 5) with the herd structure as a distribution of animals by months of age (heifers) or months after calving for different lactations. Results include a table that breaks down the number of animals in meaningful categories for decision-making (e.g. pregnant, non-pregnant and dry animals).
The Herd Structure Simulation tool; 10 years from now, the herd would have 938 more cows if all heifers enter the adult cow and the herd parameters are as defined in the left-side panel. Using this tool farmers can project their herd demographics assess the impact of possible managerial changes, and consequently decide the best strategy to follow with respect to reproduction and replacement course of actions.

Genomics
Integrated Genomic Testing for Heifer Calf decision
This tool is designed to help dairy farmers decide whether to use genomic testing on their heifer calves, and if so, find out the economically optimal testing management strategy that includes a proportion of heifer calves to test and the selection pressure based on the test results.
The rationale behind this tool is the opportunity dairy farmers have using genomic test to make a much faster herd genetic progress. Gains of genomic testing increase when the number of produced replacements is higher than the required replacements proving a higher capacity to select more aggressively, a higher selection pressure toward the best genetic heifer calves. Then, the value of genotyping depends on: (1) relationship between reliability of predicted transmitted abilities (pedigree information) and the reliability of genomic test, and (2) potential parentage errors on farm data, which are calculated based on Weigel et al. (Reference Weigel, Hoffman, Herring and Taylor2011). The net return is defined as the difference of the improved genetic value less the investment on the genomic test. This value is dependent in the capacity of the farm to generate extra heifer calf replacements, which is calculated based on Cabrera (Reference Cabrera2012a).
The practical value of the Genomic Test Tool includes (1) improved farm profitability by selecting best quality animals based upon genomics; (2) improved factors affecting the economic impact of animals regarding to efficiency, net income, longevity and lifetime profit; and (3) enhanced genetic basis of the herds.
User needs to first enter a data set of current genetic value for each calf in the herd (i.e. net merit for Holsteins or Jersey Performance Index for Jerseys) and their associated reliabilities. Farmers have this information from the Dairy Herd Improvement Association and it is based on parents’ information. Then user defines the required calf production needed to maintain the herd size as a percentage of the current population by entering herd reproductive and culling parameters. User also defines the level of parentage error (estimated percentage of erroneous records) and the local genomic test cost. User then can ask the algorithms to optimize the testing strategy that maximizes the net return (e.g. test only the animals ranked in the bottom 50% to 90%, re-sort the animals and keep the top 70% of the animals). User has also the option to evaluate the economic impact of customized selections different than the optimal.
Health
Bulk Tank Somatic Cell Count and Milk Value
This tool determines if it is beneficial to retire milk from the bulk tank from some high somatic cell count (SCC) cows. It helps producers to have the best premium (or lower penalty) related to bulk tank milk SCC levels. This tool shows the value and the final bulk tank SCC to a defined maximum cow’s SCC threshold.
The value of the bulk tank milk is an aggregated of milk amount times milk price. The latter, milk price, depends on the level of bulk tank SCC. Therefore, it could make sense to retire some milk from cows with high SCC in order to increase the milk price. Increased milk price could offset the milk production not shipped for sale. In addition, milk not sold could be used in the farm as feed for calves after pasteurization. Reusing high SCC milk increases the value of the production and therefore the possibility of retire high SCC milk. This tradeoff is numerically illustrated with this tool.
User defines maximum SCC limit for cows’ milk (and indirectly the level of SCC for the bulk tank), the SCC premium/penalty schedule together with milk price, a matrix of individual cow’s SCC and milk yield, and the possibility and the value of reusing discarded milk on-farm. The algorithms determine the economic impact of retiring milk from some high SCC cows. Results show the list of cows from which milk should be retired to attain a lower than the limit SCC, the final bulk tank SCC, the final milk price with changed premiums and penalties, and the value of the bulk tank when retiring milk from high SCC cows and this value compared against including the milk from all cows.
Production
Milk Curve Fitter
This tool converts observed dairy herd production data into a lactation curve prediction function. It is helpful for farmers to project milk production, assess the impact of changes in peak or persistence of the lactation curve, and to use the function for a variety of other management decisions. The tool is very effective for projections and economic analyses of the dairy herd and can be used for decision-making within many areas of dairy farm management such as reproduction, health, nutrition, genetics, among others.
The rationale behind the tool is to facilitate farmers with farm-specific lactation curves for better decision-making. The tool fits observed data to pre-defined lactation curves functions of either MilkBot (Ehrlich, Reference Ehrlich2011; four parameters) or Wood’s model (Wood, Reference Wood1967; three parameters) according to farm observed data by fitting parameters using least squares optimization when comparing observed v. predicted data. The results of fitting are the coefficient values of the selected function in mathematical terms.
User enters herd milk production at several points during the lactation (e.g. the average milk production every 30 days after calving for second lactation cows). The tool then fits those data to user selected Milkbot or Woods model. Once the lactation function has been determined, user can calculate the amount of milk produced within defined periods of lactation and assess the impact of changing parameters of the lactation curve.
Dairy Expansion Decision Support System
This tool is designed to explore projections of dairy farm production and expansion scenarios and simulate specific metrics of their performances. Thus, it provides critical information dairy producers need to actively manage risk on their dairy farms.
The tool forecasts a monthly projection of the cash flow ($ value) aggregated from all animals in the herd in response to factors such as lactation, month after calving and month in pregnancy according to an expected milk production, feed intake and labor requirements. The tool offers the possibility to manage scenarios of expansion either by ‘growing from within’ with their own raised heifers or by buying extra heifers in the market. Users have also the possibility to schedule sales of heifers reared on farm and make additional investments with the use of bank loans (Janowski and Cabrera, Reference Janowski and Cabrera2010).
The tool predicts heifer growth and the herd dynamics over time showing forecast changes in herd structures for calves, heifers and cows. The initial condition for the herd can be taken from a fixed number of adult animals or entered directly as a matrix of all existing animals in the herd and their characteristics. At the end, user is presented with a user-defined long-term cash flow projection that is helpful for investment decisions.
Economic analysis of switching from 2× to 3× Milking
This tool estimates the economic benefit (or loss) of changing the milking frequency from 2 times a day (2×) to 3 times a day (3×) based on user-defined parameters. It helps in the decision of adopting one more milking routine on the farm.
This tool uses partial budgeting to estimate the additional costs, revenues foregone, additional benefits and saved costs of performing one more milking a day.
It is documented that increasing the milking frequency from 2 to 3 times a day increases the milk production (Erdman and Varner, Reference Erdman and Varner1994). However, one extra milking a day, if possible, requires more labor, energy and equipment, which need to be pondered against the extra milk income minus feed cost, which is dynamically calculated by the tool. The user decides how much more extra labor, energy and equipment is required for one more milking.
User needs to define the expected milk increase with the third milking, the additional labor, energy and equipment required, and their economic parameters. The tool calculates the net return of the action and performs sensitivity analyses of the most uncertain factors such as extra milk produced, estimated feed cost and extra labor required.
Financial: price risk
Livestock Gross Margin Analyser
This suite of tools can be used to assist in the use of the Livestock Gross Margin for Dairy (LGM-Dairy) insurance program for revenue risk management that allows dairy producers to lock a future margin revenue composed of a minimum price for milk and a maximum price for feeds. The user can evaluate the premium cost of upcoming LGM-Dairy contract offerings and also find out the optimal strategy that guarantees a minimum margin of milk income minus feed and premium costs.
The tool is inspired by Valvekar et al. (Reference Valvekar, Cabrera and Gould2010) optimization strategies for guaranteeing target milk IOFC using the LGM-Dairy and uses same algorithms and data as the official U.S. Department of Agriculture program from the Risk Management Agency (RMA, 2009).
User needs to enter the expected monthly milk production during the next year and the feed used in terms of corn and soybean meal equivalents. For the premium calculation, the user also enters the monthly percentage (0% to 100%) of production to be insured and a deductible level ($0 to $2/46.4 kg milk). The tool calculates the premium cost and the insured margin (Figure 6). For the least cost premium minimization, user does not enter the monthly percentage of production to be insured, rather user enters a minimum net margin after premium. The tool then calculates the monthly percentage milk production to be insured to attain the minimum goal net margin at the least premium cost.
Illustration of Livestock Gross Margin for Dairy insurance contract. Future prices are averaged from the last 3 market days preceding to the analysis performed on 5 April 2017. Example assumes that the farm insures 50% of what produces, 4000 cwt of milk (181.4 t), and of what requires, 100 t of corn (90.72 t) and 20 t of soybean meal (18.14 t), every month of a possible contract between June 2017 and March 2018. With a $1/cwt of milk of deductible ($0.022/kg) the farmer would pay $6026 of premium ($0.0035/kg of milk insured) after a subsidy of $3124. The average insured prices were a minimum of $0.37/kg milk and a maximum of $0.14/kg for corn and of $344/t for soybean meal. The probability of pay out with such a contract was 28%. This tool allows farmers to anticipate the future market conditions and consider the opportunity of purchasing an insurance that will guarantee a minimum margin during the following year.

Conclusions
The University of Wisconsin-Madison Dairy Management program has developed a large suite of computerized decision support tools (>40) to help dairy producers improve their management. These tools are classified by areas of dairy farm management and include nutrition and feeding, heifer rearing, reproduction, genomics, production, replacement, health, financial and price risk and environment. A selected group of 20 tools are briefly described in this paper on the basis of its usefulness, rationale and scientific background, and actual applicability. All the tools are openly and freely available at http://DairyMGT.info: Tools. The ultimate goal of these tools is to assist dairy farm managers improve their long-term sustainability. Consequently, their potential benefits include enhancing economic profitability and promoting environmental stewardship of dairy farms.
Acknowledgments
This research was supported by Hatch Projects Nos. WIS01699 and WIS01849 to V. E. C. This review is based on an invited presentation at the 67rd Annual Meeting of the European Association for Animal Production held in Belfast, UK, August 2016.


