Depression is a worldwide common mental disorder. According to the WHO reports, the total number of people with depression was more than 300 million in 2015, which was corresponding to 4·4 % of the world’s population(1). Depression can lead to poor health behaviours(Reference Elderon and Whooley2) and poor quality of life(Reference Sivertsen, Bjorklof and Engedal3), which may further increase the risk of cardiovascular mortality(Reference van Dijk, van den Beukel and Kaptein4). It is regarded as the leading cause of disability and a main contributor to the disease burden worldwide(5). Moreover, depression is associated with a high risk of suicide which results in almost 800 000 people died every year(Reference Hawton, Casanas and Haw6,7) . Thus, it is necessary to explore the risk factors related to depression.
There have been plenty of studies conducted to investigate the risk factors of depression; however, the aetiology is still unclear. Physical activity(Reference Rebar, Stanton and Geard8,Reference Josefsson, Lindwall and Archer9) and dietary factors including healthy diet(Reference Lai, Hiles and Bisquera10), fibre intake(Reference Xu, Li and Song11,Reference Gangwisch, Hale and Garcia12) , vitamins (vitamin D(Reference Anglin, Samaan and Walter13,Reference Lang, Beglinger and Schweinfurth14) , vitamin B12 and folate(Reference Lang, Beglinger and Schweinfurth14,Reference Petridou, Kousoulis and Michelakos15) ) and some minerals (Mg, Zn, Fe and Cu(Reference Amani, Saeidi and Nazari16-Reference Sun, Wang and Li22)) were found to have negative associations with depression. Regarding dietary protein, several epidemiological studies have explored its association with depression. Some of the studies suggested that dietary protein intake was inversely associated with the risk of depression(Reference Wolfe, Arroyo and Tedders23–Reference Nanri, Eguchi and Kuwahara25), whereas the association was not significant in some other studies(Reference Oishi, Doi and Kawakami26–Reference Aparicio, Robles and Lopez-Sobaler28). Additionally, there was only one study(Reference Nanri, Eguchi and Kuwahara25) performed in Japanese male workers investigating the associations of protein from different sources (such as animal and plant sources) with the risk of depression, in which plant protein was associated with a decreased prevalence of depression.
Considering the results of previous studies on the association between protein and depressive symptoms were controversial and the epidemiological study conducted in the US adult population was limited, we conducted this study on a subsample of National Health and Nutrition Examination Survey (NHANES) 2007–2014 to evaluate the association between total protein intake and the risk of depressive symptoms in US adults. Furthermore, we also examined the associations of protein from milk and milk products, red meat, poultry, fish, grain products and legumes with the risk of depressive symptoms.
Methods
Ethics approval and consent to participate
This study was approved by the Institutional Review Boards and performed in accordance with the ethical standards laid down in the 1964 Declaration of Helsinki and its later amendments. All persons gave their informed consent prior to their inclusion in the study.
Study population
NHANES, a large, nationally representative survey, collects health examination data from the non-institutionalised population of the USA using a stratified multistage probability sample design(29). The study protocol was approved by the Institutional Review Boards, and all participants provided informed consent. NHANES participants were interviewed in their homes and completed the health examination in a mobile examination centre. The data are released in 2-year cycles. This study used the data from four cycles of NHANES (2007–2008, 2009–2010, 2011–2012 and 2013–2014). A total of 24 732 individuals aged 18 years and older participated in the NHANES during 2007–2014 (Fig. 1). Of these, we excluded 6887 participants including those who had incomplete and unreliable data of 2-d dietary recall survey (n 5249), those who had implausible total energy intake (<2092 kJ/d or >20 920 kJ/d, n 165), those who were lactating (n 111) and pregnant (n 203) and those who had missing data of depressive symptoms (n 1159). So finally, 17 845 (8743 males and 9102 females) individuals were included in the analysis.
Flow chart of sample selection.

Depressive symptoms
Depressive symptoms were assessed using a nine-item Patient Health Questionnaire. The nine-item Patient Health Questionnaire is a reliable and valid measure and based on nine Diagnostic and Statistical Manual of Mental Disorders signs and symptoms from depression(Reference Kroenke, Spitzer and Williams30,Reference Spitzer, Kroenke and Williams31) . Each item was scored from ‘0’ (not at all) to ‘3’ (nearly every day), and the total score ranged from 0 to 27 based on the sum of the points in each item. Depressive symptoms were identified when the nine-item Patient Health Questionnaire score ≥ 10, which had a sensitivity and specificity both of 88 % for major depression(Reference Kroenke, Spitzer and Williams30).
Dietary protein intake
Dietary intake was assessed using two 24-h dietary recall interviews by trained interviewers. The first dietary recall interview was collected in-person in the mobile examination centre, and the second interview was collected by telephone 3–10 d later. US Department of Agriculture Food and Nutrient Database for Dietary Studies was used to calculate the nutrient intakes(32). Dietary protein sources were identified with US Department of Agriculture food codes. Protein intake from two 24-h dietary interviews was averaged. Then, this average protein intake (g/d) was divided by weight (kg) to obtain protein intake (g/kg per d).
Protein sources
We choose six categories of common foods as the protein sources including milk and milk products, red meat, poultry, fish, grain products and legumes, which separately represent the main source of animal and plant proteins. The foods included in each category were as follows: (i) Milk and milk products included milks and milk drinks, creams and cream substitutes, milk desserts, sauces, gravies and cheeses; (ii) Red meat included beef, pork, lamb and veal; (iii) Poultry included chicken, turkey, duck and cornish game hen; (iv) Fish included finfish; (v) Grain products included yeast breads, rolls, cereals, pastas, quick breads, pancakes, french toast, cakes, cookies, pastries, pies, crackers, popcorn, pretzels, corn chips and mixtures having a grain product as a main ingredient; (vi) Legumes included cooked dry beans, peas, and lentils, mixtures having legumes as a main ingredient, such as baked beans or lentil soup; soyabean-derived products, such as tofu, soya sauce and soya-based meal replacements; and meat substitutes that are mainly vegetable protein.
Covariates
The following variables were selected as potential confounders: age, sex, race (Mexican American, other Hispanic, non-Hispanic white, non-Hispanic black and other race), marital status (married, living with partner or widowed, divorced/separated and never married), educational level (<high school, high school or >high school), annual household income (<$20 000 or ≥$20 000), BMI, diabetes (yes or no), hypertension (yes or no), smoking (smoked at least 100 cigarettes in life or not), alcohol (had at least twelve alcohol drinks per year or not), total energy intake, fruit intake, vegetable intake, Mg intake, Zn intake, SFA intake, MUFA intake, PUFA intake and total physical activity. Weight (kg) was measured in the mobile examination centre. BMI was calculated as weight divided by height (m) squared. Physical activity was the sum of work-related physical activity and leisure-time physical activity, which was assessed by metabolic equivalent of task hours per d and was calculated by multiplying the duration of physical activity per d by corresponding metabolic equivalent of task score(Reference Wang, Wu and Ning33). Diabetes was defined as 2-h plasma glucose level ≥11·1 mmol/l, Hb A1C level ≥ 6·5 %, fasting plasma glucose level ≥7 mmol/l(34), taking insulin or diabetic pills or self-reported physician diagnosis. Hypertension was defined as mean systolic blood pressure ≥130 mmHg or mean diastolic blood pressure ≥80 mmHg(Reference Whelton, Carey and Aronow35), taking antihypertensive medicine or self-reported physician diagnosis. Total energy intake (kJ/d) was measured by summing daily diet energy intake and dietary supplements.
Statistical analysis
Characteristics of the study population were presented as means and standard errors for continuous variables and numbers and percentages for categorical variables. Student’s t test was used to test group difference for continuous variables. The χ 2 test was carried out to compare the distribution across groups for categorical variables. Dietary protein intake (g/kg per d) was categorised into quartiles (Q1: <25th percentile, Q2: ≥25 to 50th percentile, Q3: ≥50 to 75th percentile, Q4: ≥75th percentile). The lowest quartile of protein intake was set as the reference group. Logistic regression analyses were conducted to examine the association between dietary protein intake and the risk of depressive symptoms. The associations between protein sources and the risk of depressive symptoms were evaluated among consumers only, defined as those with more than 0 g of intake for each food category. In logistic regression analysis, model I was adjusted for age (continuous) and sex; and model II was further adjusted for race, marital status, educational level, annual household income, BMI (continuous), diabetes, hypertension, smoking, alcohol, total energy intake (continuous), fruit intake (continuous), vegetable intake (continuous), Mg intake (continuous), Zn intake (continuous), SFA intake (continuous), MUFA intake (continuous), PUFA intake (continuous) and total physical activity. Tests for linear trends were performed using logistic regression with median intake in each quartile of protein as continuous variables. The dose–response relationship was evaluated by restricted cubic spline with knots at the 5th, 50th and 95th percentiles of the exposure distribution in the full-adjusted model. We also analysed the association of protein from milk and milk products, red meat, poultry, fish, grain products and legumes with depressive symptoms. Meanwhile, we conducted stratified analyses by age (<45, 45–64 and ≥65 years old), sex (male and female), annual household income (<$20 000 and ≥$20 000) and BMI (<18·5, 18·5 to <25, 25 to <30 and ≥30 kg/m2) to assess the association between total protein intake and depressive symptoms. Furthermore, we performed additional analysis by classifying protein intake according to RDA (inadequate intake: <0·8 g/kg per d, adequate intake: ≥0·8 g/kg per d)(Reference Trumbo, Schlicker and Yates36). Considering the existence of missing data, we also performed a sensitivity analysis by replacing missing values of variables (dietary intake and depression scale score, etc.) with estimated values calculated using logistic regression imputation.
Given the stratified, multistage probability sampling design and survey non-response, we used 8-year mobile examination centre weights in all above-mentioned analysis. A two-side P value < 0·05 was considered as statistically significant. Statistical analyses were performed with SPSS 18.0 and Stata 15.0.
Results
The characteristics of study population according to depressive symptoms are shown in Table 1. There were 1647 (7·92 %) participants identified as having depressive symptoms. The total protein intake was significantly lower among participants with depressive symptoms. Meanwhile, there were significant differences between participants with and without depressive symptoms in sex, age, BMI, smoking status, diabetes, hypertension and marital status. In addition, the educational level, annual household income, physical activity level, total energy intake, vegetable intake, Mg intake and protein intake from milk and milk products, red meat, fish and grain products were significantly lower among participants with depressive symptoms. However, there were no statistically significant differences in protein from poultry and legumes.
Characteristics of participants by depressive symptoms in US adults aged 18 years and older, National Health and Nutrition Examination Survey 2007–2014*
(Mean values with their standard errors; numbers and percentages)

MET, metabolic equivalent of task.
* The χ 2 test was used to compare the percentage between participants with and without depressive symptoms. Student’s t test was used to compare the mean values between participants with and without depressive symptoms.
† To convert kcal to kJ, multiply by 4·184.
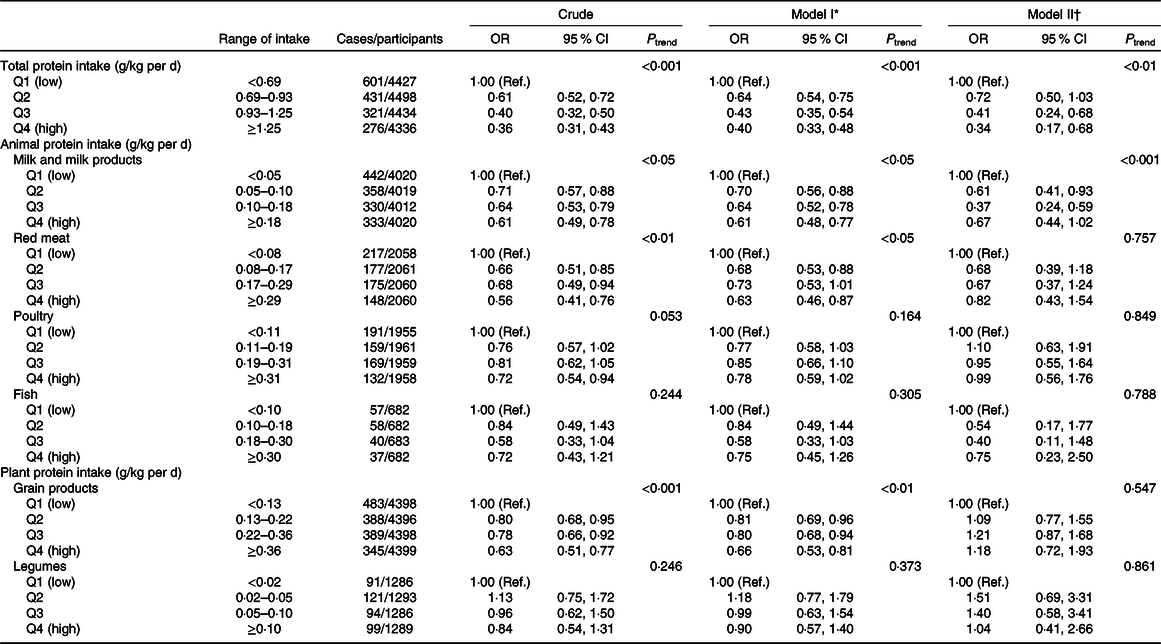
The association between dietary protein intake and the risk of depressive symptoms is shown in Table 2. For total protein intake, the association was significant both in crude and adjusted models. The full-adjusted OR of depressive symptoms was 0·34 (95 % CI 0·17, 0·68) for the highest v. the lowest quartile of protein intake. Additionally, a negative trend was observed in all models (both P < 0·01), and the risks of depressive symptoms decreased when the quartile level increased.
Depressive symptoms across quartiles (Q) of protein intakes in US adults aged 18 years and older, National Health and Nutrition Examination Survey 2007–2014
(Weighted odds ratios and 95 % confidence intervals)

Ref., reference.
* Model I: adjusted for age (continuous) and sex.
† Model II: adjusted for age (continuous) and sex, race, marital status, educational level, annual household income, BMI (continuous), diabetes, hypertension, smoking, alcohol, total energy intake (continuous), fruit intake (continuous), vegetable intake (continuous), Mg intake (continuous), Zn intake (continuous), SFA intake (continuous), MUFA intake (continuous), PUFA intake (continuous) and total physical activity.
For the highest v. lowest quartile of protein intake from milk and milk products, the crude OR of depressive symptoms was 0·61 (95 % CI 0·49, 0·78). In model I, the result was similar to the crude OR. In model II, the negative association was significant both for Q2 v. Q1 (OR 0·61; 95 % CI 0·41, 0·93) and Q3 v. Q1 (OR 0·37; 95 % CI 0·24, 0·59), but no longer statistically significant for the highest v. lowest quartile of protein intake.
The significant association between protein intake from red meat and the risk of depressive symptoms was identified both in crude model and model I, and the OR of depressive symptoms for the highest v. lowest quartile of protein intake were 0·56 (95 % CI 0·41, 0·76) and 0·63 (95 % CI 0·46, 0·87), respectively. But in model II, this association was not significant. For protein intake from poultry, the OR of depressive symptoms for the highest v. lowest quartile of protein intake in crude model and model I were 0·72 (95 % CI 0·54, 0·94) and 0·78 (95 % CI 0·59, 1·02), respectively. But in model II, this association was not significant. For protein intake from fish, the negative association with the risk of depressive symptoms was not significant.
For protein intake from grain products, there was a significant association with depressive symptoms in crude model and model I and the OR of depressive symptoms for the highest v. lowest quartile of protein intake were 0·63 (95 % CI 0·51, 0·77) and 0·66 (95 % CI 0·53, 0·81), respectively. However, for protein intake from legumes, no significant association with depressive symptoms was found.
The association between total protein intake and depressive symptoms in stratified analyses is present in Table 3. In analyses stratified by age, total protein intake was significantly associated with the decreased risk of depressive symptoms for participants aged less than 45 years and the full-adjusted OR of depressive symptoms for the highest v. lowest quartile of protein intake was 0·31 (95 % CI 0·11, 0·91). For participants aged 45–64 years and more than 65 years, the negative association between total protein intake and depressive symptoms for the highest v. lowest quartile of protein intake was found in crude model and model I, but not in model II. In analysis stratified by sex, the association between total protein intake and depressive symptoms was significant in male, and the full-adjusted OR for the highest v. lowest quartile of protein intake was 0·26 (95 % CI 0·09, 0·77). In analysis stratified by annual household income, the association between total protein intake and depressive symptoms was both significant for different levels of household income (<$20 000 and ≥$20 000). In stratified analysis by BMI, the results indicated that total protein intake was negatively associated with the risk of depressive symptoms among different levels of BMI in the full-adjusted model (18·5 to <25, 25 to <30 and ≥30 kg/m2).
Depressive symptoms across quartiles (Q) of total protein intake in US adults aged 18 years and older, stratified by age, sex, annual household income and BMI, National Health and Nutrition Examination Survey 2007–2014*
(Weighted odds ratios and 95 % confidence intervals)

Ref., reference.
* Stratified variables were excluded from the adjusted models.
† Model I: adjusted for age (continuous) and sex.
‡ Model II: adjusted for age (continuous) and sex, race, marital status, educational level, annual household income, BMI (continuous), diabetes, hypertension, smoking, alcohol, total energy intake (continuous), fruit intake (continuous), vegetable intake (continuous), Mg intake (continuous), Zn intake (continuous), SFA intake (continuous), MUFA intake (continuous), PUFA intake (continuous) and total physical activity.
§ In group (BMI < 18 kg/m2), due to the limited participants, Model II cannot be conducted.
There was a non-linear inverse association (P for non-linearity < 0·05) between total protein intake and depressive symptoms. The result depicted an approximately L-shaped association between total protein intake and depressive symptoms (Fig. 2). The OR of depressive symptoms decreased when the total protein intake increased and became almost stable at the level of protein intake above 1·0 g/kg per d. For protein intake from milk and milk products, the association with the risk of depressive symptoms was non-linear (P for non-linearity < 0·05) and the shape of this association was approximately U-shaped (online Supplementary Fig. S1).
Dose–response relationship between total protein intake and the risk of depressive symptoms. The association was adjusted for age (continuous), sex, race, marital status, educational level, annual household income, BMI (continuous), diabetes, hypertension, smoking, alcohol, total energy intake (continuous), fruit intake (continuous), vegetable intake (continuous), magnesium intake (continuous), zinc intake (continuous), SFA intake (continuous), MUFA intake (continuous), PUFA intake (continuous) and total physical activity. The reference group was the lowest intake level (0 g/kg per d). The black line and grey lines represent the estimated OR and its 95 % CI.

The results of analysis by classifying protein intake according to RDA indicated that compared with inadequate intake, adequate protein intake was negatively associated with the risk of depressive symptoms in model II (OR 0·57; 95 % CI 0·37, 0·87) (online Supplementary Table S1).
In sensitivity analysis, 24 092 individuals were included after excluding 640 participants, including those who were pregnant (n 247) and lactating (n 124) and those who had implausible total energy intake (<2092 kJ/d or >20 920 kJ/d, n 269). The above-mentioned association between dietary protein intake and the risk of depressive symptoms remains significant after replacing missing values with the estimated values calculated using logistic regression imputation (online Supplementary Table S2).
Discussion
In this study, we found that total protein intake and protein intake from milk and milk products were negatively associated with depressive symptoms. For protein from red meat, poultry and grain products, there were a significant association with depressive symptoms in unadjusted model and age- and sex-adjusted models, but the associations were not significant in the full-adjusted model. In contrast, protein intake from legumes and fish had no significant association with depressive symptoms. In stratified analyses by age, sex, annual household income and BMI, the negative association between total protein intake and depressive symptoms was significant in group younger than 45 years old, male, different levels of household income (<$20 000 and ≥$20 000) and different levels of BMI (18·5 to <25, 25 to <30 and ≥30 kg/m2).
In our study, non-linear associations of total protein intake and protein intake from milk and milk products with the risk depressive symptoms were found and the shape of the associations of total protein intake and protein intake from milk and milk products with the risk of depressive symptoms was approximately L-shaped and U-shaped, respectively. The risk of depressive symptoms reached to a relatively low level when the total protein intake was at a level of about 1·0 g/kg per d, and when increasing intake of total protein more than 1·0 g/kg per d, the OR of depressive symptoms decreased slowly. In addition, the cut-off value of 1·0 g/kg per d was a little higher than the current RDA for protein (0·8 g/kg per d) in America.
Our finding of an inverse association between total protein intake and depressive symptoms was consistent with some studies. A National Health and Nutrition Evaluation Follow-up Study(Reference Wolfe, Arroyo and Tedders23) observed that higher intake of protein was associated with decreased risk of severely depressed mood in US males. Two cross-sectional studies separately conducted in Japanese male workers(Reference Nanri, Eguchi and Kuwahara25) and Spanish Children(Reference Rubio-López, Morales-Suárez-Varela and Pico24) both found an inverse association between protein intake and the risk of depressive symptoms. Another Finnish cross-sectional study(Reference Ahola, Forsblom and Groop37) reported that having a preference for protein over carbohydrates and fats was linked to lower levels of depressive symptoms in individuals with type 1 diabetes. One cross-sectional survey of Villanueva Older Health Study carried out by Jimenez-Redondo et al. (Reference Jimenez-Redondo, Beltran de Miguel and Gomez-Pavon38) indicated that there was a negative association between protein and anxiety/depression in Spanish nonagenarians. Guligowska et al. (Reference Guligowska, Piglowska and Fife39) conducted a case–control study in Polish older adults and concluded that higher intake of protein was associated with better functional and cognitive status. Additionally, Ciarambino et al. performed two studies(Reference Ciarambino, Ferrara and Castellino40,Reference Ciarambino, Castellino and Paolisso41) about the association of a low protein diet and depressive symptoms in elderly with type 2 diabetes, and they found that the symptoms of depression were increased in individuals with low protein diet either 7 d/week or 6 d/week. In addition, they also observed that following low protein diet 6 d/week was less at risk of developing depressive symptoms than low protein diet 7 d/week.
However, the results of several studies were not in line with ours. In a Japanese cross-sectional study of 279 elderly people(Reference Oishi, Doi and Kawakami26) and a Polish cross-sectional study of sixty-four patients with obstructive sleep apnea(Reference Stelmach-Mardas, Mardas and Iqbal27), the association of protein intake and depressive symptoms was insignificant. Moreover, a follow-up study(Reference Wolfe, Arroyo and Tedders23) found a positive association between protein intake and severely depressed mood among US female. In a Spanish cross-sectional study of 140 elderly people(Reference Aparicio, Robles and Lopez-Sobaler28), protein intake was positively associated with depressive symptoms, but with no significance. In another Israeli cross-sectional study among 112 elderly people(Reference German, Kahana and Rosenfeld42), there was no difference in protein intake between depressed and non-depressed groups. The inconsistent results with our study may be due to the differences in age, sample size and region. In addition, different assessment methods of dietary intake and depressive symptoms may also contribute to the inconsistent results.
Regarding the protein intake from different food sources, the findings from our study suggested protein intake from milk and milk products was negatively associated with the risk of depressive symptoms. In a Japanese study(Reference Nanri, Eguchi and Kuwahara25), the result was different from ours, which found that plant protein but not animal protein was associated with decreased prevalence of depressive symptoms. However, since there are few studies explored the association between protein sources and depressive symptoms, we could not compare our results with other studies.
The mechanisms of the association between protein intake and depression are not well understood now. But it has been reported that amino acids from protein could influence mood state and cognitive functions. For example, tryptophan had an antidepressant-like effect that was due to its conversion to serotonin(Reference Wong and Ong43), which plays an important role in regulating mood(Reference Wurtman and Wurtman44). Tyrosine could have an effect on mood through being transformed into a neurotransmitter of dopamine(Reference Dailly, Chenu and Renard45,Reference Rao, Asha and Ramesh46) . Moreover, small molecular peptides (e.g. creatine and carnosine) have been suggested to exert an impact on brain monoamine metabolism, which may further influence the development of depression(Reference Krishnan and Nestler47,Reference Nagasawa, Murakami and Sato48) . For the biological mechanisms of milk protein, it may also be related to the serotonin system(Reference Vekovischeva, Peuhkuri and Backstrom49). Whey protein is one of the major fractions of milk protein, and the whey-derived protein α-lactalbumin is a main source of tryptophan from food(Reference Heine, Radke and Wutzke50). Moreover, it is reported that α-lactalbumin could improve mood and cognition in stress-prone subjects(Reference Markus, Olivier and Panhuysen51–Reference Markus, Jonkman and Lammers53).
In stratified analysis by age, our study found that the negative association between total protein intake and depressive symptoms was only significant in adults younger than 45 years old, but not in older adults. The mechanism underlying the age differences in association between protein intake and depression remains poorly understood. We speculated that the mechanism involved age differences in insulin secretion. The insulin secretion decreases with ageing(Reference Zhu, Yang and Zhang54). Moreover, studies have shown that insulin could facilitate the transport of tryptophan in the brain, thereby promoting the production and release of the neurotransmitter serotonin(Reference Fernstrom and Wurtman55,Reference Daniel, Love and Moorhouse56) .
It is also worth noting that our study found a significant association between total protein intake and depressive symptoms in male, but not in female. Another study(Reference Wolfe, Arroyo and Tedders23) conducted by Wolfe et al. surprisingly found that protein intake was negatively correlated with the risk of depression for male, but positively for female. In addition, several studies(Reference Hildebrandt, Steyerberg and Stage57–Reference Jovanovic, Lundberg and Karlsson59) have found sex difference in the occurrence of depression and the response to antidepressant treatment. However, there were limited studies to explore sex differences in the relationship between protein intake and the risk of depressive symptoms, which prevents us from comparing the observed results with other studies. The underlying mechanism for the sex difference may due to the differences in brain serotonin metabolism between sex. According to a study conducted by Jovanovic et al., compared with men, women tend to have lower levels of serotonin in their brains and are more sensitive to inadequate levels of neurotransmitters involved in emotional stability(Reference Jovanovic, Lundberg and Karlsson59).
Our study has several strengths. First, we used a large representative sample of general US people, which increased the statistical power to provide a more reliable result. Second, in our study, we explored the associations of total protein intake, protein derived from different foods with depressive symptoms. In addition, total protein intake and protein intake from milk and milk products were inversely associated with depressive symptoms after adjusting for some potential confounders, such as age, Mg, Zn and fatty acids. Finally, we also evaluated the dose–response relationship between total protein intake and depressive symptoms.
However, some limitations should be mentioned. First, considering a cross-sectional design of our study, we could not infer causal interpretations of the association between dietary protein and depressive symptoms. Meanwhile, we could not entirely exclude the issue of reverse causality, meaning that the depressive symptoms have altered the dietary protein intake instead of the opposite.
Second, protein intake was estimated by using two 24-h dietary recall interviews. As a self-reported assessment, it might lead to recall bias and reporting bias during the assessment of dietary intake. Therefore, it cannot fully reflect individual’s usual intake, which may lead to an overestimation or underestimation on the results observed in our study. However, we used the average of the two 24-h dietary recalls as the protein intake, which might reduce the recall bias partially. In addition, one study(Reference Knuppel, Norman and Boeing60) has indicated that two 24-h recalls are enough to evaluate the distribution of usual dietary intake. Unfortunately, due to limited information, our study was not able to identify the extent and direction of reporting bias by using repeated measurements or unbiased biomarkers of dietary intake, such as doubly labelled water for total energy expenditure and urinary N for protein intake. Third, nine-item Patient Health Questionnaire is a self-report tool for screening individual with depressive symptoms, but not including those with clinically diagnosed depression, which may have an effect on the results to some extent. Fourth, the number of subjects consuming legumes and fish over the 2 d was small, which might reduce the power to detect association of protein intake from legumes and fish with the risk of depressive symptoms.
In conclusion, our study suggested that total protein intake and protein intake from milk and milk products might reduce the risk of depressive symptoms in US adults, but not for protein intake from red meat, poultry, fish, grain products and legumes. The shape of the associations of total protein intake and protein intake from milk and milk products with the risk of depressive symptoms was approximately L-shaped and U-shaped, respectively. Given few studies investigated the associations of protein sources and depressive symptoms, additional studies focused on this point are warranted. Additionally, prospective studies are required to confirm our findings.
Acknowledgements
The authors thank all individuals at the National Center for Health Statistics of the Centers for Disease Control and Prevention who were responsible for the planning and administering of NHANES and making the data sets of NHANES available on their website.
This research did not receive any specific grant from funding agencies in the public, commercial or not-for-profit sectors.
D. Z. had full access to all study data and take responsibility for their integrity and accuracy of statistical analysis. Study concept and design: Y. L. and D. Z. Acquisition, analysis or interpretation of data: All authors. Manuscript first draft: Y. L. Critical revision of the manuscript for important intellectual content: Y. L., C. Z., S. L. and D. Z. Statistical analysis: Y. L., C. Z. and S. L. Technical and material support: Y. L., C. Z. and S. L. Supervision: C. Z., S. L. and D. Z. All the authors have approved the final article.
The authors declare that they have no conflicts of interest.
Supplementary material
For supplementary material/s referred to in this article, please visit https://doi.org/10.1017/S0007114520000562