


The important role of the food environment and food systems in the health of populations, communities and individuals is a prominent topic in the public health domain. This is largely due to the rise in obesity and diabetes worldwide( Reference Swinburn, Kraak and Rutter 1 ). More than 1·9 billion adults were overweight (BMI ≥ 25·0 kg/m2) in 2016( 2 ). During the same period (2016), 67·7 % of women and 31·3 % of men were either overweight or obese in South Africa( 3 ).
Worldwide trends of increasing weight gain and obesity are reported in children, and the trend among children to eat unhealthy energy-dense foods has increased( 4 ). Obesity in childhood increases the likelihood of obesity in adulthood and is associated with the development of CVD and diabetes( Reference Biro and Wien 5 , Reference Reilly and Kelly 6 ). Three of the co-morbidities of CVD and diabetes (high blood pressure, insulin resistance and dyslipidaemia) are increasingly being observed in children( Reference Pires, Martins and Pereira 7 ).
The food environment, defined broadly as ‘the collective physical, economic, policy and sociocultural surroundings, opportunities and conditions that influence people’s food and beverage choices and nutritional status’( Reference Swinburn, Vandevijvere and Kraak 8 ), provides the most important context in which childhood obesity should be considered. Herforth and Ahmed define the food environment as ‘the availability, affordability, convenience, and desirability of various foods’Reference Herforth and Ahmed (9) . Children should have easy access to healthy foods and consumption thereof should not be jeopardized by the promotion of unhealthy food products( Reference Lobstein, Jackson-Leach and Moodie 10 ). Schools are often targeted by food vendors and the food industry. A study in Soweto, South Africa, for example showed that sugar-sweetened beverages are sold and advertised with increased intensity within close proximity to schools( Reference Moodley, Christofides and Norris 11 ). The school food environment, comprising children’s food boxes that they bring from home, meals provided through school feeding programmes, and tuck shops or school vendors, forms part of the broader food environment and is an important component in promoting healthy eating in children( Reference Story, Nanney and Schwartz 12 ).
In South Africa, approximately 50 % of schoolchildren buy food at school frequently( Reference Shisana, Labadarios and Rehle 13 , Reference Reddy, James and Sewpaul 14 ). While some tuck shops are controlled by schools, others are outsourced or privately owned( Reference Wiles, Green and Veldman 15 , Reference Marraccini, Meltzer and Bourne 16 ). In schools that do not have a tuck shop, informal food vendors sell food either on or outside the school premises( Reference Faber, Laurie and Maduna 17 , Reference Abrahams, de Villiers and Steyn 18 ). These vendors are usually community members who live within close proximity of the school and sell food items to learners during the school break, as well as before and after school. A scoping study showed that crisps (including corn-based snacks), sweets and sugar-sweetened beverages are mostly sold, either through a tuck shop or food vendor( Reference Nortje, Faber and de Villiers 19 ). Non-branded corn-based processed snacks are frequently sold in the informal market; informal vendors buy these snacks in bulk and repack them to sell to consumers( 20 ), generally at a price cheaper than the brand-name snacks.
It follows that policies should enable, among other things, a healthy food environment for children to learn healthy eating preferences( Reference Hawkes, Smith and Jewell 21 ). One of the goals of the South African strategy for the prevention and control of obesity is to create an enabling environment that supports the availability and accessibility of healthy food choices in various settings( 22 ). To improve the school food environment, the South African Department of Basic Education developed guidelines to promote the availability of healthy food alternatives from school tuck shops( 23 ). These guidelines are aligned with the South African food-based dietary guidelines( Reference Vorster, Badham and Venter 24 ).
In addition, nutrient profiling of foods can be used for both educational and regulatory purposes( Reference Drewnowski 25 ). Through nutrient profiling, foods are ranked or classified based on their nutrient composition( Reference Rayner, Scarborough and Stockley 26 ), and may be used in combination with food prices( Reference Drewnowski 27 ) to identify foods that are healthy and affordable. The South African Nutrient Profiling Model is based on the model developed by Rayner and colleagues as adapted by the UK Food Standards Agency with modifications by the Food Standards Australia and New Zealand. It was tested and validated within the South African context and is considered appropriate for child-directed food marketing regulations in the country( Reference Wicks, Wright and Wentzel-Viljoen 28 ).
The present study assessed informal school food vending in terms of: (i) the type and cost of foods available to learners during school hours; (ii) the foods’ nutrient profile; and (iii) the cost per 418 kJ (100 kcal) for foods sold. The study further determined the nutrient content of the cheaper, repacked, bulk-purchased non-branded corn-based processed snacks, as well as the more expensive brand-name corn-based processed snacks.
Methods
Study population and design
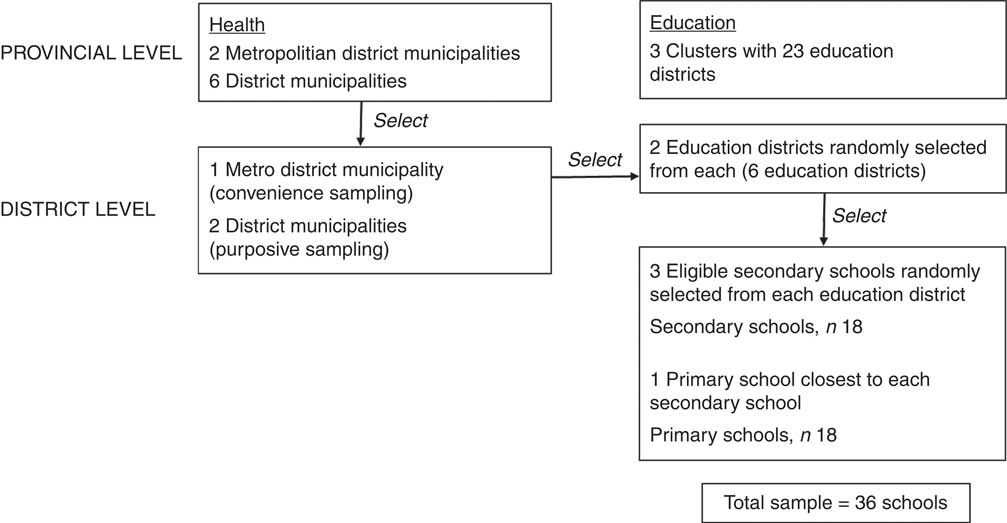
South Africa has a total population of 55·6 million people( 29 ). The country is divided into nine provinces, which are subdivided into fifty-three districts (forty-seven municipal and six metropolitan districts).
The present study used the sampling plan of a larger study entitled ‘Mentoring and promoting healthy lifestyles of learners in the Eastern Cape: an evaluation of the 2012 Integrated School Health Policy (ISHP)’. Sample selection had to consider the district boundaries of the two main stakeholders in the ISHP, namely the Eastern Cape Departments of Health and Basic Education. The health districts in the Eastern Cape follow the boundaries of the local government structures including two metropolitan districts and six district municipalities. The education districts also largely follow these boundaries but are further divided into twenty-three districts grouped into three clusters. The health districts were used as the reference point and the sampling strategy depicted in Fig. 1 was followed.
Sampling framework for selecting schools for the present study in the Eastern Cape, South Africa
Government schools in South Africa are grouped in quintiles according to the poverty level of the community where the school is located. Schools in quintile 1 are the poorest and all school funds come from the government; quintile 5 is the least poor and the bulk of the school funds are generated through school fees( 30 ).
Three health districts were selected, namely Buffalo City, OR Tambo and Chris Hani. In each of these districts, one rural and one urban sub-district were selected. The sub-districts were East London and King Williams Town in Buffalo City; Lusikisiki and Qumbu in OR Tambo; and Queenstown and Ncgobo in Chris Hani. Random selection took place by creating an electronic random list using the numbering system used in the original data set provided by the Department of Education. After the selection of the districts, three secondary schools were randomly selected from the eligible schools in the district. Schools were eligible if they were: (i) public schools (independent schools were excluded); (ii) fell into socio-economic quintile 1–3 (where 1 is the poorest schools and 5 the most affluent); and (iii) were secondary schools only (no primary–secondary combined schools were considered). For each selected secondary school, the closest primary school was selected. The total study sample therefore consisted of eighteen secondary schools and eighteen primary schools. For each of these thirty-six schools, foods sold by informal food vendors inside or immediately outside the school premises were assessed. Data were collected during February and March 2016.
Measuring tools and data collection
A checklist was developed for recording the type, weight and cost of food items sold. After the vendor gave consent, one fieldworker completed the checklist while another took photographs. The checklist was used to record basic demographics such as the school’s name, whether the vendor operated inside or outside the school premises, the type of stall and whether food was prepared on site. For each food item sold by the vendor on the day of observation, the food type, a short description of the food, cost per unit and weight per unit were recorded on the checklist. For commercially packaged foods, the weight per unit was obtained from the wrapper. For packaged/wrapped food items with unknown weights, the fieldworker weighed five randomly selected units per food item. For unwrapped foods and combined dishes (e.g. a sandwich), the fieldworker bought five randomly selected units per food item to be weighed. If a vendor sold different unit sizes for a specific food item, the weight and cost for each unit size were recorded.
A standard protocol for weighing food samples was used whereby samples were weighed on a calibrated digital food scale (AND HT-5000 Compact scale, capacity 5·1 kg and 1 g increments). Each sample was weighed twice for accuracy. Combined food items were weighed as a whole (total weight), then they were dissembled and each ingredient was weighed individually. Weighing was always done by a fieldworker pair (not individually).
Nutrient content of corn-based processed snacks
For nutrient analysis of the non-branded corn-based processed snacks, a sub-sample of three schools (a mixture of primary and secondary schools) was randomly selected in each district. Packets of the non-branded corn-based snacks were purchased from different informal vendors selling at a selected school (approximately ten packets in total); these were combined and mixed to constitute a representative composite sample for pulverisation and analysis; this was done for each selected school. The weight of the composite samples from OR Tambo, Chris Hani and Buffalo City districts (n 3 per district) ranged from 190 to 363 g, from 190 to 384 g and from 178 to 400 g, respectively. Random samples of the brand-name snacks were purchased from each of three stores in three different sites in the Cape Town Metropole. Sample packets from each store were combined and mixed to constitute a representative composite sample for pulverisation and analysis; the three composite sample weights ranged from 337 to 381 g. Thus, nine non-branded and three brand-name composite samples were analysed.
Analyses were performed in a double-masked fashion by a commercial food and nutritional testing analytical laboratory accredited by the South African National Accreditation System. In this laboratory, all analytical samples were prepared on the same day and analysed in the same analytical batch. Reference samples form part of the daily routine in this laboratory to assure the quality of results.
In addition to the moisture, ash, protein, fibre, fat, sugars, vitamin E and selected chemical elements (mineral) content, the samples were also screened for possible contamination with ‘illegal’ synthetic dyes with which spices can be adulterated in order to improve the colour, appearance and the apparent quality and freshness of spice products( Reference Everstine, Spink and Kennedy 31 , Reference Van Asselt, Banach and van der Fels-Klerx 32 ). The analytical laboratory performed the screening for a total of eleven synthetic dyes including Sudan I–IV. The carbohydrate content was calculated ‘by difference’ and the content obtained in this manner was used in the calculation of energy content. The energy content (kJ/100 g) was calculated using the percentage (g/100 g) protein multiplied by 17, plus the percentage total carbohydrates multiplied by 17, plus the percentage fat multiplied by 37( Reference Greenfield and Southgate 33 ).
Data analysis
Data were captured into Microsoft Excel data files. Descriptive data analysis was done using the statistical software package IBM SPSS Statistics version 21. Categorical data are expressed as frequencies and percentages. Continuous data are expressed as either the mean and sd or the median and interquartile range.
Nutrient profiling and cost
For each food item, information on nutrient mass per 100 g was obtained from the South African Food Composition Tables( Reference Wolmarans, Danster and Dalton 34 ), food packaging and the manufacturer’s website. The nutritional information needed for the South African nutrient profiling is: energy (kJ), saturated fat (g), total sugar (g), Na (mg), fibre (g) and protein (g); and for fruit, vegetables, nut and legume content, the percentage. The nutrient profile for each food item was calculated using the South African Nutrient Profiling calculator( 35 ). Spearman correlation analysis was performed to assess the relationship between the nutrient profile score and the cost (per 418 kJ (100 kcal)) of the food.
Nutrient content of corn-based snacks
For each nutrient, the mean and sd from the individually analysed composite samples (n 9, non-branded snacks; n 3, brand-name snacks) were calculated and rounded off to the number of decimal places given for the specific nutrient in the South African Food Data System (SAFOODS) database( Reference Wolmarans, Danster and Dalton 34 ). ANOVA was used to compare the non-branded and brand-name snacks. A P value of <0·05 was considered statistically significant.
Results
At the thirty-six selected schools, ninety-two informal food vendors were observed. The number of vendors per school ranged from 1 to 7, with a median (interquartile range) of 2 (1–5). Half (n 46) of the vendors sold food inside the school premises and the other half immediately outside the school premises. Most vendors placed their goods either on a table (mostly a makeshift table) or bench (58·7 %) or on a ground cover (32·6 %). Eight per cent of vendors’ stalls were covered with a roof; 23·9 % were protected from the sun; and for 83·7 % the food was either packaged or covered. Eighty-seven per cent of vendors said that they sell the same food items every day.
The number of different food items sold per vendor on the day of observation ranged from 1 to 13, with a median (interquartile range) of 6 (4–7). Food items sold at most schools were corn-based processed snacks (94 %), sweets (89 %) and lollipops (72 %), followed by biscuits (62 %; Table 1). Other popular food items included vetkoek (deep-fried dough, either plain or with a filling), chicken feet and head, polony, drink powder, and homemade frozen ice made from cordial concentrate and sold in a plastic sachet. Fruits were sold at only 28 % of the schools.
Foods sold by informal vendors (n 92), inside or immediately outside the school premises (n 36), to learners in the Eastern Cape, South Africa, February–March 2016
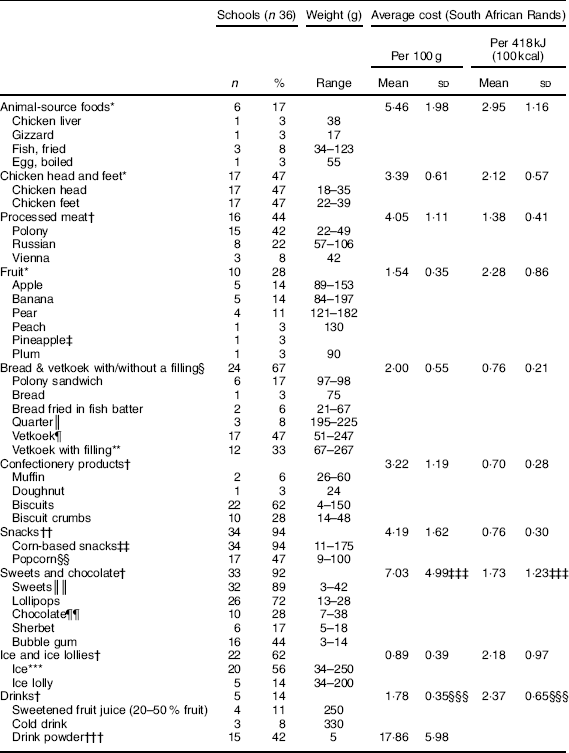
* Nutrient profile: all food items in this group were classified as healthy options.
† Nutrient profile: none of the food items in this group were classified as healthy options.
‡ Weight not recorded.
§ Nutrient profile: some of the food items in this group were classified as healthy options, depending on the type of filling.
║ Hollowed-out quarter loaf of white bread, filled with polony, or polony and cheese.
¶ Deep-fried dough.
** Filled with either chicken livers, polony, minced meat or potato.
†† Nutrient profile: none of the food items in this group were classified as healthy options, except plain, unsalted popcorn which was classified as a healthy option.
‡‡ Non-branded, 39 %; brand-name, 61 %.
§§ Plain, salted, sugar-coated or caramel-coated.
║║ Hard boiled, soft, toffees and fudge; some vendors sold cigarette-sweets.
¶¶ Some vendors sold melted chocolate that was repacked.
*** Homemade using sweetened cordial.
††† Sugar-free tartrazine-free powder; commercially packaged in 5 g single sachets, to be mixed with 2 litres of water.
‡‡‡ Excludes sherbet as it was often sold in a plastic toy, and bubble gum.
§§§ Some vendors sold cold drink in a toy gun; excluded from calculation.
The portion size per food item sold on the day of observation varied (Table 1). For example, the portion size for corn-based snacks ranged from 11 to 175 g (175 g packets were sold in three schools); and that for biscuits from 4 to 150 g (150 g packets were sold in one school).
The nutrient profiling scores for the individual food items ranged from −11 to +26. For beverages, a score of <1 and for foods (other than cheese) a score of <4 are considered healthy food options( 35 ). Animal-source foods (scores ranging from −1 to +2), chicken head and feet (scored −2) and fruits (scores ranging from −9 to −6) were all classified as healthy food options. Drinks (scores ranging from 2 to 3), frozen ice lollies (scored 1), sweets and chocolates (scores ranging from 14 to 26) and confectionery products (scores ranging from 4 to 12) were all categorised as less healthy food options (Table 1 and Fig. 2). Spearman correlation analysis showed that the nutrient profiling score was inversely related to the cost per 418 kJ (100 kcal) of the food item (r = −0·562, P = 0·010), indicating that healthier food items were more expensive sources of energy.
Average cost (in South African Rands) per 418 kJ (100 kcal) of foods commonly sold by informal vendors (n 92), inside or immediately outside the school premises (n 36), to learners in the Eastern Cape, South Africa, February–March 2016. Nutrient profiling: ![]() , all food items in this group were classified as healthy options;
, all food items in this group were classified as healthy options; ![]() , some of the food items in this group were classified as healthy, depending on the type of filling;
, some of the food items in this group were classified as healthy, depending on the type of filling; ![]() , most of the food items in this group were classified as less healthy options (plain, unsalted popcorn was the only food item classified as a healthy option);
, most of the food items in this group were classified as less healthy options (plain, unsalted popcorn was the only food item classified as a healthy option); ![]() , none of the food items in this group were classified as healthy options
, none of the food items in this group were classified as healthy options
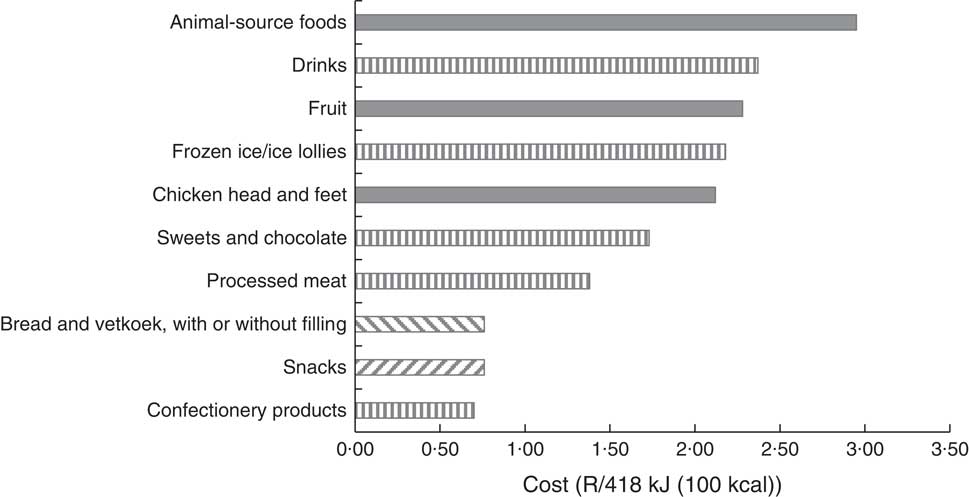
The cost per 418 kJ (100 kcal) for certain food groups is shown in Fig. 2. Energy cost for animal-source foods was highest (R2·95 (sd 1·16)/418 kJ), while snacks, bread and vetkoek, and confectionery products had the lowest energy cost (<R0·80/418 kJ) for each of these food groups respectively.
Nutrient content of corn-based processed snacks
The samples were screened for eleven ‘illegal’ synthetic food dyes and none were detected. Nutrient content for the non-branded and brand-name snacks is presented in Table 2. The non-branded snacks had a significantly higher moisture content, and significantly lower energy and Ca contents compared with the brand-name snacks. While none of the brand-name composite samples contained sucrose, six of the nine non-branded composite samples contained sucrose, ranging from 4·4 to 6·2 g/100 g. Two of the non-branded composite samples had very high Fe content (25·4 and 30·3 mg/100 g, respectively).
Nutrient content per 100 g edible portion for non-branded and brand-name corn-based processed snacks
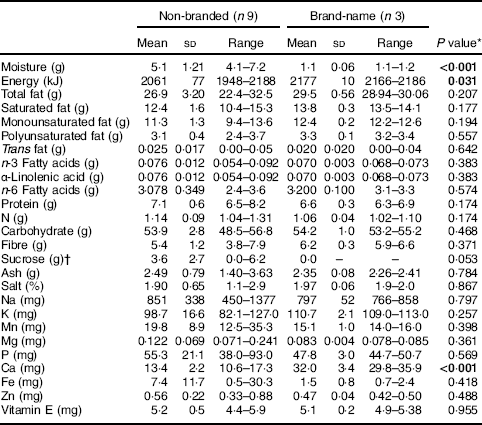
The only n-3 fatty acid detected was α-linolenic acid; the main saturated, monounsaturated and polyunsaturated fatty acids were palmitic, oleic and linoleic acids, respectively.
Cd and Pb content of all the samples was <0·001 mg/100 g and <0·005 mg/100 g, respectively. None of the samples contained Cu.
* ANOVA; significant P values are shown in bold font.
† Sucrose was the only sugar detected; none of the samples contained fructose, glucose, maltose or lactose.
Discussion
In the present study, we assessed the type of foods sold by informal vendors to learners in thirty-six schools in the Eastern Cape Province of South Africa; we also investigated the cost of the foods and calculated the cost per 418 kJ (100 kcal). Food items sold at the schools were mostly corn-based processed snacks, sweets and lollipops, followed by biscuits. Vetkoek (deep-fried dough) and chicken feet and heads were sold at just more than half of the schools and fruits at just more than a quarter of the schools. These findings reflect the results of a recent review( Reference Nortje, Faber and de Villiers 19 ) that found crisps (including corn-based snacks), sweets and chocolates generally being the food items sold mostly at schools in lower-income communities in South Africa. The review by Nortje et al. ( Reference Nortje, Faber and de Villiers 19 ), however, did not report on the nutrient content, nutrient profile or cost of the foods.
The popularity of corn-based processed snacks as a food item stocked by informal food vendors selling to learners reflects trends observed in individual consumption and in the food production space. Silangwe, for example, found that 157 secondary-school learners reported Nik-Naks (corn-based processed snacks) 135 times during a 24 h recall period( Reference Silangwe 36 ), while the HealthKick study reported 55 % of primary-school learners consuming crisps the day before the survey at baseline and 75 % consuming crisps at follow-up three years later( Reference Steyn, de Villiers and Gwebushe 37 ). ‘Crisps’ in the HealthKick study included corn-based snacks (A de Villiers, personal communication). Studies in South Africa often do not differentiate between potato crisps and corn-based processed snacks. Children in South Africa are introduced to potato crisps/corn-based processed snacks from a very young age. For example, a study that was done in the KwaZulu-Natal Province showed that 61·1 % of rural and 42·9 % of urban 6–12-month-old infants consumed these snacks at least once during the week prior to the survey( Reference Faber, Laubscher and Berti 38 ). Further perspective to the popularity of these snacks is provided by data showing that South Africa accounts for 1·1 % of the global market value for savoury snacks (predominantly made up of potato crisps and corn-based processed snacks). The compound annual growth rate of the market in the period 2011–2015 was 3·7 %, with 146 million units produced in 2015( 39 ).
In the lower-income market, a ubiquitous feature of extruded corn-based snacks is the bright colour, which consumers associate with strong flavour( 20 ). A popular belief is that these snacks contain synthetic dyes, and as some evidence exists for synthetic food colours to have adverse behavioural effects in children( Reference Weiss 40 ), this would be a public health concern. We did not test for synthetic food colours per se but rather tested for ‘illegal’ synthetic dyes which do have detrimental health effects( Reference Everstine, Spink and Kennedy 31 , Reference Van Asselt, Banach and van der Fels-Klerx 32 ); none were detected in any of the composite snack samples tested.
Some differences were detected in the nutrient content for the two types of corn-based snacks (non-branded v. brand-name snacks). The non-branded snacks had a significantly higher moisture content, and significantly lower energy and Ca contents. However, the Ca content is low and although statistically significant, the difference in Ca content between the non-branded and brand-name snacks as well as the contribution to total Ca requirement are of little nutritional importance (recommended dietary requirement for Ca for 9–18-year-old males and females is 1300 mg/d( Reference Ross, Manson and Abrams 41 )). While none of the brand-name samples contained sucrose, two-thirds of the non-branded samples contained up to 6·2 g sucrose/100 g. A high Fe content of up to 30·3 mg/100 g was also detected in two of the non-branded samples, the source of which is not known; it might have originated from contamination during the production and/or repacking process. While these differences might only become important if large quantities are consumed, both types are high in energy and Na, leaving questions about the inclusion of these products on a regular basis, even in small quantities, in the diet of particularly children. Some vendors sold 175 g packets of corn-based snacks, which will provide between 1395 mg (brand-name snack) and 1489 mg (non-branded snack) of Na; compared with the recommended daily Na intake of <2000 mg( 42 ).
Some evidence for the negative effect the consumption of purchased snack foods may have, is provided by Feeley and Norris; they calculated average consumption of Na and added sugar from foods purchased from school or in the community for 17–18-year-old adolescents (n 451) in Soweto. For dietary Na, purchased foods contributed 4803 mg/week for boys and 4761 mg/week for girls, which is more than half of the recommended daily intake. For added sugar, purchased foods contributed 561·6 g/week for boys and 485·3 g/week for girls, which is about three times the recommended daily intake( Reference Feeley and Norris 43 ).
Besides corn-based processed snacks, other repacked foods were biscuit crumbs and melted chocolate, most probably bought as remnants from a factory. Some vendors sold cigarette-sweets, cold drink in a toy gun and sherbet in a plastic toy; all of which should probably be prohibited to be sold to learners. An artificially sweetened cold-drink powder was sold in 42 % of the schools. The 5 g powder sachet should be diluted with 2 litres of water to avoid consumption of concentrated chemicals; however, when sold to learners they often consume it as a powder( 23 ). The large packing size for corn-based snacks (e.g. 175 g) and biscuits (e.g. 150 g) that were sold at some of the schools included in the study are of concern.
The healthfulness of food items sold at schools by informal vendors should also be considered against the conditions under which these vendors operate. Most vendors placed their goods on a table or bench or on the ground and very few had a roof or were protected from the sun. Hill and co-workers( Reference Hill, Mchiza and Puoane 44 ) studied street-food vendors in Cape Town and surrounding areas and concluded that street foods pose major public health concerns, because the vendors exhibited poor hygiene and safety practices which might be exacerbated by the lack of facilities and resources available to them.
The inverse association between the nutrient profiling score and cost per 418 kJ (100 kcal) of the food item indicates that the healthier food items were also more expensive sources of energy. Similar findings were reported in a review paper by Darmon and Drewnowski( Reference Darmon and Drewnowski 45 ). Although few South African data are available, it has been argued that the cost of a healthier diet is beyond the reach of the poor in the country( Reference Schönfeldt, Hall and Bester 46 ). Globally, the higher cost of healthy diets may explain socio-economic disparities in diet quality( Reference Darmon and Drewnowski 45 ), and it is well described in the literature that healthier diets cost more than unhealthy diets. Rao and co-workers included studies from ten countries in a meta-analysis and found good evidence of a price difference between heathier and less healthy foods/diet patterns( Reference Rao, Afshin and Singh 47 ). The authors of the meta-analysis, however, identified the lack of prices from low-income and middle-income countries as a limitation.
Although our nutrient profiling results showed that fruits are the healthier options, fruits were substantially more expensive in terms of energy cost (per 418 kJ (100 kcal)) compared with the other food items sold. A daily intake of 400 g of fruits and vegetables (5 servings) is recommended by the South African food-based dietary guidelines( Reference Vorster, Badham and Venter 24 ). A recent finding on fruit and vegetable consumption in eighteen countries participating in the Prospective Urban Rural Epidemiology (PURE) study showed that unaffordability of fruits and vegetables might be a large barrier to achieving the nutritional targets of two servings of fruit and three servings of vegetables daily( Reference Miller, Yusuf and Chow 48 ). Besides being more expensive sources of energy, fruits are perishable, and it will be a challenge to convince vendors to stock these. Although fruits and vegetables are an expensive source of energy, they are nutrient-rich in relation to their low energy content and were shown to have a relatively high nutrient-to-price ratio, and therefore to provide key nutrients at a reasonable cost( Reference Darmon, Darmon and Maillot 49 ).
Promoting healthy eating in different settings, including schools, is one of the key actions outlined in the Strategy for the Prevention and Control of Obesity in South Africa( 22 ). According to the National School Nutrition Programme Guidelines for Tuck Shop Owners, school management teams and school governing bodies should play a leading role in ensuring that healthy food-snacks and beverages are sold to learners, and each tuck shop owner should sign a Service Level Agreement with the school( 23 ). Implementation of these guidelines, particularly with regard to informal food vendors is, however, not clear. The guidelines further recommend that the community should encourage tuck shop owners to sell healthier food options and that the parents should lead by example. Yet, the informal food vendors are community members and, in many instances, probably the parents of learners. Tuck shops selling healthier food options more frequently may not necessarily be positively perceived or be associated with healthier food choices( Reference Bekker, Marias and Koen 50 ) and a more comprehensive approach will be needed for a healthier school environment. However, for any intervention to reduce children’s intake of unhealthy foods to be successful, children need access to healthier food choices. The inverse association between the nutrient profiling score and energy cost of the food item indicates that the healthier food items were more expensive sources of energy. Considering that the schools were in low-income settings, strategies are needed to assist the informal food vendors to select healthier food options at no additional cost to sell. The nutrient profile and cost of food items may be used to develop tools to guide food choices in settings where financial means are limited( Reference Dubois, Tharrey and Darmon 51 ).
Acknowledgements
Acknowledgements: The authors thank the vendors and schools for participating in the study; the fieldworkers for collecting the data; their administrator Erica April for operational logistics; and the Eastern Cape Department of Education for granting approval to do the study. Financial support: The study was funded by the South African Medical Research Council. The South African Medical Research Council had no role in the design, analysis or writing of this article. Conflict of interest: The authors have no conflict of interest. Authorship: M.F. contributed to study design, data analysis and writing of the manuscript. A.d.V. contributed to study design and writing of the manuscript. J.H. contributed to project planning, data collection and data capturing, and manuscript editing. P.J.v.J. contributed to the sampling plan and nutrient analysis of the corn-based snacks, and writing of the manuscript. A.P.O. contributed to initial planning and selection of schools, and manuscript editing. E.S. is the principal investigator of the larger study and contributed to manuscript editing. All authors read and approved the final manuscript. Ethics of human subject participation: The study was conducted according to the principles of the Declaration of Helsinki of 1964, as revised in Fortaleza, Brazil in 2013. The study was approved by the Ethics Committee of the University of Fort Hare. Each school principal was informed of the study and what it entailed, before approaching the vendors to participate. Vendors were informed about the purpose of the study and what was required from them; that their food items would be observed and recorded on a checklist, and that foods without weights on the packaging would be purchased to be weighed. Permission to take photographs of food items was also obtained from the vendors. Informed consent was obtained from participating vendors by signing a consent form; and each vendor received an information letter.


