Many national and international guidelines recommend nutrition screening to identify patients at risk of malnutrition( Reference Kondrup, Allison and Elia 1 – Reference Elia 5 ). This is not only because treatment of malnutrition can produce clinical benefits, but also because malnutrition is costly( Reference Elia and Stratton 6 ). It is estimated that managing patients with malnutrition is over four times more costly than managing those without malnutrition, and that treatment of malnutrition produces a net cost-saving( Reference Elia and Stratton 6 ). Despite widespread recognition of the importance of nutritional screening, malnutrition remains under-detected and under-treated especially in the community setting( Reference Russell and Elia 7 ). This may be because healthcare workers have limited time to screen for malnutrition and in the case of the community setting, limited access to individuals at risk of malnutrition. If people could effectively screen themselves, they could reduce the workload of healthcare workers, while becoming more engaged in their own care and management.
Nutritional screening, which may involve different criteria within and between care settings, can be regarded as the first step in the management of malnutrition. The Malnutrition Universal Screening Tool (‘MUST’), the most commonly used malnutrition screening tool in both hospital and community settings in the UK( Reference Elia and Stratton 8 – Reference Russell and Elia 10 ), is based on three criteria: BMI, unintentional weight loss and an effect of acute disease preventing oral nutritional intake (>5 d). In the first paper to examine the feasibility of self-screening with ‘MUST’ our group reported that the procedure is acceptable to patients, is user-friendly, reliable and has good agreement with healthcare professional (HCP) screening( Reference Cawood, Elia and Sharp 11 ). However, this study used a paper version of the tool in which the calculation of BMI and weight loss involved the manual use of a number of tables to convert anthropometric measurements into a ‘score’. Although this is a valid method, it can be both slow and prone to human error.
To overcome these difficulties self-screening using an electronic system has been proposed because of its potential to produce quicker, more reliable and more valid results. Indeed, encouraging results have been produced in a pilot study using an electronic system( Reference McGurk, Jackson and Elia 12 ), facilitated by modified equipment. Unfortunately such tailor made self-screening machines are not currently available for clinical use. Other studies have also investigated the use of automated malnutrition screening tools although they have not involved patient self-screening( Reference Abbott, Teleni and McKavanagh 13 , Reference Hershkovich, Stark and Levi 14 ). As further investigations are warranted, this study was undertaken to extend the evidence base for malnutrition self-screening. Specifically this study in the outpatient setting examined (1) the concurrent validity, and ease of use of self-screening using an electronic version of ‘MUST’ by patients compared with HCP and (2) patient preference for electronic v. paper-based self-screening with ‘MUST’.
Methods
General
This study involves malnutrition screening with ‘MUST’. ‘MUST’ is a five step tool, step 1 involves BMI, step 2 unintentional weight loss and step 3 acute disease effect. From this data, malnutrition scores can be calculated (step 4) and risk categories designated, low risk (score 0), medium risk (score 1), high risk (score 2 or more) which corresponds to management plans (step 5)( Reference Todorovic, Russell and Stratton 15 , 16 ). ‘MUST’ can be categorised with a three-category classification (low, medium, high risk of malnutrition), and also a two-category classification (low risk and at risk of malnutrition (medium+high risk combined)) (see the ‘Results’ section).
The investigation was divided into two parts: study 1 involving 100 patients, which examined the agreement between electronic self-screening with HCP screening and ease of use; and study 2 involving twenty patients, which examined preference between self-screening using paper and electronic versions of ‘MUST’. In an attempt to select a random sample of patients, the following procedure was instituted. When the HCP undertaking the study was ready to recruit, the next available person (last patient to be checked into the clinic) was invited to participate. Participants were excluded if they were <18 years of age, pregnant, inpatients, unable to complete ‘MUST’ due to physical or mental incapacity, unable to comprehend English, participating in another nutrition study or were unable to give informed consent. Reasons for non-participation were recorded.
This study was conducted according to the guidelines laid down in the Declaration of Helsinki and all procedures involving subjects were approved by the Southampton and South West Hampshire Research Ethics Committee B (08/H0504/49). Written informed consent was obtained from all subjects. The trial was registered on ClinicalTrials.gov (NCT00714324). Basic information such as age, sex, type of clinic, highest qualification achieved, current/former occupation, and self-rated computer skills (advanced, competent, beginner, never) was also obtained from each subject. Their occupations were grouped using a UK standard occupation classification system( 17 ). If help was requested during self-screening, it was noted.
Study 1
This study of 100 patients examined the agreement between self-screening and HCP screening, ease of use of self-screening, the time to self-screen and the prevalence of malnutrition.
The electronic version of ‘MUST’ was available on a laptop situated on a table in the outpatient waiting room, it included simple instructions on how to use the screening tool using a step by step process. The tool consisted of a maximum of eight screens: (1) instructions; (2) basic details (name, sex, date of birth); (3) height (entered in metric or imperial); (4) weight (entered in metric or imperial); (5) weight approximately 3 months ago (entered in metric or imperial); (6) question addressing if any weight loss was planned or unplanned (this screen only shows if there was weight loss); (7) the presence of acute disease effect on nutrition intake (no food intake for more than 5 d); (8) summary showing risk category and advice on next steps (Fig. 1).
Example screenshots of the electronic Malnutrition Universal Screening Tool used for self-screening by patients in the trial.
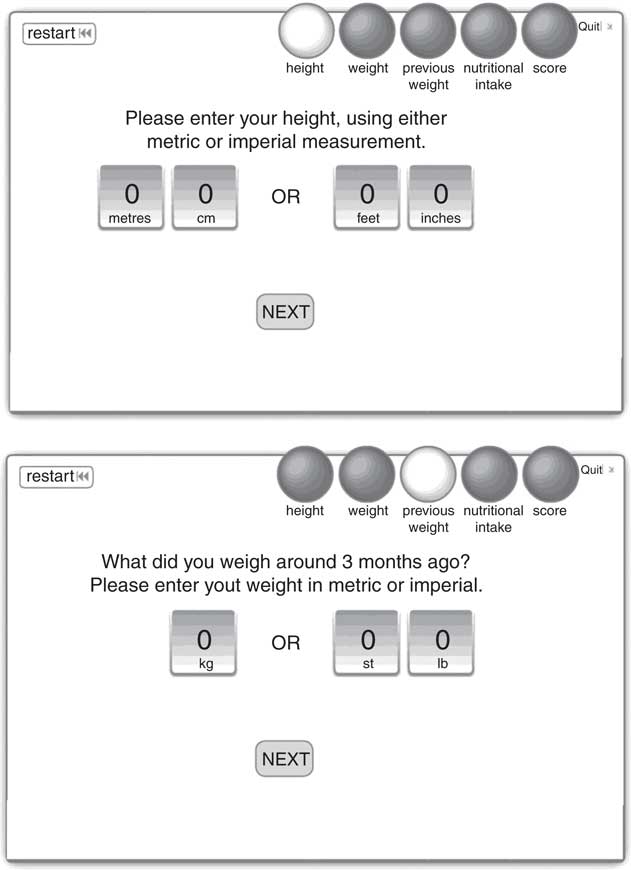
All patients were made aware of the weighing scales (Marsden MS4202 medical digital grade 3), and portable height measure (Seca Leicester stadiometer) which were available in the waiting room. No additional verbal instructions were provided. All calculations were automated and the results of the electronic version of ‘MUST’ were automatically saved in an excel sheet on the laptop. The patients did not share their results with the HCP.
Agreement between self-screening and healthcare professional screening
Following self-screening, the HCP also screened the patient, using the same equipment and standardised ‘MUST’ screening methodology (paper-based) as detailed by Stratton et al. ( Reference Stratton, Hackston and Longmore 18 ). Weight was measured to the nearest 0·1 kg and height to the nearest 0·1 cm. The HCP documented the patients ‘MUST’ score and risk category (low, medium or high), but did not disclose this to the patient. Any discrepancies between the two sets of screening results were examined closely to identify the cause of the problem.
Ease of use and time taken to complete the electronic version of the Malnutrition Universal Screening Tool
All patients completed an ease of use questionnaire, comprising of sixteen questions, rating the ease of use (very easy, easy, difficult, very difficult), willingness to self-screen, computer skills and areas for general comments (areas to improve, aspects that were difficult). The time taken for each patient to self-screen using the electronic version of ‘MUST’ was recorded using a stop watch. The relationship between time taken to self-screen and other factors (age, sex, occupation, access to a computer, self-rated computer skills) were assessed.
Prevalence of malnutrition
The prevalence of malnutrition was assessed using both self-screening and HCP screening.
Study 2
This study involving twenty separate patients examined patient preference between self-screening with paper and electronic versions of ‘MUST’, the former having been previously validated( Reference Cawood, Elia and Sharp 11 ). Patients were recruited from the same clinics using the same procedures as in study 1, and a collection was made of similar data, such as age, sex, weight, height, type of clinic, highest qualification achieved, and current/former occupation. In contrast to study 1, this sub-sample was not assessed by a HCP, they were simply asked to assess ease of use and preference for the electronic v. paper version of ‘MUST’. Half (n 10) completed the paper version first, followed by the electronic version and the other half (n 10) in the reverse order. Time to complete each version was recorded using a stop watch and patients completed a preference questionnaire after they had completed both versions.
Statistical analysis
Agreement and chance-corrected agreement (κ) of malnutrition risk categorisation were assessed, the latter using the grading system of Landis & Koch( Reference Landis and Koch 19 ) (<0·00, poor; 0·00–0·20, slight; 0·21–0·40, fair; 0·41–0·60, moderate; 0·61–0·80, substantial; 0·81–1·00, almost perfect). The binomial test was used to examine systematic under- or over-categorisation (disagreements) of malnutrition risk between tools (McNemar test). Results are presented for both the two-category classification of ‘MUST’ (low risk, medium+high risk), and the three-category classification (low, medium, high risk). Power calculations (Sample Power 2 SPSS), suggested that for a malnutrition prevalence of 10 %, a sample size of at least ninety-two patients was needed to detect a chance-corrected agreement of κ=0·75 against a null hypothesis of κ=0·45 with 80 % power and P=0·05 (two-tailed). Statistical analyses (χ 2, independent samples t test) were undertaken using SPSS statistical software package (IBM; version 24.0). Results of continuous variables are presented as means and standard deviations, unless otherwise stated. A P value of <0·05 (two-tailed) was considered to be significant.
Results
Study 1
Recruitment and study population
After excluding four subjects who met one of the exclusion criteria (<18 years, pregnant, participation in another study), the study population represented 63 % of the total sample of subjects invited to participate. The reasons for patients declining to participate were as follows: not willing/no reason (37 %), unable to use a computer (36 %), anxious/not feeling well (9 %), poor English/unable to read/no glasses (6 %), inadequate time (patient asked to see doctor) (6 %) and other reasons (5 %). No baseline characteristics are available for those who declined to participate in the study.
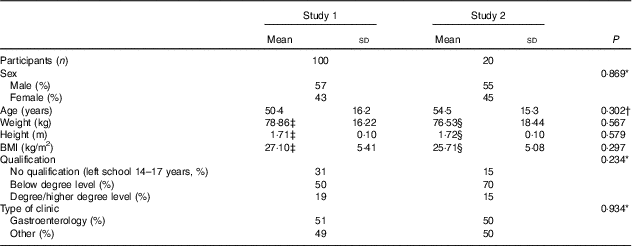
Of the 100 subjects enrolled into the study (57 % male) the mean age was 50·4 years (19–85 years, sd 16·2 years) with 29 % older than 60 years. Table 1 shows the anthropometric characteristics (weight, height, BMI, qualifications attained) all of which did not differ significantly from those in study 2 (Table 1). Patients had a range of occupations including; managerial and professional (26 %); technical and administrative (24 %); skilled trade (17 %); and provision of sales and customer services (9 %). The patients attended a gastroenterology clinic (51 %) and a variety of other clinics (including other medical, oncology and surgical clinics) which did not differ significantly from study 2. The majority of the patients had access to a computer at home (83 %), used it daily/weekly (74 %), and classified their computer skills as competent or advanced (63 %). In all, 37 % of participants classified themselves as beginners/novice or had never used a computer before.
Baseline characteristics of subjects participating in studies 1 and 2 (Mean values and standard deviations; numbers and percentages)

* χ 2 Test (P values calculated using numbers and not percentages).
† Independent samples t test.
‡ Results obtained by healthcare professional using paper version.
§ Results obtained by patient using electronic self-screening version.
Agreement between self-screening and healthcare professional screening
(a) Three-category ‘MUST’ classification (low, medium, high risk)
For the three-category classification of ‘MUST’ (low, medium, high risk) agreement between patient ‘self-screening’ and HCP screening was 94 %, and the chance-corrected agreement 74 % (κ=0·74 (within the range of 0·61–0·80 indicative of ‘substantial’ agreement; se 0·092; P<0·001)) (Table 2). There were six discrepancies in categorisation between patient self-screening and HCP screening (McNemar P=0·261), of which five were lower with HCP screening (Table 3). From the six discrepancies, two were associated with the BMI score (step 1 of ‘MUST’), one with the weight loss score (step 2 of ‘MUST’), two with the acute disease effect score (step 3 of ‘MUST’), and one with both BMI and acute disease (steps 1 and 3) making a total of seven disagreements (due to one discrepancy having two disagreements). The cause of these disagreements are summarised below.
Agreement and chance-corrected agreement between electronic ‘self-screening’ and healthcare professional (HCP) screening (Numbers and percentages; κ coefficients with their standard errors)
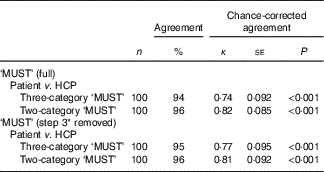
MUST, Malnutrition Universal Screening Tool.
* Step 3=acute disease effect score (no food intake for >5 d); three-category ‘MUST’ (low, medium, high risk); two-category ‘MUST’ (low, medium+high risk).
Cross tabulation of malnutrition risk according to ‘electronic patient self-screening’ and healthcare professional (HCP) screening using the three-category Malnutrition Universal Screening Tool classification (Numbers and percentages)

* Six discrepancies; McNemar test P=0·261.
BMI score (step 1 of the Malnutrition Universal Screening Tool)
There were a total of three discrepancies in this category. The first patient recorded their height as 1·63 m (weight 52·9 kg), whereas the HCP measured it as 1·55 m (weight 52·6 kg). This difference of 8 cm resulted in a BMI of 19·9 kg/m2 (‘MUST’ score 1) according to patient self-screening compared with 21·9 kg/m2 (‘MUST’ score 0) according to HCP screening. The second patient recorded an unrealistic height of 2·13 m (weight 73 kg), whereas the HCP measured it as 1·7 m (weight 73·7 kg), a difference of 43 cm, which resulted in a BMI of 16·1 kg/m2 (‘MUST’ score 2) during patient self-screening and 25·5 kg/m2 (‘MUST’ score 0) during HCP screening. The third patient recorded a weight of 68 kg, which produced a BMI of 19·9 kg/m2 and a score of 1 (as BMI <20 kg/m2) (height 1·85 m), whereas the HCP recorded the weight as 68·7 kg which produced a BMI of 20·1 kg/m2 and a score of 0 (as BMI >20 kg/m2).
Weight loss score (step 2 of the Malnutrition Universal Screening Tool)
The single patient in this category recorded their current weight as 96·4 kg and their previous weight of 107 kg, which meant that the weight loss was 10·6 kg (9·9 % weight loss, score=1). The HCP recorded a current weight (measured) of 95·1 kg and a previous weight of 107 kg and an associated weight loss of 11·9 kg (11·1 % weight loss, score=2).
Acute disease effect score (step 3 of the Malnutrition Universal Screening Tool)
For the acute disease effect score, three patients gave themselves a score of 2, whilst the HCP scored them as zero.
When the acute disease effect (step 3) is excluded from the ‘MUST’ categorisation, the three-category classification of ‘MUST’ (low, medium, high risk) agreement between patient self-screening and HCP screening was 95 %, and the chance-corrected agreement was 77 % (κ=0·77 (within the range of 0·61–0·80 indicative of ‘substantial’ agreement’; se 0·095; P<0·001)) (Table 2).
(b) Two-category ‘MUST’ classification (low risk; medium+high risk)
For the two-category classification of ‘MUST’ (low risk; medium+high risk) agreement between patient self-screening and HCP screening was 96 % (κ=0·82 (within the range of 0·81–1·00 indicative of ‘almost-perfect’ agreement; se 0·085; P<0·001)) (Table 2). There were four discrepancies between ‘self-screening’ and HCP screening (McNemar P=0·125) (Table 4): two were associated with BMI score (step 1 of ‘MUST’), none with weight loss score (step 2 of ‘MUST’), one with acute disease effect score (step 3 of ‘MUST’), and one with both BMI score and acute disease effect score (steps 1 and 3) (these are the same discrepancies as discussed above). With the acute disease effect removed, agreement between patient self-screening and HCP screening was 96 % (κ=0·81 (within the range of 0·81–1·0 indicative of ‘almost-perfect’ agreement; se 0·092; P<0·001)) (Table 2).
Cross tabulation of malnutrition risk according to ‘electronic patient self-screening’ and healthcare professional (HCP) screening using the two-category Malnutrition Universal Screening Tool classification (Numbers and percentages)
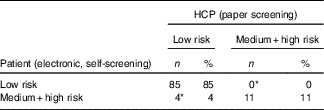
* Four discrepancies; McNemar test P=0·125.
Ease of use of the electronic version of the Malnutrition Universal Screening Tool and time taken to complete self-screening
All patients (n 100) were able to screen themselves. Only 10 % reported difficulties in undertaking the task and asked for subsequent assistance, the main reasons being problems with eye sight (not having their glasses with them) (n 4) and lack of computer skills (n 3).
Patients found the tool easy or very easy to understand (99 %) and complete (98 %). Most felt they were able to measure their weight and height (86 %) and complete the tool by themselves (89 %), whilst indicating that they had been provided with adequate instructions (100 %). All patients (100 %) were happy to answer questions about their nutrition and nearly all were happy to screen themselves (99 %).
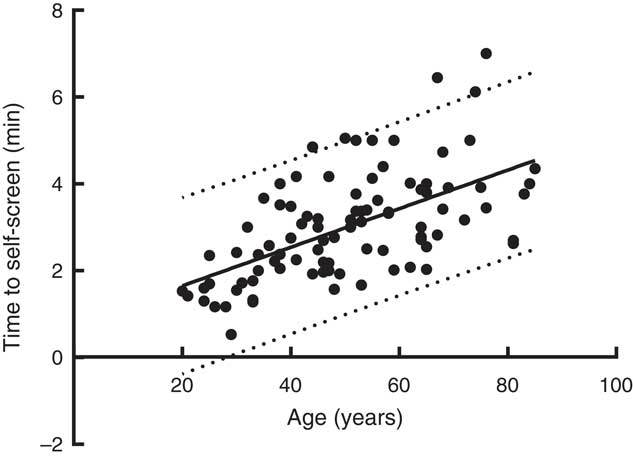
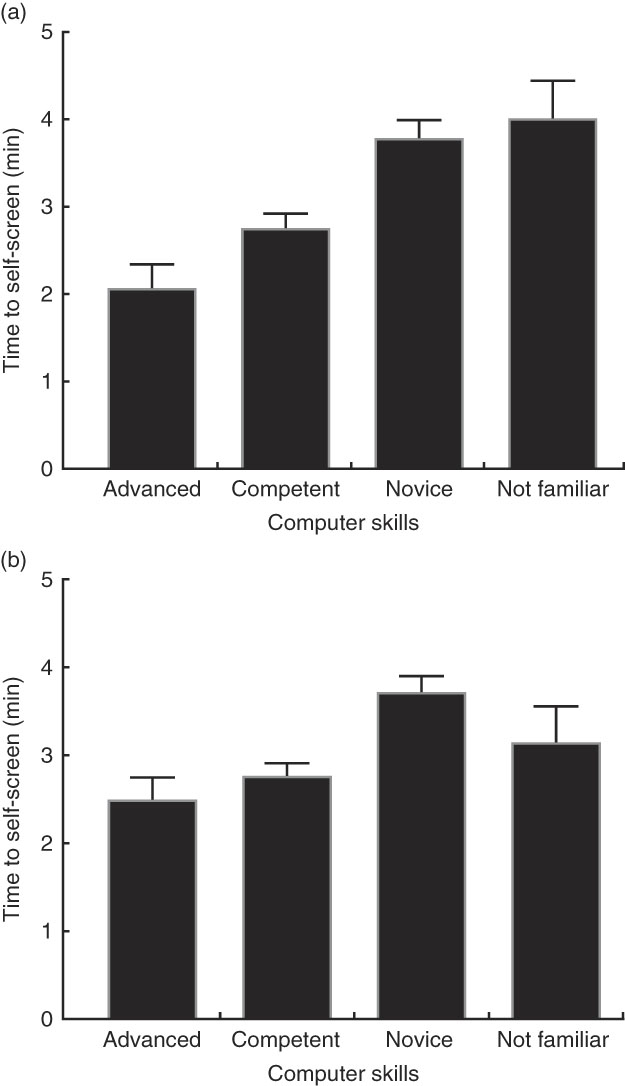
Patients (n 100) took a mean of 3·0 (sd 1·2) min (range 0·5–7·0 min; n 94) to self-screen, with 80 % taking <4 min, 96 % <5 min and 100 % in ≤7 min. Time to screen was not significantly related to sex or occupational status. However, it was significantly faster in the following groups: younger patients (Fig. 2; <60 years 2·7 (sd 1·08) min v. >60 years 3·77 (sd 1·15) min (P<0·001; n 94)); those who had access to a computer and internet at home (2·82 (sd 1·08) v. 4·06 (sd 1·42) min (P<0·001; n 88)); those who rated themselves as being more competent in computer skills (advanced 2·07 (sd 0·67) min, competent 2·76 (sd 1·0) min, beginner/novice 3·78 (sd 1·17) min, never 4·01 (sd 1·53) min (P<0·001; n 88)); those who used the computer more frequently (daily 2·59 (sd 0·98) v. 1–2/week 23·42 (sd 0·65) min v. beginner/novice 3·78 (sd 1·17) v. never 4·01 (sd 1·53) min (P<0·001; n 88)); and those who rated themselves as having better educational qualifications (no qualifications/left school 14–17 years 3·54 (sd 1·23) min v. qualification below degree level 2·90 (sd 1·14) min v. qualification to degree/higher degree level 2·43 (sd 1·09) min (P=0·006; n 94)). When individual variables were adjusted for age (time to screen remaining the independent variable), there was a loss of significance associated with the availability of computer and internet at home (P=0·097) and educational qualifications (P=0·104), but frequency of computer use (P<0·001) and self-rated computer skills (P<0·001) remained highly significant (Fig. 3). Furthermore, those who preferred to self-screen or had no preference between self-screening and HCP screening took a shorter time to self-screen (2·84 (sd 1·09) v. 4·10 (sd 1·44) min; P<0·001, n 88) and were younger than those who preferred HCP screening (48·0 (sd 14·7) v. 65·0 (sd 14·6) years; P<0·001; n 90).
Time taken to self-screen by age. ![]() , regression line (time (min)=0·762+0·044 years; r 0·584; P<0·001, n 93);
, regression line (time (min)=0·762+0·044 years; r 0·584; P<0·001, n 93); ![]() , 95 % prediction lines.
, 95 % prediction lines.
Time taken to self-screen according to computer skills. (a) Raw data (P<0·001) and (b) data adjusted for age (P<0·001). Values are means, with their standard errors represented by vertical bars.
About 80 % of patients were able to screen themselves in <4 min, and of these 76 % were <60 years, 84·5 % had a home computer and internet access, and 91·5 % were either <60 years or older than 60 years with a home computer and access to the internet. This last category of patients showed 93·8 % agreement with HCP screening (κ=0·76) using the three-category classification of ‘MUST’ and 96·3 % agreement (κ=0·85) with HCP screening using the two-category classification of ‘MUST’.
Most patients (89 %) stated there were no aspects of the tool that they felt could be improved. Five patients said improvements could be made, mainly around automated number input. Overall most of the participants (85 %) said they would prefer to use an electronic version of ‘MUST’ over a paper version. When asked whether they would prefer a HCP to screen them only a minority affirmed, as 86 % were happy to self-screen or had no preference.
Prevalence of malnutrition assessed by patient self-screening (n 100)
Prevalence of malnutrition in patients was found to be 15 % by self-screening and 11 % by HCP screening, with no significant difference between the two estimates according to the McNemar test (Table 3). There was some variation in malnutrition rates depending on type of clinic attended (gastroenterology 15 %, oncology 8 %, surgical 20 % and ‘other’ medical 17 %) although these were not significantly different. There were no associations between malnutrition risk established by patient self-screening and age categories (<65 v. >65 years), sex, educational qualifications or type of clinic attended.
Study 2
Preference between electronic and paper versions of the Malnutrition Universal Screening Tool
The characteristics of patients in this group of twenty outpatients are shown in Table 1. These characteristics (age, sex, weight, height, BMI, educational qualifications and type of clinic attended) did not differ significantly from study 1.
Both tools were judged to be easy to use requiring limited assistance; however more patients required some assistance with the paper tool (4/20) v. the electronic version of ‘MUST’ (2/20) (difference not significant, P>0·05). Although numbers are small (n 20), the majority of patients found the electronic tool easier to complete (65 %), preferred it to the paper version (55 %) or had no preference (20 %). Age, qualifications and type of clinic attended had no impact on preference (between tools, understanding of tools, person screening) with the one exception of age having an impact on preference of tools, those aged <60 years significantly preferred the electronic version (χ 2, P=0·016). The main reason for the preference was that the electronic tool was quicker and easier to use.
In study 2, the mean time to for the same patient to self-screen using the electronic version of ‘MUST’ was about 30 % quicker than the paper version, though not significant (2·1 (sd 1·3) v. 3·0 (sd 1·2) min).
Discussion
This study in outpatients demonstrates the feasibility of electronic self-screening using ‘MUST’, the most widely used validated malnutrition screening tool across hospital and community settings in the UK( Reference Russell, Oldale and Elia 9 , Reference Russell and Elia 10 , Reference Russell and Elia 20 , Reference Russell and Elia 21 ). This study suggests that outpatients were able to self-screen using an electronic version of ‘MUST’. It has also identified the advantages and disadvantages of using the current electronic self-screening system and suggests improvements that could be made to pave the way towards routine self-screening in the hospital outpatient setting and potentially into the wider community. Although a wide variety of malnutrition tools are used in clinical practice across the world, they may not be amenable to self-screening because they require input from HCP (e.g. Nutrition Risk Screening (NRS)-2002 and subjective global assessment). Other types of tools may be used for self-screening, such as subjective self-administered questionnaires lacking objective measurements of weight and height, and the short form of the Mini Nutritional Assessment (MNA), a modification of the lengthier, original MNA that was developed for use only in older people in the community setting.
One of the encouraging aspects of the study was that nearly all of the participants found the electronic version of ‘MUST’ easy to understand and complete, and were able to complete it themselves. When asked if they would prefer a HCP to screen them, 86 % either had no preference or were happy to self-screen, indicating that electronic self-screening is highly acceptable and indeed just as, if not, more acceptable than HCP screening.
The agreement between electronic self-screening and HCP screening was found to be 94 % (chance-corrected agreement 74 %) for the three-category classification of ‘MUST’ and 96 % (82 % chance-corrected agreement) for the two-category classification of ‘MUST’. The present results, are at least as good as those obtained in our previous study using a paper version of ‘MUST’ to self-screen (90 % agreement or 70 % chance-corrected agreement for three-category classification of ‘MUST’, and 93 or 77 % chance-corrected agreement for the two-category classification of ‘MUST’)( Reference Cawood, Elia and Sharp 11 ), and represent ‘substantial’ to ‘almost-perfect’ agreement( Reference Landis and Koch 19 ). Another positive aspect of the present study is that self-screening took on average 3·0 (sd 1·2) min (n 100), which is 40 % faster (P<0·001) than that reported in our previous paper using a paper version of ‘MUST’ (5 (sd 1·9) min; n 205). Indeed, in the present study almost all patients (96 %) self-screened in 5 min or less. Given that these patients are ‘waiting’ in outpatient waiting rooms, the amount of time needed to self-screen appears feasible and not over-burdensome, although sufficient resource (e.g. equipment) would be needed in practice to prevent delays in large clinics if patients are slow to self-screen or there are large numbers of patients waiting. To reduce the risk of this possibility, clinics could select groups of patients who are likely to self-screen faster, such as those who are younger, have access to a computer at home and have higher self-rated computer skills. For example, the study found that those who were <60 years in combination with having a home computer and internet access accounted for 91.5 % of those who were able to screen themselves in <4 min with at least as good agreement with HCP screening of the cohort as a whole.
There were six discrepancies out of 100 between self-screening and HCP screening, which for practical reasons can be divided into two categories. The first category, which accounted for most of the discrepancies, are those that can easily be identifiable by a clinic attendant, as in the case of an erroneous entry by a patient who recorded an unrealistic height at 2·13 m (actual height 1·70 m) or erroneous entries of an acute disease score (no intake for >5 d), which are extremely unlikely to apply to hospital outpatients. The second category involves discrepancies in which the source of the discrepancy is more difficult to identify in routine clinical practice because of uncertainties as to whether the erroneous entries of weight or height or weight loss were made by the HCP, the patient, or both. It is also unclear if discrepancies were due to incorrect measurements, or transcription errors, which could be due to incorrect visualisation and/or memorisation of the information displayed on the scales and/or stadiometer.
Some of these potential areas for error could be overcome by development of an electronic system that integrates measures of weight, weight loss and height, with transmitting the information directly to a computer to calculate ‘MUST’ scores. Sonic measurements of height may also prove to be useful for self-screening as the patient does not have to operate the stadiometer, as height is recorded electronically while the subject stands upright on the stadiometer, looking forward. McGurk et al. ( Reference McGurk, Jackson and Elia 12 ) investigated one such system in which a modified digital weight and height machine used Wi-Fi to transmit the results directly to the computer (weight loss was manually entered to enable a ‘MUST’ score to be calculated). They concluded that this was ‘rapid, easy, reliable and feasible in a clinical setting’, but it required the use of specialised equipment which may have logistical and cost limitations. A separate issue, that of an acute disease effect resulting in no food intake for more than 5 d, is extremely unlikely to apply to the hospital outpatient setting. Its exclusion from the ‘MUST’ scoring system in this setting, would not only simplify and speed up self-screening, it would also make it more accurate. This is in line with the Malnutrition Action Group of the British Association for Parenteral and Enteral Nutrition, which developed ‘MUST’, and chose not to include step 3 in their electronic malnutrition self-screening website http://www.malnutritionselfscreening.org/ ( 22 ). Finally, calculations of BMI and percentage weight loss using an electronic system avoid potential errors that can arise from manual calculations and use of paper versions with graphs to indicate cut-off points between scores.
The prevalence of malnutrition was found to vary non-significantly depending on the type of clinic and the overall prevalence among hospital outpatients was 15 % by self-screening and 11 % by health professional screening, with no significant difference between them. Such results are comparable to those previously reported in similar clinics in the same hospital (16 %( Reference Rust, Cawood and Walters 23 ) and 19·6 %( Reference Cawood, Elia and Sharp 11 ) using ‘MUST’, although higher values have been reported in specific gastroenterology clinics (21·3 %( Reference McGurk, Jackson and Elia 12 ) and 30 %( Reference Stratton, Hackston and Longmore 18 )). In addition, the overall results are comparable to those previously reported in the UK in free-living older individuals in the community (12·5 %)( Reference Elia and Stratton 24 ), those residing in sheltered housing (approximately 13 %)( Reference Ralph, Cawood and Hubbard 25 , Reference Russell and Elia 26 ), and to the prevalence of 15 % in hospital outpatients used in a national report on the cost of malnutrition in England( Reference Elia 27 ).
Use of patient self-screening in an outpatient environment could be a significant step forward in the treatment of community based malnutrition, and supports patients to play a role in their own health and self-management, a key area for the NHS. In England alone, the number of outpatient appointments has nearly doubled since 2005–2006, rising from 60·6 million appointment to 113·3 million in 2015–2016( 28 ). Although screening patients who are admitted into hospital remains crucial, it cannot be the only strategy, given that in the same time period (2015–2016) the number of patients admitted was 16·3 million, significantly less than the number seen in outpatients( Reference Russell and Elia 26 , 29 ). Of the outpatient attendances, 51 % were referrals from general medical practitioners (v. 27 % from hospital consultants following an inpatient episode or accident and emergency visit)( 28 ), highlighting that outpatient attendance is largely community generated. Given that the majority of malnutrition originates in the community( Reference Russell and Elia 26 ), outpatient clinics offer a unique opportunity to screen for malnutrition in a large group of community based patients who may otherwise not be screened or receive the nutritional support they require. Similarly there is also the opportunity for self-screening to be rolled out wider into other community settings such as general practice.
There are some limitations to this study. As many as 36 % of the outpatients declined to participate in the study, raising the possibility of selection bias. Furthermore, the majority of study participants were computer literate, having access to a home computer and using it frequently, but approximately one third of those who declined to participate in the study did so because they lacked computer skills, questioning the presence of self-selection bias (those who consented to participate in the study may have agreed on the basis that they thought their computer skills were sufficient to complete the tool). However, it is encouraging to note that the third of patients who described themselves as computer beginners/novices, still managed to complete the tool with minimal help. This profile however may change with time, older people are increasingly using a computer to access information, advice, goods and services via the internet and it has been reported that for the first time, the number of people aged 65 years and over who have used the internet has overtaken those who have never used it( Reference Green and Rossal 30 ). The lag in technology adoption is likely to lessen between younger and older adults( Reference Charness and Boot 31 ), which may facilitate the adoption of electronic tools, such as self-screening in older adults and supports the desire for technology to become an integrated part of healthcare.
Another limitation to the study is that its findings may not be applicable to all types of clinics, as self-screening is likely to be unreliable or impossible in certain patients with physical or mental disability, such as those unable to stand or those who are severely demented or confused. The use of self-screening in other community settings, for example, sheltered housing, general population requires evaluation.
Conclusion
This study of patients attending a variety of hospital outpatient clinics shows that electronic self-screening involving ‘MUST’ is acceptable to patients, is user-friendly, and has substantial to almost-perfect agreement with HCP screening. Electronic self-screening was found to be as agreeable and often preferred by patients, compared with the validated paper-based self-screening ‘MUST’ tool. Further work is required to understand how electronic self-screening and subsequent management could be more effectively and more completely implemented into routine outpatient clinics, and the wider community.
Acknowledgements
The authors would like to thank the staff and patients at University Hospital Southampton NHS Foundation Trust for their encouragement or participation in the study.
The study was funded by an unrestricted educational grant from Nutricia Advanced Medical Nutrition.
M. E. was the chief investigator; A. L. C., R. J. S. and M. E. were responsible for trial design and development of protocol; S. K. E. S., E. R. W. with A. L. C. carried out patient recruitment, data collection and data entry; A. L. C. and M. E. performed data and statistical analysis; A. L. C. wrote the first draft of the manuscript, and finalised with M. E. and R. S.
M. E., E. R. W. and S. K. E. S. declare that there are no conflicts of interest. A. L. C. and R. J. S., both of whom hold honorary posts with the University of Southampton, are also employed part time by Nutricia.