

I. Introduction
Determining the price at which an asset should be issued is a fundamental economic problem. Too low a price means the issuer leaves money on the table. This transfer of value is financially detrimental to the issuer, but at least it ensures that the asset will be sold out easily. Too high a price, on the other hand, is likely to reduce the volume sold and negatively affect the reputation of both the issuer and the intermediary/broker. This risk of underselling and reputational damage explains why the literature finds that release prices are almost systematically too low for many assets (stocks and bonds in a financial context (Ljungqvist, Reference Ljungqvist and Eckbo2007; Ritter and Welch, Reference Ritter and Welch2002), but also tickets for sports and entertainment events (Bhave and Budish, Reference Bhave and Budish2017; Courty, Reference Courty2000, Reference Courty2003)).
In the context of wine, the pricing issue has already been raised. It has generally been addressed through hedonic models. These models allow the identification of the value attached by consumers to various attributes and have consequently been used to analyze wine prices from various regions (Outreville and Le Fur, Reference Outreville and Le Fur2020). In Bordeaux, the pricing issue takes on a particular meaning: it is the only region for which there is both a clearly organized and very active primary market and a liquid secondary market.Footnote 1 Moreover, Bordeaux plays the role of reference for the entire wine market. This is due in part to its primary market, which is structured around an annual event, the “en primeur campaign,” organized via “La Place de Bordeaux” (hereinafter, La Place). Concretely, in the spring of year T, the chateaux release their wines from vintage V = T – 1. These wines are still aging in oak barrels and are delivered to buyers between the end of year T + 1 and the beginning of year T + 2 (18 to 24 months after their release). This time lag and the fact that the wine is unfinished imply that market players face substantial uncertainty regarding each wine's final quality and the market price at the time of physical delivery. La Place itself relies on chateaux, courtiers (who advise the chateaux), and negociants (who absorb the quantities put on the market and connect the chateaux with resellers/merchants). Retailers and end customers are not directly part of this ecosystem.
The past decade has seen the emergence of the Liv-ex market platform, which uses the transactions recorded on its website to estimate market values for individual wines and compute price indices for the wine market as a whole. The main index, the Liv-ex 100, is often used to monitor general market trends. Negociants, on the other hand, keep large wine inventories whose value varies with demand. Therefore, they own significant price information for individual wines traded in substantial quantities. The wines are gradually released throughout the en primeur campaign, and La Place distributes them rapidly while ensuring global visibility. For example, in 2022, Château Batailley 2021 was one of the first well-known chateaux to be released on May 9, and Vieux Château Certan 2021 concluded the campaign on June 20. The en primeur period represents the year's highlight for the entire fine wine market.
A great vintage at affordable prices positively impacts the demand for fine wines (e.g., mature Bordeaux wines but also wines from other regions) (e.g., vintages 2009, 2015, and 2019, released in 2010, 2016, and 2020, respectively). A less good and/or overpriced vintage leads to the opposite result (e.g., vintages 2010, 2013, and 2017). Therefore, determining efficient release prices for Bordeaux wines is crucial for all wine industry participants. However, apart from qualitative analyses, often based on simple comparisons, only Liv-ex has ventured to propose release price estimates. Thus, for example, Farr Vintners—one of the most prominent English merchants—proposes comparisons based on the prices of previous vintages.
Given the issue's importance, academia has also examined the pricing of Bordeaux en primeur wines. Ashenfelter, Ashmore, and Lalonde (Reference Ashenfelter, Ashmore and Lalonde1995) are the first to highlight the inefficiency in the Bordeaux fine wine market. The most comprehensive studies are by Hekimoğlu, Kazaz, and Webster (Reference Hekimoğlu, Kazaz and Webster2017), Hekimoğlu and Kazaz (Reference Hekimoğlu and Kazaz2020), and Masset and Weisskopf (Reference Masset and Weisskopf2022). These studies are conceptually similar. In particular, they (i) model price changes rather than prices themselves and (ii) assume that price dynamics in the primary market need to be consistent with the ones observed in the secondary market. The intuition is that “over the long run, prices on the two markets cannot substantially diverge” (Masset and Weisskopf, Reference Masset and Weisskopf2022, p. 410). In addition to its logical nature, this approach requires relatively little secondary market data. Indeed, since it aims at modeling relative price variations (returns), it is not necessary to have secondary market prices for individual wines; a secondary market index (e.g., Liv-ex 100) is sufficient to track the general market dynamics. However, this simplicity has a double cost: a lack of statistical robustness in general and some wine prices that are potentially irrelevant from an economic perspective. The problem of robustness stems from the fact that to model the dynamics of the various wines correctly (all of which do not necessarily respond in the same way to changes in economic and qualitative variables), one would need a considerable price data history. In practice, however, it is difficult, if not impossible, to obtain data for more than 20 years. This means that many of the coefficients are estimated based on only 20 observations and are, therefore, likely to change if new data (e.g., one year of “fresh” data) is added. The problem of economic relevance comes from the fact that returns are modeled. Thus, the estimated release price of a chateau in vintage V is highly dependent on the price of vintage V – 1. Moreover, it does not consider the fact that the demand for that chateau may have evolved differently from the market as a whole between years V – 1 and V.Footnote 2
In this paper, we exploit a dataset containing individual wine prices on both the primary and secondary markets. We maintain the assumption that prices on the primary market must be consistent with those in the secondary market. We first model the prices on the secondary market just before the beginning of the en primeur campaign (end of April). This gives us a precise picture of how the market values each chateau. We then exploit this information to infer an appropriate release price for the new vintage. Our approach is similar to the one used in the bond market. When an issuer wants to determine the coupon to be offered on new bond issuances in the primary market, it will check the yield required by investors for the bonds already trading in the secondary market. In the context of wine, the comparison is less direct because two vintages of the same chateau are two different wines. All else being equal, an older wine, a better wine, or a wine from a highly sought-after vintage will naturally be more expensive. Therefore, we also consider the age effect, wine ratings, and the quality of the vintage.
In the following, we present our approach and apply our model to the 2021 vintage. A recent descriptive study by Liv-ex summarizes the 2021 primeur campaign as follows: “predictable chaos” (Liv-ex, 2022). Our model could help determine efficient prices and avoid this “chaos.” Chaos is problematic for intermediaries and merchants (who have to carry inventories while their margins are limited) in the short term and dangerous for all actors in the long term. Chateaux, in particular, want to sell their wines at high prices to ensure an ultra-premium positioning. However, this could backfire if buyers perceive release prices as excessive and, even more so, if they observe subsequently falling prices on the secondary market. Thus, this paper makes contributions from both an academic and a practical point of view. Our model stands out by its intuitive character (the logic is inherited from the bond market), its adaptation to the wine market (it takes into account its specificities), and the use of a set of price data obtained directly from the Bordeaux market. It delivers economically relevant results. Therefore, it can provide a decision-making tool for sellers (chateaux), intermediaries (courtiers and négociants), and buyers.
II. Research design
Our approach to estimating efficient en primeur release prices for Bordeaux wines is based on the premise that prices on the primary market are coherent with those observed on the secondary market. In order to do so, we proceed in three steps.
Step 1
In the first step, we use a regression to model the price of Bordeaux wines on the secondary market. This regression allows us to estimate the value attached to the various attributes that affect the price of Bordeaux wines. The general model reads as follows:

where $p_{i, v}^{sec} \;$ is the log price of a specific wine, that is, a specific chateau i × vintage v pair, on the secondary market just before the start of the en primeur campaign. The coefficients Chati account for the typical price level of wines from chateau i. The age coefficient β age accounts for the fact that wine prices generally increase with age (see, e.g., Dimson, Rousseau, and Spaenjers (Reference Dimson, Rousseau and Spaenjers2015)). The quality effect of the overall vintage (VintQ) and individual wines (Scorei,v) are controlled by β vintQ and β score. In the empirical analysis, we further consider several extensions to this general model. For instance, to account for the fact that wines with a high score may trigger a disproportionate price premium, we also consider a model that includes a quadratic term of the score. Similarly, to allow the vintage effect to be more flexible, we also use a model in which the quality of the vintage is entered as a set of dummies for exceptional, very good, and good (average being a reference in the regression).
Step 2
In the second step, we use the estimates for the various attributes from Model (1) to determine efficient release prices on the primary market that are in line relative to the secondary market. That is, we compute the efficient release prices using the formula:

where $\hat{p}_{i, 2021}^{prim}$ corresponds to the estimated efficient release price of each chateau i in vintage 2021. The age coefficient does not appear in this formula because it is, by definition, equal to zero.Footnote 3 VintQ and Scorei,v correspond to the estimated quality of vintage 2021 and the ratings of each wine.
Step 3
To examine the relevance of the model, we compare the estimated prices with the actual release prices. Theoretically, there are two possible explanations for discrepancies: (1) an irrelevant model which is unlikely due to the different test statistics used in this case or (2) inefficient prices. To distinguish between these two competing explanations, we analyze how the market reacted following en primeur releases. We look at the prices on the Liv-ex marketplace. If the model is good, but release prices are not efficient (explanation 2), we expect a negative correlation between the difference of the actual and estimated prices (mispricing) and the market reaction. That is, wines released at prices that are too high will sell less well, and their prices will decline on the secondary market.
Masset and Weisskopf (Reference Masset and Weisskopf2022) also use the linkages between secondary and primary markets to deduce efficient Bordeaux en primeur prices. They argue that the dynamics of en primeur prices need to remain consistent, at least in the long term, with those of a benchmark wine index. Their approach is based on the price variations of the various chateaux for subsequent years. It has the advantage of only using a small number of variables, including one benchmark, capturing the secondary market dynamics. However, this parsimony also leads to limitations. The biggest drawback of this approach is that it does not consider that some wines may evolve differently from the index. For the present study, we take advantage of a unique dataset from the Bordeaux wine trade. It contains prices on the secondary market for individual chateau × vintage pairs. This allows us to directly model the prices of the various crus (and not only their variations from one vintage to another). We will present our dataset in the next section.
III. Data
A. Prices on the primary and secondary markets
Our dataset consists of primary and secondary market price data for 74 red Bordeaux wines. They represent the majority of the Bordeaux wine market activity. We exclude white and sweet wines because they embody a tiny share of the wines traded and would add unnecessary noise to the different specifications. For the primary market, we collected the ex-negociant en primeur prices of the 2021 vintage as well as the three previous ones (2018 to 2020). This data comes from Liv-ex. For the secondary market, we obtained prices directly from negociants at La Place (negoce prices) just before the beginning of the 2021 en primeur campaign, that is, at the end of April 2022. The data contains prices for the various wines from the 2005 to 2020 vintages. Therefore, our database contains 1,177 prices from the secondary market (vintages 2005 to 2020) and 296 en primeur prices (vintages 2018 to 2021). Since the secondary market data is from 2022, we focus on modeling the prices of the 2021 vintage offered en primeur in 2022. For additional analyses, en primeur price data from the 2018 to 2020 vintages are used.
Table 1 presents price statistics by vintage. At first glance, the en primeur (primary market) prices for 2021 wines appear reasonable. On average, they are significantly lower than the current secondary market prices of the last three vintages. However, 2018, 2019, and 2020 are widely considered great vintages, and other older vintages have average prices close to and sometimes even lower than the 2021 vintage. For example, the 2014 vintage, which has been frequently compared to the 2021 vintage (wet and not very hot summer, wines with a “classic claret” aromatic profile), has a similar average price level, even though these wines are bottled and seven years older. In other words, these are wines whose quality is much less uncertain than that of the 2021s (which are still in barrels) and can already be consumed.
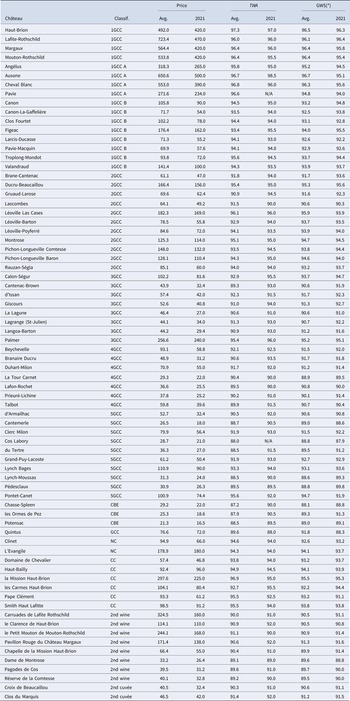
Descriptive statistics by vintage

Notes: Prices correspond to the current prices on the secondary market for vintages 2005 to 2020 and the prices on the primary market for vintage 2021. Vintage evaluation is the aggregate vintage rating (based on data from nine individual vintage charts from international wine experts/publications). TWA and GWS denote information on ratings from The Wine Advocate (TWA) and Global Wine Scores (GWS). For vintage 2021, GWS scores are unavailable and have been replaced by an aggregate score computed using a conceptually similar methodology.
Table 2 reports equivalent statistics, but for individual wines. The most expensive wines are the first classified growths (1GCC in the Médoc and 1GCC A in St-Emilion). They are followed by wines frequently called super seconds: Ducru-Beaucaillou, Leoville Las-Cases, or Montrose, to name a few. The least expensive wines are “poorly” classified wines (e.g., Cru Bourgeois, 5GCC) from the Medoc, whose production is considerable (Potensac, Cantemerle, etc.).
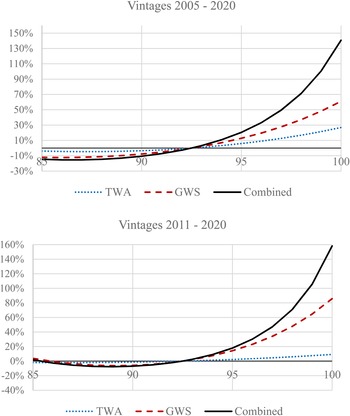
Descriptive statistics by chateau

Notes: 1GCC to 5GCC stand for first to fifth growth (Médoc), 1GCC A, 1GCC B, and GCC stand for first growth A, first growth B, and classified growth (St-Emilion). NC stands for not classified (Pomerol). CBE stands for Cru Bourgeois Exceptionnel (Médoc). The 2nd wine and 2nd cuvée stand for the second wine of classified growth chateaux and for another cuvée produced by classified growth chateaux but distinct from them. TWA and GWS denote information on average and 2021 ratings from The Wine Advocate (TWA) and Global Wine Scores (GWS). For the 2021 vintage, GWS scores are unavailable and have been replaced by an aggregate score computed using a conceptually similar methodology.
B. Vintage quality and ratings
A key element in the pricing of Bordeaux wines is vintage quality. This can be analyzed using weather data or expert ratings (see Corsi and Ashenfelter (Reference Corsi and Ashenfelter2019) for a discussion). At first sight, weather data appears more objective and has the advantage of being freely available (public knowledge). On the other hand, ratings, which are only available with a lag (of around one year), may contain private knowledge that goes beyond publicly available weather data. However, using weather-related data is also challenging. In particular, it is difficult to identify the relevant variables and even tougher to consider their possible interactions. For example, high temperatures and low precipitation are individually desirable (Ashenfelter, Reference Ashenfelter2008), but the two together can be problematic, especially at certain moments of the vine-growing cycle. This is becoming increasingly the case with global warming (see Ashenfelter and Storchmann (Reference Ashenfelter and Storchmann2016) for a review of the impact of weather and climate change on wine). However, more granular weather-related data retrieved from satellites appears to somewhat alleviate these concerns and difficulties and may constitute an interesting approach in the future.
Therefore, we opt for vintage charts rather than weather-related data. We compile and aggregate data from nine experts/reference publications. Aggregation reduces subjectivity bias and helps achieve an objective score (Cardebat, Figuet, and Paroissien, Reference Cardebat, Figuet and Paroissien2014). We include international (The Wine Advocate, Wine Spectator, Wine Enthusiast, Vinous, Decanter, Wine Cellar Insider) and French (Revue des Vins de France, Guide Hachette, Idealwine) experts. Some international references (Jancis Robinson, James Suckling, and Jean-Marc Quarin) could not be considered because they do not provide an aggregate and numerical evaluation of the various vintages. In order to control for differences in the rating scale and the way it is used (some experts are more generous and/or make more significant differences between the best and worst vintages), we standardize all the evaluations by subtracting the average and dividing by the standard deviation. In order to ensure the consistency of the evaluations, we calculate the correlation between the various experts. The lowest coefficient is 0.79, and the mean is slightly higher than 0.90. These results show that the experts have a strong level of agreement when it comes to assessing a vintage's overall quality. We, therefore, take the average of the standardized ratings to obtain an aggregate rating. It has an average correlation of 0.96 with the nine experts. In order to simplify the interpretation of this aggregate rating, we express it on the same scale as American experts, that is, on a scale of 100 points. Four categories of vintages emerge from the analysis of the ratings.
As displayed in Table 1, the best vintages are 2005, 2009, 2010, 2015, 2016, 2018, 2019, and 2020. All have scores between 96 and 99 and can, therefore, be considered exceptional. The vintages for 2008, 2014, and 2017 are in a second group with scores between 91 and 93. These are very good vintages. Then there are four good vintages (2004, 2006, 2011, and 2012) with scores between 88 and 90 points. The vintages for 2007 (86 points) and 2013 (84 points) close the ranking and can be considered average. The 2021 vintage gets a score of just 90 points. However, most experts have not yet evaluated it numerically (their qualitative comments are nevertheless consistent with the numerical evaluation mentioned previously). Moreover, the uncertainty about the vintage's final in-bottle quality remains high since the wines are not yet finished. Vintage 2021 can be considered on the borderline between good and very good.
We also consider the quality of individual wines, which can deviate from the vintage's overall assessment. To do so, we refer to the ratings of The Wine Advocate (TWA). Robert Parker, the absolute reference for Bordeaux, launched TWA in the 1970s. He retired almost ten years ago, but TWA remains the reference in the wine market. Nevertheless, there may be substantial differences between TWA and other wine experts for some wines. Indeed, preferences and other elements external to the wine tasted may affect the rating given by a particular expert. We, therefore, also consider the Global Wine Scores (GWS), which use a methodology that aims to maximize their information content. Ratings from experts are aggregated to minimize subjectivity (Cardebat, Figuet, and Paroissien, Reference Cardebat, Figuet and Paroissien2014). Unfortunately, the GWS website is not up to date, so the scores for vintage 2021 are not available. We have, therefore, calculated a rating based on the same approach as GWS by aggregating the scores of TWA, Vinous, Jancis Robinson, Tim Atkin, James Suckling, Jeff Leve, and Jane Anson.Footnote 4 The correlation between our aggregate score (AGG) and GWS is 0.92 for wines from 2005 to 2020. For comparison, the correlation between TWA alone and GWS is only 0.86. Moreover, the mean and standard deviation are almost identical for GWS and AGG. This suggests that AGG does a very good job of replicating GWS. We, therefore, use this score to assess the quality of the wines from the 2021 vintage.
Tables 1 and 2 present statistics on TWA and GWS scores by vintage (Table 1) and chateau (Table 2). First, the average and median scores by vintage are consistent with the qualitative hierarchy of the various vintages discussed earlier. A clear connection between prices and scores can be observed at the individual wine level. However, the difference between the best and the weakest wines appears much less pronounced than between the most and least expensive wines. Finally, for the 2021 wines, we see that they often have scores close to or slightly below the average scores of the 2005 to 2020 vintages. In short, they are good wines for the majority, but very few have the potential to be truly exceptional.
C. Market reaction to the release of en primeur wines
We obtain price data from Liv-ex for Bordeaux 2021s, for which trading activity on their platform exists. In comparison to the overall en primeur Bordeaux market, liquidity is limited. However, the prices recorded on Liv-ex represent actual transaction prices on the secondary market. This allows us to understand how the market reacts and how the various wine prices evolve just after their release. A total of 15 wines from our sample have been traded on Liv-ex. In unreported results, we find that prices have deviated on average by –4% (median: –10%) from their release prices. Nine wine prices decreased on average by –14%. Six wine prices increased on average by 11%, but this high average is mostly due to two wines that performed very well: Carruades de Lafite (+37%) and Carmes Haut-Brion (+15%). Anecdotally, these chateaux are among the three most popular 2021 (i.e., these are the wines that most members indicated they had purchased) in the Cellar Tracker community (the third one, Chateau Canon, has not yet traded on Liv-ex).
IV. Empirical results
A. Prices on the secondary market
Table 3 reports the results following the estimation of Model (1) for nine specifications. The table is organized into two panels: Panel A contains the results when all vintages (2005 to 2020) are considered, and Panel B focuses on the most recent vintages (2011 to 2020).
Modeling of wine prices on the secondary market

Notes: Table 3 displays the results of the nine specifications based on Model (1). Panel A includes all vintages, and Panel B is restricted to vintages from 2011 to 2020. It regresses log prices for specific wines on VintQ, a continuous quality variable, or on Good, Very Good, and Exceptional, which are wine quality dummy variables. Age is equal to the age of the wine since its release. TWA, GWS, TWA2 and GWS2 are the “The Wine Advocate” and “Global Wine Scores” scores and scores squared, respectively. All specifications include chateaux fixed effects (FE). *, **, and *** denote significance at the 90%, 95%, and 99% levels, respectively.
Table 3 suggests that all models have high explanatory power. Similarly, the coefficients remain consistent across the different specifications. The chateau coefficients (not reported in the table) vary between –2.51 and 0.76 for the most comprehensive Model (IX).Footnote 5 These coefficients have to be interpreted in comparison to the reference Angelus. These variable coefficients show that the price of a wine on the secondary market depends first and foremost on the name of the chateau that produced it. The hierarchy is unsurprising: Lafite Rothschild (more expensive than Angelus by 114% on average for the 2005 to 2020 vintages, and by 124% for the 2011 to 2020 vintages), Ausone (73% and 65%, respectively), then the other first growths, with Carruades de Lafite that appears to be as expensive as Haut-Brion. This last observation may be surprising, as Table 2 shows that Haut-Brion sells for much more than Carruades. However, Haut-Brion wines also receive much higher scores than Carruades. The model shows that the score differences between the two wines can explain the price differential. In terms of brand effect, there is—in 2022—almost no difference between the two. A group of chateaux, classified as fifth growth or cru bourgeois exceptionnel and with a lower standing (e.g., Potensac, Cantemerle, Chasse-Spleen), are at the bottom of the ranking with discounts between 85% and 90% relative to Angelus. Generally, the hierarchy has not changed much between the full sample and the 2011–2020 vintage sample. However, the differences in coefficient values between the most prestigious chateaux and the others have increased. This phenomenon should be reflected in the prices in the en primeur market.
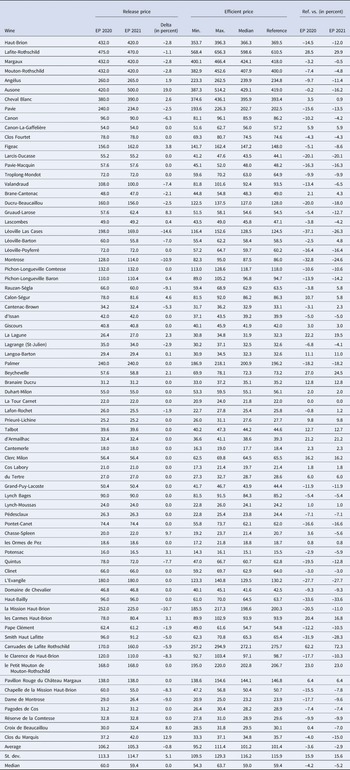
The quality of the vintage has a statistically and economically highly significant impact. The price difference between an average and an exceptional quality vintage ranges between 41 and 48% when all vintages are considered (Panel A), and TWA is used to measure the quality of individual wines (Models I, II, V, and VI). If GWS is employed (Models III, IV, VII, and VIII) and the focus is on vintages from 2011 to 2020 (Panel B), the vintage effect becomes less pronounced. This observation suggests that GWS can better capture the qualitative nuances between individual wines, resulting in a vintage effect that becomes secondary to the individual ratings. Moreover, we see that the coefficients associated with GWS are higher than those of TWA. Modeling vintage quality with dummies (good, very good, and exceptional) rather than a continuous variable (VintQ) has a limited impact on the R2. Economically, however, the results are a little different since we see that genuinely exceptional vintages sell for much more than others. This is consistent with observations and remarks from La Place that suggest that certain types of buyers (international ones, collectors, and investors) are only interested in great vintages. Model (IX) is the most elaborate one because it includes both TWA and GWS. It suggests that the two ratings are complementary. GWS has a stronger price effect, but TWA also plays a role, especially for the best-rated wines (quadratic effect). This is consistent with the literature that suggests that TWA is influential, especially when the score is “surprisingly” good (Masset, Weisskopf, and Cossutta, Reference Masset, Weisskopf and Cossutta2015). Figure 1 illustrates this effect for both vintage samples (2005 to 2020 and 2011 to 2020). Overall, the vintage and TWA effects have become less important in recent vintages. This can be attributed to two factors: the multiplication of great vintages and the retirement of Robert Parker. There is no longer a single expert who influences the market, and the chateaux have taken advantage of this new paradigm to reposition themselves according to their status and reputation.
Ratings and prices.
Notes: This figure shows the relationship between ratings and prices. The top panel includes all vintages, and the bottom panel is restricted to vintages from 2011 to 2020. It uses a rating of 92.5 points as a reference. The y-axis reports the premium (or discount) of a wine with a specific score compared to a similar wine with a score of 92.5 points. The figure shows the relationship between The Wine Advocate (TWA), Global Wine Scores (GWS), and both TWA and GWS with prices.

Age also has a positive effect on prices. A buyer must be compensated for the costs (e.g., storage, insurance) and uncertainty faced. The remuneration corresponds to $\exp ( {{\hat{\beta }}_{age}} ) -1.$ It is in the range of 3.3 to 4.5% p.a. in real terms for Panel A and 1.4% to 2.6% for Panel B. We also consider a model with an interaction between age and VintQ, but this has no impact on the results. In other words, for the sample of vintages considered, quality and age have a positive effect, but the slope of the age effect does not change with vintage quality. This result is different from Dimson, Rousseau, and Spaenjers (Reference Dimson, Rousseau and Spaenjers2015), but this can be explained by their sample containing some ancient wines, “collectables,” whose evolution is very different compared to younger wines.
The coefficient of determination (R2) are very high for all models, and the various coefficients remain stable from one specification to another. This suggests that the results presented so far are robust. Nevertheless, significant differences in some coefficients can be observed when comparing Panels A and B. Some chateaux have seen their standing and price level change over the last ten vintages. Robert Parker started retiring at the beginning of the 2010s, and TWA has progressively lost some of its influence. Moreover, the age effect is less pronounced in the most recent vintages. Our model must reflect the market's current reality to be deemed relevant. It is, therefore, logical to base our forecasts on the results obtained with the sample containing vintages from 2011 to 2020 (i.e., on the coefficients from Panel B).
B. Efficient prices on the primary market
In a second step, we can estimate the release prices of the 2021 vintage wines using the results of the estimation of Model (1). In concrete terms, this involves considering (i) chateau (brand effect), (ii) vintage quality, (iii) age (= 0 by definition), and (iv) expert ratings. At this stage, the only uncertainty is the quality of the vintage. According to the statistics presented in Table 1, the vintage looks good. Some comments suggest that it may even be very good. These assessments align with market comments that place 2021 close to 2011, 2014, or 2017 (see, notably, articles by N. Martin and A. Galloni on vinous.com). In our estimates, we consider this uncertainty by modeling prices on the following assumptions: the vintage is (i) good or (ii) very good.
Table 4 exhibits the ex-negoce price forecasts by chateau and the comparison with the previous vintage. The effective release prices have remained relatively stable compared to the 2020 vintage. We also report statistics on the efficient price, considering the nine specifications and the fact that the vintage (VintQ) is between good and very good. The reference model (“Reference” in the table) corresponds to Specification (IX) and assumes that the vintage is good. Note that if the vintage were to be very good, the estimated prices would be slightly lower. This may seem counterintuitive, but this is because, over the last ten vintages, the price difference between good and very good vintages has been small (only the exceptional vintages genuinely stand out with much higher prices). It is essentially due to the individual wine ratings (TWA and GWS), which are higher on average in a very good vintage than in a just good vintage. However, for 2021, the ratings are often good but rarely very high.
Efficient release prices by chateau

Notes: Release prices for vintages 2020 (EP 2020) and 2021 (EP 2021) are reported. Statistics on Efficient Price are based on the results from Specifications (I) to (IX) and assuming that the 2021 vintage is either good or very good. The reference model stands for Specification (IX), assuming the vintage is good.
Overall, considering the vintage as good, the reference model points to a price correction of 4.2% (median) compared to the vintage 2020. According to our model, release prices were too high by 2.9% (on average) to 5.2% (at the median). Our model suggests that the 2021 vintage was, on average, too expensive.Footnote 6 The most interesting statistic, however, is the standard deviation. The price variation between vintages 2020 and 2021 tends to be quite similar among the various chateaux. Our model, however, suggests much more significant differences among the chateaux. We suspect this may be due to frictions preventing many chateaux from aligning themselves with market conditions. Specifically, each chateau tends to try to match the prices of its neighbors with a similar status to avoid the risk of being seen as less qualitative (if the price is lower than their counterparts) or greedy (if the price is higher). This leads to insufficiently differentiated prices and mispricing situations.
C. Mispricing and market response
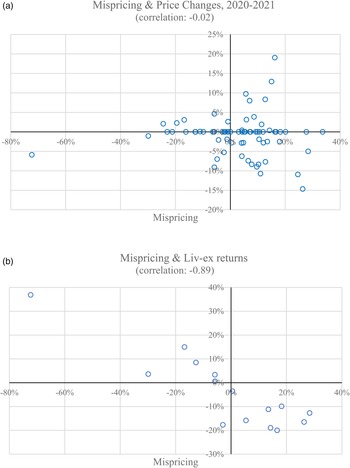
Figure 2 reports findings for the market response triggered by the mispricing of the analyzed wines. It displays correlations between the mispricing of a wine and the price change between vintages 2020 and 2021 (Panel A) and the return of the wines on the Liv-ex platform (Panel B).
Analysis of mispricing.
Notes: This figure shows the relation between mispricing (i.e., the relative difference between the effective release price and the efficient release price as estimated with our model)—on the horizontal axis—and (A) price change between vintages 2020 and 2021, and (B) returns on the Liv-ex trading platform—on the vertical axis.

There does not appear to be a linkage between the en primeur price evolution between vintages 2020 and 2021 and mispricing. Many chateaux have only slightly, if at all, changed their prices between the two vintages. This has triggered negative and positive mispricing (between –30 and 35%) as the respective chateaux have performed no price adjustment to fit the quality of the wine and the vintage. Some chateaux nevertheless increased or decreased their prices by up to 15–20%. In both cases, this has mainly led to positive mispricing of up to 30%. In the case of positive price evolutions, this may be due to chateaux that were overly confident about the demand for their product or who decided to realign prices with competitors. In the case of negative price differences, chateaux may have reacted to too high prices for vintage 2020 or a reduction in quality, but according to our model, not enough.
The linkage between mispricing and subsequent returns on the Liv-ex platform is the strongest and most clear-cut, with a correlation coefficient of –0.89. The more mispriced a wine is, the lower the return is. Apart from one exception, all wines with a positive mispricing (i.e., being too expensive) led to a negative return, and vice versa. This implies that it is essential for investors to understand which wines can be considered bargains and which are overpriced when issued. This not only has an effect on the immediate price paid but also on the subsequent return the buyer can expect to make. In the long run, this may lead to a breach of trust with customers and buyers becoming more wary of pricing in future issuances for the chateau.
V. Conclusions
This paper uses the Bordeaux wine market to examine the fixation of efficient release prices. Based on the fact that the primary and secondary markets are necessarily linked, we propose a model for estimating the price of wines on the secondary market, which we then apply to the wines released on the en primeur market. Our model includes brand value, vintage quality, ratings, and age variables. Compared to past studies on the pricing of en primeur Bordeaux wines, our model has a high explanatory power of 98% and helps to determine prices (rather than returns) for individual wines. This is due to the availability and use of more fine-grained secondary market price data for individual wines and not only an aggregate benchmark such as the Liv-ex 100.
We document that the 2021 vintage was overall too expensive and that many producers have not adjusted their prices downward enough to counter a vintage that was only of good quality. The median mispricing thus amounts to 5.2% but strongly differs for individual wines, with extremes of 73% underpricing for Carruades de Lafite or 34% overpricing for Haut-Bailly. We further show that wines released at too high prices had subsequent negative returns on the Liv-ex trading platform.
This study tackles an essential issue in the market for fine wines. With the increase in interest for fine wines, not only for consumption but also as an investable asset, and the fact that several wine regions or producers gradually turn to La Place de Bordeaux for the release of their wines, a model helping with the proper fixation of the issue price is needed. We present a model capable of doing so with high explanatory power. In this way, it is useful for all market participants. For La Place and wine producers, it allows for more robust market clearing of wine prices. For consumers, collectors, or investors, it allows obtaining efficient prices against which actual issue prices can be compared. This helps to avoid purchasing wines at inflated prices, which may hurt subsequent returns or make it worthwhile to buy physically available wines.
Hedonic pricing models have reached a certain maturity in academia (see Oczkowski and Doucouliagos (Reference Oczkowski and Doucouliagos2015) for a meta-analysis) to characterize wine prices in multiple regions. Models to estimate efficient release prices, particularly in Bordeaux, have also gained some traction in recent years and will continue to be important as the wine market develops. As in traditional financial markets, the modeling will evolve and increasingly rely on novel estimation techniques and larger datasets in terms of prices, expert scores, and increased liquidity on the secondary market. The ongoing development and increased usage of, for example, Liv-ex for secondary market data or the wine community for quality cues (Dubois, Reference Dubois2021; Oczkowski and Pawsey, Reference Oczkowski and Pawsey2019), will allow for larger datasets and ultimately favor big data approaches. Moreover, machine-learning techniques have started to be used to estimate wine quality based on attributes such as alcohol, sulfites, or acidity (Gupta, Reference Gupta2018; Koranga et al., Reference Koranga, Pandey, Joshi and Kumar2021). These methods may ultimately be extended to new data to provide more accurate price or expert score estimates.
However, the central question of the persistence of market inefficiency for young wines raised by Ashenfelter, Ashmore, and Lalonde (Reference Ashenfelter, Ashmore and Lalonde1995) remains open. This needs to be put into perspective. The dominance of Bordeaux fine wines has diminished over the past 20 years. Liv-ex statistics show that the share of Bordeaux wines in Liv-ex transactions has dropped from more than 90% in the early 2000s to less than 30% in the 2020s. This shows that buyers are turning away from Bordeaux for other regions. This could be interpreted as a sign of buyer rationality in the face of inefficient pricing. Nevertheless, this argument is insufficient, as the en primeur market continues to exist and prices continue to increase. Several explanations can be put forward to describe the persistence of this inefficiency:
• Buyers from emerging countries are increasingly numerous but remain relatively uninformed (Masset et al., Reference Masset, Weisskopf, Faye and Le Fur2016). They are very sensitive to the Veblen effect and willing to pay higher prices than mature buyers from developed countries (Cardebat and Jiao, Reference Cardebat and Jiao2018).
• The chateaux have an oligopolistic position that allows them to set higher prices than under perfect competition. In addition, the chateaux have increased their storage capacity and can better control the quantities delivered to the market and, by extension, prices.
• In the Bordeaux market, only negociants (wholesalers) may obtain allocations (purchase options) from chateaux. Once a negociant refuses to exercise his option because he feels the price is too high he will lose his option for the subsequent year. This system incentivizes negociants to exercise their option, even if they deem the price too high.
These three hypotheses help to answer some of the questions raised in the seminal paper by Ashenfelter et al. (Reference Ashenfelter, Ashmore and Lalonde1995). They could also justify the fact that the occurrence of efficient prices in the en primeur market is far from a given. It, however, remains to be tested whether they can fully explain the apparent inefficiency of the Bordeaux en primeur wine market.
Acknowledgments
We would like to thank two anonymous referees, Arnaud de la Ville, and Karl Storchmann (the editor), for their valuable and helpful suggestions.


 Open access