

Following Ukraine’s Maidan Revolution in 2014, Russian-backed separatists in Eastern Ukraine took control of cities in what came to be known as the Donetsk People’s Republic (DPR) and the Luhansk People’s Republic (LPR), significantly weakening Ukraine’s control over the Donbas region.Footnote 1 Over the next eight years, Russia systematically deepened its ties with both armed and civilian separatist forces, bolstering the region’s defenses against Ukrainian efforts to regain control. These preparations proved invaluable during the 2022 Russian invasion of Ukraine. Moscow’s cultivation of civilian organizations and efforts to manufacture popular opposition forced Kyiv to divert scarce political and material resources to manage growing instability in the region. Russian-backed separatists provided essential intelligence and logistical support to Russian forces, integrated into the Russian military command structure, destabilized Ukraine’s defenses across multiple fronts, and facilitated troop movements through the use of captured infrastructure.Footnote 2
Scholars and analysts often claim that the world has entered a new era of great-power competition.Footnote 3 The 2018 National Defense Strategy of the United States, for example, asserts that “Inter-state strategic competition, not terrorism, is now the primary concern in US national security.”Footnote 4 The 2022 National Security Strategy similarly concludes that “the post-Cold War era is definitively over and a competition is underway between the major powers to shape what comes next.”Footnote 5 As the Russia–Ukraine war illustrates, however, the nontraditional threats that defined post-Cold War global security—largely driven by the activities of politically violent nonstate actors—have not disappeared. Instead, these threats coexist alongside resurgent interstate tensions.
Modern states maintain informal transnational ties to a wide range of foreign nonstate actors, including armed groups,Footnote 6 ethnic militias,Footnote 7 opposition parties,Footnote 8 and civilian organizations and pro-democracy movements.Footnote 9 International relations scholarship has overwhelmingly focused on the downstream effects of state support for nonstate actors, especially how that support influences the trajectory of subnational conflict in other countries.Footnote 10 Research on upstream influence—that is, how a state’s support for nonstate actors affects the strategies and behaviors of the state itself—is scarce, even as we live in a time where the return of great-power competition and the expansion of powerful communication technologies suggest increased importance for transnational ties.Footnote 11
We focus on one dimension of upstream influence: how transnational ties affect competition between states. We conceptualize transnational ties in network terms as cooperative interactions between a focal government and nonstate actors in foreign countries. Both the size of a state’s transnational network and the structure of that network—that is, the extent to which a state’s ties allow it to cooperate indirectly with additional nonstate groups, beyond its immediate partners—influence that state’s interactions with other states. We argue that extensive networks of transnational ties embolden governments and encourage aggressive foreign policies while also inviting aggression by other states. We propose two mechanisms for this emboldening effect: (1) transnational networks increase a state’s capacity and bargaining leverage with respect to adversaries, and (2) transnational networks generate liabilities for states, pulling them into unwanted confrontations on behalf of their nonstate subordinates. Our central claim is that as governments expand their transnational networks, their relationships with other governments grow increasingly hostile.
We further argue that the influence of the capacity and liability mechanisms depends, in part, on a country’s existing level of conventional military capabilities. Ceteris paribus, powerful countries are less reliant on nonstate partnerships to exert influence, and they are better equipped to manage those partnerships effectively. Weaker countries, by contrast, are more likely to be emboldened by transnational ties, and they lack the resources needed to monitor their nonstate partners and mitigate principal–agent dilemmas. We show empirically that although transnational ties are always associated with increased interstate competition, that association is stronger for ties formed by weak countries. This finding suggests that when governments attempt to compensate for a lack of conventional military strength by developing nonstate partnerships, the result is an intensification of interstate competition.
A key feature of our approach is that we do not limit the analysis to specific organizations or types of nonstate actors. Rather, our theory and analysis incorporate the broad range of groups that participate in various forms of “contentious politics,” from rebels and terrorists to militants and civilian opposition movements. Scholars of political violence have increasingly emphasized the need for research that avoids reliance on arbitrary distinctions and encompasses the many forms that political violence might take.Footnote 12 This guidance is especially relevant to the current study; in their efforts to exercise transnational influence, governments routinely cooperate with a wide variety of nonstate actors. Our goal is not to conflate armed and civilian groups or ignore substantive distinctions between them. Rather, we show that, when it comes to government efforts at extending transnational influence, ties to civilian groups exacerbate interstate tensions just as readily as ties to armed groups.
The empirical analysis draws on high-resolution event data covering the period 1995–2023.Footnote 13 We implement a comprehensive measure of interstate competition—the main outcome of interest—that includes all conflictual events between governments, including verbal events like threats and demands, and material events like shows of force, sanctions, and armed attacks. By considering a wide range of conflictual interactions, we are able to assess multiple potential ways in which transnational ties impact interstate relations. A core element of our theory, and a central challenge to the identification of effects in this literature, is that transnational networks and interstate conflict coevolve as states form ties to nonstate actors in response to interstate tensions—and those ties in turn shape the trajectory of interstate competition. We thus use a multilevel network approach to explicitly model the coevolution of transnational cooperation and interstate conflict over time, which allows interstate and transnational relations to mutually influence one another.Footnote 14 We find that both the size and structure of countries’ transnational networks are positively associated with a wide range of verbal and material conflict types. In fact, transnational networks are among the most important determinants of conflict, similar in importance to such long-established influences as geographic distance and military capabilities. We further find that conventional military capabilities play an important moderating role. That is, the association between conflict and transnational ties is particularly strong for countries that are militarily weak. Overall, the results support our theoretical expectations, and they suggest that transnational networks are a central feature of competition between states.
Our research reveals both similarities and contrasts between the current global security environment and prior eras. The Cold War showed that competition between powerful states manifests at the subnational level in the form of civil wars and armed conflicts.Footnote 15 We find that, long after the Cold War, states continue to pursue their interests through transnational ties—though with greater variety in the types of states and nonstate actors involved, and with far different implications for interstate competition. Our research further shows that the distinction between today’s great-power politics and the transnational threats that dominated the post-Cold War era is blurry. Rather than fading into the background, politically violent nonstate actors play a central role in interstate competition, providing states with additional avenues of influence. While scholars and analysts are acutely aware of state–nonstate relationships, our research is the first, to our knowledge, to develop and test a generalizable theory of how these relationships affect interstate competition.
Literature Review
While the Cold War featured especially high levels of great-power support for nonstate actors in broader proxy conflicts, governments continue to foster close relationships with friendly nonstate actors operating on the territory of other countries. As Figure 1 illustrates, mean levels of cooperation between states and foreign nonstate actors have remained consistently high since the early 2000s. On average, around 80 percent of governments have cooperative ties to at least one foreign nonstate group. And although governments support slightly fewer numbers of groups, on average, than in the mid 2000s (Figure 1b), governments continue to cooperate with those groups at high levels (Figure 1c).
Mean levels of transnational cooperation between governments and foreign nonstate actors
Notes: (a) Percentage of governments with ties to at least one nonstate actor. (b) Mean number of nonstate partners per government. (c) Mean number of cooperative state–nonstate interactions per government. Data from Boschee et al. Reference Boschee, Lautenschlager, O’Brien, Shellman, Starz and Ward2015.

Figure 1 Long description
The image contains three line graphs side by side, each representing different aspects of transnational cooperation between governments and foreign nonstate actors from 1999 to 2022. The first graph on the left shows the percentage of governments with transnational ties, with the y-axis ranging from 50 to 90 percent. The line starts around 60 percent in 1999, rises sharply to around 80 percent by 2005, and fluctuates between 70 and 90 percent thereafter. The second graph in the middle displays the number of nonstate partners, with the y-axis ranging from 2 to 7. The line begins at 2 in 1999, climbs steadily to a peak of around 6.5 by 2007, and then shows a gradual decline with some fluctuations, ending around 4.5 in 2022. The third graph on the right illustrates the number of transnational ties, with the y-axis ranging from 0 to 50. The line starts at 0 in 1999, rises sharply to around 40 by 2005, peaks at 50 around 2010, and then declines with some fluctuations, ending around 30 in 2022. All values are approximated.
Research on cooperation between governments and transnational actors is fragmented across studies of state-sponsored terrorism, intervention in civil wars, external support for insurgents, and similar literatures.Footnote 16 Because we wish to develop a generalizable theory on the interstate effects of state–nonstate cooperation, and because the distinctions between nonstate groups are often blurry,Footnote 17 we focus here on themes that span these literatures.
The most salient question is why states choose to support foreign nonstate actors in the first place.Footnote 18 Scholars agree that interstate rivalry, however construed, is a primary motivator.Footnote 19 Weak and strong states alike foster relationships with nonstate actors in rival states they wish to subvert.Footnote 20 For militarily weak states, providing material support to proxy actors is often an effective means of targeting adversaries.Footnote 21 And for powerful states, reliance on nonstate actors may be more cost effective than traditional military confrontations and less likely to result in unwanted crisis escalation.Footnote 22
Scholars have also examined whether common ethnicity, religion, ideology, and other shared attributes encourage cooperation between governments and nonstate groups.Footnote 23 While such attributes may influence a government’s decision regarding whom to cooperate with, they do not obviously influence the initial choice to support nonstate groups, and they are generally of lesser importance than strategic competition.Footnote 24 Much cooperation occurs without religious, ethnic, ideological or other substantive affinities, and in some cases cooperation occurs among ideological opposites.Footnote 25
Government support for nonstate actors often follows a deterrence logic, with a focus on increasing the government’s capabilities—and thus strengthening its bargaining position—relative to adversaries.Footnote 26 Governments also use nonstate actors to pursue revisionist goals, such as destabilizing a target regime, extracting concessions, and weakening state authority across swaths of the target’s territory.Footnote 27 In a game-theoretic analysis, Qiu finds that the primary motivation of governments in supporting nonstate armed groups is to compel targeted states to expend resources on internal security, thus creating opportunities to exercise influence over weakened adversaries.Footnote 28
Across these literatures, scholars draw heavily on principal–agent analysis, where nonstate groups act as agents on behalf of a sponsor state.Footnote 29 The principal–agent framework clarifies the principal’s incentive to delegate to an agent tasks that the principal lacks the means or willingness to perform itself.Footnote 30 Principal–agent models further clarify the nuances of state–nonstate partnerships, such as the potential for agency loss, where agents deviate from the intended behaviors and goals of the principal,Footnote 31 and they provide insight into how governments can use screening, monitoring, sanctions, and other mechanisms to select reliable nonstate partners and mitigate reckless behaviors.Footnote 32 Later, we build on these insights to explore the unintended consequences of transnational support, as well as government efforts to avoid those consequences.
Three limitations of the current literature are notable. First, despite widespread agreement that support for nonstate groups is tied to interstate rivalry, there is little systematic research on the upstream effects of transnational ties on conflict between states. Most research addresses the opposite relationship, such as the effect of rivalry on terror attacks.Footnote 33 Civil wars increase the risk of militarized interstate disputes, and this increased risk is linked to such factors as external support for rebel groups.Footnote 34 Game-theoretic models have shown that state support for militants can elicit concessions from adversaries,Footnote 35 that provision of “safe havens” to terrorist groups encourages governments to share information in order to eradicate those groups,Footnote 36 and that support for rebel groups creates commitment problems in interstate bargaining.Footnote 37 However, these studies limit their analysis to narrow strategic settings, such as civil war in neighboring states, and do not consider the more general phenomenon of transnational support for nonstate actors. A study by Maoz and San-Akca, which finds preliminary evidence that support for nonstate armed groups increases the odds of militarized interstate disputes (MIDs) due to retaliation by targeted states, is perhaps closest in spirit to the research conducted here.Footnote 38
Second, current literature does not pay sufficient attention to cooperative ties between nonstate groups themselves, or how those ties matter for interstate relations. Alliances are extraordinarily common among terrorist organizations, insurgents, rebel groups, and other armed groups.Footnote 39 Intergroup networks are also essential to social movements, anti-government protests, spontaneous collective action, and other more decentralized forms of “contentious politics.”Footnote 40 Yet scholars have not considered the possibility that a government’s ability to extend influence via nonstate partnerships may depend on the ties of those partners themselves. We later show that the “connectedness” of nonstate partners amplifies a government’s ability to project influence.
Third, the fragmentation of this research into separate literatures on terrorism, rebels, insurgencies, and other armed groups has limited the ability of scholars to develop and test generalized theories of political violence. States do not restrict their transnational support only to terrorists and rebels; they support a wide range of opposition groups.Footnote 41 For example, US agencies provided significant financial and organizational support to Serbian opposition parties and civic groups during the 2000 election in a bid to mobilize resistance against Slobodan Milosevic.Footnote 42 External support has long played a role in the politics of social movements.Footnote 43 Even support for nonviolent resistance movements may presage political violence.Footnote 44 Our emphasis on contentious nonstate actors, regardless of designation, responds to the growing call among scholars to conduct research that encompasses political violence as a phenomenon,Footnote 45 and to avoid over-reliance on “poorly demarcated, constantly contested” conceptual boundaries.Footnote 46 Our theory’s purview includes all politically contentious groups—that is, groups capable of targeting a foreign government—irrespective of organizational form, tactics, motivations, or territorial control.Footnote 47 This comprehensive approach should not be taken to mean that there are no important distinctions between these groups. Rather, we wish to uncover mechanisms of influence that apply broadly to government efforts at building out transnational networks, irrespective of the precise composition of those networks. The theoretical framework we develop later is intended to be generalizable across a wide range of group types.
A Theory of Transnational Networks and Interstate Competition
We define transnational ties as cooperative interactions between the government of one state and nonstate actors in one or more other states.Footnote 48 The nature of these ties varies. We focus on material forms of cooperation, which include military and economic support, sharing of intelligence or information, provision of aid, and similar activities. The identity of nonstate actors also varies. Consistent with our goal of developing a general theoretical framework, we examine both armed organizations and civilian organizations. Armed organizations are nonstate militarized groups, such as rebel movements, terrorist organizations, and militias.Footnote 49 Civilian organizations are not overtly militarized but are nonetheless involved in contentious politics—and may in some circumstances resort to political violence. Examples include opposition parties, social movements, religious organizations, and organized anti-government protesters.Footnote 50 See Appendix A.1 for cooperation event codes and included groups.
Our theory and empirical analysis include both armed organizations and civilian organizations for three reasons. First, the boundary between armed groups and civilians is often opaque, as when anti-government opposition movements turn to terrorism,Footnote 51 or when large-scale civilian protests evolve into civil war.Footnote 52 Further, armed groups and civilian groups often support one another’s activities, as with “political wings” of militant organizations. Second, governments frequently attempt to exercise influence through both types of groups. In countries that have no active armed groups, for example, foreign governments may instead pursue influence by supporting civilian opposition movements.Footnote 53 During Kyrgyzstan’s Tulip Revolution, for instance, the United States provided support to opposition print and TV media outlets in an effort to sustain the nonviolent protests that would ultimately force President Askar Akayev from office.Footnote 54 Third, and most importantly, the mechanisms we detail later are not unique to armed groups. Theories of conflict do sometimes necessitate analysis of specific groups—for example, a theory about territorial control may be limited to rebels. By contrast, our theory examines how governments respond to other governments’ attempts at extending transnational influence. In this context, external support for civilian groups affects foreign policy, and may exacerbate interstate tensions, just as readily as support for armed groups.Footnote 55 Put differently, the overall prevalence of a government’s ties to nonstate actors is more relevant to explaining interstate competition than are the identities of individual actors. Accordingly, our theory encompasses the complete set of transnational ties to contentious nonstate actors for all states. We show in Appendix A.7 that the empirical results remain stable even when we drop specific types of groups from the analysis.
Drawing on network theory, we conceptualize cooperative ties between governments and foreign nonstate actors as a transnational network. Figure 2 provides a snapshot of the full network. The graph reveals that most governments cooperate with at least a few foreign groups. And while governments cooperate at generally higher levels with civilian groups, they also cooperate extensively with armed groups. Further, there are extensive intergroup ties. Armed groups cooperate with other armed groups; civilian groups cooperate with other civilian groups; and armed groups and civilian groups cooperate with one another.
Illustration of the transnational cooperation network
Notes: Nodes are governments and nonstate actors. Edges are instances of material cooperation. Data from Boschee et al. Reference Boschee, Lautenschlager, O’Brien, Shellman, Starz and Ward2015, using year 2023 values. Excludes OTH nodes and ties between governments.

Figure 2 Long description
A Venn diagram illustrates the transnational cooperation network among governments, armed groups, and civilian groups. The diagram features three intersecting circles, each representing one of the groups. The green circle on the left represents governments, the blue circle on the right represents civilian groups, and the red circle at the bottom represents armed groups. The intersections of these circles show the cooperative relationships between these groups. The overlapping areas indicate the level of cooperation between the different groups, with varying densities of lines representing the intensity of these interactions. The diagram visually conveys the complexity and interconnectedness of transnational cooperation.
Within this larger network, each government in turn has a unique local network or ego-network comprised of the ties between that focal government and its immediate or “first degree” nonstate partners, as illustrated in Figure 3. Ego-networks vary substantially in size. During the bipolarity of the Cold War, for example, the superpowers maintained large local networks of rebel groups and political movements to advance their strategic interests.Footnote 56 Hegemons, too, rely on extensive network ties to create and maintain international order.Footnote 57 By contrast, countries with more modest or regionally focused ambitions are likely to foster fewer ties to nonstate actors. The tendency for wars in Africa to take place “across” rather than between countries is a salient example of this dynamic, where African states use active transnational network ties to intervene in their neighbors’ affairs.Footnote 58
Illustrative ego-networks of China, Russia, and the United States at three time points
Notes: Purple nodes are nonstate actors—that is, armed groups and civilian groups—in foreign countries. Thick lines are state–nonstate cooperative ties. Thin lines are nonstate–nonstate cooperative ties. Data from Boschee et al. Reference Boschee, Lautenschlager, O’Brien, Shellman, Starz and Ward2015.

Figure 3 Long description
The image displays three sets of ego-networks for China, Russia, and the United States, each shown at three different time points: 2000, 2010, and 2020. Each network is represented by a central node labeled with the country's abbreviation (CHN for China, RUS for Russia, and USA for the United States) and connected to various other nodes through lines. These lines represent the ties or connections between the focal country and its immediate nonstate partners. The networks for each country show an increase in complexity and the number of connections over time, indicating a growth in the number of partners and interactions.
We define interstate competition as adversarial interactions between governments, whether verbal or material, involving efforts to influence, pressure, constrain, or coerce one another.Footnote 59 Consistent with the literature discussed earlier, we assume that governments form cooperative ties with foreign nonstate actors primarily to extend influence. This assumption implies that transnational networks are, at least in part, endogenous to interstate competition. That is, as competition intensifies, governments have an incentive to extend their capabilities by recruiting nonstate proxies. Thus while we are primarily interested in how transnational ties influence interstate competition, we also acknowledge the existence of a reverse relationship. We refer to this mutual endogeneity between interstate competition and transnational ties as coevolution. While coevolution raises unique methodological dilemmas, we show later that it also has important theoretical implications; the process by which states select nonstate partners determines, in part, the influence of those partners on interstate relations.
The possibility that transnational ties can increase interstate conflict is not obvious. Governments prefer to achieve their goals, and extract concessions from rivals, with as little resistance as possible. Indeed, as noted earlier, governments often turn to nonstate proxies in order to avoid state-to-state confrontations.Footnote 60 And while the pursuit of state interests often requires aggressive strategies, such as threats, demands, sanctions, and mobilizations, states typically use these strategies to intimidate targets rather than provoke retaliation.Footnote 61 States especially wish to avoid becoming targets of aggression by others. Yet as with most realms of international relations, interstate competition is an information-scarce strategic environment, and mistakes are common.Footnote 62 Against this strategic backdrop, transnational networks can intensify interstate competition in two ways. First, transnational ties unilaterally increase the sponsor state’s capacity, which emboldens the sponsor to adopt more aggressive policies. Second, the principal–agent aspects of transnational ties increase a sponsor’s liability for the actions of its nonstate partners, which pulls sponsors into unwanted confrontations with other governments. Both capacity and liability also invite preemptive or retaliatory aggression by adversaries.
In developing these mechanisms, we focus on two aspects of transnational ties: (1) the size of a government’s ego-network, or the number of foreign nonstate actors it cooperates with directly, and (2) the overall structure of the government’s ties, defined by whether the government’s nonstate partners themselves have cooperative ties to additional nonstate actors. We argue that size and structure work through the capacity and liability mechanisms to increase conflict between states. We first develop the argument with regard to ego-network size, and we then expand the discussion to network structure.
Capacity
A large ego-network of transnational partnerships increases a state’s capabilities relative to other states. Partnerships with subnational actors are force multipliers.Footnote 63 Supporting terrorists or other extremists is generally cheaper than using conventional force.Footnote 64 Nonstate actors are often willing to engage in illicit activities, such as assassinations and terror attacks, that would attract international scrutiny and condemnation if conducted by traditional militaries.Footnote 65 Further, armed groups in foreign countries have privileged access to the host country’s territory, as well as “local knowledge” of terrain, geography, political dynamics, and military capabilities.Footnote 66 Transnational ties to civilian groups also improve capacity. Support for anti-government protesters or opposition parties can influence or undermine target governments.Footnote 67 One such example is the extensive verbal and material support provided by Western democracies to protesters during Ukraine’s Orange Revolution, which strengthened mass demonstrations against fraudulent election results and helped sustain pressure for a repeat runoff, in which Viktor Yushchenko, a Western-oriented leader, prevailed.Footnote 68 That Western support for protesters created tensions with Russia, which viewed countries like the United States as meddling in its sphere of influence, illustrates how transnational networks can worsen interstate relations.
Transnational ties also erode the capacity of other governments. Depleting an opponent’s resources is often the core motivation behind supporting proxy groups.Footnote 69 Armed groups may attack military, infrastructure, or civilian targets.Footnote 70 Even without direct attacks, the political instability generated by contentious groups may require governments to shift expenditures to internal security and away from foreign affairs.Footnote 71 And both armed and civilian groups may be able to extract policy concessions that weaken the target government relative to adversaries.Footnote 72
As a government’s transnational ego-network increases in size, its relative capabilities increase accordingly. Qiu observes that “the fundamental reason that states support rebel groups is to weaken the international opponents and gain bargaining leverage against rival regimes.”Footnote 73 This leverage creates opportunities for the focal state to target adversaries more aggressively,Footnote 74 much as increases in conventional military capabilities embolden states to make tougher demands and pursue more assertive policies.Footnote 75 Increased aggression may take the form of threats, demands, rejections of proposed deals, or other forms of “verbal conflict.”Footnote 76 Or it may involve “material” forms of conflict, such as mobilization of military resources, expulsion of diplomats, imposition of sanctions, or direct intervention. Governments with large transnational networks are more likely to act aggressively toward other governments not only in their words, but also in their actions.Footnote 77
Shifts in power driven by transnational ties may also increase the aggressiveness of adversaries. That is, in addition to initiating more conflict, governments with large ego-networks are also more likely to be targeted by other governments. The logic here is similar to commitment problems in interstate bargaining. An anticipated shift in the status quo distribution of power—in this case, resulting from support for nonstate actors—encourages an adversary to act preemptively.Footnote 78 In an example of how small-scale terrorist activities can lead to macro-level power shifts that incentivize aggressive preemption, Bapat argues that the 1998 Kargil War was in part a response by India to perceived Pakistani support of militants in Kashmir, which had gradually eroded India’s territorial control.Footnote 79 Such measures are essentially a form of deterrence aimed at government sponsors of nonstate actors,Footnote 80 driven by the belief that while extremist groups themselves may be difficult to confront, “state sponsors are deterrable.”Footnote 81
Liability
We also anticipate that transnational networks increase interstate conflict by pulling state sponsors into confrontations with their adversaries. In this liability mechanism, the sponsoring state’s transnational ties become (unintended) obligations that the state must fulfill. Although delegation is often meant to avoid direct interstate conflict, principal–agent models show that delegation may in fact have the opposite effect.Footnote 82 Principals often have little control over the agents they support, and those agents in turn may have their own agendas and interests.
Liability takes a variety of forms. One risk is that an errant agent may escalate a crisis to the point that the principal feels compelled to intervene. For example, Syria’s sponsorship of Palestinian guerrillas precipitated an escalating crisis that eventually culminated in the Six Day War, which Syria lost badly. Subsequently, the Syrian government avoided supporting groups that might escalate a crisis and “force Damascus into a damaging confrontation with its stronger neighbor.”Footnote 83 Alternatively, agents may fail to accomplish their objectives or face unexpected challenges, prompting the principal to step in and expose itself to confrontation. Consider prerevolution Iran. Ahead of parliamentary elections in 1952, the United States and United Kingdom attempted to keep Prime Minister Mohammad Mosaddegh from returning to power by funneling support to a multitude of civilian opposition groups, including conservative clerical organizations, activist merchants, and eighteen opposition candidates. This strategy ultimately failed, as Mosaddegh suspended elections and later dissolved parliament. The United States responded to the underperformance of its agents by escalating its commitment, working directly with pro-Shah military factions to coordinate the coup that ultimately deposed Mosaddegh.Footnote 84
Liability also involves strategic pushback by adversaries. As Berkowitz observes, “delegation can also result in costs outside of the sponsorship relationship, including retaliation by targeted states and international condemnation.”Footnote 85 Even when sponsoring governments attempt to conceal their ties to nonstate actors, other states are often aware of these connections,Footnote 86 which means that targeted countries may attempt to hold a government accountable for the activities of nonstate proxies.Footnote 87 Along similar lines, Schultz argues that states in a dispute may not be able to reach a negotiated settlement if one or both sides cannot credibly commit to halting support for extremists.Footnote 88 The perception of liability increases the odds that governments with extensive transnational networks will find themselves targeted by other countries.
Capacity and liability work in concert. Consider the lead-up to the Iran–Iraq War. The new Islamic regime in Tehran supported multiple armed and civilian groups in Iraq, including Kurdish separatists and the Shia Islamist Dawa party.Footnote 89 These actions were clear attempts to destabilize the Ba’athist regime and promote a revolutionary ideology, and they raised Iraqi government concerns of reduced capacity and territorial losses.Footnote 90 Iraq’s ultimate invasion of Iran in late 1980 was motivated in part by a desire to hold Iran accountable for perceived interference in Iraq’s internal affairs, arrest the spread of Islamist revolutionary ideals, and deter further support for nonstate groups.Footnote 91
This discussion yields the following hypotheses:
H1 The larger a government’s transnational ego-network, the more likely it is to initiate verbal and material conflict with other countries.
H2 The larger a government’s transnational ego-network, the more likely it is to be targeted by verbal and material conflict from other countries.
Network Structure
The earlier arguments focus on the size of a government’s transnational ego-network. But networks take many forms. We anticipate that the structure of transnational network ties also affects conflict behavior. Network structure influences a broad range of social outcomes, including the diffusion of innovations,Footnote 92 achievement of policy goals,Footnote 93 and the robustness of networks to targeted attacks.Footnote 94 Although many scholars have noted the network-like characteristics of state–nonstate ties,Footnote 95 the practical implications of network structure remain unexplored.
We focus on aspects of network structure that enable governments to extend influence beyond even their immediate nonstate partners. We thus examine each government’s broader set of ties across the global transnational network, not limited to their respective ego-networks. The goal is to identify the full extent of each government’s “reach” within the international system. To meet this challenge, we draw on closeness centrality,Footnote 96 a classical network concept that reflects an actor’s proximity to all other actors in a defined social system. Network scholars have shown that high-closeness actors are able to spread information more efficiently, form ties more readily, and exercise increased influence over third parties.Footnote 97 In international relations, Kinne uses closeness centrality to measure economic embeddedness in trade networks,Footnote 98 and Beardsley and colleagues use a similar concept to assess hierarchical influence in security communities.Footnote 99
Figure 4 illustrates closeness by mapping Iran’s transnational network at increasing degrees of separation. If Iran’s nonstate partners were exclusively connected to Iran and had no other partners (Figure 4a), Iran’s overall closeness centrality within the broader international system would be low. However, expanding the analysis to include second-degree and third-degree connections (Figures 4b and 4c) reveals that Iran’s immediate partners are themselves linked to numerous other nonstate actors. These indirect ties give Iran access to large numbers of additional groups through the activities of its immediate partners, potentially expanding the Iranian government’s global influence. Limiting our analysis only to Iran’s immediate ties ignores this potential source of influence.
Illustration of Iran’s cooperation with nonstate actors
Notes: Central node is Iran. Remaining nodes are foreign nonstate actors. Ties represent material cooperation. (a) Includes only immediate or first-degree ties. (b) Includes second-degree ties, or the ties of Iran’s immediate partners. (c) Includes third-degree ties, or the ties of the partners of Iran’s immediate partners. For legibility, graph includes only a subset of Iran’s overall transnational network. Data from Boschee et al. Reference Boschee, Lautenschlager, O’Brien, Shellman, Starz and Ward2015, using the last three quarters of 2019.

Figure 4 Long description
The image contains three diagrams labeled (a), (b), and (c), illustrating Iran's cooperation with nonstate actors at different degrees of connection. Diagram (a) shows only first-degree ties, with a central blue node representing the Iran government connected to several purple nodes representing first-degree ties. Diagram (b) includes second-degree ties, with the central blue node connected to purple nodes, which are further connected to pink nodes representing second-degree ties. Diagram (c) extends to third-degree ties, with the central blue node connected to purple nodes, which are connected to pink nodes, which are further connected to orange nodes representing third-degree ties. Each diagram visually represents the expanding network of connections from the Iran government to various degrees of nonstate actors.
Indirect ties to foreign nonstate actors extend a government’s influence in at least two ways. First, even when a government delegates tasks to nonstate partners, those partners often further delegate tasks to other actors. A government’s ability to project influence thus depends, in part, on whether transnational partners have their own capacity for delegation. Second, indirect linkages amplify problems of agency loss. As the principal grows more distant from those agents ultimately responsible for carrying out the principal’s designated tasks, the principal’s ability to influence its agents declines. In a study of terrorist networks, for example, Abrahms and colleagues find that agency problems lead affiliated groups to engage in more attacks on civilians than parent groups.Footnote 100
These two factors—indirect delegation and agency loss—compound one another. As a government’s closeness to nonstate actors increases, that government should find that it has an increased capacity for achieving its interests, which leads to emboldening and increased aggression. At the same time, the agency loss associated with indirectly connected groups increases the risk of liability-based confrontations. When intermediaries exist between a principal and the agents ultimately responsible for carrying out the principal’s tasks, monitoring agent performance becomes more difficult, and the potential for a divergence in preferences between principal and agents increases.Footnote 101 Closeness centrality thus amplifies both the capacity and the liability mechanisms, further provoking interstate conflict.
Iran’s efforts to maintain a network of closely connected nonstate partners illustrates this point. As a matter of policy, the Iranian government encourages cooperation among nonstate groups.Footnote 102 In an in-depth analysis of what they call the “Iran threat network,” Tabatabai and colleagues argue that “ITN is not simply a hub-and-spoke system with Iran in the center;” rather, Iran’s nonstate partners act as “conduit[s] between Iran and other groups.”Footnote 103 By far the most active of these partners is Lebanese Hezbollah. Within Iran’s larger network, Hezbollah acts as an intermediary that manages and mentors nonstate groups on Tehran’s behalf.Footnote 104 Hezbollah has provided some form of training, weapons, and/or financial support to Shia militias in Iraq,Footnote 105 pro-government forces in Syria,Footnote 106 and Houthi rebels in Yemen.Footnote 107
While Hezbollah retains a high profile, it is not unique in its efforts to develop cooperative ties that redound to Iran’s benefit. As Tabatabai and colleagues observe, “Tehran does not seek to establish relationships it controls entirely and cultivate groups that are completely reliant upon it. Instead, it encourages its partners and proxies to cooperate with each other to advance their own and Iran’s objectives.”Footnote 108 In 2014, for example, when “popular mobilization forces” (PMFs) emerged in Iraq as a paramilitary response to ISIS violence, Iran quickly moved to sponsor select PMFs—which it then encouraged, in turn, to recruit and support local affiliates. The goal was to “expand [Iran’s] influence into geographic areas where neither Iran nor its close Shia allies previously had reach.”Footnote 109
The general strategy of partnering with nonstate groups that cultivate ties to other groups is not limited to Iran.Footnote 110 During Nicaragua’s Contra War in the 1980s, US support for the Fuerza Democrática Nicaragüense (FDN) was driven, in part, by the perception that FDN was capable of building cooperation among disparate anti-government forces. For example, US officials encouraged the FDN to cooperate with Miskito militias in coordinated attacks against Sandinistas. Pakistan has also long benefited from the Haqqani Network’s extensive ties to tribal militias in southern Afghanistan, which allow the Pakistani government to extend its influence to the local level.Footnote 111 And Turkey’s cooperation with the Free Syrian Army—now the Syrian National Army—has allowed the Turkish government to leverage SNA’s ties to Turkmen militias, anti-PKK Kurdish groups, foreign mercenaries, and numerous other militants to destabilize the Syrian government and establish a buffer zone in northern Syria. Governments also rely on civilian organizations to expand their networks. For instance, Russia’s Russkiy Mir Foundation promotes Russian culture and nationalism abroad as part of the government’s effort to project soft power and strengthen ties between diaspora communities and organizations.Footnote 112
This earlier discussion leads to the following hypotheses:
H3 The greater a government’s closeness centrality in the transnational network, the more likely it is to initiate verbal and material conflict with other countries.
H4 The greater a government’s closeness centrality in the transnational network, the more likely it is to be targeted by verbal and material conflict from other countries.
Transnational Networks and Conventional Military Power
We expect that transnational network ties are associated with increased conflict propensity for all countries. However, the principal–agent logic of our theory implies that the magnitude of this association may be stronger for some countries than others. Governments strategically choose their partners, and they are acutely aware of “adverse selection” problems like agency loss. Governments must select partners that are aligned with their interests and willing to act in support of those interests, and they must avoid partners that are likely to act unilaterally, escalate crises unnecessarily, or otherwise shirk on their responsibilities.Footnote 113 We anticipate that the conflict-inducing influence of transnational network ties is weaker for countries with high levels of conventional military capabilities—as reflected, for example, by number of military personnel and defense expenditures—and stronger for less powerful countries. For both the liability and capacity mechanisms, powerful countries are less susceptible to the aspects of transnational networks that promulgate conflict, while weaker countries are especially vulnerable to those influences. We anticipate a negative interaction between transnational networks and military capabilities for two reasons.
First, powerful states are more likely to have the resources needed to minimize adverse selection problems. Powerful states command superior intelligence, reconnaissance, and diplomatic resources, as well as cross-national monitoring and information-sharing partnerships, which allow these countries to screen potential proxies and select groups that are ideologically aligned, competent, and disciplined.Footnote 114 Further, powerful countries have greater resources for increasing the capacity of those groups they choose to support, including in-country training, embedded advisors and intelligence officers, and weapons. At the same time, powerful countries are better equipped to monitor nonstate partners for compliance with the sponsor’s objectives, and they are able to selectively control weapons and financing to influence agent behavior. For these reasons, the liability mechanism is likely to be attenuated for powerful countries and amplified for weaker countries.
In Nicaragua, for example, US intelligence assessments indicated that some anti-Sandinista groups, such as Edén Pastora’s ARDE, would be difficult to control, which led the United States to instead support the FDN. That support included extensive training programs and financial support, as well as threats to suspend support in the event of human rights abuses. Such tactics are not limited to armed groups. When supporting civilian opposition movements, governments similarly attempt to select proxies in a way that minimizes agency loss. Throughout the Cold War, the USSR used its extensive global resources to locate and support Marxist opposition movements that were disciplined, well organized, and unlikely to drag their external sponsor into unwanted conflict.Footnote 115
Second, the capacity-enhancing effects of transnational network ties should be weaker for powerful states than for weaker ones. We argued that governments cultivate ties to nonstate groups in part to increase their bargaining leverage against adversaries. Increased capacity shifts the bargaining range and emboldens a government to make more aggressive demands.Footnote 116 From the perspective of commitment problems, a relatively large increase in power is more likely to attract attention from adversaries and invite preventive actions.Footnote 117
Consider Libya in the 1970s, which lacked conventional military strength but built transnational ties to the Irish Republican Army (IRA), the Abu Nidal Organization, and various African insurgencies. The growth of this network attracted global scrutiny and emboldened Qaddafi to adopt a more confrontational foreign policy posture, ultimately resulting in numerous direct military clashes between Libya and Western governments. All else equal, the capacity mechanism should be more sensitive to the transnational network ties of weak states than powerful states.
We thus expect military capabilities to moderate the relationship between transnational ties and conflict, such that transnational ties increase conflict more for weak states than powerful states. As with the liability and capacity mechanisms more generally, this interactive relationship is relevant for both initiation and targeting. A weak sponsor state that has difficulty constraining its nonstate partners may be forced to initiate conflicts on behalf of reckless proxies, or that sponsor may find itself targeted by adversaries eager to assign blame. Similarly, a weak state that expands its transnational network may become more aggressive, or its increased capacity may invite pre-emptive actions by others.
The principal–agent logic of our theory further implies that this moderating effect should be stronger for ego-network size and weaker for closeness. The reason is straightforward and mainly involves the liability mechanism. As discussed earlier, social distance between principals and agents amplifies problems of agency loss. Although powerful governments are better equipped to select and discipline their nonstate partners, that advantage is largely limited to direct partnerships. The agency dilemmas posed by indirect partners are numerous. Governments exercise substantial discretion in selecting their direct partners, but that discretion typically does not extend to selecting partners of partners. Governments also cannot easily monitor the actions of indirect partners or impose sanctions for shirking. Consequently, even powerful governments will find it difficult to prevent agency loss and underperformance by partners of partners. Civil wars often exhibit this problem. In Syria, for example, powerful external governments funneled material support to a select number of prominent groups. Those groups, in turn, operated through a fragmented ecosystem of smaller, often poorly organized and ideologically extreme groups, with results that routinely conflicted with the sponsor states’ respective strategic interests.
This discussion yields two additional hypotheses:
H5 The influence of transnational network ties on conflict initiation and targeting is stronger for weak states than for powerful states.
H6 The interaction between military capabilities and transnational network ties is stronger for ego-network size than for closeness centrality.
Research Design
To test our hypotheses, we use data from the Integrated Crisis Early Warning System (ICEWS), covering the years 1995 to 2023.Footnote 118 ICEWS offers three benefits. First, it includes data on governments and various types of armed groups and civilian groups. This breadth is essential in measuring the full extent of governments’ respective transnational ties. Second, ICEWS data are collected at the daily level, which allows us to model cooperation–conflict dynamics in high temporal resolution. Third, ICEWS includes approximately 300 unique types of conflictual and cooperative interactions. We are thus able to derive data on many different types of interstate competition and transnational cooperation.
Following the CAMEO event data ontology, ICEWS categorizes conflict events as either verbal (for example, threats, demands, ultimatums) or material (for example, mobilizations, sanctions, armed attacks). Our operationalization of interstate competition uses both verbal and material events. Our theory considers how transnational ties exacerbate tensions between states, increase hostility, and intensify interstate competition. Neither the capacity nor liability mechanism is limited to militarized conflict. Analysis of verbal conflict alongside material conflict thus serves as a plausibility check. If our arguments are correct, then we should observe similar patterns for both types of conflict.Footnote 119 Further, at a practical level, the distinction between verbal and material conflict in standard event-data ontologies is blurry. While many events are clearly verbal (for example, threats) and others are clearly material (for example, armed attacks), some events do not fall cleanly into either category.Footnote 120 For example, the act of severing diplomatic relations can consist of either a simple public statement or a large-scale operation involving embassy closures and evacuation of personnel. Including the full range of event types in our analysis ensures that the empirical results are not overly sensitive to arbitrary thresholds.
Using the ICEWS data, we generate two networks. The interstate conflict network, denoted ${\bf{g}}$
, is defined as a
${\bf{g}}$
, is defined as a $1 \ldots T$
stack of asymmetric, binary matrices of dimensions
$1 \ldots T$
stack of asymmetric, binary matrices of dimensions ${n_g} \times {n_g}$
, where
${n_g} \times {n_g}$
, where $T$
is an arbitrary number of time periods and
$T$
is an arbitrary number of time periods and ${n_g}$
is the number of active governments in the system. A given
${n_g}$
is the number of active governments in the system. A given ${g_{ij,t}} = 1$
matrix entry indicates that government
${g_{ij,t}} = 1$
matrix entry indicates that government $i$
initiated some form of conflict, either verbal or material, against government
$i$
initiated some form of conflict, either verbal or material, against government $j$
in period
$j$
in period $t$
. Interstate conflict ties are directed,
$t$
. Interstate conflict ties are directed, ${g_{ij,t}} \ne {g_{ji,t}}$
. The formation of new ties in this network reflects an increase in interstate competition, which is our main outcome of interest. (See Appendix A.1 for the list of included conflict event types.)
${g_{ij,t}} \ne {g_{ji,t}}$
. The formation of new ties in this network reflects an increase in interstate competition, which is our main outcome of interest. (See Appendix A.1 for the list of included conflict event types.)
The transnational cooperation network consists of cooperative ties between governments and foreign nonstate actors, and between nonstate actors themselves. Foreign nonstate actors include both armed organizations and civilian organizations. Armed organizations include rebel movements, militias, and terrorist organizations, while civilian organizations includes formal opposition parties, organized opposition movements and social movements, and spontaneous protest actions, among others. To identify these actors, we draw on CAMEO’s actor ontology, focusing exclusively on ICEWS actors with the CAMEO codes listed in Appendix A.1. We show in Appendix A.7 that the main results hold even if we exclude civilian or armed groups from the analysis.
We define the transnational network separately for each $i$
focal government, such that
$i$
focal government, such that ${{\bf{m}}_i}$
is a
${{\bf{m}}_i}$
is a $1 \ldots T$
stack of asymmetric, valued matrices of dimensions
$1 \ldots T$
stack of asymmetric, valued matrices of dimensions ${n_{m,i}} \times {n_{m,i}}$
, where
${n_{m,i}} \times {n_{m,i}}$
, where ${n_{m,i}}$
is equal to the
${n_{m,i}}$
is equal to the $i$
government plus the number of foreign nonstate actors active in the international system in periods
$i$
government plus the number of foreign nonstate actors active in the international system in periods $1 \ldots T$
. Matrix entries
$1 \ldots T$
. Matrix entries ${m_{ik,t}}$
take on integer values that indicate the number of cooperative material interactions initiated or maintained by
${m_{ik,t}}$
take on integer values that indicate the number of cooperative material interactions initiated or maintained by $i$
toward nonstate actor
$i$
toward nonstate actor $k$
in the time periods
$k$
in the time periods $t - 3$
through
$t - 3$
through $t$
, while entries
$t$
, while entries ${m_{kl,t}}$
indicate the number of cooperative interactions between nonstate actors
${m_{kl,t}}$
indicate the number of cooperative interactions between nonstate actors $k$
and
$k$
and $l$
.
$l$
.
In deriving measures of transnational network size and structure, we incorporate the entirety of each government’s ties to nonstate actors—that is, rather than defining those ties differently for each dyad—because the influence of transnational networks is not limited to dyadic relationships. For example, consider interstate competition between the United States and Iran. If, for the sake of the US–Iran dyad, we defined Iran’s transnational network only in terms of Iran’s support for groups active in US territory, our analysis would ignore how Iran’s support for groups in Iraq, Israel, Syria, Yemen, and elsewhere influences US actions toward Iran. Our theory requires comprehensive measures of transnational ties.
We define the size of government $i$
’s ego-network at time
$i$
’s ego-network at time $t$
in terms of
$t$
in terms of $i$
’s immediate or first-degree neighbors,
$i$
’s immediate or first-degree neighbors,
 $${\rm{Transnational\ ego}} {-} {\rm{network\ size\ (i,t)}} = \sum\limits_{k \ne i}^{{n_{m,i}}} I\{ {m_{ik,t}} + {m_{ki,t}} \gt 0\} ,$$
where $I\{ {m_{ik}} + {m_{ki}} \gt 0\} $
is an indicator function that evaluates to 1 if the condition
$I\{ {m_{ik}} + {m_{ki}} \gt 0\} $
is an indicator function that evaluates to 1 if the condition $\{ {m_{ik}} + {m_{ki}} \gt 0\} $
is fulfilled, zero otherwise. This measure, one of our key explanatory variables, indicates the number of transnational actors with whom government
$\{ {m_{ik}} + {m_{ki}} \gt 0\} $
is fulfilled, zero otherwise. This measure, one of our key explanatory variables, indicates the number of transnational actors with whom government $i$
directly cooperates.
$i$
directly cooperates.
To measure the second explanatory variable, the closeness centrality of government $i$
at time
$i$
at time $t$
, we calculate harmonic centrality,Footnote 121 defined as
$t$
, we calculate harmonic centrality,Footnote 121 defined as
 $${\rm{Transnational\ network\ closeness}}\ ({\rm{i}},{\rm{t}}) = {1 \over {{n_{m,i}}}}\sum\limits_{k \ne i}^{{n_{m,i}}} {{1 \over {d(i,k,t)}}} ,$$
where $d(i,k,t)$
is the shortest distance between
$d(i,k,t)$
is the shortest distance between $i$
and nonstate actor
$i$
and nonstate actor $k$
. For this measure we use inverse tie values, such that greater tie strength corresponds to shorter distances. Thus
$k$
. For this measure we use inverse tie values, such that greater tie strength corresponds to shorter distances. Thus
 $$d(i,k,t) = \min ({1 \over {{m_{il}}}} + \ldots + {1 \over {{m_{lk}}}})$$
for the transnational network observed at time
$$d(i,k,t) = \min ({1 \over {{m_{il}}}} + \ldots + {1 \over {{m_{lk}}}})$$
for the transnational network observed at time $t$
, where
$t$
, where $l$
represents intermediary nonstate actors between
$l$
represents intermediary nonstate actors between $i$
and
$i$
and $k$
. If no
$k$
. If no $ik$
path exists, then
$ik$
path exists, then
 $${1 \over {d(i,k,t)}} = 0$$
.
$${1 \over {d(i,k,t)}} = 0$$
.
Substantively, harmonic centrality measures how closely connected a given $i$
government is to every nonstate actor in the transnational network. High values indicate not only that
$i$
government is to every nonstate actor in the transnational network. High values indicate not only that $i$
has many immediate nonstate partners, but that those partners are themselves connected to many other nonstate actors (who are in turn connected to many other nonstate actors, and so on). A government with high harmonic centrality thus has greater reach in the transnational network and is better equipped to extend political influence indirectly.Footnote 122
$i$
has many immediate nonstate partners, but that those partners are themselves connected to many other nonstate actors (who are in turn connected to many other nonstate actors, and so on). A government with high harmonic centrality thus has greater reach in the transnational network and is better equipped to extend political influence indirectly.Footnote 122
Calculating ego-network size or closeness yields scalar values for each government in each time period. For either measure, the full set of these characteristics of governments’ transnational networks can be represented as a $1 \ldots T$
stack of vectors of length
$1 \ldots T$
stack of vectors of length ${n_g}$
, denoted
${n_g}$
, denoted ${\bf{v}}$
. A given
${\bf{v}}$
. A given ${{\bf{v}}_{i,t}}$
entry indicates either the size of government
${{\bf{v}}_{i,t}}$
entry indicates either the size of government $i$
’s transnational network, or government
$i$
’s transnational network, or government $i$
’s closeness in the overall transnational network, in period
$i$
’s closeness in the overall transnational network, in period $t$
.
$t$
.
Inferential Network Model
Our analysis does not attempt to distinguish between the capacity and liability mechanisms, as both mechanisms lead to similar empirical expectations. Instead, we focus on estimating the overall impact of transnational ties on interstate conflict, both material and verbal. An immediate estimation challenge is that, in a network context, the exogenous sources of variation required for quasi-experimental analysis are not available. Existing causal inference designs rely on the potential outcomes framework, with identification achieved by approximating as-if random treatment assignment, such that parameter estimates recover average treatment effects as a counterfactual between treated and untreated units. However, interdependence violates the assumptions of the potential outcomes framework.Footnote 123 And recently developed models for causal inference on time-series, cross-sectional data require assumptions—such as no spillover across units—that are implausible in networks.Footnote 124
We instead employ an inferential network model, which approaches causality in a different way. Network models are generative models that, if well specified, approximate a highly interdependent causal process. In network models, causality is represented by the parameters of a stochastic data-generating process, where altering a parameter changes the probability distribution over network evolution, such that causal effects are defined as features of the generative mechanism rather than counterfactual contrasts across treatments. While network scholars have begun exploring the potential outcomes framework in a network context, this research remains exploratory; current models are limited to simple cross-sectional networks without network-behavior coevolution.Footnote 125 Network models do not estimate treatment effects as such, but they nonetheless provide much more leverage over causality than purely descriptive regression models, where parameter estimates represent only conditional correlations.
As with all observational data analysis, unobserved confounders are a concern. Network models address confounding by incorporating endogenous structural influences, as well as actor covariates, directly into the data-generating process.Footnote 126 This approach prioritizes those confounders that are known to affect network data. Our analysis must grapple with two particularly salient confounders. First, because the outcome of interest—interstate conflict—consists of highly interdependent relationships, the data points are not statistically independent.Footnote 127 The occurrence of conflict between some states influences conflict between other states.Footnote 128 The empirical model must incorporate this interdependence. Second, although we are substantively interested in how transnational cooperation affects interstate conflict, these phenomena mutually influence one another. Transnational networks do not form randomly. Rather, governments self-consciously use transnational ties to exercise influence, often in response to rivalries and other interstate tensions. This endogenous dynamic between interstate competition and transnational ties is in fact foundational to our theory. To estimate the impact of transnational networks on interstate conflict, the empirical model must account for the simultaneous influence of conflict on transnational networks.
To our knowledge, the only model capable of addressing both problems is the stochastic actor-oriented model (SAOM) of network-behavior coevolution. This family of models has been extensively used in the study of international relations.Footnote 129 Our implementation of the SAOM uses two equations. For the interstate conflict network, ${\bf{g}}$
, we specify a network-level equation,
${\bf{g}}$
, we specify a network-level equation, $f_i^{\bf{g}}({\bf{g,v}})$
, that models the formation of
$f_i^{\bf{g}}({\bf{g,v}})$
, that models the formation of $ij$
conflict ties. For the
$ij$
conflict ties. For the ${\bf{v}}$
metrics derived from the transnational cooperation network, we specify a node-level “behavior” equation,
${\bf{v}}$
metrics derived from the transnational cooperation network, we specify a node-level “behavior” equation, $f_i^{\bf{v}}({\bf{g,v}})$
, that models increases or decreases in government
$f_i^{\bf{v}}({\bf{g,v}})$
, that models increases or decreases in government $i$
’s ego-network size (or closeness centrality). By incorporating elements of each equation into the other, we are able to model coevolution of interstate conflict and transnational ties over time.Footnote 130 The interstate conflict equation includes separate terms for the
$i$
’s ego-network size (or closeness centrality). By incorporating elements of each equation into the other, we are able to model coevolution of interstate conflict and transnational ties over time.Footnote 130 The interstate conflict equation includes separate terms for the $i$
initiator’s and
$i$
initiator’s and $j$
target’s respective ego-network sizes (or closeness scores), and the transnational network equation includes measures of the
$j$
target’s respective ego-network sizes (or closeness scores), and the transnational network equation includes measures of the $i$
government’s tendency to initiate or receive interstate conflict. This model thus explicitly mirrors the endogenous causal process underlying our theory; interstate competition spurs governments to develop transnational ties to nonstate actors, and, at the same time, those ties influence interstate competition. See Appendix A.2 for technical details on the model.
$i$
government’s tendency to initiate or receive interstate conflict. This model thus explicitly mirrors the endogenous causal process underlying our theory; interstate competition spurs governments to develop transnational ties to nonstate actors, and, at the same time, those ties influence interstate competition. See Appendix A.2 for technical details on the model.
To address interdependence in data points, where interstate competition between some states influences competition between others, we incorporate endogenous network terms into the conflict equation. These terms capture the most prominent sources of heterogeneity in networks.Footnote 131 We model initiators’ and targets’ overall activity in the network using indegree and outdegree terms, which control for heterogeneity in countries’ first-order relationships, or the tendency of some governments to be systematically more aggressive or ambitious in their foreign relations than others. Together, the degree terms control for the possibility that a state’s transnational network size is spuriously correlated with its overall activity in the conflict network. We also include a term for reciprocity and a term for transitivity, which account for heterogeneity in second-order and third-order network relations, respectively. These terms control for system-level confounders, such as the possibility that states with large transnational networks coincidentally have common third-party adversaries. As a robustness check, we also estimated an additive and multiplicative effects network (AMEN) model,Footnote 132 which utilizes a more generic approach to modeling higher-order influences, alongside conventional sender/receiver random effects (see Appendix A.8).
Because endogenous network influences are especially strongly correlated with conflict,Footnote 133 they are the most relevant potential confounders in this case. Nonetheless, even with the inclusion of network terms, omitted variable bias remains a concern, and we must also control for observables. In the $f_i^{\bf{g}}({\bf{g,v}})$
network equation, we include dyadic covariates for log-transformed geographic distance between initiator and target,Footnote 134 the presence of a defense pact or other military alliance,Footnote 135 and distance in ideal points in UN General Assembly voting.Footnote 136 We include monadic covariates for both the initiator’s and target’s log-transformed military capabilities,Footnote 137 regime type,Footnote 138 and involvement in an interstate or civil war.Footnote 139 In the
$f_i^{\bf{g}}({\bf{g,v}})$
network equation, we include dyadic covariates for log-transformed geographic distance between initiator and target,Footnote 134 the presence of a defense pact or other military alliance,Footnote 135 and distance in ideal points in UN General Assembly voting.Footnote 136 We include monadic covariates for both the initiator’s and target’s log-transformed military capabilities,Footnote 137 regime type,Footnote 138 and involvement in an interstate or civil war.Footnote 139 In the $f_i^{\bf{v}}({\bf{g,v}})$
behavior equation, we control for military capabilities, regime type, and involvement in interstate and/or civil war. Because data availability for control variables limits the analysis to the 1995–2016 period, we estimate models both with and without controls.
$f_i^{\bf{v}}({\bf{g,v}})$
behavior equation, we control for military capabilities, regime type, and involvement in interstate and/or civil war. Because data availability for control variables limits the analysis to the 1995–2016 period, we estimate models both with and without controls.
While we cannot of course conclude that this model specification eliminates the risk of unobserved confounding, the multipronged approach to inference—that is, a coevolutionary specification that models both directions of the interstate–transnational relationship, incorporation of endogenous network terms into the interstate conflict equation, and controls for a range of known exogenous influences—increases our confidence that the parameter estimates reflect a true causal process. Notably, the AMEN model discussed in Appendix A.8 addresses network confounding and heterogeneity with a different estimation strategy,Footnote 140 and our main results remain robust.
We implement the SAOM as a moving-window estimator that allows parameter estimates to vary over time (see Appendix A.2.1). We distinguish between four eras of interest: pre-9/11, which covers the years prior to the 9/11 terror attacks and the subsequent shift in emphasis toward transnational terrorism; 2002–2008, which covers the emergence of the Global War on Terror (GWOT) and corresponding wars in Iraq and Afghanistan; 2009–2014, which covers the retrenchment of extremist organizations in North Africa and the Middle East, and is essentially a transition period between the GWOT and major-power competition; and the post-2014 period, which covers the metastasis of ISIS, the collapse of Afghanistan, the Russian invasion of Ukraine, and a general intensification of interstate competition.Footnote 141 Our goal in distinguishing eras is not to derive hypotheses specific to each, but to inductively observe how interstate–transnational dynamics evolve alongside the global security climate.
Empirical Results
The SAOM parameter estimates show that larger transnational networks are associated with increased conflict initiation (H1), which aligns with our expectation that transnational ties embolden aggressive behavior and intensify interstate competition. Figure 5 illustrates time-varying parameter estimates from the SAOM for the relationship between transnational ego-network size and interstate conflict. The top row of Figure 5 shows estimates for material interstate conflict—that is, actions such as troop mobilizations, imposition of sanctions, and armed attacks. We find that ego-network size is significantly correlated with the initiation of material conflict for all time periods under consideration, and this result holds with or without the inclusion of covariates. Further, we see a pronounced increase in emboldening in the post-2014 era, a period of time characterized by the rise of great-power competition. The growing association between ego-network size and conflict is consistent with the claim that transnational cooperation reinforces interstate competition.
Transnational ego-network size and interstate conflict
Notes: Stochastic actor-oriented model. Lines are parameter estimates. Polygons are 95% confidence intervals. Data aggregated to the quarterly level. Estimates based on a three-year moving window. See Appendix A.4 for results of behavior equations.

Figure 5 Long description
The line graph presents data on the relationship between the size of transnational ego-networks and interstate conflict from 1995 to 2023. The graph is divided into four panels: two for material conflict and two for verbal conflict. Each panel compares the size of the initiator's and target's transnational ego-networks. The x-axis represents the years from 1995 to 2023, while the y-axis represents the estimates plus 95 percentage confidence intervals. Two models are depicted: one with controls (solid blue line) and one without controls (dashed green line). The graph is further divided into four periods: 1995-2001, 2002-2008, 2009-2014, and 2015-2023, each represented by different background colors. The data shows variations in the size of ego-networks and their association with different types of conflicts over time. All values are approximated.
We also find support for the hypothesis that governments with larger transnational ego-networks attract more material conflict (H2), though with less consistent results. In the 1990s, governments with extensive transnational ties are, as expected, more likely to be targeted with aggression by other governments. However, this association weakens during the Global War on Terror in the 2000s before strengthening again as major-power competition reemerged in the early 2010s. This result likely reflects a declining interest in aggressive actions toward state sponsors of terror in the mid-2000s, as conditions in Iraq deteriorated and GWOT operations met substantial headwinds.
These results hold if we instead focus on verbal conflict between states, such as threats, demands, condemnations, and other nonphysical actions that typically involve lower-intensity conflict—though the estimates are generally of smaller magnitude than for material conflict (bottom row of Figure 5). As the bottom-left panel illustrates, transnational ego-network size is consistently associated with an increase in verbal conflict. The magnitude of this relationship is remarkably stable from the 1990s through 2023, despite dramatic changes in the international system during this time. Transnational networks embolden governments to be more verbally aggressive in their interactions with other governments. Large transnational ego-networks also tend to attract verbal aggression from other governments, though the estimates for this relationship are less consistently significant.
At the same time, although we are less concerned here with exploring the reverse relationship, the empirical results also provide evidence that transnational ties respond to interstate competition. Appendix A.4 shows that governments that initiate conflict, or are targeted for conflict, are more likely to expand the size of their transnational ego-networks. This finding holds for both material and verbal conflict. As assumed by our theory, and as anticipated by our research design, interstate competition precedes an intensified search for influential transnational partners.
To assess the substantive impact of transnational ties, we interpret the parameters from the top row of Figure 5, that is, the relationship between ego-network size and material interstate conflict, with the full set of controls across all time periods in the moving-window analysis. Figure 6a shows the odds ratio of interstate conflict initiation for differing ego-network sizes, compared to a baseline of no transnational ego-network. In the period ending April 2016, for example, illustrated by the top line in Figure 6a, an increase in ego-network size from zero to ten nonstate actors is associated with a fifteen-fold increase in the odds of conflict initiation—an extremely large difference. Even in those time periods where the substantive association is weakest—in our data, the period ending July 2013—an ego-network of ten actors is associated with an increase in the odds of conflict initiation of over 25 percent. For conflict targeting, the association is smaller in magnitude but still statistically and substantively significant. Figure 6b shows that an increase in ego-network size is associated with a nearly four-fold increase in the odds of being targeted, at its maximum. Thus the empirical results support both H1 and H2, though with transnational network ties having a stronger influence on emboldening initiators than on attracting conflict to targets.
Interpretation of SAOM parameter estimates
Notes: Each line represents an individual model over a three-year period. Y-axis indicates the odds ratio of a conflict tie associated with an increase in transnational ego-network size from zero to an arbitrary nonzero value specified on the x-axis. Results based on “With controls” model for Material conflict in Figure 5.

Figure 6 Long description
Two line graphs showing the odds ratio of conflict tie against the number of nonstate actors in transnational ego-network for initiator's and target's ego-network. The x-axis represents the number of nonstate actors in transnational ego-network ranging from 0 to 10. The y-axis represents the odds ratio of conflict tie ranging from 0 to 15. The graph on the left shows the initiator's ego-network with multiple lines representing different ending years, indicated by a color gradient from purple to orange. The graph on the right shows the target's ego-network with similar lines and color coding. The lines in both graphs indicate that as the number of nonstate actors increases, the odds ratio of conflict tie also increases, with a more pronounced effect in the initiator's ego-network. All values are approximated.
A related question is how the influence of transnational networks compares to well-known determinants of interstate conflict, such as distance, alliances, regime type, and military capabilities. Figure 7 calculates variable importance across all time periods.Footnote 142 Unsurprisingly, geographic distance and military capabilities are consistently the most important determinants of conflict. Yet transnational ties also exhibit a high degree of variable importance, exceeding the performance not only of exogenous influences like democracy and military alliances, but also endogenous network influences like reciprocity, transitivity, and nodal degree effects. Temporal trends further indicate that the importance of transnational ties—especially for conflict initiation—increased sharply post-9/11. The importance of transnational ties then waned gradually in the post-GWOT era before again spiking sharply post-2013. For many of the time windows analyzed in the 2014–2016 range, the size of the initiator’s transnational ego-network is the most important determinant of interstate conflict, exceeding the importance even of distance and military capabilities. Together with the parameter estimates shown in Figure 5, these results suggest that the association between transnational ties and conflict is robust across eras and reflects a broader tendency of competition through transnational influence.
Relative importance of variables in predicting interstate conflict
Notes: Larger filled area indicates greater importance for that variable. Estimates based on material conflict in the “With controls” model in Figure 5. Values for each period sum to one, using the method of Indlekofer and Brandes Reference Indlekofer and Brandes2013.

Figure 7 Long description
The line graph illustrates the relative importance of multiple variables in predicting interstate conflict over time, spanning from 1999 to 2015. The x-axis represents the years, while the y-axis indicates the relative importance, ranging from 0.00 to 1.00. The graph includes several data lines, each representing a different variable. The variables include ego-net size for both the initiator and target, reciprocity, transitivity, indegree, outdegree, alliance, distance, ideal point distance, power for both the initiator and target, democracy for both the initiator and target, interstate war for both the initiator and target, and civil war for both the initiator and target. Each variable is color-coded for distinction. The graph shows fluctuations in the relative importance of these variables over the specified time period. All values are approximated.
Network Structure
The results so far emphasize the size of governments’ respective transnational ego-networks. The structure of those networks also matters. Figure 8 illustrates results from modeling the coevolution of interstate conflict and government closeness centrality (while also controlling for ego-network size). The results in the top left panel of Figure 8 indicate that closeness is positively and significantly correlated with conflict initiation, which supports the logic of H3—that is, as governments cultivate ties to well-connected nonstate actors, they are emboldened to be increasingly aggressive toward other governments. Interestingly, this emboldening pattern is entirely absent in the 1990s. Post-9/11, closeness is persistently associated with conflict initiation. The lower left panel of Figure 8 also shows a stable association between closeness centrality and verbal conflict across all time periods.
Transnational closeness centrality and interstate conflict, 1995–2023
Notes: Stochastic actor-oriented model. Lines are parameter estimates. Polygons are 95% confidence intervals. Data aggregated to the quarterly level. Estimates based on a three-year moving window. See Appendix A.4 for results of behavior equation.

Figure 8 Long description
The line graph consists of four panels, each representing different aspects of transnational closeness centrality and interstate conflict. The top left panel shows the initiator's closeness in the transnational network for material conflict, while the top right panel shows the target's closeness in the transnational network for material conflict. The bottom left panel depicts the initiator's closeness in the transnational network for verbal conflict, and the bottom right panel depicts the target's closeness in the transnational network for verbal conflict. Each panel contains two lines representing different models: one with controls and one without controls. The x-axis represents the years from 1995 to 2023, divided into four periods: 1995-2001, 2002-2008, 2009-2014, and 2015-2023. The y-axis represents the estimates plus ninety-five percentage confidence intervals. The graph shows how the closeness centrality in the transnational network relates to the initiation and targeting of interstate conflicts over time. All values are approximated.
Figure 9 interprets the parameter estimates for material conflict, broken down into four distinct time periods. As already seen in the results for ego-network size, as a government’s ties to nonstate actors proliferate, the odds of that government initiating conflict with other governments increase substantially. The government’s “reach” or closeness within the transnational network further amplifies this relationship. For example, during the “2015+” period, if a government increases the size of its ego-network from zero to ten nonstate partners, but those partners are not themselves connected to any additional nonstate actors, then the odds of conflict initiation by that government increase about four-fold. By contrast, if that same government acquires ten partners that are themselves well connected to other nonstate groups, the odds of conflict initiation increase by nearly sixteen-fold. Although the magnitude of this pattern varies over time, we find that cooperative ties to well-connected nonstate groups are always associated with increased conflict.
Interpretation of closeness parameter estimates, disaggregated by time periods
Notes: Y-axis indicates the odds ratio of a conflict tie corresponding to the ego-network size given on the X-axis. Line color indicates the focal node’s closeness within the transnational network. Results based on Material conflict and “With controls” model in Figure 8(a).

Figure 9 Long description
The line graph is divided into four panels representing different time periods: 1995-2001, 2002-2008, 2009-2014, and 2015 onwards. The x-axis represents the number of nonstate actors in the transnational network, ranging from 0 to 10. The y-axis represents the odds ratio of conflict tie, ranging from 0 to 16. Each panel shows a gradient of lines indicating the initiator's closeness, categorized as high, medium, and low. The gradient lines show an increasing trend in the odds ratio of conflict tie as the number of nonstate actors increases. The dashed horizontal line at y equals 1 serves as a reference point. All values are approximated.
The top right panel of Figure 8 shows that high closeness centrality in the transnational network also tends to attract aggression from other governments, which supports H4. However, this pattern is weaker in magnitude and less consistently significant than for initiation. For example, in the pre-9/11 era, closeness is associated with a decrease in incoming conflict ties, which suggests that, at least for a time, governments were able to use ties to well-connected nonstate groups to prevent attacks by adversaries. The post-9/11 era sees a sharp spike in the opposite direction, consistent with H4. In more recent periods, closeness has become less consistently significant for targets. We do find, however, that closeness continually attracts verbal conflict from other governments (lower right panel of Figure 8). The discrepant results here between material and verbal conflict suggest that governments with extensive ties to well-connected nonstate actors generally attract the attention of other states, but those other states often resort to verbal actions rather than material confrontations.
Finally, we assess the relative importance of ego-network size and closeness centrality. Figure 10 illustrates the results. Despite substantial variation over time, closeness is overall the most important of the transnational variables in explaining conflict—particularly the closeness of potential initiators. Overall, the results for closeness centrality emphasize a crucial point. Cooperative ties to foreign nonstate actors tend to embolden governments and increase aggressive actions, but the structure of those ties determines the magnitude of the emboldening effect. A government may have relatively few immediate nonstate partners and yet exercise influence through the activities of its indirect partners. By contrast, a government with many immediate nonstate partners may be constrained by an inability to exercise influence beyond its local connections.
Relative importance of ego-network size and transnational closeness centrality in predicting interstate conflict
Notes: Estimates based on the “With controls” model in Figure 8. Larger filled area indicates greater importance for that variable.

Figure 10 Long description
The line graph illustrates the relative importance of four factors in predicting interstate conflict over time from 1999 to 2016. The x-axis represents the years, ranging from 1999 to 2016, while the y-axis represents the relative importance, ranging from 0.00 to 0.12. The graph includes four data lines: Ego-net size for the target, Ego-net size for the initiator, Transitional net closeness for the target, and Transitional net closeness for the initiator. Ego-net size for the target is represented in light green, Ego-net size for the initiator in teal, Transitional net closeness for the target in blue, and Transitional net closeness for the initiator in dark blue. The graph shows fluctuations in the relative importance of these factors over the years, with Ego-net size for the target generally maintaining the highest relative importance, followed by Ego-net size for the initiator, Transitional net closeness for the target, and Transitional net closeness for the initiator. All values are approximated.
Conventional Military Power
To test H5 and H6, we interacted the transnational network variables with the initiator’s and target’s respective military power, as measured by Composite Index of National Capability scores.Footnote 143 We re-estimated the full set of models for ego-network size and closeness centrality with an interaction term included. Figures A4 and A5 in the appendix present the full set of results. For virtually all model specifications—ego-network size and closeness, initiators and targets, material and verbal conflict—we find a persistent negative interaction between power and transnational network ties, consistent with H5. Transnational networks are associated with increased conflict for all countries, but that association is significantly larger in magnitude for weak countries than for powerful countries.
Figure 11 interprets the interaction terms for the material conflict models (that is, the upper panels in Figures A4 and A5). The four upper panels illustrate the change in log-odds of conflict as the respective transnational network variable increases from its minimum to its maximum, at three different fixed levels of military power. Unsurprisingly, for powerful countries (blue lines), the baseline level of conflict, when no transnational ties exist, is always higher. An increase in the initiator’s ego-network size (top left) increases conflict, but this increase is more pronounced for weak countries (yellow line) than for powerful countries. In fact, for weak countries, a relatively modest increase in transnational network size brings the odds of conflict initiation to the same level as for powerful countries—and a substantial increase in network size pushes those odds well above the level for powerful countries. We find similar results, though less pronounced, for the other measures of transnational network influence. These findings have substantive importance. Countries that lack conventional military power may be tempted to find other means of exerting influence, including by extending support to foreign nonstate actors. Yet such a strategy, when pursued by weak countries, appears to be particularly destabilizing to interstate relations.
Interpretation of interaction between transnational networks and conventional power
Notes: Top panels interpret parameter estimates from interaction models of material conflict. Each line shows the log odds ratio of a conflict tie as either transnational ego-network size or closeness centrality increases from its minimum to its maximum, with military power fixed at either the observed mean, 1 standard deviation below the mean, or 1 s.d. above the mean. The y-axes show the log odds ratio relative to a baseline scenario where transnational ego-network size and/or closeness centrality are held at zero, and military power is held at its mean. Bottom panels illustrate the difference in log odds when ego-network size/closeness increases from zero to one, with military power fixed at below-average, average, or above-average levels. Confidence intervals in gray (top) and vertical lines (bottom), derived via the delta method.

Figure 11 Long description
The bar graph consists of four panels. The top two panels show the log odds of conflict as a function of the size of the transnational ego-network for both the initiator and the target. The bottom two panels show the log odds of conflict as a function of transnational closeness centrality for both the initiator and the target. Each panel contains three lines representing different levels of military power: mean minus one standard deviation, mean, and mean plus one standard deviation. The bottom row of the graph shows the magnitude of the interaction effect by variable, with four panels corresponding to initiator's ego-network size, initiator's closeness, target's ego-network size, and target's closeness. Each panel contains three data points representing different levels of military power. The x-axis of each panel in the bottom row indicates the level of military power, while the y-axis indicates the change in log odds of conflict. The color scheme includes yellow, purple, and blue lines and data points, representing different levels of military power. All values are approximated.
The bottom panels in Figure 11 show the magnitude of the interactive relationship between conventional power and the four transnational network variables. As anticipated by H6, the magnitude of this interaction is greatest for the initiator’s ego-network size and is smaller for closeness centrality. This finding further supports the mechanisms articulated in our theory. Powerful countries have the resources to manage their nonstate partnerships and avoid agency loss, but that capability appears to be limited to direct partners and largely disappears for indirectly connected actors.
Conclusion
The Cold War is often characterized as a period in which superpowers maintained unusually large portfolios of nonstate proxies within their rivals’ spheres of influence, actively fueling and shaping subnational conflict in the process.Footnote 144 Our results suggest that such transnational ties endured beyond the Cold War and are likely to become more important as the international system returns to a period of heightened interstate competition.Footnote 145 We extend existing research by exploring how transnational ties influence conflict between states rather than within them.
This analysis makes four primary contributions. First, we provide a straightforward theoretical model that links state support for foreign nonstate actors to interstate competition. The model emphasizes mechanisms—capacity and liability—that are generalizable to both civilian and armed groups. To our knowledge, this is the first attempt in the literature to develop a systematic model of the upstream consequences of transnational ties. Second, we show empirically that large transnational networks are consistently associated with material and verbal aggression, particularly in the post-2014 period of heightened great-power competition.Footnote 146 This association is substantively large, and our assessment of variable importance suggests that transnational ties play more of a role in interstate competition than traditional variables like democracy and alliances. Third, we find that the structure of transnational networks exacerbates this relationship. Cooperation with well-connected groups is associated with a sharp increase in the odds that a state will initiate conflict or become the target of conflict. Finally, we show that conventional military power interacts with transnational ties in meaningful ways. While transnational ties are always associated with deterioration of interstate relationships, they are especially likely to intensify competition for states that lack conventional capabilities. This finding highlights the destabilizing consequences of governments resorting to nonstate partnerships as compensation for military weakness.
Overall, our results underscore the need for research that bridges the traditionally isolated fields of interstate competition and subnational cooperation. One step in this direction is to disentangle the mechanisms of capacity and liability. Case studies may help identify specific ties that uniquely enhance a state’s capabilities or generate liabilities. For instance, liability-generating ties might be more common in relationships over which states have limited control, such as those grounded in shared ethnicity or kinship, where external influences are particularly strong.Footnote 147
A second area of exploration is to separate out group types. Our analysis includes both armed and civilian groups because the proposed causal mechanisms are not unique to any particular group type. And sensitivity checks show that the findings from the main article are robust across different categories of nonstate actors. But we recognize that civilian and armed groups may play different roles within a state’s transnational network. For example, transnational ties to armed groups may be more likely to escalate into material conflict, while ties to civilian groups may instead provoke diplomatic or verbal disputes. Alternatively, governments may choose to support whichever groups are most influential within a given target state, in which case support for civilian groups may provoke as much of a response as support for armed groups. Yet another possibility is that governments use ties to civilian groups to conceal malign intentions and avoid retaliatory actions by adversaries. Exploring these and similar possibilities likely requires a game-theoretic analysis of strategic interactions between state sponsors, nonstate actors, and target countries, as well as detailed group-level data for armed and civilian groups.
A third line of inquiry would be to differentiate between verbal and material forms of conflict and cooperation. On the conflict network side, we treat verbal and material conflict between states as points on a common continuum of interstate competition. Yet the two forms of conflict may follow different logics. For example, the political costs and benefits of diplomatic threats may differ substantially from those of a military strike. With respect to transnational cooperation, our network includes only material forms of cooperation between governments and nonstate actors. Yet here too it is worth exploring why states provide some nonstate actors with material support and others with verbal.
Finally, our findings suggest that the strength of transnational ties as drivers of conflict varies over time, which we speculate reflects broader shifts in the international system. There is a growing consensus that such periodic changes in global dynamics are meaningful, especially the pre- and post-Cold War eras.Footnote 148 What is it, exactly, that characterizes these different periods of time? How do shocks like the COVID-19 pandemic change the nature of transnational ties as drivers of conflict? A promising direction for future research is to develop analytical and empirical tools that account for these temporal dimensions of conflict, and to use those tools to explore how the influence of transnational networks on state aggression may wax or wane with shifting global conditions.
Acknowledgments
For comments, we thank Jon Green, Bruce Desmarais, Finn Klebe, and participants at the 2025 American Political Science Association Annual Conference.
Funding
We gratefully acknowledge the support of the Minerva Research Initiative, Grant no. #FA9550-23-1-0471. The views expressed herein are solely the authors’ own and do not represent the US Department of Defense or Air Force Office of Scientific Research.
Data Availability Statement
Replication files for this article may be found at <https://doi.org/10.7910/DVN/7A839K>.
Supplementary Material
Supplementary material for this article is available at <https://doi.org/10.1017/S0020818326101349
Authors
Brandon J. Kinne is Professor of Political Science at University of California, Davis. He can be contacted at bkinne@ucdavis.edu.
Juan Tellez is Associate Professor of Political Science at University of California, Davis. He can be contacted at jftellez@ucdavis.edu.
Anya Stewart is PhD Candidate in Political Science at University of California, Davis. She can be contacted at aastewart@ucdavis.edu.
Iliyan Iliev is Associate Professor of Political Science at The University of Southern Mississippi. He can be contacted at Iliyan.Iliev@usm.edu.
Brandon Derr is MA student in Political Science at The University of Southern Mississippi. He can be contacted at Brandon.Derr@usm.edu.
Shreya Murthy is PhD Candidate in Political Science at the University of California, Davis. She can be contacted at shimurthy@ucdavis.edu.
Patrick Bernhard is currently a Data Analyst at Chainalysis. He can be contacted at bernhard.patrick97@gmail.com.
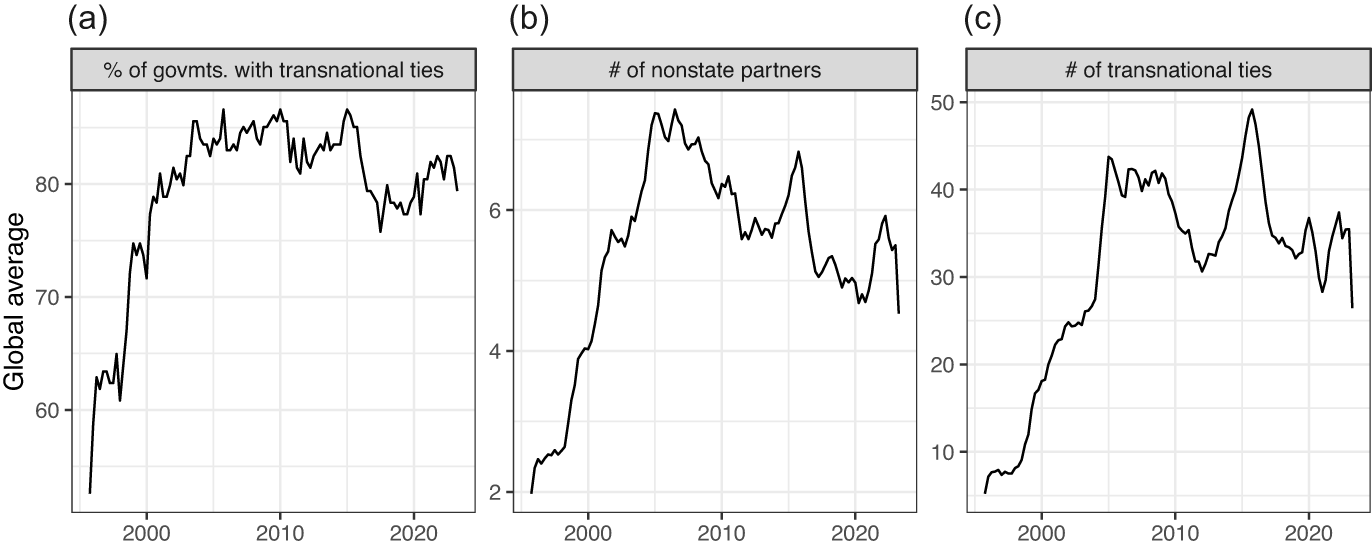
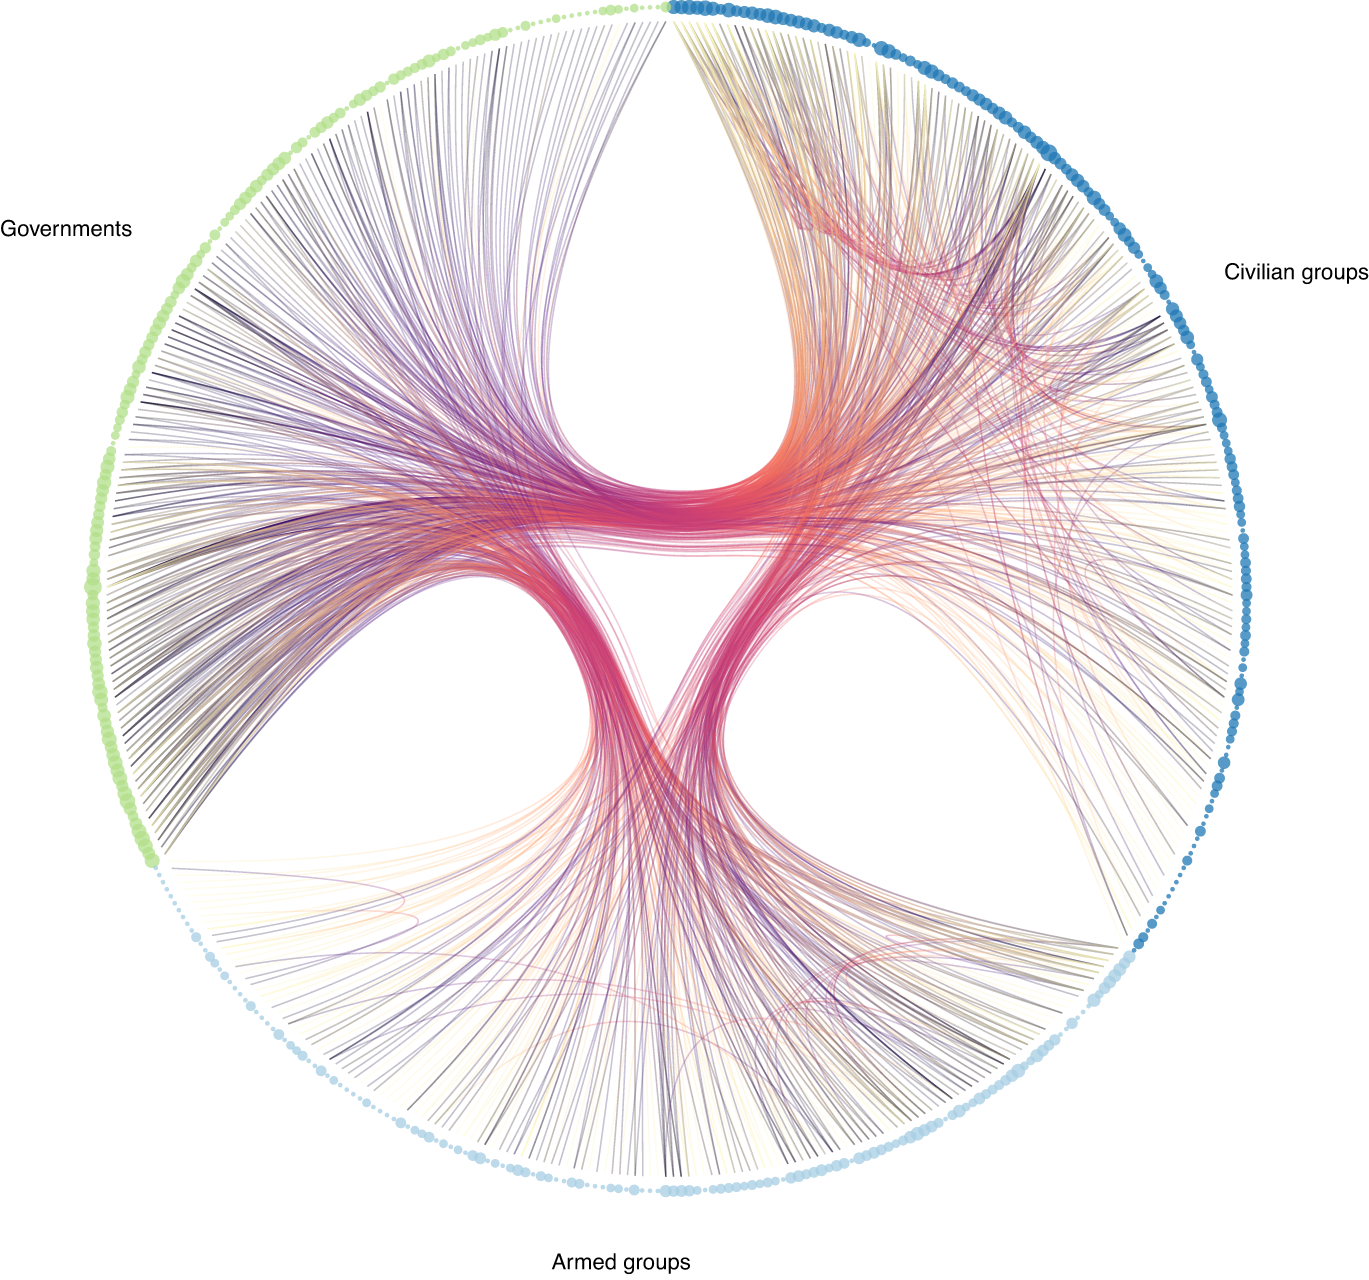
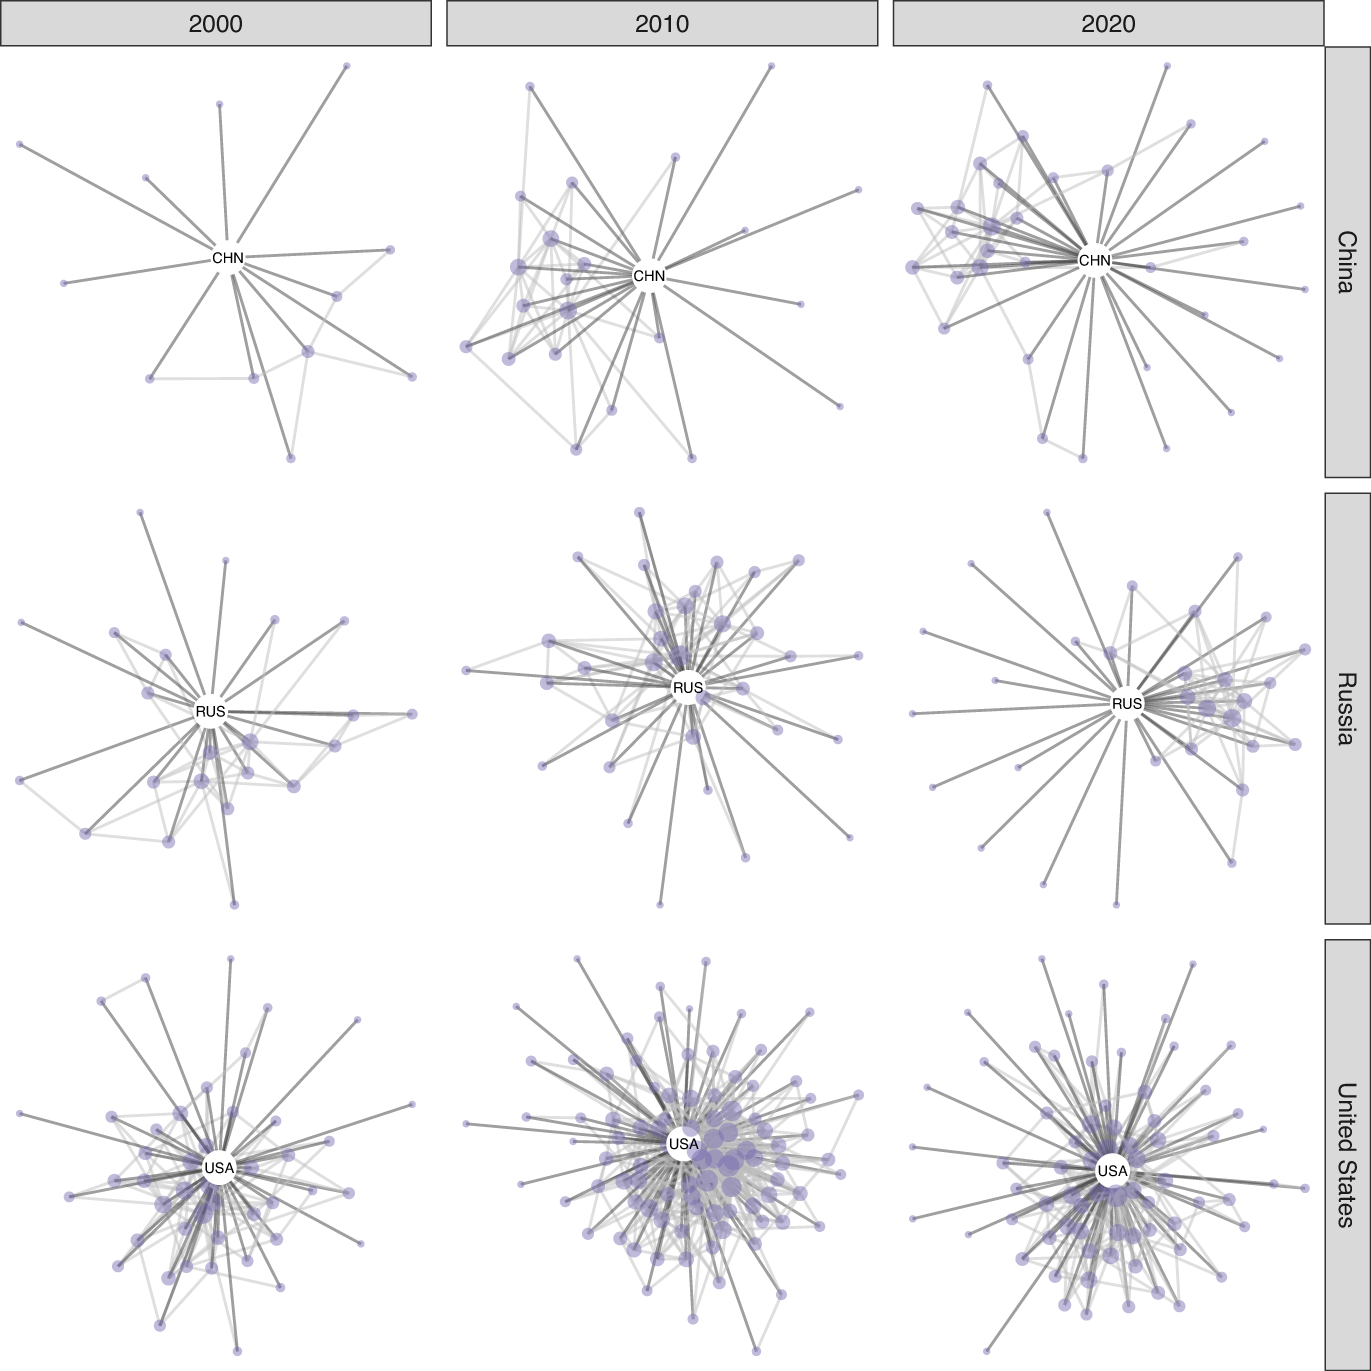
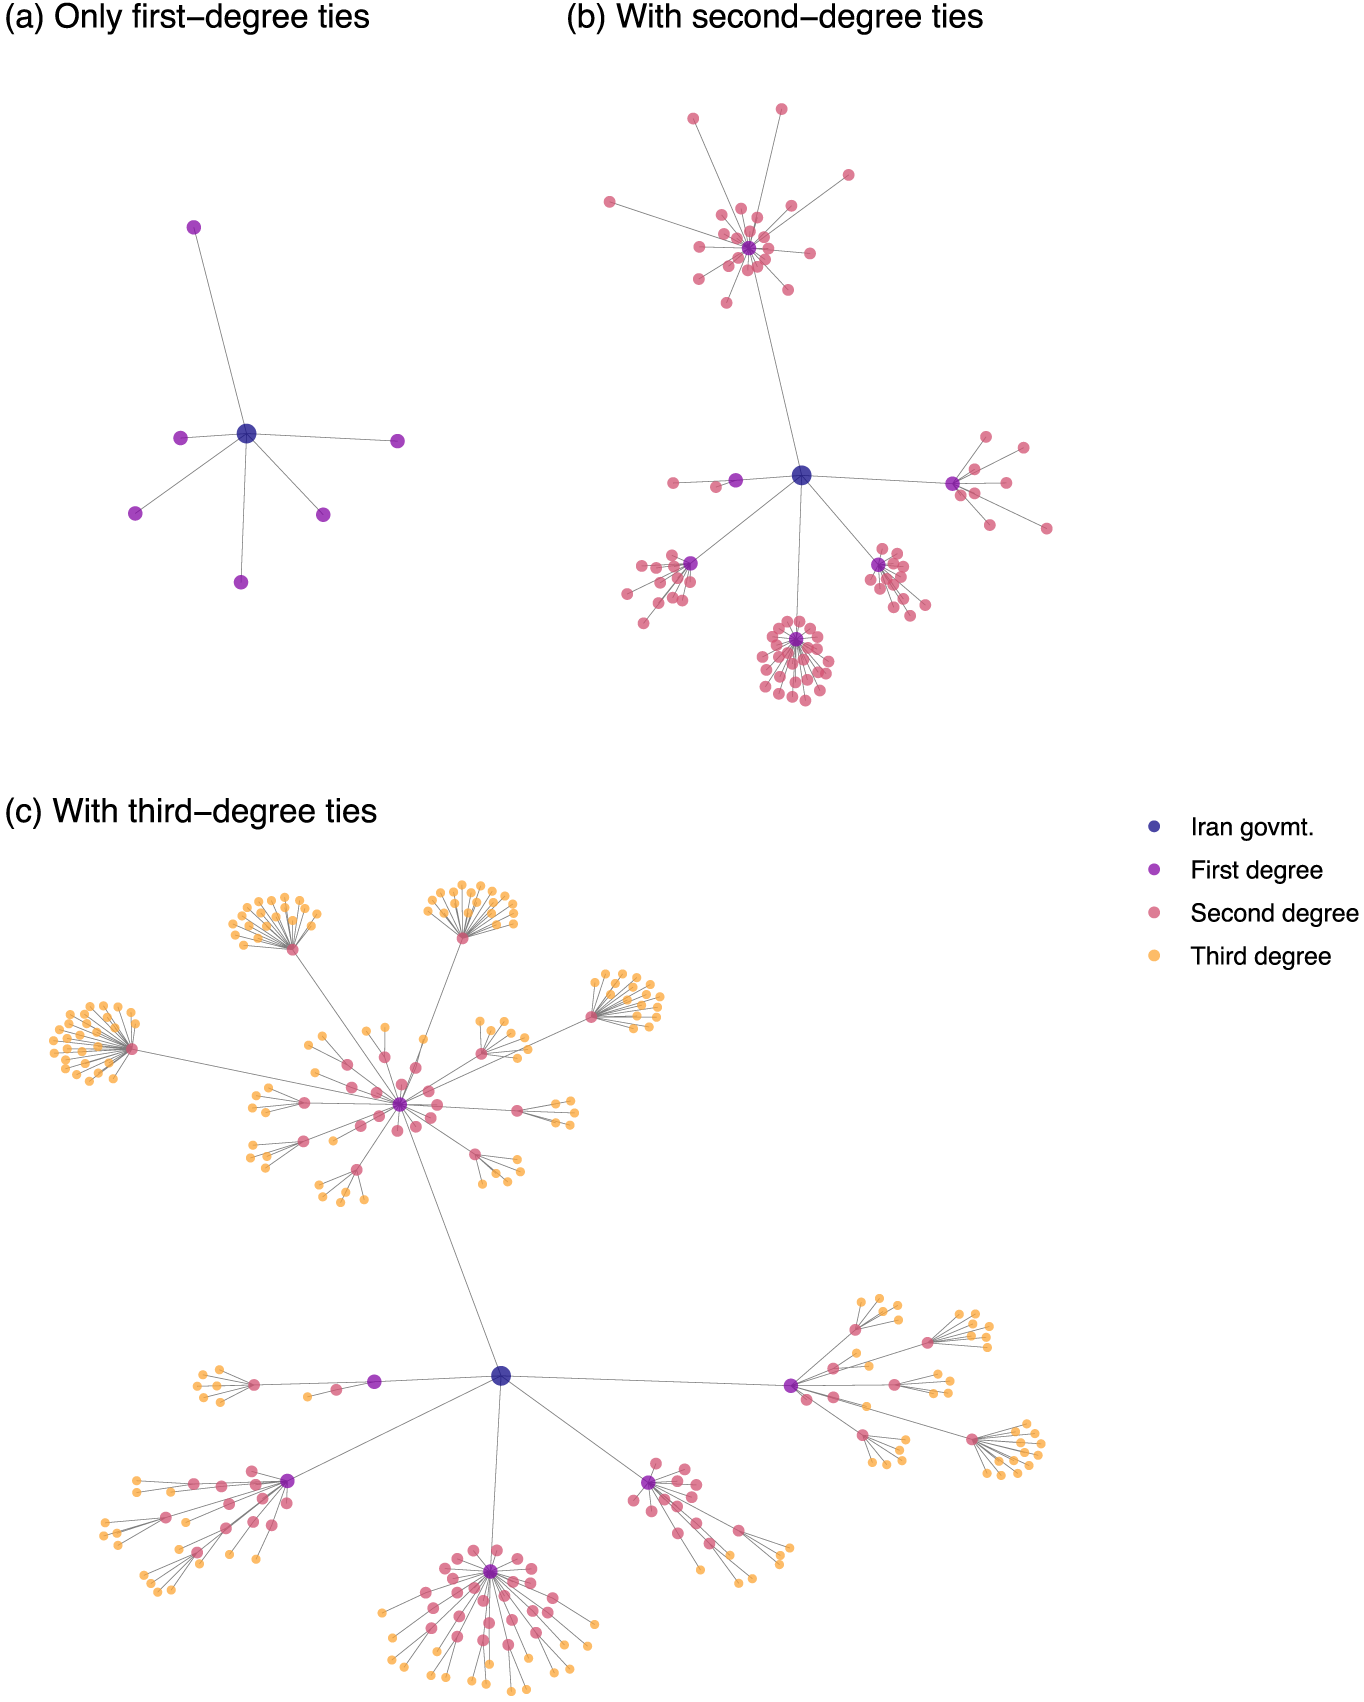
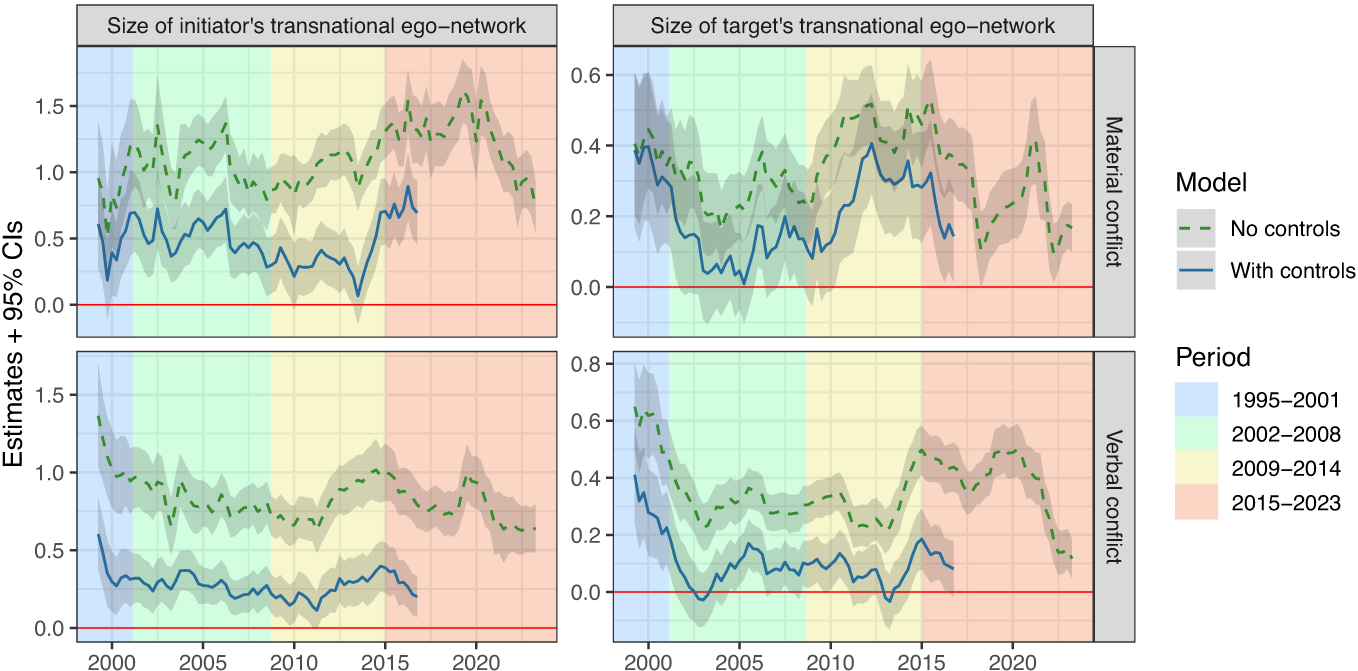
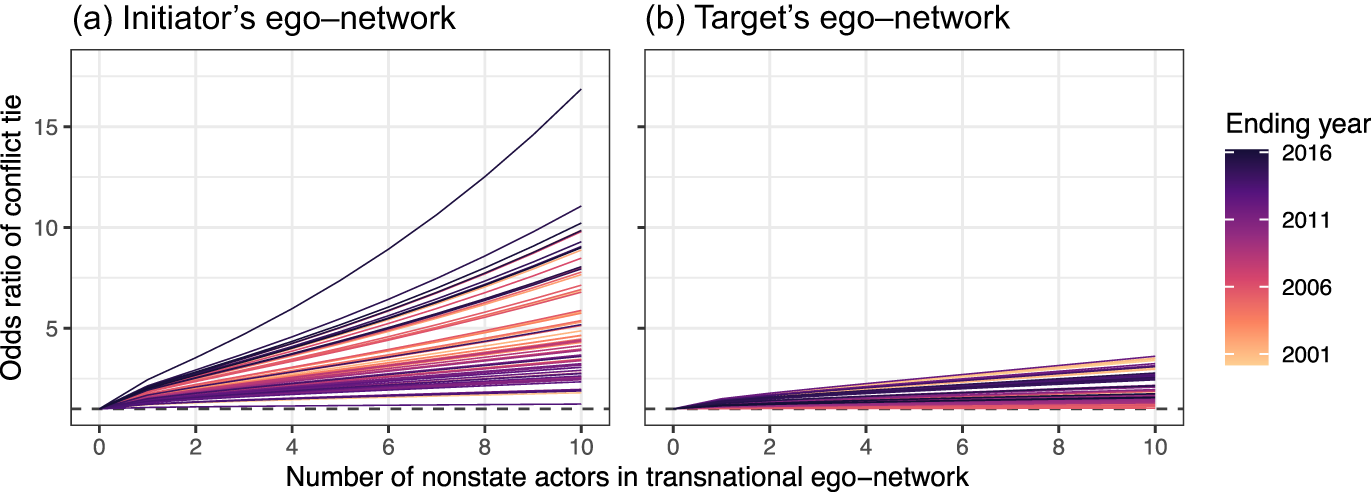
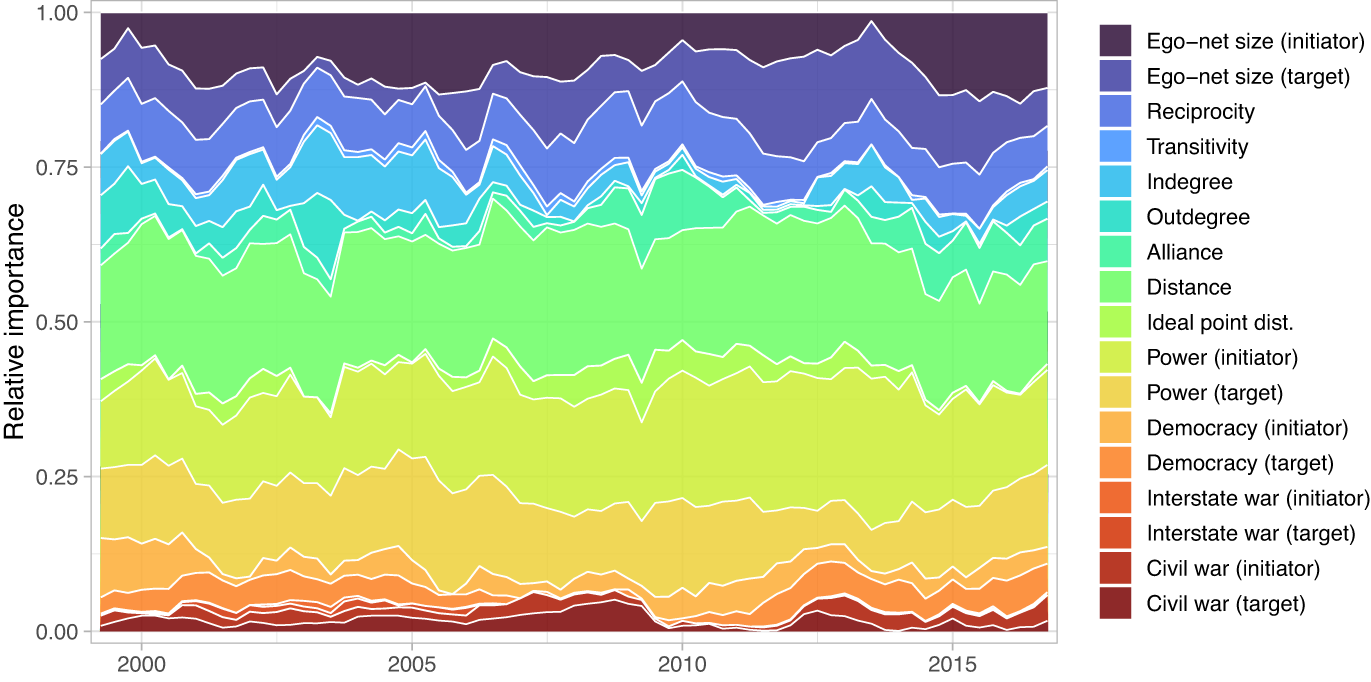
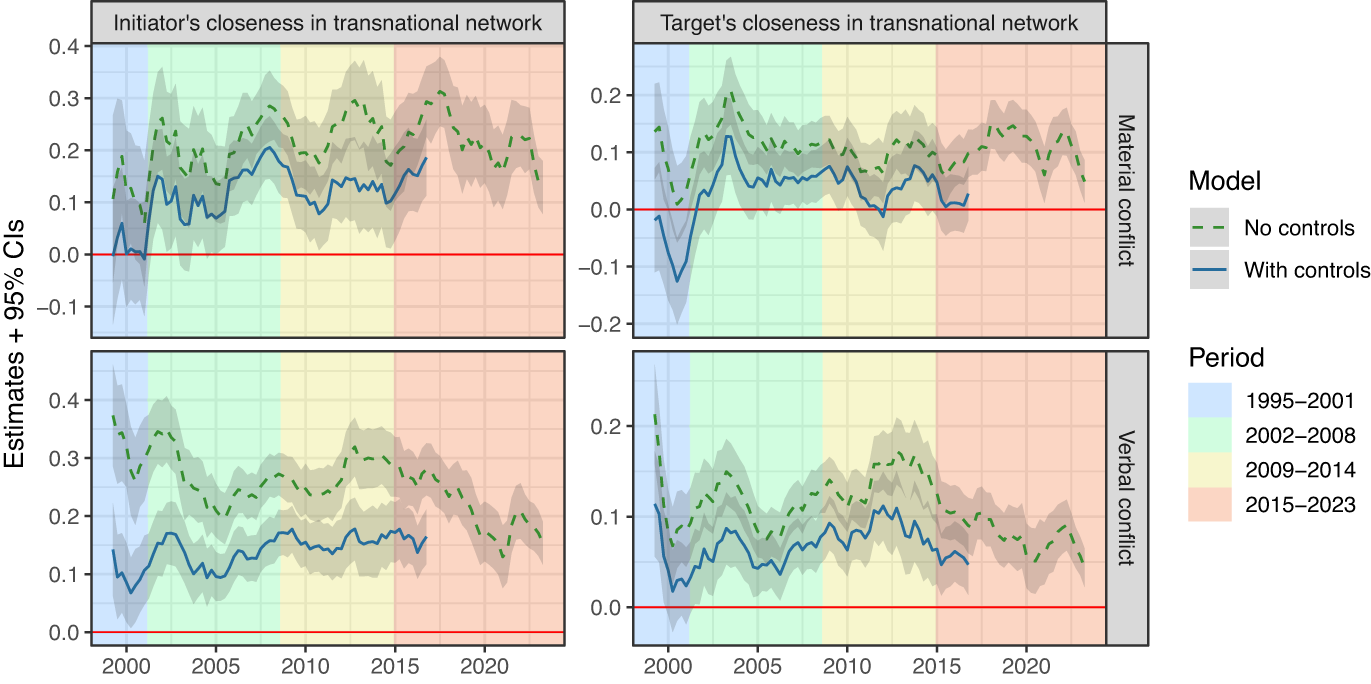
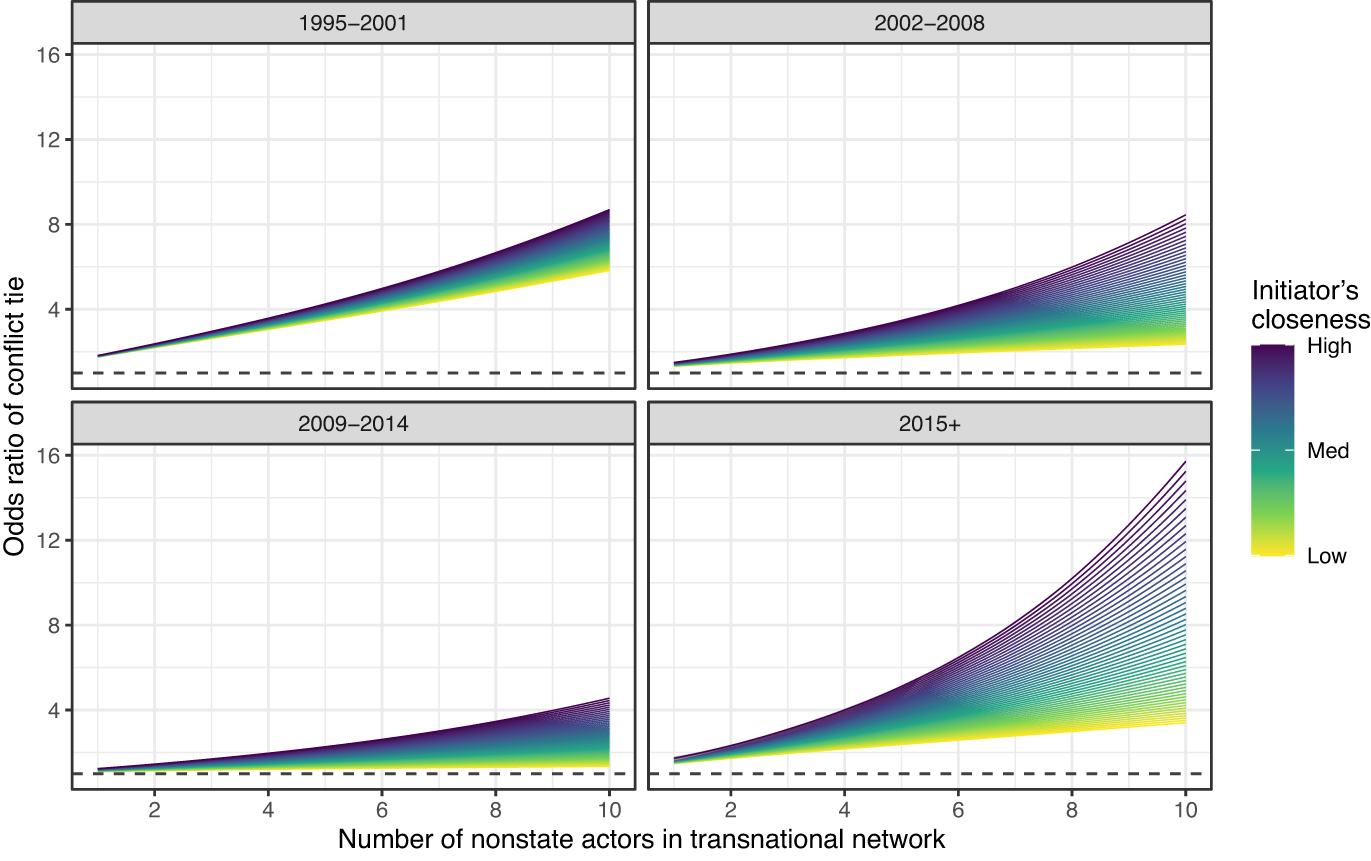
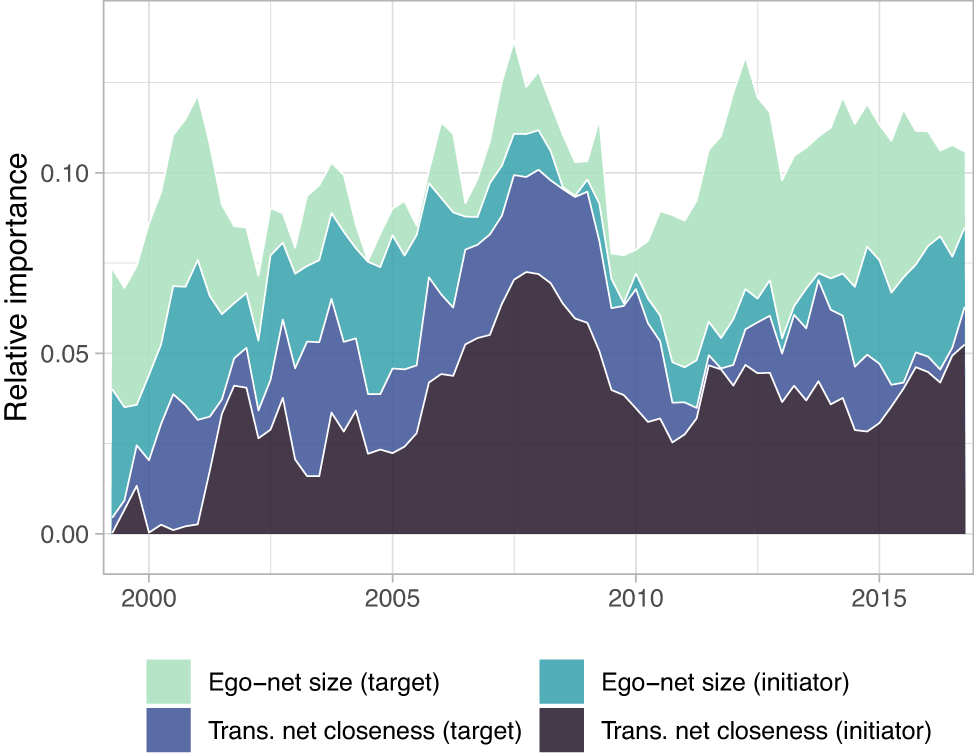
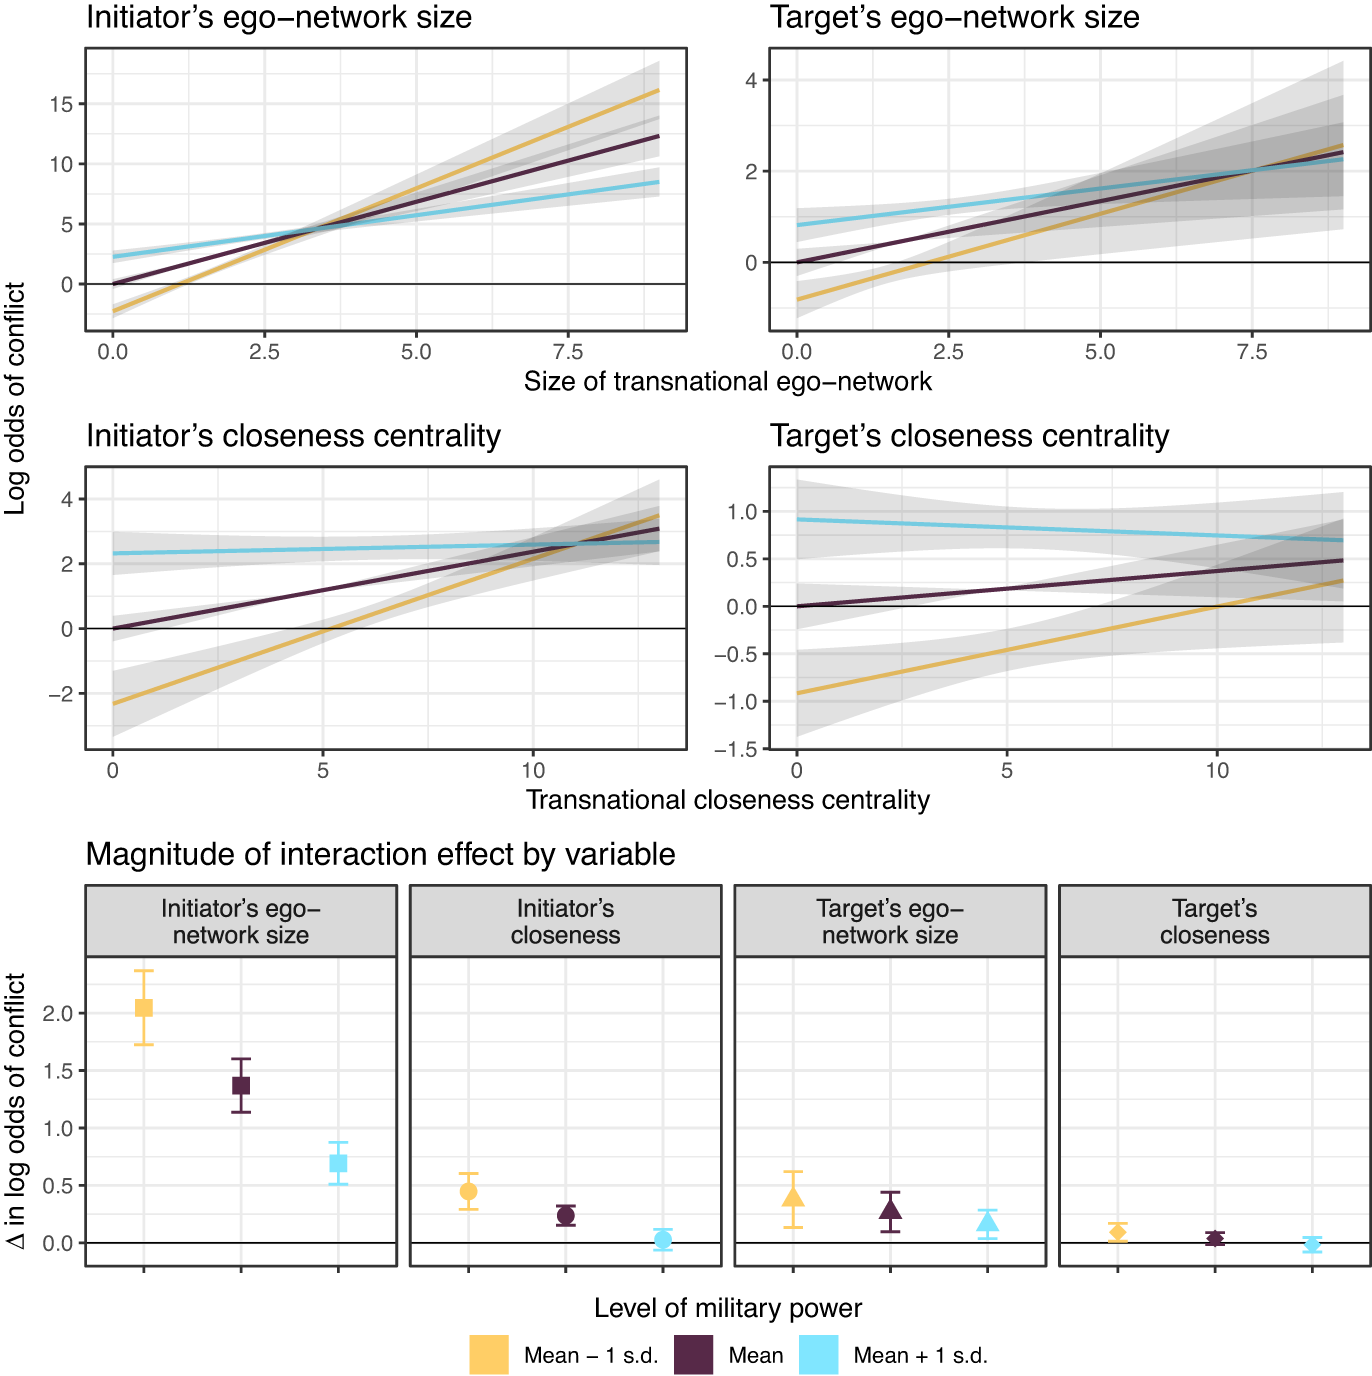


 Open access

