



According to the Centers for Disease Control and Prevention, obesity is a rising epidemic that poses serious health challenges in the USA(Reference Mitchell, Catenacci and Wyatt1,2) . In 2015, an estimated 93·3 million (39·8 %) US adults aged ≥20 years and 13·7 million children aged ≤19 years (18·5 %) were obese(Reference Hales, Carroll and Fryar3). By 2030, a projected 115 million adults will be obese in the USA(Reference Wang, McPherson and Marsh4). Obesity poses many risks to health, including type 2 diabetes, hypertension, stroke, coronary artery disease, several forms of cancer and cognitive dysfunction(Reference Mitchell, Catenacci and Wyatt1). Obesity is also associated with decreases in both human and economic productivity, and in 2010, an estimated $US 147 billion was invested in the prevention, diagnosis and treatment for obesity in the USA(Reference Hales, Carroll and Fryar3). With the rise of obesity, dieting has become prevalent in the American society. At any given time, between 15 and 35 % of Americans are trying to lose weight(Reference Kassirer and Angell5), and Americans spend an estimated $US 33 billion each year on weight loss products(6). The National Health and Nutrition Examination Survey in 2013–2016 found that changing eating habits was listed by adults as one of the most popular means of attempting to lose weight(Reference Martin, Herrick and Sarafrazi7).
The advent of the New Year is a key time when 40–45 % of Americans resolve to make changes to their lifestyle, including health behaviours like stopping smoking, getting more exercise and dieting(Reference Norcross, Mrykalo and Blagys8,Reference Boutelle, Kirschenbaum and Baker9) . Unfortunately, among the tens of millions of Americans who resolve to lose weight at the beginning of each year, few – certainly less than half – will succeed(Reference Kassirer and Angell5,Reference Norcross, Mrykalo and Blagys8,Reference Boutelle, Kirschenbaum and Baker9) . But virtually unstudied in the research literature are the types of diets that are easier for such resolvers to adhere to over time. Holidays associated with large meals, such as Thanksgiving, Christmas and Hanukkah, may also be associated with poor weight loss diet compliance, yet this is also virtually unstudied in the literature. Indeed, the entire US winter holiday season between American Thanksgiving and the end of December is typically associated with many energy-dense foods, either as part of meals or exchanged as gifts (such as cookies, chocolates and cakes), and this can represent challenges to dieters(Reference Boutelle, Kirschenbaum and Baker9,Reference Yanovski, Yanovski and Sovik10) . It is unknown which diets might be easier for dieters to follow when temptation abounds.
Many weight loss diets have been formulated over the years by clinics (such as the Mayo Clinic), by companies (such as Weight Watchers) and as popular culture diets (such as the Paleo or Keto diets). The relative popularity of these disparate diets over time is difficult to judge (including their relative popularity among New Year’s resolution dieters), and determination of how long the average person adheres to the diets is also extraordinarily difficult. Clinical studies of diets suffer from researcher allegiance effects and high dropout rates(Reference Turk, Yang and Hravnak11). The experimental design of such studies (such as having volunteers regularly come to a clinic to get weighed, or for consultation(Reference Gardner, Trepanowski and Del Gobbo12)) is a likely source of bias in reported outcomes compared with those achieved by people who begin diets on their own without the supervision of a healthcare professional(Reference Turk, Yang and Hravnak11). Survey-based studies (e.g., Williamson etal.(Reference Williamson, Serdula and Anda13)) can also be biased, since respondents may lie about whether they are sticking to a diet(Reference Brenner and DeLamater14,Reference Shephard15) .
In the current study, we examined long-term trends in the popularity of several diets along with short-term dynamics of the drop out of new January dieters (NJD), using time series data on Internet searches in the USA for recipes associated with those diets. We also examined the fraction of dieters who appear to drop out during the American winter holiday season. The analysis is predicated on the assumption that people actively dieting on a particular plan would want to find recipes associated with that diet.
Our analysis uses the principles of ‘digital epidemiology’, which is a rapidly emerging paradigm that utilises the increasing availability of real-time digital data, such as Internet search trends or social media data, to track temporal and geospatial patterns in behaviours, including the spread of disease or health problems in populations(Reference Salathe, Bengtsson and Bodnar16). With 90 % of Americans accessing the Internet(17), digital data sources can provide information about disease, health and behaviour in populations that are difficult to trace using traditional surveillance methods(Reference Shephard15,Reference Salathe, Bengtsson and Bodnar16) .
Such methods have been applied in the past to diets. Markey & Markey(Reference Markey and Markey18) found that geospatial patterns in Internet searches related to diets were positively associated with geospatial patterns in negative health outcomes that are typically associated with obesity. While their analysis noted seasonality in diet-related Internet searches, it did not quantify the dropout rates of NJD, nor did it compare different diets.
In our study, we fit a mathematical model to the time series of Internet search trends for multiple diet recipes. The model captures both long-term trends in the popularity of particular diets over time and also short-term temporal dynamics of the influx of NJD and the drop out of those dieters as the year progresses. Using this model, we quantify, for the first time, the average time spent by NJD on various diets before dropout, and how this varies from diet to diet. Using the model, we also examined dieting dropout during the US winter holiday season, which begins in late November and lasts to the end of December.
Methods and materials
Data
In 2019, US News & World Report evaluated forty-one popular diets and ranked them based on the opinion of a panel of health experts as to their ease, nutrition and efficacy(19). The best weight loss diets (in descending order of ranking) were Weight Watchers, Volumetrics, Flexitarian, Jenny Craig, Vegan, Engine 2, Ornish, Raw Food, HMR Program, Mayo Clinic, SlimFast, DASH, Keto, Nutrisystem, Optavia, Vegetarian, Atkins, Biggest Loser, Eco-Atkins, Mediterranean, Nutritarian, South Beach, Asian, Spark Solution, TLC, Flat Belly, Nordic, Zone, Macrobiotic, MIND, Dukan, The Fast, Paleo, Anti-Inflammatory, Supercharged Hormone, Abs, Fertility, Glycemic-Index, Whole30, Alkaline and Body Reset diets. The expert panel of nutritionists and health experts did not conduct studies to quantitatively compare the efficacy of the diets, but rather based their rankings on their opinions of how easy the diets would likely be to adhere to and how likely they would promote long-term weight loss.
Monthly trends in the number of Google searches in the USA for recipes related to the above diets were obtained from Google Trends application programme interface (http://www.google.com/trends, accessed August 2019). Unless otherwise stated, the time series were examined between January 2004 and July 2019. Because searches for Mediterranean, Nordic and Asian recipes could be related to a search for ethnic or regional recipes rather than weight loss diets, we excluded those search terms. In addition, we excluded search terms related to Vegetarian, Vegan, Macrobiotic, Raw Food and Fertility recipes, because those diets may be associated less with weight loss and potentially more with lifestyle or philosophical commitments. For the remaining thirty-three diets, we examined Google search trends for the keywords ‘<diet name> Recipes’. We also examined search activity for recipes for more generic diets by examining the keywords ‘Low Carb Recipes’ and ‘Low Fat Recipes’. The keyword search terms were chosen under the supposition that people searching for recipes related to a particular diet were on that diet.
The resultant data for the seven most popular diet recipes (as ranked by Internet search activity) are shown in Fig. 1. The data provided by Google Trends were normalised to the total search volume on Google, and thus the data were relative and not absolute. In addition, the number of searches per month was normalised to the maximum number of searches related to all search terms examined in this analysis, times 100.
Google Trends Internet search data for keyword search terms related to diet recipes. The monthly number of searches for all keywords is normalised to the maximum number of monthly searches among all keywords, times 100. Only diets for which the relative monthly number of searches was more than ten at least once between January 2004 and July 2019 are shown
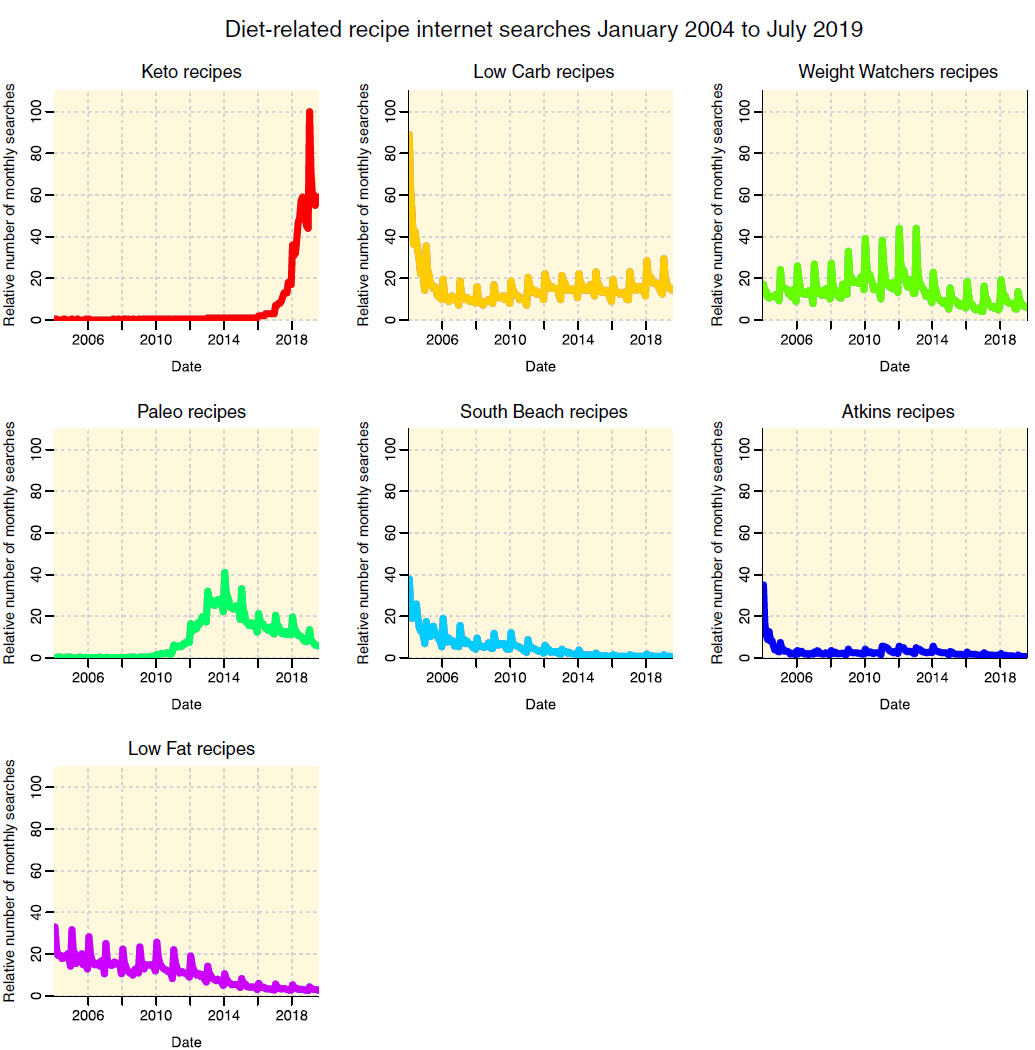
Searches for recipes related to the Keto diet have surged in recent years, and the most searches for diet recipe keywords were for ‘Keto Recipes’ in January 2019. However, only in recent years has the Keto diet become popular; in order to obtain reasonable estimates of both long- and short-term trends, approximately 5 years of data related to a particular search term are necessary. Thus, we excluded search terms related to this diet from further consideration in the analysis.
The other data shown in Fig. 1 are for the keywords Low Carb Recipes, Weight Watchers Recipes, Paleo Recipes, South Beach Recipes, Atkins Recipes and Low Fat Recipes. For all other diet search terms, the maximum relative number of monthly searches over the previous 15 years was 10 or less, leading to insufficient data to which to reliably fit for long- and short-term trends (in fact, twenty-two of the remaining twenty-eight diets had a monthly maximum relative number of searches of one or fewer). Because we used Least Squares regression methods to fit to the sources of data in this analysis (see the next section), in order to obtain unbiased model parameter estimates and confidence intervals, the stochasticity in the data must be approximately normally distributed about the expected mean(Reference Neter, Kutner and Nachtsheim20). Because the monthly number of search terms is left truncated at zero, the Least Squares assumptions were violated for unpopular diets where the relative number of search terms was at (or close) to zero for many months.
In addition, long-term trends that too dramatically rise or fall at the beginning or end of the time series can mask short-term trends (particularly trends associated with NJD). As seen in Fig. 1, such steep temporal patterns were evident at the beginning of the time series data for Low Carb Recipes, South Beach Recipes and Atkins Recipes. To avoid biases, these patterns might cause in the determination of short-term patterns, we took the data from 2006 onwards, by which point the long-term trends did not vary widely from year to year. Unfortunately, the data for Atkins Recipes were too sparse after that point to permit reliable fitting, and thus we excluded that diet from further consideration.
As seen in Fig. 1, Internet searches for Paleo Recipes only began to significantly rise around the beginning of 2011; thus, we restricted the analysis to that time frame forward. In addition, by 2016, Internet searches for South Beach Recipes had largely ceased; therefore, we restricted the analysis of that data to before that time period.
Mathematical model
For all diets in Fig. 1, the data show distinctive seasonality: every January there is a sharp increase in diet recipe searches, followed by a decline to the summer months. At the end of each year, there is usually a further distinct decline in the number of diet recipe searches (coinciding with the US winter holiday season from late November to the end of December). Baseline long-term trends in searches for diet recipes included people who are dieting regardless of the time of year.
Assuming an exponential decline in NJD over time who had been initially inspired to try a diet as part of their New Year’s resolution, the model for the temporal trends in the predicted number of recipe searches is
 $${y^{pred}}\left( t \right) = {y^{base}}\left( t \right)\left( {1 + A{e^{ - ({{m - 1} )/B}}} + C{I_{11}} + D{I_{12}}} \right),$$
where y base (t) captures the baseline long-term trends, modelled with a spline, and the second term describes the short-term trends relative to the long-term patterns, where m is the month of year (from 1 to 12), A, B, C and D are model parameters, I 11 = 1 when m = 11 (i.e., November) and is zero otherwise, and I 12 = 1 when m = 12 (i.e., December) and is zero otherwise. The parameter A is the relative increase in NJD each year over baseline, and B is the average time NJD spend on the diet before stopping the diet (dropping out). The parameters C and D refer to the relative change in the number of dieters during November and December, respectively.
Inspiration to try a particular diet is akin to a contagion process (i.e. an individual is ‘infected’ with the idea to attempt a particular diet, e.g., through exposure to information from friends, family or media)(Reference Dodds and Watts21). The assumption of exponential decay in New Year’s resolution dieters is thus drawn from typical epidemiological models of contagious processes, which assume that the probability distribution for time spent in the ‘infected’ state is exponentially distributed(Reference Brauer and Castillo-Chavez22).
We used Least Squares regression to fit the parameters A, B, C and D to each set of diet recipe Internet search time series. The number of df, ν, in the spline formulation of y base (t) was varied from half the number of years of data under consideration to twice the number of years. The number of df for the final model was chosen from the model that provided the lowest Akaike Information Criterion statistic(Reference Akaike23).
The earlier study by Markey & Markey(Reference Markey and Markey18) examined temporal trends associated with Internet searches for keywords related to diets between 2005 and 2011(Reference Markey and Markey18). They fit a model to the time series data that corrected for long-term trends, and with short-term seasonal trends modelled as a linear trend in month of the year (although their analysis noted significant seasonality in diet-related searches, it did not assess the average dropout time of NJD). Effectively, their model was equivalent to
 $${y^{pred}}\left( t \right) = {y^{base}}\left( t \right)\left( {1 + \beta m} \right),$$
where β was the linear dependence on m, the month of year. We additionally fit this alternative model to the data to determine whether their model fits the data better compared with the model of equation (1), based on comparison of the Akaike Information Criterion of the two models.
Results
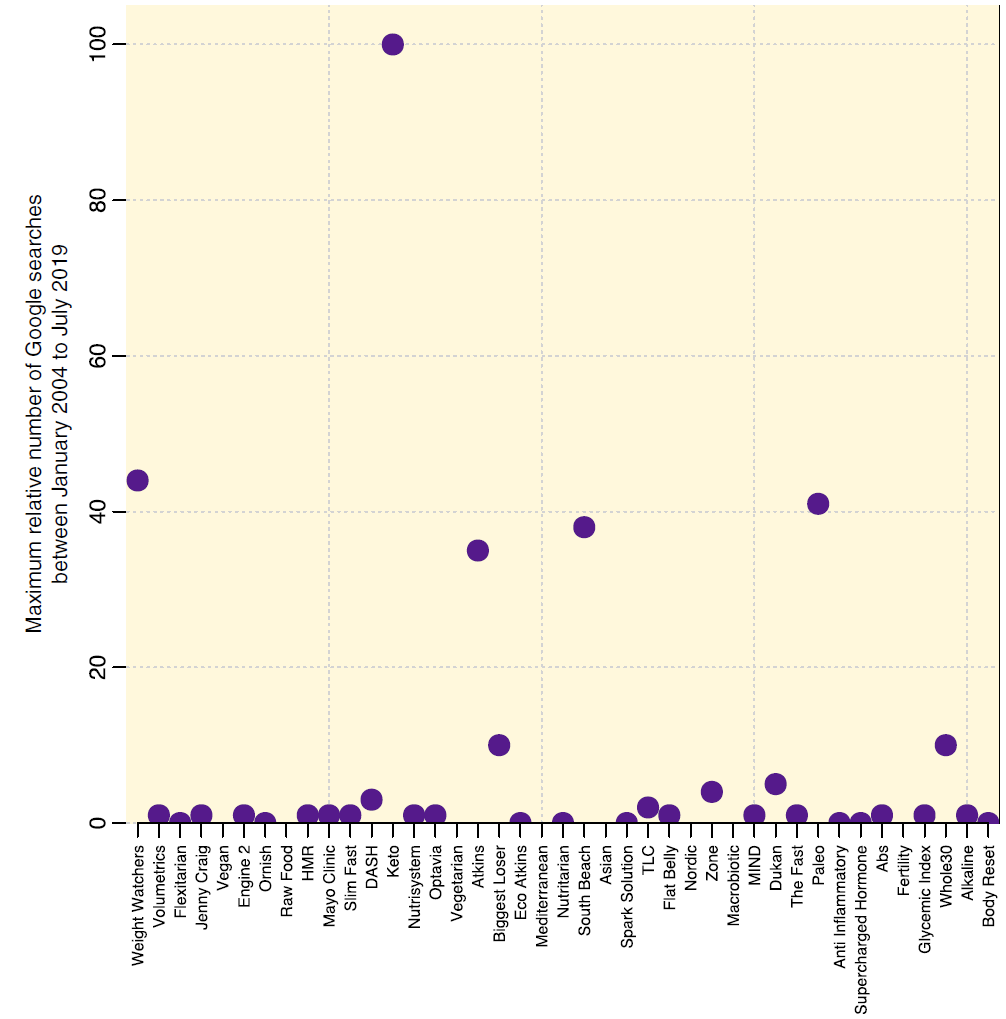
In Fig. 2, for each of the keyword search terms related to diet recipes, we show the maximum of the relative monthly number of Internet searches between January 2004 and July 2019 v. the 2019 ranking by US News & World Report health experts of the diet for nutrition and weight loss. With the possible exception of the Weight Watchers diet, there is no discernible relationship between the expert ranking and the Internet search popularity of recipes for each diet.
Maximum relative number of Internet searches for keyword search terms related to recipes for diets between January 2004 and July 2019, v. the 2019 ranking by US News & World Report health experts of each diet for nutrition and weight loss, listed from best to worst. The monthly number of searches for all keywords is normalised to the maximum number of monthly searches among all keywords, times 100
The best-fit parameter values of equation (1) for each data sample are shown in Table 1 and graphically summarised in Fig. 3. There were significant differences in the average persistence of NJD (P = 0·007, Pearson’s χ 2 with 4 df). The Weight Watchers, Paleo and Low-Carb diets evidenced statistically consistent average compliance times among NJD (P = 0·84, Pearson’s χ 2 with 2 df) and were the three best diets for length of persistence or compliance. The South Beach diet had the worst compliance duration and was significantly worse than all other diets (P = 0·02, one-sided Z test).
Results of fits of the parameters of the model of equation (1) to diet recipe-related Internet search data

The parameter A is the relative increase in new January dieters (NJD) each year over the baseline long-term trends, and B is the average time NJD spend on the diet before dropping out (shown here in months). The parameters C and D are the relative change in the number of dieters during November and December, respectively.
Best-fit parameters of the model of equation (1) to the time series of Internet searches for recipes related to various diets. The parameter A is the relative increase in new January dieters each year over baseline, and B is the average time new January dieters spend on the diet before dropping out. The parameters C and D are the relative change in the number of dieters during November and December, respectively. The vertical bars represent the one standard deviation uncertainty on the parameter estimate
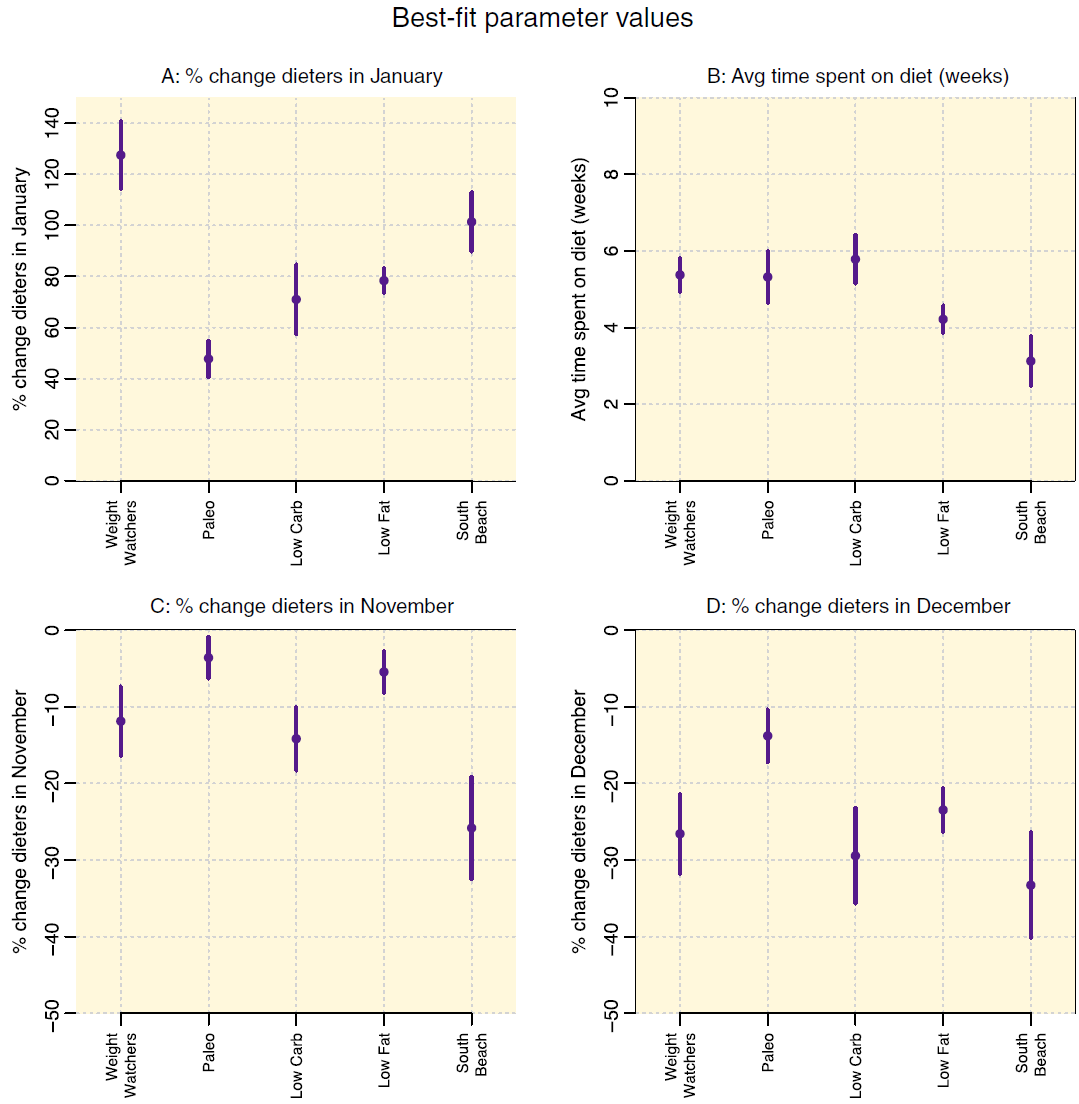
All diets except the Paleo diet had dropout rates significantly higher than zero in November (P < 0·05, one-sided Z test). There were significant differences among the November dropout rates (P = 0·005, Pearson’s χ 2 with 4 df). The November dropout rates of the Weight Watchers, Paleo, Low Carb and Low Fat diets did not significantly differ (P = 0·10, Pearson’s χ 2 with 3 df), but the November dropout rate of the South Beach diet was significantly worse than that of the other diets (P = 0·015, one-sided Z test).
All diets had dropout percentages significantly above zero in December (P < 0·05, one-sided Z test). There were also significant differences among the December dropout rates of all diets (P = 0·02, Pearson’s χ 2 with 4 df). The December dropout rates of the Weight Watchers, Low Carb, Low Fat and South Beach diets were similar (P = 0·47, Pearson’s χ 2 with 3 df), but the December dropout rate of the Paleo diet was significantly lower than that of the other diets (P = 0·008, one-sided Z test).
We combined the P-values of the statistical comparison tests of the time to drop out of NJD and the November and December dropout rates for each of the diets. That analysis reveals that the Paleo diet performed significantly better than other diets for this combination of indicators (Fisher’s combined P = 0·017(Reference Fisher24)), and the South Beach diet performed significantly worse (Fisher’s combined P = 0·003).
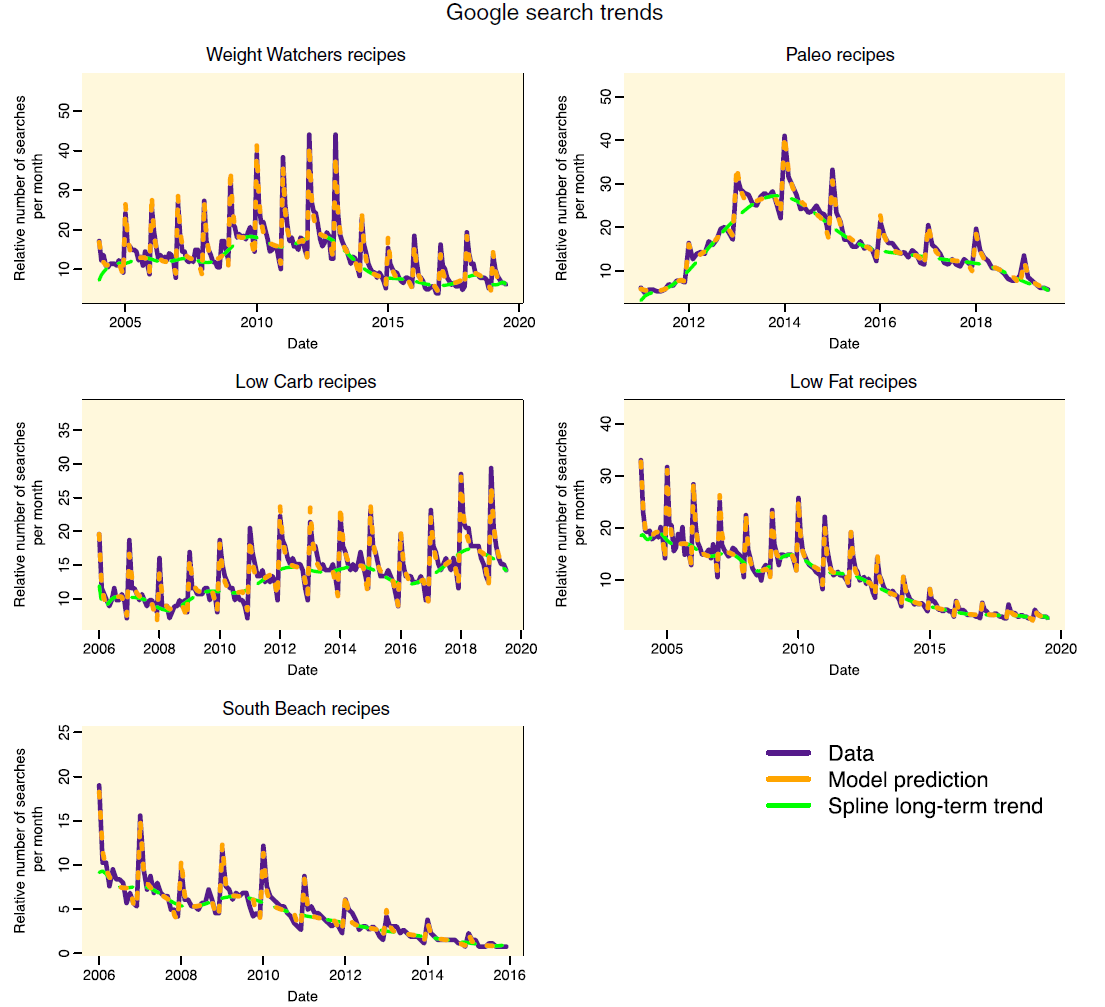
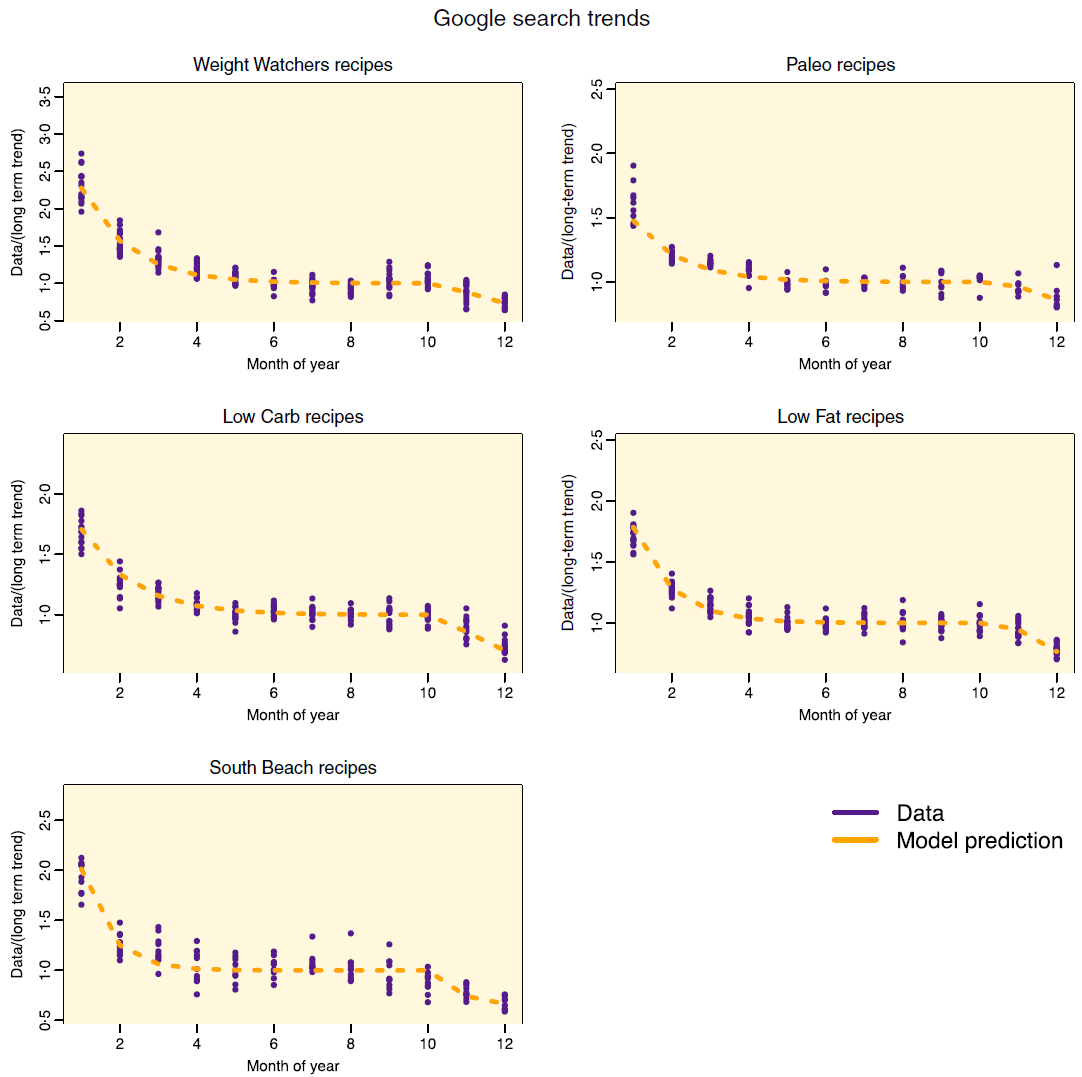
The model fits of equation (1) to the time series data are shown in Fig. 4. For all diets, the R 2 of the best-fit model was >95 %. In Fig. 5, we show the data, divided by the estimated long-term trends, by month, with the best-fit short-term trends overlaid (according to the second term in equation (1)). In all cases, the short-term model provided a reasonable description of the short-term trends in the data.
Google Trends Internet search data for keyword search terms related to recipes for diets. The monthly number of searches for all keywords is normalised to the maximum number of monthly searches among all keywords, times 100. The green line represents the spline estimate of the long-term trends in the number of searches (the first term in equation (1)). Overlaid in orange is the best-fit model of equation (1) that includes the long-term trends and also the short-term trends due to drop-out of new January dieters (modeled with an exponential decline after January 1st), and also diet drop-outs during the US holiday season in November and December. For all diets, the R 2 of the best-fit model is greater than 95 %
Google Trends Internet search data by month for keyword search terms related to recipes for diets, divided by the best-fit long-term trends from equation (1). Overlaid in orange is the second term of the best-fit model of equation (1) that includes the short-term trends due the drop-out of new January dieters (modeled with an exponential decline after January 1st), and also diet drop-outs during the US holiday season in November and December
For all data sets, the best-fit model of equation (1) was obtained when the number of df, ν, used in the spline estimate of the long-term trend was approximately 1·5 times the number of years of data. The parameter values were fairly insensitive to the value of ν in the vicinity of the best fit (i.e., the variation in the best-fit parameter for different values of ν was much less than the average statistical uncertainty on the parameter estimates from the fits).
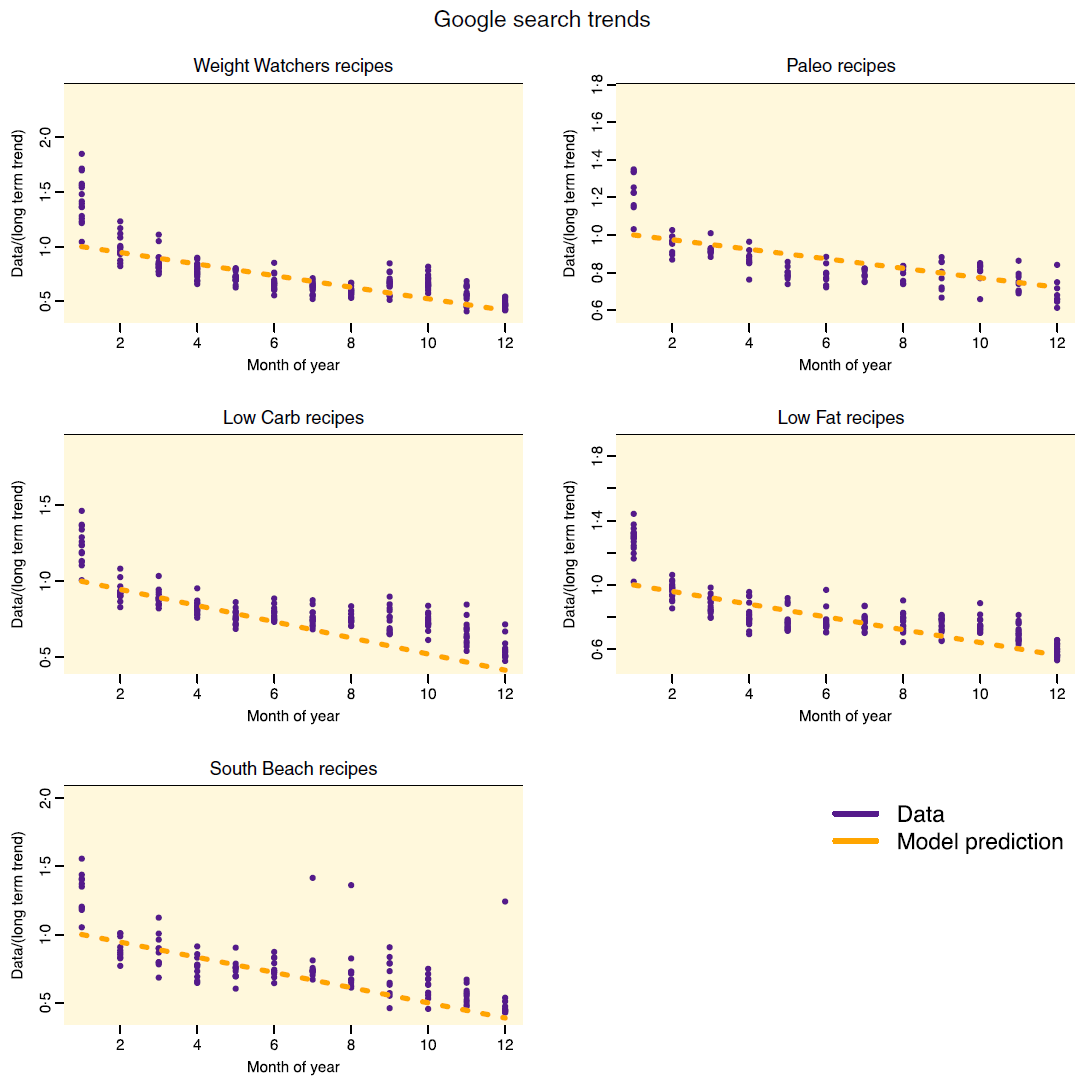
For all data sets, the model of equation (1), which assumed an exponential decline in NJD, fits the data better (resulting in a lower Akaike Information Criterion) than the model of equation (2) (derived from reference (Reference Markey and Markey18)), which assumed a linear decline in those dieters. Compare Fig. 5 with Fig. 6 to visualise the quality of fit of the two models; for all diets, the linear model of equation (2) consistently underestimated the number of NJD compared with the exponential model of equation (1).
Google Trends Internet search data by month for keyword search terms related to recipes for diets, divided by the best-fit long-term trends from the model in equation (2) (which is similar to that used by Marky & Markey(Reference Markey and Markey18)). Overlaid in orange is the second term of the best-fit model of equation (2) that includes the short-term trends due to drop-out of new January dieters, modeled with a linear decline after January 1st. For all diets, the linear model consistently under-estimated the number of January dieters, and the exponential decline model of equation (1) provides a better fit to the data (see Fig. 5)
Discussion
Obesity is a persistent and prevalent problem in the USA(Reference Ogden, Carroll and Fryar25), affecting millions of Americans and costing billions of dollars in direct medical costs and lost productivity(Reference Wolf and Colditz26). However, there is a dearth of comprehensive studies comparing the relative efficacy of competing diets and their adherence ease. In the current study, we applied principles of digital epidemiology to track temporal patterns in dieting behaviours in the American population. We examined trends in Internet searches in the USA for recipes associated with different popular diets using the Google Trends(Reference Carneiro and Mylonakis27–Reference Nuti, Wayda and Ranasinghe29). We found that the most popular diets associated with recipe searches since 2004 were the Keto, Low Carb, Weight Watchers, Paleo, South Beach, Atkins and Low Fat diets. For all diets, the temporal trends evidenced distinct annual patterns, with a sharp increase in January, followed by a decline to the summer months and a further abrupt decline in November and December. We fit a mathematical model to these Internet recipe searches, where the model incorporated long-term trends in the number of dieters, along with short-term trends associated with NJD and their subsequent dropout, and also diet dropouts during the US winter holiday season. Unfortunately, the Keto and Atkins diets did not result in sufficient time series data to which to reliably fit. Hence, our analysis focused on the Low Carb, Weight Watchers, Paleo, South Beach and Low Fat diets.
A significant proportion of American dieters appeared to stop dieting during the US holiday season in November and December. For all diets studied, 5–25 % of dieters appear to drop out in November, and 15–30 % of dieters appear to drop out in December. The lowest holiday season dropout rates were seen for the Paleo diet (with December dropout rate 14 ± 3 %), and the highest were seen for the South Beach diet (with December dropout rate 33 ± 7 %). This is in broad concordance with the study by Yanovski etal.(Reference Yanovski, Yanovski and Sovik10), who found that adults significantly gained weight during the US winter holiday season, but tended to not gain significant weight during the rest of the year.
Weight Watchers evidenced a significantly larger jump in dieters every January compared with the other diets we studied, with a net increase of almost 130 % at the beginning of each new year. This pattern may reflect the effect of media advertising for that diet near the end of each year. The Weight Watchers diet had among the longest average compliance times spent by NJD of the diets we studied (over 5 weeks). The Mayo Clinic website rates the Weight Watchers diet as potentially sustainable for the long term because it emphasises permanent lifestyle changes(30).
Among the diets we studied, the Paleo diet also had among the longest average times spent by NJD before dropout (over 5 weeks, similar to the Weight Watchers and Low Carb diets) and also had the lowest dropout rates during the winter holiday season (<5 % dropping out in November and <15 % dropping out in December). The Paleo diet typically includes vegetables, fruits, nuts, roots and meat and typically excludes foods such as dairy products, grains, sugar, legumes, processed oils, salt, alcohol and coffee. The diet is based on eating foods available to hunter-gatherer humans before the advent of agriculture. Overall, except for a potential deficiency in Ca due to the exclusion of dairy products, the diet is considered by experts to be healthy(Reference Obert, Pearlman and Obert31–Reference Ghaedi, Mohammadi and Mohammadi33). The wide variety of foods (including energy-dense foods) that can be eaten on the Paleo diet may explain the low dropout rate during the winter holiday season and the long compliance time among NJD(Reference Phillips and Chapman34,Reference Katz and Meller35) .
The South Beach diet appeared to have the shortest time before dropout among NJD (only around 3 weeks) and the highest dropout rate during the holiday season (around 25 % in November and over 30 % in December). This pattern may reflect difficulties in following the diet, while the diet purports to focus on nutrient-rich, high-fibre carbohydrates, lean sources of protein, fats and low-fat dairy, the initial phase of the diet involves elimination of all carbohydrates for 2 weeks(Reference Agatston36). While low-carbohydrate diets can yield faster initial weight loss compared with diets such as low-fat diets (even though long-term results are similar(Reference Hall and Chung37)), side effects of extreme low-carbohydrate diets can include headaches, halitosis, muscle cramps, diarrhoea, general weakness and rash(Reference Astrup, Larsen and Harper38–Reference Chalasani and Fischer40).
The Low Carb diet showed the longest time spent among NJD before dropout (almost 6 weeks), but had the second highest dropout rates in November and December among the diets studied (15 and 30 %, respectively). An excess of sugary and energy-dense foods is typically consumed during the winter holiday season in America(Reference Yanovski, Yanovski and Sovik10,Reference Stevenson, Krishnan and Stoner41) , which may make low-carbohydrate diets difficult to follow during that period.
Although our model can be used to determine the average duration of adherence among NJD (or at least duration of searches for recipes related to that diet), the data do not provide any specific information about the individuals performing the Internet searches, including their age, gender, race/ethnicity, weight loss goal, whether they switched between diets or their reasons for ceasing to search for recipes related to a diet. For example, individuals may have collected a sufficient number of recipes related to a diet, and overtime may cease searching for new recipes even if they remain on the diet (however, this does not explain the significant drop in diet-related recipe searches in November and December). Conversely, many individuals may have stopped searching for recipes because they dropped the diet. For example, the diet may have proven too difficult to follow, they lost interest in it(Reference Kassirer and Angell5), the diet was too expensive (for an assessment of costs related to different diets, see(42)) or they may have reached their goal weight. However, given that the average American dieter wants to lose around 20 pounds(Reference Mueller, Hurt and Abu-Lebdeh43), and the average weight loss achieved in standard behavioural weight loss programmes is a few pounds per month(Reference Wing and Phelan44); it seems unlikely that the bulk of people who dropped out within a few weeks of starting the diet did so because they had achieved their goal (and again, this does not explain the significant drop in dieters in November and December).
It is also unknown whether the dieting dynamics of NJD are representative of people who begin to diet throughout the year (e.g., due to a change of lifestyle perhaps triggered by a critical medical issue such as a heart attack or the onset of diabetes(Reference Wing and Phelan44)). Further study is needed, at the individual level, to determine if New Year’s resolvers differ from other groups of self-changers in their length of diet adherence, general success with diets and in the types of chosen diets. In particular, the individual characteristics associated with length of diet adherence and ability to maintain lost weight are not unveiled by the current study. Hence, our analysis does not reveal information about longer-term diet adherence and weight loss maintenance.
Our model assumed exponential decline in NJD who had been initially inspired to diet as part of a New Year’s resolution. As mentioned in ‘Mathematical model’ section, the assumption of exponential decay in New Year’s resolution dieters is drawn from typical epidemiological models of contagious processes, which assume that the probability distribution for time spent in the ‘infected’ state is exponentially distributed(Reference Brauer and Castillo-Chavez22). We found that this model fits the data significantly better than one that assumed a simple linear decline in such dieters (e.g., Markey & Markey(Reference Markey and Markey18)). However, there is the possibility that an even more complex probability distribution underlies the time to drop out of NJD, just as more complex probability distributions may underlie time spent in the infected state in disease models(Reference Feng, Xu and Zhao45). This is an interesting avenue for future research, but requires data more finely binned than the monthly data available from Google Trends when the data span more than a year.
From an epidemiological perspective, the long-term trends associated with some of the diets in Fig. 1 manifest the characteristic shape of an outbreak of contagious diseases (the ‘epidemic curve’(Reference Wilson and Burke46)). This indicates that the long-term patterns for some of these diets may indeed be driven by a contagious process whereby people are ‘infected’ with the idea to try a particular diet by what they see in the media or hear from their friends or family(Reference Dodds and Watts21). Interest in some diets clearly wane over time as new fad diets become popular, supplanting the old fad diets. Modelling the long-term trends using a mathematical model of contagion presents an interesting avenue for future research, as such analyses can potentially determine how ‘contagious’ a particular diet is.
We did not find an apparent relationship between the relative popularity of recipe searches associated with particular diets and the ranking of those diets by health experts. At the same time, we focused on one spelling for each of the diets examined, and it may be possible that alternate spellings (or misspellings) were used by people searching for recipes. Thus, the relative number of searches associated with recipes for those diets may not be completely indicative of the relative popularity of those diets. However, it is interesting that the lack of association we see between expert rankings and apparent popularity of diets mirrors the lack of association between sales of self-help books and expert rankings of those books(Reference Norcross, Campbell and Santrock47). While experts carefully weigh the evidence and health impacts associated with each diet, unfortunately many people instead focus on the hype of each new fad diet, with the hope of it being a ‘magic bullet’ for weight loss(Reference Moyad48,Reference Best49) . Given the tendency of the public to want to try fad diets, analyses such as ours, which passively track the apparent dieting behaviours of an entire population (at least the 90 % with Internet access), can help inform healthcare professionals as to which of the most popular diets may be easiest for their patients to follow and may help guide the public in choosing optimal diet programmes.
Summary
We applied principles of digital epidemiology to passively monitor temporal patterns in dieting behaviours in the American population by tracking trends in Internet searches for recipes related to several popular diets. The analysis was predicated on the assumption that people searching for recipes associated with a particular diet were on that diet. A mathematical model successfully fits the 2004–2019 data, in which the model incorporated long-term trends in the number of dieters, short-term trends associated with NJD and their subsequent dropout and also diet dropouts during the US winter holiday season. This is the first analysis of its kind to use passive surveillance to compare compliance characteristics of different weight loss diets.
We found significant differences between diets. For example, the Paleo diet evidenced the longest compliance times among NJD and the lowest dropout rates during the holiday season. In contrast, the South Beach diet demonstrated the shortest compliance time among NJD and the highest dropout rates during the holiday season.
Acknowledgements
Acknowledgements: None. Financial support: S.T., C.M., M.G.N.Z., J.A.M.P., M.T., J.A.M.P. and C.C.C. were supported by the National Security Agency (NSA – Grant H98230-J8-1-0005), the Office of the President of ASU and the Office of the Provost at ASU. C.C.C. was additionally supported by the Data Science Initiative at Brown University. Conflict of interest: All authors declare no conflicts of interest. Authorship: S.T. conceived of the analysis. A.M., C.C.C. and J.C.N. provided contextual guidance. S.T., S.C., E.I., C.M., M.G.N.Z., J.A.M.P., D.S., M.T. and J.V.M. performed the modelling analysis. All authors contributed to the writing and editing of the manuscript. Ethics of human subject participation: The current study was conducted according to the guidelines laid down in the Declaration of Helsinki. Because all data used were publicly available, anonymous, aggregated data, and human subject research approval was not necessary.



