

High intake of dietary fibre has been inversely related to intestinal inflammation( Reference Nielsen, Theil and Purup 1 , Reference Lallès 2 ). Regardless of the type of fibre, its consumption modulates the microbial community composition and enhances intestinal fermentation, with SCFA being the major fermentation products( Reference Kaiko and Stappenbeck 3 ). Microbial metabolites and microbiota-associated molecular patterns (MAMP) have been recognised as the main mechanisms through which microbes communicate with the intestinal mucosa( Reference Kaiko and Stappenbeck 3 , Reference Frosali, Pagliari and Gambassi 4 ). Besides acting as an energy source for colonic epithelial cells, SCFA exert anti-inflammatory properties by inhibiting histone deacetylases( Reference Hinnebusch, Meng and Wu 5 ) and serve as agonists for G-protein receptors( Reference Brown, Goldsworthy and Barnes 6 ), which are important modulators of gut homoeostasis and inflammatory processes( Reference Miyamoto, Hasegawa and Kasubuchi 7 , Reference McKenzie, Tan and Macia 8 ). Concurrently, the intestinal microbiota is a rich source of immune-reactive molecules, such as lipopolysaccharides and lipoteichoic acids, which stimulate innate immune sensors including toll-like receptors (TLR)( Reference Kaiko and Stappenbeck 3 , Reference Frosali, Pagliari and Gambassi 4 ).
As a type of soluble fibre, resistant starch (RS) has been reported to decrease large intestinal inflammation by down-regulating the expression of inflammatory mediators, such as pro-inflammatory TNF-α and NF-κB( Reference Nielsen, Theil and Purup 1 , Reference Liu, Upadhyaya and Fardin-Kia 9 ), and enhancing the expression of nuclear transcription factor PPAR-γ ( Reference Haenen, Souza da Silva and Zhang 10 ). In being resistant to digestion by mammalian enzymes in the small intestine, RS is highly fermentable for amylolytic bacteria in the hindgut( Reference Haenen, Zhang and Souza da Silva 11 ). The beneficial effect of RS on host physiology may, therefore, encompass SCFA-derived attenuation of intestinal inflammation( Reference Nielsen, Theil and Purup 1 , Reference Liu, Upadhyaya and Fardin-Kia 9 , Reference Upadhyaya, McCormack and Fardin-Kia 12 ). For the five RS types, most evidence for immunomodulatory abilities exists for RS2 (granular and high amylose starches) and RS3 (retrograded starch)( Reference Nielsen, Theil and Purup 1 , Reference Haenen, Souza da Silva and Zhang 10 ), whereas less has been reported about anti-inflammatory properties of RS4( Reference Nielsen, Theil and Purup 1 , Reference Liu, Upadhyaya and Fardin-Kia 9 ). The RS4, which are chemically modified starches obtained by cross-linking or by addition of chemical derivatives, have received more attention lately due to their neutral and adaptable organoleptic and textural properties, allowing for the replacement of digestible starches in processed foods without affecting food selection( Reference Birt, Boylston and Hendrich 13 ). Due to their specific molecular structure, RS4 are little susceptible to host enzymatic digestion( Reference Birt, Boylston and Hendrich 13 ). However, little is known whether cross-linking may render the starch less or more easily fermentable for intestinal microbes. In pigs, we recently showed that different bacteria utilised enzymatically modified starch in the caecum and transglycosylated starch (TGS) in gastric, ileal, caecal and proximal and mid-colonic content as a substrate compared with RS2 and RS3( Reference Metzler-Zebeli, Schmitz-Esser and Mann 14 , Reference Newman, Zebeli and Velde 15 ), which may have consequences for microbe-host signalling. Moreover, with the main intestinal site of fermentation being the large intestine, available data for immunomodulatory capabilities and effects on the barrier function of RS in the small intestine are generally scarce.
In this short-term study, the main aim was to investigate the effect of TGS consumption on the jejunal barrier function and expression of genes related to inflammation, barrier function and the mucosal defence in the jejunum, ileum, caecum and colon using healthy, non-challenged pigs as a model. We hypothesised that, via alterations in fermentation metabolites and MAMP profiles, TGS consumption may reinforce the small intestinal integrity and down-regulate innate immune signalling pathways in the small and large intestine compared with rapidly digestible starch. In order to prove our hypothesis, we further re-analysed SCFA and bacterial community data( Reference Newman, Petri and Grüll 16 ) to illustrate intestinal microbiota-host interactions in the ileum, caecum and colon.
Methods
Experimental design, animals and housing
All procedures involving animal handling and treatment were approved by the institutional ethics committee of the University of Veterinary Medicine Vienna and the national authority according to paragraph 26 of Law for Animal Experiments, Tierversuchsgesetz – TVG (GZ 68.205/0063-WF/II3b/2014). The detailed experimental design has been described in Newman et al.( Reference Newman, Petri and Grüll 16 ), and intestinal samples from the same pigs were used in the present work. In brief, sixteen Large White, male growing pigs (age: 4 months; initial body weight: 45·4 (sd 5·8) kg) were randomly assigned to one of two diets in a randomised design with two blocks with four animals per treatment in each block( Reference Newman, Petri and Grüll 16 ). Pigs were individually fed and housed in metabolism pens (1·20×1·00 m) with Plexiglas walls to allow visual contact. Each cage contained one nipple drinker with free access to demineralised water, one feeder and one heating lamp. Before the experiment, pigs were allowed a 3-d environmental adaptation.
Diets and feeding
All pigs were fed a commercial cereal-based grower diet (metabolisable energy, 13·4 MJ/kg; crude protein, 16·8 % as-fed basis) before the start of the experiment( Reference Newman, Petri and Grüll 16 ). Experimental diets were formulated to meet or exceed current recommendations for nutrient requirements of growing pigs( 17 ). The two diets were identical except for the starch component (Table 1). The control starch (CON) diet comprised a rapidly digestible waxy maize starch (Agrana Research & Innovation Center GmbH (ARIC)), whereas in the TGS diet 50 % of the native waxy maize starch was replaced by TGS (ARIC). The TGS was prepared via an acid-catalysed transglycosylation of the native waxy maize starch, which rearranges the glycosidic bonds that are present in the native waxy maize starch. As a result, the TGS product had eight types of glycosidic bonds: α(1,2), α(1,3), α(1,4), α(1,6), β(1,2), β(1,3), β(1,4) and β(1,6)-glycosidic bonds and comprised a total dietary fibre content of 50 %. The experimental diets were fed for 10 d. Pigs were manually fed three times daily, 08.00, 11.00 and 16.00 hours to mimic human meal patterns. Initially, feed allowances were calculated to meet four-times the maintenance energy requirement (3×461 kJ digestible energy/kg BW0·75)( 17 ). Care was taken that feed allowances surpassed pig’s appetite in order not to restrict the feed intake at meal times. Feed spillage and leftovers in feeding bowls were collected after feeding. Diets were analysed for DM (method 3.1), crude protein (N×6·25 by the Kjeldahl method; method 4.1.1), Ca (method 10.3.2), P (method 10.6.1)( 18 ) and starch. To measure the total starch content of the TGS diet, the soluble TGS was leached out of the samples and treated with perchloric acid. The resulting glucose was measured using HPLC (Ultimate 3000; Thermo Fisher Scientific) equipped with an Aminex HPX-87H separation column (Bio-Rad) and a Refratomax 520 detector (Thermo Fisher Scientific). The total starch content of the control diet was determined via the UV method (Enzymatic BioAnalysis; R-Biopharm) using a spectrophotometer (DR 2800; Hach Lange GmbH). Gross energy of diets was measured using an isoperibolic bomb calorimeter (C200; IKA-Werke GmbH and Co. KG), with benzoic acid as a calibration standard.
Ingredients and chemical composition of the control (CON) diet and transglycosylated starch (TGS) diet
* Agrana Research & Innovation Center GmbH.
† FibreCell (Agromed Austria GmbH).
‡ Provided per kg of complete diet (GARANT GmbH): 16 000 IU (4800 µg) of vitamin A, 2000 IU (50 µg) of vitamin D3, 125 mg of vitamin E, 2·0 mg of vitamin B1, 6·0 mg of vitamin B2, 3·0 mg of vitamin B6, 0·03 mg of vitamin B12, 3·0 mg of vitamin K3, 30 mg of niacin, 15·0 mg of pantothenic acid, 900 mg of choline chloride, 0·15 mg of biotin, 1·5 mg of folic acid, 200 mg of vitamin C; 4·6 g of Ca, 2·3 g of digestible P, 2·4 g of Na, 2·0 g of Cl, 3·2 g of K, 1·0 g of Mg; 50 mg of Mn (as MnO); 100 mg of Zn (as ZnSO4); 120 mg of Fe (as FeSO4), 15·6 mg of Cu (as CuSO4), 0·5 mg of Se (as Na2SeO3), 1·9 mg of iodine (as Ca(IO3)2).
§ Total starch in CON diet determined by enzymatic-spectrophotometric assay (R-Biopharm) and in TGS diet by perchloric acid treatment of samples and measurement of resulting glucose using HPLC( Reference Newman, Petri and Grüll 16 ).
Sample collection
Pigs were sampled 2 h after the morning feeding on the last experimental day. After sedation (Narketan, 10 ml/kg body weight; Ketamine HCl; Vétoquinol AG; and Stresnil, 3 ml/kg body weight; Azaperone; Biokema SA), pigs were euthanised by intracardiac injection of T61 (10 ml/kg; Embutramide; MSD Animal Health) and the abdominal cavity was opened. The gastrointestinal tract was ligated at the oesophagus and rectum and removed from the abdomen. The small and large intestines were identified and isolated, by carefully dissecting them from the mesentery. The small intestine was divided in half to identify the mid-jejunum. Intestinal segments (jejunum, ileum, caecum and mid-colon) were opened at the mesentery and the total luminal content was collected, homogenised, and stored on ice until long-term storage at −80°C. These intestinal segments were thoroughly washed in ice-cold PBS, and the mucosa from 20-cm long intestinal pieces was scraped off using a glass microscope slide. Mucosa samples were immediately snap-frozen in liquid N2 and stored at −80°C for subsequent RNA isolation. In considering the longitudinal distribution of the Peyer’s patches in the ileum, those areas as well as the secretive and absorptive area of the ileal mucosa were scraped and homogenised before snap-freezing. Due to the size of the caecum, the mucosal surface on the right side of the mesenterium was scraped. Concurrently, a 20-cm segment from the mid-jejunum, proximal to the gene expression sample, was collected for electrophysiological and permeability marker measurements using the Ussing chamber technique and immediately transferred into ice-cold transport buffer which was pre-gassed with carbogen (95 % O2 and 5 % CO2).
Intestinal barrier function
Electrophysiological measurements were carried out as previously described( Reference Metzler-Zebeli, Lawlor and Magowan 19 ). Four successional samples prepared from the distal 10 cm of the jejunal segment were evaluated in parallel. Jejunal pieces were opened at the mesentery, rinsed with transport buffer and stripped of the outer serosal layers (Tunica serosa and Tunica muscularis). Small segments with an exposed area of 0·91 cm2 were mounted in the Ussing chambers, gassed with carbogen (95 % O2–5 % CO2) and kept at 38 °C. Each Ussing chamber was connected to a pair of dual channel current and voltage electrodes (Ag–AgCl) which were submerged in 3 % agar bridges filled with 3 m potassium chloride. After an equilibration under open-circuit conditions for 20 min, the tissue was short-circuited by clamping the voltage to zero. The potential difference (mV), short-circuit current (Isc, µA/cm2) and transepithelial resistance (Ω×cm2) were continuously recorded using a microprocessor-based voltage-clamp device and software (version 9.10; Mussler, Microclamp). Fluorescein 5(6)-isothiocyanate (FITC, final concentration: 0·1 mmol/l; Sigma-Aldrich) and horse-radish peroxidase (HRP, final concentration: 1·8 µmol/l; Carl Roth GmbH+Co. KG) were added 5 min after short-circuiting the tissue to assess the paracellular permeability. To measure marker flux rates solution samples from the basolateral side were taken at 60, 120 and 180 min, whereas solution samples from the mucosal side were collected at 70 and 170 min after marker addition. At the end of the experiment (185 min after the voltage clamp), theophylline (inhibitor of the phosphodiesterase; final concentration, 8 mm) was added to both chamber sides to monitor tissue vitality. The FITC and HRP concentrations in mucosal and serosal buffers were analysed and mucosal-to-serosal flux rates of FITC and HRP were calculated( Reference Metzler-Zebeli, Lawlor and Magowan 19 ).
RNA isolation and quantitative reverse transcription PCR
For RNA isolation, 20 mg of frozen mucosal scrapings were combined with lysis buffer (Qiagen) and autoclaved ceramic beads (0·6 g; 1·4 mm; VWR)( Reference Newman, Petri and Grüll 16 ). Samples were homogenised using the FastPrep-24 instrument (MP Biomedicals) and RNA was isolated. RNA isolates were treated with DNase I (Turbo DNA kit; Life Technologies Limited) to remove genomic DNA. The RNA was quantified using the Qubit HS RNA Assay kit on the Qubit 2.0 Fluorometer (Life Technologies) and the quality of extracted RNA was evaluated with the Agilent Bioanalyzer 2100 (Agilent RNA 6000 Nano Assay; Agilent Technologies). Complementary DNA (cDNA) was synthesised from 2 µg RNA using the High Capacity cDNA RT kit (Life Technologies Limited) and 1 µl of RNase inhibitor (Biozym) was added to each reaction. Reverse transcription controls were completed as a control for residual DNA contamination.
Primers targeting genes related to the intestinal innate immune response were designed using and, together with the previously published primers, were verified with PrimerBLAST (www.ncbi.nlm.nih.gov/tools/primer-blast/). In addition, primer sets were tested for specificity using melting curve analysis (online Supplementary Table S1). If possible, primer pairs were located on different exons. Intestinal mucosa samples were analysed for the expression of twenty-four targets and five house-keeping genes (HKG) using porcine specific primers (online Supplementary Table S1). The single-stranded cDNA was amplified and quantified with Fast-Plus EvaGreen Master Mix with Low ROX (Biotium) on a Stratagene Mx3000P QPCR System (Agilent Technologies) using ninety-six-well plates with a 20-µl reaction volume. Each reaction contained 10 µl of master mix, forward and reverse primers (100 pmol) and 50 ng of cDNA template. Negative controls and reverse transcription controls (RT minus) were included in order to control for residual DNA contamination. All reactions were run in duplicate. The amplification programme included an initial denaturation step at 95°C for 10 min, followed by forty cycles of 95°C for 10 s, primer annealing at 60°C for 30 s, and elongation at 72°C for 30 s. Fluorescence was measured at the last step of each cycle. Melting curve analysis was performed to determine the specificity of the amplification.
Three out of the five HKG (β-actin (ACTB), glyceraldehyde 3-phosphate dehydrogenase (GAPDH), and β-2 microglobulin (B2M)) were found suitable as endogenous controls after assessment with NormFinder(
Reference Andersen, Jensen and Ørntoft
20
) and BestKeeper(
Reference Pfaffl, Tichopad and Prgomet
21
). Their geometric mean was used for normalisation of the raw gene expression data to determine ΔC
q
values. The relative gene expression was calculated relative to the pig with the lowest expression of the respective gene using the
 $$2^{{{\minus}\Delta \Delta C_{q} }} $$
method. Amplification efficiencies (E=10(−1/slope)) of all primer sets were provided in the online Supplementary Table S1 and prepared by using a 5-fold serial dilution of samples.
$$2^{{{\minus}\Delta \Delta C_{q} }} $$
method. Amplification efficiencies (E=10(−1/slope)) of all primer sets were provided in the online Supplementary Table S1 and prepared by using a 5-fold serial dilution of samples.
Statistical analysis
A power test analysis estimated according to Kononoff & Hanford( Reference Kononoff and Hanford 22 ) and based on recent data for intestinal microbiome composition, gene expression and electrophysiology of pigs( Reference Metzler-Zebeli, Schmitz-Esser and Mann 14 , Reference Metzler-Zebeli, Lawlor and Magowan 19 , Reference Metzler-Zebeli, Mann and Ertl 23 ) using the SAS software (version 9.4; SAS Institute Inc.) was performed to identify the number of observations needed for the present pig experiment. The power test analysis indicated that statistical power of more than 90 % for a sample size of eight and α=0·05 could be expected, enabling sufficient power to reject the null hypothesis (H0), if H0 was false (P=1−β).
Data of electrophysiology and permeability as well as of intestinal expression of target genes were first analysed for normality using the Shapiro–Wilk test and outlier in SAS (version 9.4). Subsequently, the ANOVA was performed using the MIXED procedure of SAS to compare the effects of the TGS and CON diets with the pig as the experimental unit. The model included the fixed effect of diet and the random effect of the block. Degrees of freedom were approximated using the Kenward–Rogers method (ddfm=kr). The pairwise comparisons among least-square means were performed using the Tukey–Kramer test. Results are expressed as least-square means with their standard error of the mean, and P<0·05 and 0·05<P≤0·10 were defined as significance and trend, respectively.
Intra-associations between expression levels of genes, separately per intestinal site (jejunum, ileum, caecum and mid-colon), were computed in R using Pearson’s correlations. Boxplots, correlation matrices and heat maps were generated using the packages ‘corrplot’( Reference Wei 24 ) and ‘ggplot2’( Reference Wickham 25 ) in R Studio (version 1.0.136). In order to identify key features influencing ileal, caecal and colonic gene expression, sparse partial least squares (sPLS) regression and relevance network analyses( Reference Lê Cao, González and Déjean 26 , Reference Lê Cao, Martin and Robert-Granié 27 ) were performed using the ‘mixOmics’ package in R studio to integrate data of relative bacterial abundances at genera level, microbial metabolites (SCFA and lactate) from the same pigs published in our companion article( Reference Newman, Petri and Grüll 16 ) and present gene expression results. In doing so, supervised sPLS regression was used to identify the most discriminant bacterial genera and SCFA (acetate, propionate, butyrate, iso-butyrate, valerate, iso-valerate and caproate) and lactate in relation to the mucosal gene expression in the ileum, caecum and mid-colon( Reference Lê Cao, González and Déjean 26 , Reference Lê Cao, Martin and Robert-Granié 27 ). The ‘network’ function was used to generate the images from sPLS, whereby the ‘network’ function calculated a similarity measure (Pearson’s correlation) between X and Y variables in a pairwise manner( Reference Mach, Berri and Estellé 28 ). In the graphs, each X-and Y-variable corresponds to a node, whereas the edges display the associations between the nodes.
Results
Information regarding the TGS-related differences in SCFA concentrations and bacterial abundances at genus level of the same pigs as in the current work are reported in our companion paper( Reference Newman, Petri and Grüll 16 ).
Performance and intestinal barrier function
The average daily feed intake was similar and amounted to 1·70 and 1·61 (sem 0·093) kg for the CON and TGS diets, respectively( Reference Newman, Petri and Grüll 16 ). Similarly, pigs had similar average daily weight gain (1·04 and 1·10 (sem 0·077) kg for CON and TGS-fed pigs, respectively( Reference Newman, Petri and Grüll 16 ). Ussing chambers were used to evaluate the effect of TGS on the mid-jejunal barrier function (Table 2). Consumption of the TGS diet led to a 7-fold lower and negative Isc compared with the CON diet (P=0·022), whereas the transepithelial tissue resistance and mucosal-to-serosal flux of FITC and HRP were similar between TGS- and CON-fed pigs.
Mucosal electrophysiological variables and mucosal-to-serosal permeability marker flux in the jejunum of pigs fed either the control (CON) or transglycosylated starch (TGS) diet (Mean values with their standard errors; n 8/diet)
FITC, fluorescein 5(6)-isothiocyanate; HRP, horseradish peroxidase.
Intestinal gene expression
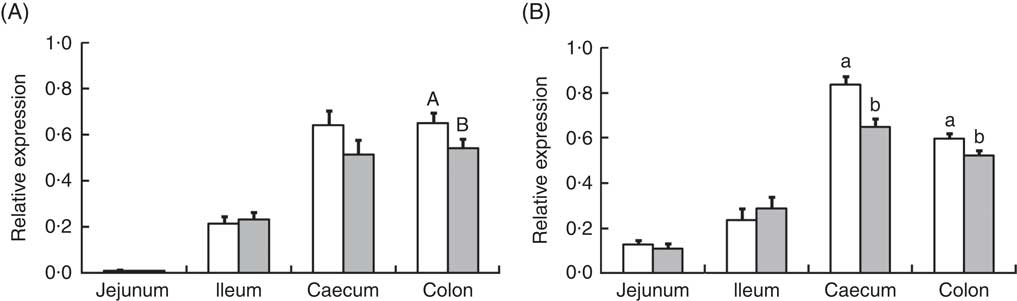
Analysis of the effects of TGS on intestinal gene expression encompassed genes related to the non-specific mucosal defence (intestinal alkaline phosphatase (IAP), mucin 2 (MUC2) and mucin 4 (MUC4)), barrier function (zonula occludens-1 (ZO1) and occludin (OCLN); Table 3), pathogen-recognition receptors (TLR2 and TLR4; Fig. 1(A) and (B)), pro- (IL1B, IL6, INFG, NFKB and TNFA) and anti-inflammatory cytokines (IL6, IL8, IL10), suppressors of cytokine signalling (SOCS1-6) and transcription factors (AMP-activated protein kinase (AMPK), fatty acid synthase (FASN) and PPARG) (Table 4; online Supplementary Table S2). In regard to the two small intestinal sections, the TGS diet down-regulated the ileal relative OCLN expression by 0·3-fold (P=0·018; Table 3). Most effects of TGS were observed for the caecal and colonic mucosa (Tables 3 and 4). There, the TGS diet tended (P=0·057) to up-regulate the caecal expression of IAP by 1·5-fold and down-regulated (P<0·05) the caecal expression of MUC2 and ZO1 by 0·4 and 0·3-fold, respectively, compared with the CON diet (Table 3). The relative expression of TLR4 (Fig. 1(B)), NFKB, SOCS2 and SOCS4 (P<0·05; Table 3) and, as trends (P<0·10), of IL6, PPARG and AMPK (Table 3) were also down-regulated by 0·2 to 0·3-fold in the caecal mucosa of pigs fed the TGS diet compared with those fed the CON diet. In the colonic mucosa, the TGS diet further down-regulated the expression of TLR4 (P<0·05; Fig. 1(B)) and, as trends (P<0·10), of TLR2 (Fig. 1(A)) and IAP (Table 3) by 0·2, 0·1 and 0·3-fold compared with the CON diet, respectively.
Relative expression of toll-like receptor (TLR)-2 (A) and TLR-4 (B) in jejunum, ileum, caecum and colon of pigs fed either the control (![]() ) or transglycosylated starch (
) or transglycosylated starch (![]() ) diet. Values are means (n 8/diet), with their standard errors represented by vertical bars. a,b Mean values with unlike letters are statistically significant (P≤0·05) effects of diet within a gut segment. A,B Mean values with unlike letters are trends (0·05<P≤0·10) for diet effect within a gut segment.
) diet. Values are means (n 8/diet), with their standard errors represented by vertical bars. a,b Mean values with unlike letters are statistically significant (P≤0·05) effects of diet within a gut segment. A,B Mean values with unlike letters are trends (0·05<P≤0·10) for diet effect within a gut segment.
Expression of luminal defence and barrier function genes in the jejunum, ileum, caecum and colon of pigs fed either the control (CON) or transglycosylated starch (TGS) diet (Mean values with their standard errors; n 8/diet)
IAP, intestinal alkaline phosphatase; MUC2, mucin 2; MUC4, mucin 4; ZO1, zonula occludens-1; OCLN, occludin.
Relative expression of genes within the innate immune signalling cascade in the caecum and colon of pigs fed either the control (CON) or transglycosylated starch (TGS) diet (Mean values with their standard errors; n 8/diet)
TGFB1, transforming growth factor β-1; INFG, interferon-γ; SOCS, suppressor of cytokine signalling; AMPK, AMP-activated protein kinase; FASN, fatty acid synthase.
Intra-associations between relative expression levels of innate immune genes
Despite similar expression levels between all genes in the jejunal and ileal mucosa, except ileal OCLN expression, hierarchical clustering of correlations showed that genes within the TLR-2, TLR-4 and NF-κB signalling cascade were positively correlated in the jejunum (Fig. 2(a)). Strong negative correlations (r>0·75) existed between the jejunal expression of SOCS1 with expression levels of TLR4, NFKB, IL10 and ZO1. In the ileum (Fig. 2(b)), expression of both tight-junction proteins ZO1 and OCLN was positively associated with that of NFKB and PPARG. Strong correlations (r>0·80) also existed between ileal expression levels of FASN, TGFB1, IL6, IL1B and IAP.
Correlation heatmap using hierarchical cluster analysis showing intra-associations between relative expression levels of innate immune genes in jejunum (a), ileum (b), caecum (c) and colon (d). INFG, interferon- γ; SOCS, suppressor of cytokine signalling; TGFB1, transforming growth factor β-1; AMPK, AMP-activated protein kinase; FASN, fatty acid synthase; IAP, intestinal alkaline phosphatase; MUC4, mucin 4; OCLN, occludin; TLR, toll-like receptor; TNFA, tumour necrosis factor-α; ZO1, zonula occludens-1; MUC2, mucin 2.
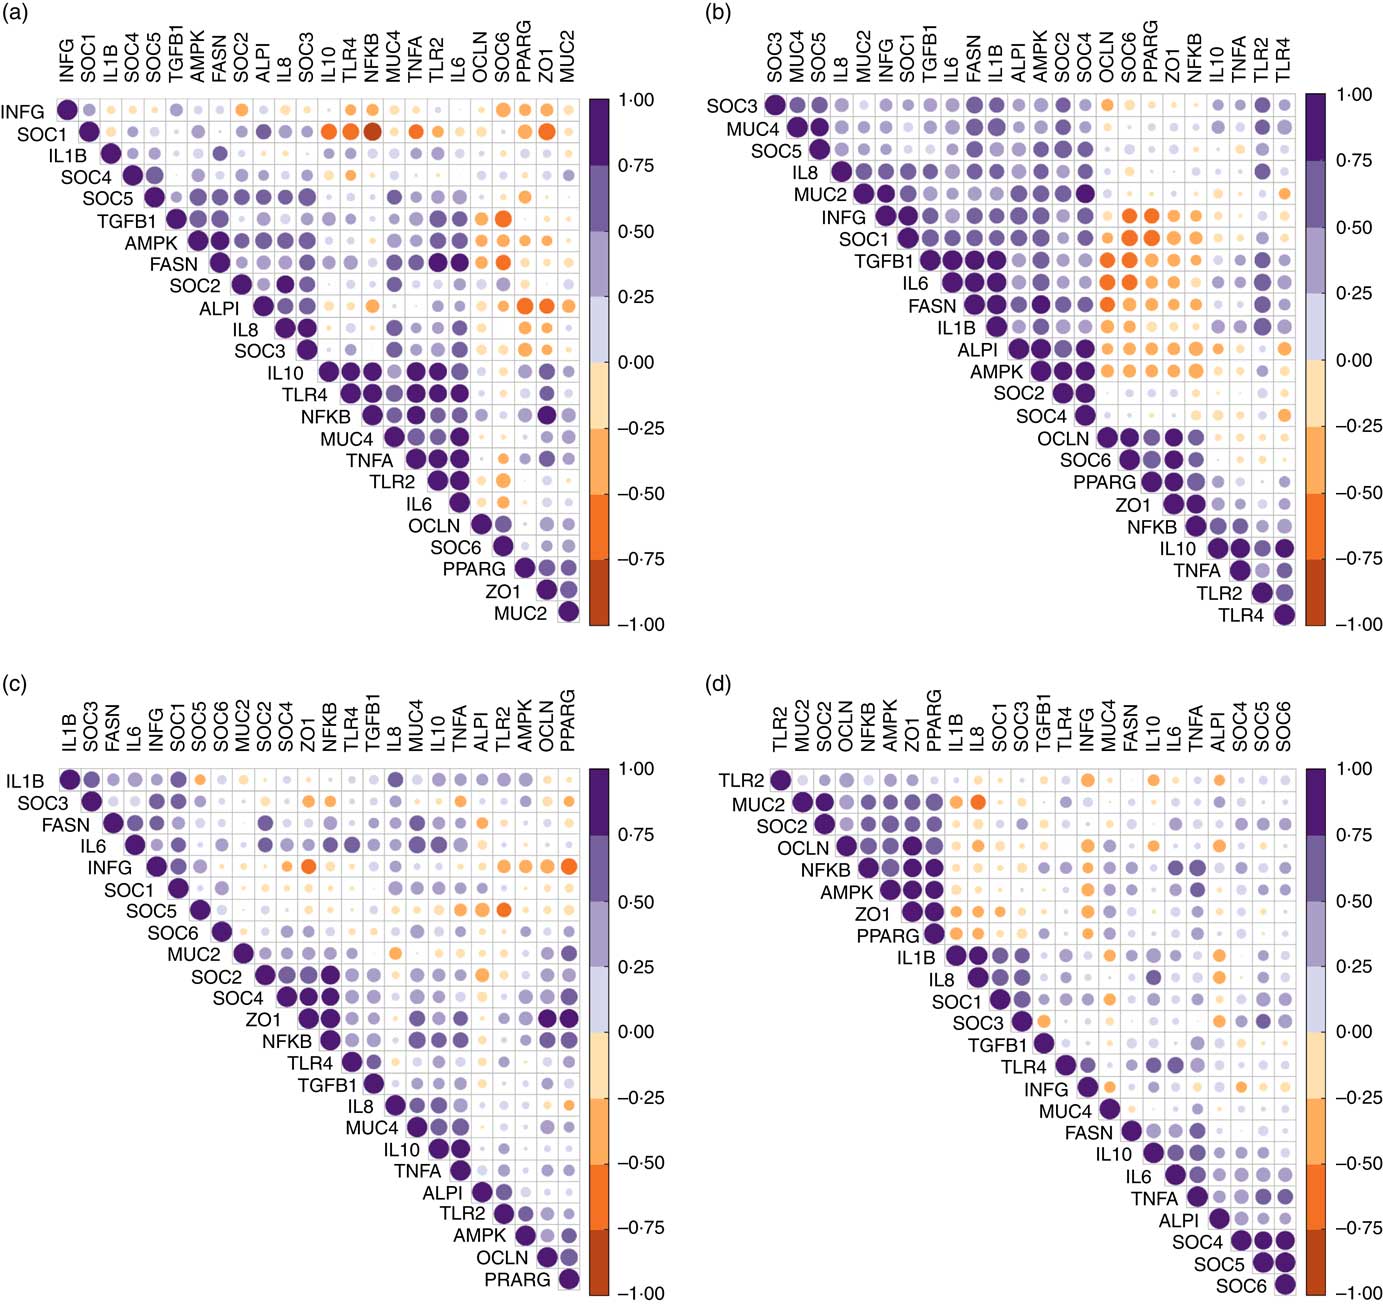
In the caecal mucosa (Fig. 2(c)), the expression of ZO1 was highly positively (r>0·80) correlated with expression levels of NFKB, PPARG and OCLN. Caecal expression of NFKB was further positively correlated with the expression of a range of genes including TLR4, TNFA, IL6, IL10, TNFA, TGFB1, FASN, PPARG, OCLN, MUC4, SOCS2 and SOCS4. In the colonic mucosa (Fig. 2(d)), hierarchical clustering showed a positive correlation cluster between the expression levels of NFKB, PPARG, AMPK, SOCS2, MUC2, ZO1 and OCLN. Notably, the expression level of INFG negatively correlated with expression levels of NFKB, PPARG and ZO1 in all four intestinal segments, and with that of SOCS6 in the jejunum and ileum.
Relevance network associations between relative expression of genes and bacteria
Relevance networks were computed for differentially expressed genes between the two feeding groups and bacterial genera. A predictive model constructed from the relative abundance of genera can be effective to discover influential taxa( Reference Mach, Berri and Estellé 28 ). Therefore, we investigated whether the TGS-induced differential expression of innate immune genes in ileal, caecal and mid-colonic mucosa were influenced by the TGS-derived alterations in the microbiota using sPLS regression and relevance network association analysis. This approach identified several minor to moderate correlations between the gene expression and bacterial genera in the ileum, caecum and mid-colon. Therefore, only the strongest pairwise associations as the most influential are presented separately for each differently expressed gene in the ileum, caecum and colon (Fig. 3(a)–(g); online Supplementary Table S3).
Determination of potential key genera for mucosal expression of innate immune genes in the ileum (a), caecum (b–f) and colon (g) of pigs using relevance networking. Covariations between the relative abundances of bacterial genera (relative abundances>0·01) in digesta and relative gene expression levels using sparse partial least squares regression were established separately for ileal, caecal and colonic data. The network is displayed graphically as nodes (genera and expression of genes) and edges (biological relationship between nodes). The edge colour intensity indicates the level of the association: ![]() , positive;
, positive; ![]() , negative. Node shape indicates whether it is the expression of a gene (round) or genera (rectangular). The score of the association is indicated under each edge and in online Supplementary Table S3. Only the strongest pairwise associations were projected, with score threshold dependent of the respective association. MUC2, mucin 2; OCLN, occludin; SOCS, suppressor of cytokine signalling; TLR, toll-like receptor; ZO1, zonula occludens-1.
, negative. Node shape indicates whether it is the expression of a gene (round) or genera (rectangular). The score of the association is indicated under each edge and in online Supplementary Table S3. Only the strongest pairwise associations were projected, with score threshold dependent of the respective association. MUC2, mucin 2; OCLN, occludin; SOCS, suppressor of cytokine signalling; TLR, toll-like receptor; ZO1, zonula occludens-1.
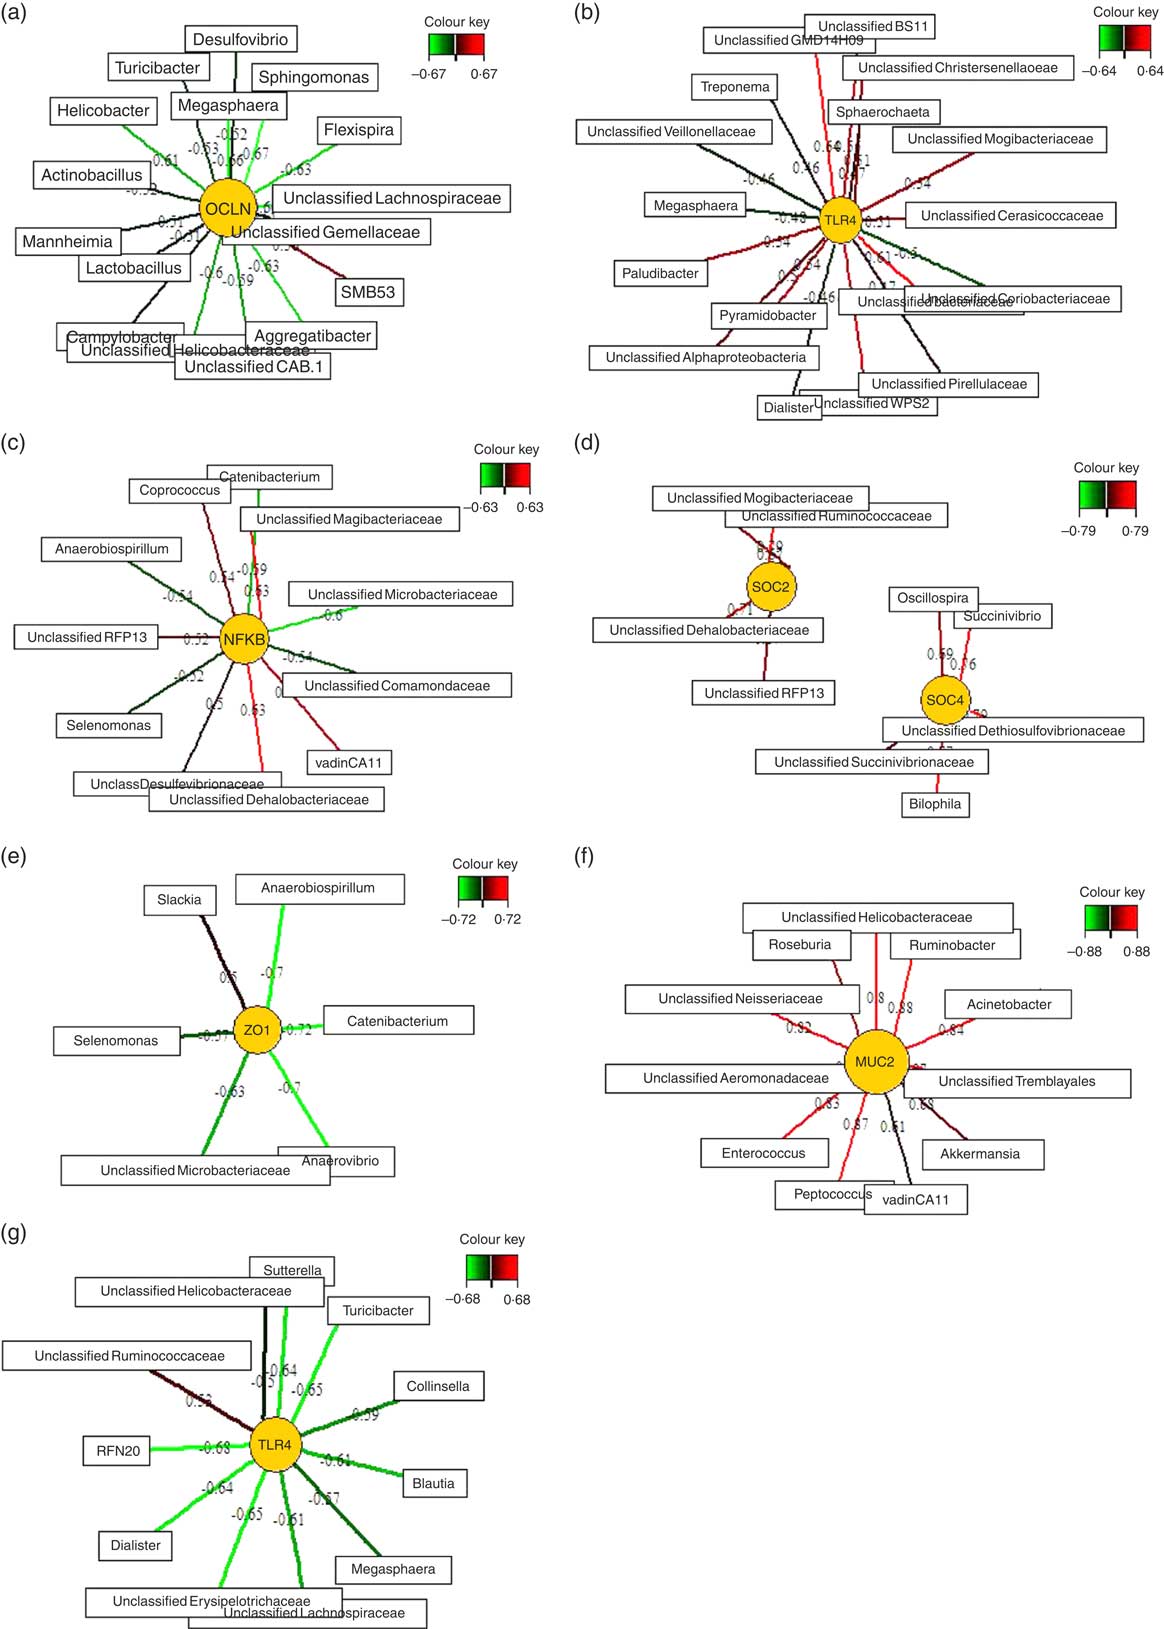
Except for one genus (SMB53) which was positively correlated with ileal OCLN expression, sSPLS regression and subsequent relevance network analysis negatively associated OCLN expression levels with genera of the phyla Firmicutes (e.g. Sphingomonas, Megasphaera, an unclassified Lachnospiraceae genus, Turicibacter and Lactobacillus), Proteobacteria (e.g. Flexispira, Aggregatibacter, Campylobacter, Mannheimia and Helicobacter) and Bacteroidetes (e.g. Flexibacter) in the ileum.
The six differentially expressed genes in the caecal mucosa with the TGS diet positively or negatively associated with many bacterial genera that were increased or decreased in their relative abundances in caecal digesta after TGS feeding( Reference Newman, Petri and Grüll 16 ). For instance, unclassified genera of Veillonellaceae (tentatively identified as Selenomonas)( Reference Newman, Petri and Grüll 16 ), Coriobacteriaceae and Microbacteriaceae in caecal digesta were negatively associated with expression levels of TLR4, NFKB, SOCS4 and/or ZO1 in the caecal mucosa. Moreover, an unclassified Mogibacteriaceae in caecal digesta was positively associated with the mucosal expression of TLR4, NFKB and SOCS2. Overall, the various bacterial genera in caecal digesta that were identified as most influential associated with the expression of TLR4 in comparison to other differentially expressed genes in the caecum of TGS- and CON-fed pigs. This was in contrast to the negative associations between caecal bacterial genera and caecal expression of ZO1 (Fig. 3(e)), which were very similar to those for the caecal expression of NFKB (Fig. 3(c)). The caecal relative expression of MUC2, in turn, was positively associated with 11 genera including Roseburia, Ruminobacter, Acinetobacter, Akkermansia, Peptococcus and Enterococcus in caecal digesta (Fig. 3(f)). In the colon, mucosal TLR4 expression was negatively associated (association score>0·5) with eleven genera including Sutterrella, Turicibacter, Collinsella, Blautia and Dialister in colonic digesta. Consistently, Megasphaera was negatively associated with TLR4 expression in the caecum (Fig. 3(b)) and colon (Fig. 3(g)).
Relevance networks between relative expression of genes and fermentation metabolites
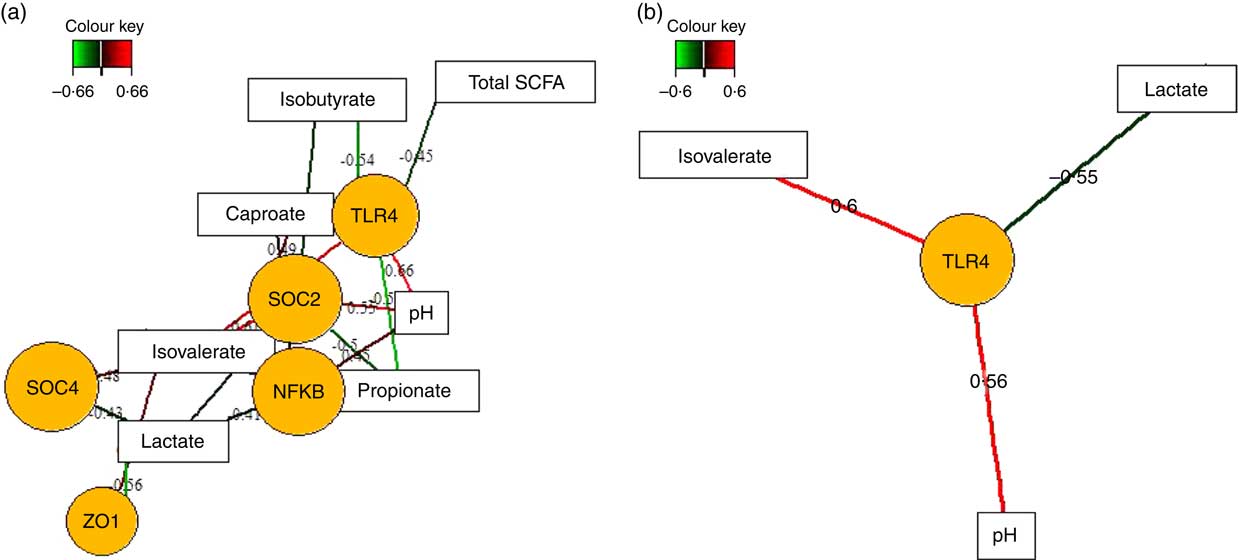
Fermentation metabolites, such as SCFA and lactate, play fundamental roles in the regulation of intestinal inflammatory processes( Reference McKenzie, Tan and Macia 8 ). Therefore, we also applied sPLS regression and relevance network analysis to assess whether different concentrations of SCFA, lactic acid and luminal pH between feeding groups( Reference Newman, Petri and Grüll 16 ) were correlated with up- or down-regulation of the expression of innate immune genes in the caecal and colonic mucosa in response to TGS feeding (Fig. 4; online Supplementary Table S3). In the caecum (Fig. 4(a)), luminal pH was positively and propionic acid negatively associated with mucosal expression levels of TLR4, NFKB and SOCS2. Lactic acid, in turn, was positively and iso-valeric acid negatively associated with expression levels of NFKB, SOCS2, SOCS4 and ZO1. Similar opposite relationships were also observed for associations between caecal caproic (positive) and isobutyric acid (negative) with the expression levels of TLR4 and SOCS2. In the colon (Fig. 4(b)), expression of TLR4 showed the strongest associations with lactic acid (negative), iso-valeric acid and pH (both positive).
Determination of the influential effect of fermentation metabolites and pH for mucosal expression of innate immune genes in caecum (a) and colon (b) of pigs using relevance networking. Covariations between fermentation acids and pH in digesta and relative gene expression using sparse partial least squares regression were established separately for caecal and colonic data. The network is displayed graphically as nodes (genera and expression of genes) and edges (biological relationship between nodes). The edge colour intensity indicates the level of the association: ![]() , positive;
, positive; ![]() , negative. Node shape indicates whether it is the expression of a gene (round) or luminal fermentation acid/pH (rectangular). The score of the association is indicated under each edge and in the online Supplementary Table S3. Only the strongest pairwise associations were projected, with score threshold dependent of the respective association. OCLN, occludin; SOCS, suppressor of cytokine signalling; TLR, toll-like receptor; ZO1, zonula occludens-1.
, negative. Node shape indicates whether it is the expression of a gene (round) or luminal fermentation acid/pH (rectangular). The score of the association is indicated under each edge and in the online Supplementary Table S3. Only the strongest pairwise associations were projected, with score threshold dependent of the respective association. OCLN, occludin; SOCS, suppressor of cytokine signalling; TLR, toll-like receptor; ZO1, zonula occludens-1.
Discussion
Consumption of RS modulates the gastrointestinal microbial composition and has been shown to attenuate intestinal inflammation and support intestinal integrity in pigs and rodents, with the majority of evidence being available for the large intestine( Reference Liu, Upadhyaya and Fardin-Kia 9 , Reference Haenen, Souza da Silva and Zhang 10 , Reference Nofrarías, Martínez-Puig and Pujols 29 ). The immunomodulatory abilities of RS are clearly linked to the specific structure and conformation of the starch molecules( Reference Nielsen, Theil and Purup 1 , Reference Liu, Upadhyaya and Fardin-Kia 9 , Reference Haenen, Souza da Silva and Zhang 10 ). The present results emphasise the capability of TGS to down-regulate the expression of genes related to the innate immune response pathways especially in the caecal mucosa of clinically healthy, non-challenged pigs, whereas effects on mucosal barrier function and gene expression in the small intestine were almost absent. Moreover, we could demonstrate microbiome signatures on mucosal signalling in the ileal, caecal and colonic mucosa as bacterial genera and fermentation metabolites that were altered after TGS consumption were identified as relevant factors for the differently expressed host genes in the ileum, caecum and colon of pigs. Intra-association gene expression clusters and relevance networking support the theory that the lower expression of luminal defence genes, cytokines, transcription factors and SOCS may have been mediated by decreased signalling via TLR-4 and NF-κB as pivotal pro-inflammatory elements in the caecum and colon. This finding highlights the importance of investigating microbiota-RS interactions in mucosal innate immune signalling( Reference Haenen, Souza da Silva and Zhang 10 , Reference Upadhyaya, McCormack and Fardin-Kia 12 , Reference Nofrarías, Martínez-Puig and Pujols 29 ) and in relation to acquired mucosal immune tolerance towards the present microbial community( Reference Frosali, Pagliari and Gambassi 4 ).
As the main site of action of many RS is the large intestine, more evidence for immunomodulatory capabilities and effects on barrier function is available for the caecum and colon than for the small intestine( Reference Nielsen, Theil and Purup 1 , Reference Vaziri, Liu and Lau 30 ). For the present TGS, alterations in the bacterial community composition and diversity were already detectable but less pronounced in gastric and ileal digesta compared with caecal and colonic digesta as recently reported( Reference Newman, Petri and Grüll 16 ). This, together with the shorter retention time along the small intestine, may explain the minimal TGS-induced changes of mucosal gene expression in the jejunum and ileum. Unfortunately, we could not collect sufficient amounts of small intestinal digesta from all pigs; therefore, data for microbial metabolites are missing for these segments. Nevertheless, the present intra-associations between expressions of genes may support microbial signalling via TLR-2, TLR-4 and NF-κB pathways in the jejunum and NF-κB in the ileum. Jejunal data for transepithelial tissue resistance and flux rates of paracellular permeability markers from Ussing chambers support the absence of a TGS-derived effect on mucosal barrier function in the jejunum of pigs. Previously, the soluble fibre inulin decreased the transepithelial tissue resistance in the jejunum of weaned pigs, which the authors explained by a greater capacity of inulin-fed pigs to absorb nutrients, mainly glucose( Reference Awad, Ghareeb and Paßlack 31 ). As the Isc reflects the sodium-dependent co-transport of nutrients (e.g. glucose and amino acids)( Reference Awad, Ghareeb and Paßlack 31 ), the TGS-induced negative Isc in the jejunal mucosa likely illustrated the lower intestinal glucose availability with the TGS diet when compared with the CON diet( Reference Newman, Zebeli and Eberspächer 32 ).
By acting as a bridge between adjacent epithelial cells, occludin is important in tight-junction stability( Reference Turner 33 ) and lower Ocln expression caused loss of tight-junction function in mice( Reference Mir, Meena and Chaudhry 34 ). Consequently, greater expression of occludin may strengthen the bond between cells, whereas remaining firmly anchored to zonula occludens-1 proteins( Reference Groschwitz and Hogan 35 ). The TGS, however, down-regulated the ileal expression of OCLN and caecal expression of ZO1 in the present study, which may be related to the general suppression of the expression of genes related to pro-inflammatory pathways by the TGS compared with CON in the intestine. A comparable down-regulation in the colonic expression of zonula occludens-1 and occludin without deteriorating effects on the transepithelial resistance was observed in mice receiving soluble fibre in the form of 10 % inulin( Reference Liu, Cephas and Holscher 36 ).
Similar to our observations, RS4 induced attenuation of the caecal expression of pro-inflammatory genes, including NF-κB, in mice, which the authors related to an RS4-derived enhanced caecal butyrate production( Reference Liu, Cephas and Holscher 36 ). In the present study, we could establish an inverse relationship between the caecal expression of NFKB and the TGS-induced increase in luminal propionic acid( Reference Newman, Petri and Grüll 16 ). Mechanistically, SCFA-sensing G-protein receptors play crucial roles in immune regulation( Reference McKenzie, Tan and Macia 8 ), with propionic acid signalling more strongly via G-protein receptor 41( Reference Brown, Goldsworthy and Barnes 6 ). Results for ileal and caecal G-protein receptors expression between TGS- and CON-fed pigs, however, were inconclusive( Reference Newman, Petri and Grüll 16 ). Associations with luminal pH, in turn, support the role of a TGS-induced intensification of intestinal fermentation in the down-regulation of the expression of NFKB and SOCS2 in the caecum and of TLR4 in the caecum and colon.
In general, the interaction of TLR with their specific MAMP induces NF-κB signalling which leads to the secretion of pro-inflammatory cytokines, defensins, mucins and IAP( Reference Doyle and O’Neill 37 ). Concurrently, IAP can inhibit the NF-κB pro-inflammatory signalling cascade in the enterocyte and modify expression of key tight-junction proteins, like ZO1 and OCLN, via dephosphorylation of microbial ligands for pathogen-recognition receptors (e.g. lipopolysaccharides, flagellin, CpG DNA motifs, uridine diphosphate)( Reference Lallès 2 ). The trend for the TGS-induced up-regulated expression of IAP might therefore be indicative of a stimulated detoxification of luminal MAMP, including lipopolysaccharides, which subsequently may have decreased the expression of TLR4, NFKB, MUC2 and ZO1 in the caecal mucosa of pigs. This assumption may be supported by the present intra-associations between the expression of TLR4 and related genes and relevance networking analysis with bacterial genera and microbial metabolites. According to the present relevance networks, the TGS-related increase in moderate to high abundant genera within the family Veillonellaceae, including an unclassified genus (closest reference genus being Selenomonas), Megasphaera, Mitsuokella and Succiniclasticum in caecal and colonic digesta( Reference Newman, Petri and Grüll 16 ), may have played key roles in the suppression of pro-inflammatory gene expression. These genera appeared to replace other starch-degrading genera within the families Ruminococcaceae and Christensenellaceae, and the class Bacteroidales in caecal and colonic digesta of TGS-fed pigs compared with CON-fed pigs( Reference Newman, Petri and Grüll 16 ). The increased ratio of Firmicutes:Bacteroidetes and Firmicutes:Proteobacteria along the gastrointestinal tract in TGS-fed pigs( Reference Newman, Petri and Grüll 16 ) and the positive association of iso-valeric acid with caecal and colonic gene expression levels further supports the assumption of a modulated presence of gram-negative bacteria and hence immune-stimulating lipopolysaccharides with the TGS diet. Particularly, the substitution of the two predominant genera in caecal and colonic digesta, Ruminococcus in CON-fed pigs v. the Selenomonas-related genus (unclassified Veillonellaceae) in TGS-fed pigs( Reference Newman, Petri and Grüll 16 ), likely greatly affected pathogen-recognition receptors and microbial metabolite signalling between diets. Ruminococcus is a genus of acetate, formate, lactate and succinate producers( Reference Louis, Scott and Duncan 38 ), whereas Veillonellaceae, including Selenomonas, comprises propionate and succinate producers( Reference Flint, Duncan and Scott 39 ). Accordingly, the Selenomonas-related genus (unclassified Veillonellaceae) and propionic acid negatively associated with caecal TLR4 expression in sPLS regression and relevance network analysis. Network analysis further indicated that other moderate to low abundant propionate-producing Veillonellaceae genera( Reference Louis and Flint 40 ), which were increased with the TGS diet, were important for the down-regulation of OCLN expression in the ileum (Megasphaera), TLR4 expression in the caecum and colon (Megasphaera and Dialister) and NFKB and ZO1 expression in the caecum (Selenomonas). Moreover, similar association patterns between bacterial genera (e.g. Catenibacterium, Anaerobiospirillum, Selenomonas, unclassified Microbacteriaceae) and the expression of NFKB and ZO1 in the caecum support that pro-inflammatory signalling occurred via NF-κB. With NF-κB being a central player in pro-inflammatory signal transduction( Reference Lawrence 41 ), present relevance networks for the caecum and colon also indicated that the anti-inflammatory action of TGS may have been mediated by other pathogen-recognition receptors than TRL-2 and TLR-4. The present network analysis, however, did not allow for the clarification of whether the positive effect of the TGS was primarily mediated via an altered MAMP profile or via the changes in SCFA and lactic acid concentrations in the ileum, caecum and colon. A number of bacterial taxa were positively associated with the down-regulated caecal expression of MUC2 (e.g. Akkermansia, Roseburia, Ruminobacter, Acinetobacter, Peptococcus and Enterococcus). This relationship may have been indicative of substrate-dependencies, as some of these genera are known for their mucin-degrading abilities( Reference Ottman, Davids and Suarez-Diez 42 , Reference Van den Abbeele, Belzer and Goossens 43 ) and were not associated with the expression of other genes. Lastly, interactions with the mucosa-associated microbiota need to be considered as well, which were not investigated in the present study.
The regulation of cytokine signalling occurs at multiple levels. Enhanced luminal SCFA concentrations may attenuate an up-regulation of the expression of pro-inflammatory response genes in the small and large intestines via the activation of the nuclear transcription factors PPAR-γ and AMPK, which serve as negative regulators of NF-κB signalling( Reference Hontecillas and Bassaganya-Riera 44 – Reference Pongkorpsakol, Satitsri and Wongkrasant 46 ). Accordingly, pigs fed retrograded tapioca starch (RS3) had an up-regulated PPARG expression and down-regulated expression of target genes of PPAR-γ in the colonic mucosa( Reference Haenen, Souza da Silva and Zhang 10 ), whereas raw potato starch (RS2) did not alter PPARG expression in the caecal-colonic region despite enhanced SCFA levels in RS2-fed pigs( Reference Nielsen, Theil and Purup 1 , Reference Nielsen, Lærke and Theil 47 ). The present results of a down-regulated caecal PPARG and AMPK expression were contradictory to those findings. However, according to the strong intra-associations, the decreased caecal expression of PPARG and AMPK may have signalled the reduced caecal expression of tight-junction proteins ZO1. To limit the ability of cytokines to initiate an immune response, NF-κB expression induces SOCS protein expression( Reference Alexander and Hilton 48 ). This dependency probably explains the current down-regulated caecal expression of SOCS2 and SOCS4, which are potent inhibitors of the JAK/STAT pathway, thereby suppressing further pro-inflammatory signalling events in the caecum( Reference Tamiya, Kashiwagi and Takahashi 49 ). Also, the absence of an effect of TGS on the expression of anti-inflammatory (i.e. IL-8 and IL-10) and regulatory cytokines (transforming growth factor-β1) may be related to the reduced caecal NFKB expression.
In conclusion, the present results demonstrate the capability of TGS to down-regulate the caecal expression of genes within the TLR-4 and NF-κB pro-inflammatory signalling cascade, with almost no effects on expression of immune genes and barrier function in the small intestine. Moreover, sPLS regression and relevance networking analysis indicated a microbiome signature on mucosal signalling as TGS-derived changes in bacterial genera and fermentation metabolites, such as propionic acid, associated with the differentially expressed genes in the ileum, caecum and colon of pigs. However, association networks did not allow for distinguishing whether the TGS-derived alterations in bacterial abundances or microbial metabolites played a greater role in the observed changes in ileal, caecal and colonic gene expression. Further research will need to be conducted to confirm the anti-inflammatory potential of TGS at lower rates of dietary inclusion in more complex human diets.
Acknowledgements
Georg Kvapil, Christina Grabner and Nadine Schneider are gratefully acknowledged for assistance in the animal trial. The authors thank Arife Sener, Suchitra Sharma, Anita Dockner and Melanie Wild (Institute of Animal Nutrition and Functional Plant Compounds) for excellent technical assistance. Timea Molnar-Wegerth is thanked for assistance with starch provision and analysis (Agrana Research & Innovation Center GmbH). The authors further thank Agromed Austria GmbH (Kremsmünster, Austria) for providing the cellulose (FibroCell® M1) to be incorporated into the diets.
The authors contributed as follows to the manuscript: study concept and design: B. U. M.-Z., D. G. and Q. Z.; preparation of starch products: D. G.; acquisition of intestinal samples: B. U. M.-Z. and Q. Z.; acquisition of microbiota data: M. A. N. and B. U. M.-Z.; data analysis: B. U. M.-Z.; drafting of the manuscript and responsibility for final content: B. U. M.-Z. All authors read and approved the final manuscript.
This work was supported by the Austrian Research Promotion Agency (FFG) (BRIDGE project no. 836447-‘Healthy Carbohydrates’). Agrana Research & Innovation Center GmbH provided support in the form of salary for author D. G., but did not have any additional role in the study design, data collection and analysis, decision to publish or preparation of the manuscript.
Supplementary material
For supplementary material/s referred to in this article, please visit https://doi.org/10.1017/S0007114518001113


