


The ageing global population(1) poses challenges to all aspects of society(2), most notably health and social care. To lessen this burden and support individuals to maintain their physical, social and mental well-being later in life, exploring ways to promote healthy ageing is of high priority. In particular, appropriate nutrition is considered an important factor in reducing risk of cardiometabolic disease, slowing loss of bone and muscle mass, preserving cognitive function and helping to maintain physical and mental fitness in older age(Reference Jong, Mathers and Franco3).
Diet quality indexes (DQI) are useful nutritional assessment tools, accounting for the complexity of dietary exposure and the principle that people eat foods and not nutrients(Reference MacDonell, Miller and Waters4), that can be easily translated into food-based, dietary advice(Reference Franco, Fallaize and Hwang5). Their use is increasingly prevalent, with several DQI being investigated within older adults(Reference de Haas, de Jonge and Voortman6–Reference Xu, Houston and Locher18). For example, Mediterranean Diet Scores have been inversely associated with risk of incident disability(Reference Talegawkar, Bandinelli and Bandeen-Roche15) and with overall, CHD and cancer mortality(Reference Knoops, de Groot and Kromhout8,Reference Osler and Schroll13,Reference Trichopoulou, Kourisblazos and Wahlqvist16) in longitudinal studies. Moreover, USA Healthy Eating Index (HEI) scores have been positively associated with components of the Fried et al. frailty phenotype(Reference Fried, Tangen and Walston19) and indicators of functional decline such as gait speed and knee extensor power cross-sectionally(Reference Xu, Houston and Locher17).
Nonetheless, component choice and scoring method mean current, widely used, DQI could be deemed unsuitable for older adults (aged ≥ 65 years) whereby a range of key health outcomes related to mortality risk and quality of life, and impacts of physical and cognitive decline, should be considered. Specifically, Mediterranean Diet Scores discourage high dairy intake, a food group beneficial for musculoskeletal health(Reference Kim and Lee20) and associated with lower risk of type 2 diabetes(Reference Aune, Giovannucci and Boffetta21) and CVD(Reference Deghan, Mente and Rangarajan22), whereas the HEI disregards the importance of oily fish consumption, particularly long chain n-3 PUFA content, which has been associated with reduced cognitive impairment(Reference De Spiegeleer, Petrovic and Boeckxstaens23), inflammation(Reference Bollwein, Diekmann and Kaiser24) and risk of CHD(25). Moreover, the Alternative Healthy Eating Index-2010 (AHEI-2010) includes three fatty acid components, resulting in strong associations with CVD risk(Reference Chiuve, Fung and Rimm26); however, overall dietary quality may not be reflected in scores and associations with other health outcomes may be limited.
To our knowledge, only one DQI specifically tailored to older populations exists, the USA Elderly Dietary Index, for which scores have been cross-sectionally inversely associated with CVD risk(Reference Kourlaba, Polychronopoulos and Zampelas9). However, it has not been widely explored nor validated and may be limited in its associations with physical function and sarcopenia by favouring only moderate protein intake (highest scores awarded for only 1–2 servings/week each of meat, fish or seafood and legumes) and excluding physical activity as high protein intake (1·0–1·2 g/kg per d; equivalent to ≥ 3 servings/day of meat, fish or seafood and legumes) has been associated with improved or reduced loss of muscle mass and strength(Reference Dorrington, Fallaize and Hobbs27), and physical activity acts synergistically with protein to enhance its effect(Reference Breen and Phillips28). Moreover, current established and validated scores such as the HEI and Mediterranean Diet Scores were developed for use in USA and Mediterranean populations, respectively, questioning the suitability within a UK population.
Therefore, this study aimed to develop three variations of an evidence-based DQI suitable for UK older adults (aged ≥ 65 years) (DQI-65) that characterised an optimum dietary pattern and assess (i) their ability to predict adherence to our previously proposed age-specific nutritional recommendations for this population group(Reference Dorrington, Fallaize and Hobbs27) and (ii) associations with health markers of importance to older adults, using cross-sectional data. The novel DQI were explored alongside the validated HEI-2015 and AHEI-2010 to identify whether the new DQI-65 were better predictors of adherence to nutritional recommendations and health status.
Methods
Development of the diet quality index for UK older adults
Index structure and variations
DQI-65 development was based on the steps documented by Waijers, Feskens and Ocke(Reference Waijers, Feskens and Ocke29) with all decisions being made by an experienced registered nutritionist (JAL), registered dietitian (RF) and a nutrition student (ND). Following a thorough evaluation of existing indexes identified in the current literature, it was decided that the primary DQI-65 would be comprised of the more frequently used combination of foods and nutrients, with physical activity added due to the range of health benefits in older adults(30). However, it was deemed appropriate to develop two further variations in order to test the effect of including physical activity and the effect of exchanging nutrient components with food groups on the predictive value of the index. The three DQI-65 were Nutrient and Food-based DQI-65 (NFDQI-65), which contained food groups and nutrients, NFDQI-65 with Physical Activity (NFDQI-65+PA), which contained food groups, nutrients and physical activity, and Food-based DQI-65 with Physical Activity (FDQI-65+PA), which contained solely food group components with physical activity.
Choice of index components
All decisions regarding choice of components and scoring criteria were guided by the nutritional recommendations for UK older adults (≥ 65 years) proposed in our previous critical review, along with the practical food-based advice we devised(Reference Dorrington, Fallaize and Hobbs27). Nutrients from our proposed age-specific nutritional recommendations were selected to be represented in the index if new recommendations had been set (i.e. protein, Ca, vitamin B12, folate and fluid) or if strong evidence supported their physiological role among older adults (i.e. dietary fibre, free sugars, MUFA, PUFA and SFA, long chain n-3 PUFA, Na, vitamin D and alcohol). Guidance from the UK Eatwell Guide (31) was considered alongside these recommendations as consistency between dietary guidelines, where appropriate based on the identified age-specific evidence, would likely enhance adherence.
Twelve main components were devised, eleven of which were dietary components (a mixture of food groups and nutrients) and the twelfth represented physical activity (except for NFDQI-65 in which this was excluded).
Components 1–3 and 5–6 (fruit, vegetables, protein, low-fat dairy and wholegrain carbohydrates) represent nutrients identified as important to older adults and, in the case of protein, Ca, folate and vitamin B12, for which we proposed new, higher, recommendations(Reference Dorrington, Fallaize and Hobbs27). Specifically, sufficient protein intake is important to support maintenance of muscle mass and strength among older adults, which diminishes with age(Reference Koopman and Van Loon32), and we found that evidence suggests older adults have higher protein requirements due to impaired absorption and utilisation(Reference Dorrington, Fallaize and Hobbs27). Furthermore, dairy product provides bioavailable Ca, an essential mineral required to minimise age-associated loss of bone mineral density(Reference Hunter and Sambrook33), and, along with animal proteins, is a good source of vitamin B12. Finally, fruit, vegetables and wholegrain carbohydrates provide dietary fibre and a wide range of vitamins and minerals (e.g. vitamins A, C, E and folate), supporting various physiological functions, and have been associated with lower risk of CVD(Reference Aune, Giovannucci and Boffetta21,Reference Li, Hruby and Bernstein34) .
Component 4 (oily fish) was selected due to oily fish containing long chain n-3 PUFA and vitamin D, and being associated with lower risk of CHD(25).
Components 7–8 and 11 (free sugars, Na and alcohol) reflect nutrients in our previously proposed nutritional recommendations that are considered detrimental to health of older adults(Reference Dorrington, Fallaize and Hobbs27). Specifically, high intake of free sugar containing foods may displace protein and micronutrient intake and increase risk of overweight or obesity(Reference Dorrington, Fallaize and Hobbs27), and Na intake is a major risk factor for hypertension(35) and has been positively associated with systolic blood pressure and diastolic blood pressure (DBP) in an elderly population(Reference Alam, Purdie and Johnson36). Moreover, sensitivity to the toxicity of alcohol increases with age(Reference Truswell37) and methodological limitations exist within age-specific evidence supporting benefits of light-to-moderate intake on health (as is appraised in the AHEI-2010), therefore discouraging alcohol consumption seems prudent in this age group(Reference Dorrington, Fallaize and Hobbs27).
Component 9 (fat and fatty acids) reflects recommendations for dietary fat and fatty acids in our previous review and accounts for the variable relationships between different fatty acids and risk of chronic disease such as type 2 diabetes and CVD(Reference Dorrington, Fallaize and Hobbs27). Specifically, SFA intake is discouraged and substitution with PUFA and MUFA is encouraged.
Component 10 (fluid) was selected as fluid intake is essential to prevent dehydration, which is associated with impaired cognitive and physical function, and to lower risk of constipation(Reference El-Sharkawy, Sahota and Lobo38), which can impair appetite. Fluid intake is commonly low within this demographic due to impaired thirst sensation, poor renal function and fear of incontinence(Reference Bernstein and Munoz39), meaning it should not be overlooked within dietary assessments among older adults.
Finally, component 12 (physical activity) was included in the FDQI-65+PA and NFDQI-65+PA due to physical activity acting synergistically with protein to enhance muscle maintenance or synthesis in response to amino acids(Reference Breen and Phillips28), and its additional role in supporting weight maintenance, cardiovascular health and preventing loss of bone strength(30).
No dietary variety component was included, but instead limitations were imposed regarding number of portions of certain foods, notably for vegetables, fruit and protein, preventing the maximum score being achieved without a varied diet. For example, for protein only ≤ 1 portion each of legumes or nuts, dairy and red meat were allowed per day, and for vegetables only ≤ 1 portion each of legumes and tomato puree were allowed. These limitations were based on a consensus decision by the nutrition experts, taking into account the health benefits or detriments of each. Justification of these decisions is in online Supplementary Table S1.
Component measurement methods and recommendations
Measurement methods chosen were either based on portions of representative foods or nutrient intakes. The NFDQI-65/NFDQI-65+PA and FDQI-65+PA measured fruit, vegetables, protein, low-fat dairy, wholegrain carbohydrates and fluid as portions of representative foods, and the NFDQI-65/NFDQI-65+PA measured free sugars, Na, fat and fatty acid, and alcohol as nutrient intakes. In comparison, the FDQI-65+PA measured the free sugars, Na, fat and fatty acid, and alcohol components as portions of representative foods which were selected based on main contributors to nutrient intakes in the National Diet and Nutrition Survey (NDNS) and the panel’s consensus decision.
Guidelines for food-group components were based on number of portions eaten, with a portion being a quantity considered as standard for UK adults (such as 80 g for fruits and vegetables)(31,40,41) to ensure applicability of the index to general UK portion sizes, or a quantity specified in Scientific Advisory Committee on Nutrition advice(25,42) . No age or sex-specific portion size guidance was identified and therefore portion sizes were generalised to older adults and both men and women. All portion weights were given as cooked or eaten. For nutrient components, quantitation was as mg, g or percentage of total energy intake (as relevant) and was guided by our previously proposed nutritional recommendations(Reference Dorrington, Fallaize and Hobbs27). For the NFDQI-65 and NFDQI-65+PA, nutrient intake data for Na and alcohol were used as mg and g, respectively, and free sugars, MUFA, PUFA and SFA were as percentage of total energy intake. Physical activity was assessed as min/d of moderate intensity activity which was calculated within the NDNS dataset from data collected using an NDNS-specific self-reported questionnaire (Year 1) or the self-reported Recent Physical Activity Questionnaire (Years 2 onwards). Full details of physical activity assessment methods are detailed elsewhere(Reference Mindell43).
Required numbers of portions for each food-based component were set by analysing nutritional composition of specified foods and considering the evidence-base, as well as the quantity required to meet specific nutritional recommendations. For example, for protein the index recommendation is ≥ 3 portions/d to promote protein consumption at each meal due to evidence of benefits of even protein distribution(Reference Tieland, Beelan and Laan44), and as it was determined that three portions of protein, combined with specified quantities of other protein-rich foods in the index including low-fat dairy, oily fish and wholegrain carbohydrates, would help support an individual to meet the nutritional recommendation we proposed of 1·2 g/kg per d(Reference Dorrington, Fallaize and Hobbs27). Similarly, for low-fat dairy, the recommendation of ≥ 3 portions/d of the specified quantities was calculated as each portion provides 200–250 mg Ca, therefore providing up to 75 % of our proposed daily Ca requirements of 1000 mg which, in conjunction with other dietary sources of Ca, should allow this to be met. Recommendations for oily fish were based on the most recent UK Scientific Advisory Committee on Nutrition advice(25), with 1 portion/week meeting advised long chain n-3 PUFA intake, and for physical activity were taken from the UK Physical activity guidelines for older adults (30). For the remainder of the components, decisions were made from panel discussions, taking into account UK Eatwell guide recommendations in the case of fruit, vegetables and wholegrain carbohydrates due to their evidence-based nature and to promote consistency between guidelines where any reason to differ did not exist. Full explanations for all components are in online Supplementary Table S1.
Index scoring
The components were scored in a manner that accounted for their evidence-based associations with health outcomes, negatively scoring those considered detrimental to health (i.e. lower intake receives higher score) and positively scoring those considered beneficial to health (i.e. higher intake receives higher score). Specifically, the fruit, vegetables, protein, oily fish, low-fat dairy, wholegrain carbohydrates, fat and fatty acids, fluid and physical activity components were positively appraised due to their proposed health benefits and the free sugar, Na and alcohol components negatively appraised due to their proposed detrimental effects and the conclusions from our previous review(Reference Dorrington, Fallaize and Hobbs27).
In the absence of qualitative evidence to suggest otherwise, components were equally weighted, with scores for each ranging between 0 and 10 points. This is in line with other widely used DQI, such as the HEI-2015 whose authors stated that dietary guidelines are to be considered as a whole and ‘all concepts are equally important’(Reference Krebs-Smith, Pannucci and Subar45). A score of 10 was awarded for full adherence to each component recommendation, except for the fat and fatty acids component of the NFDQI-65 and NFDQI-65+PA, which were subdivided into two sub-components (MUFA + PUFA:SFA ratio and SFA intake) each worth up to five points. A proportionate score was allocated for intakes between the minimum and maximum criteria using a linear slope, for example, if an individual consumed 1 portion of fruit/d (for which the recommendation is ≥ 2 portions/d), they would score 5 out of 10 points, whereas 1·5 portions of fruit/d would score 7·5. The maximum total score was 120 points for FDQI-65+PA and NFDQI-65+PA and 110 points for NFDQI-65. Higher scores reflect greater adherence to the recommendations.
Full details of the components and scoring methods of the DQI-65 variations are in Table 1.
Components and scoring method of DQI-65 variations*
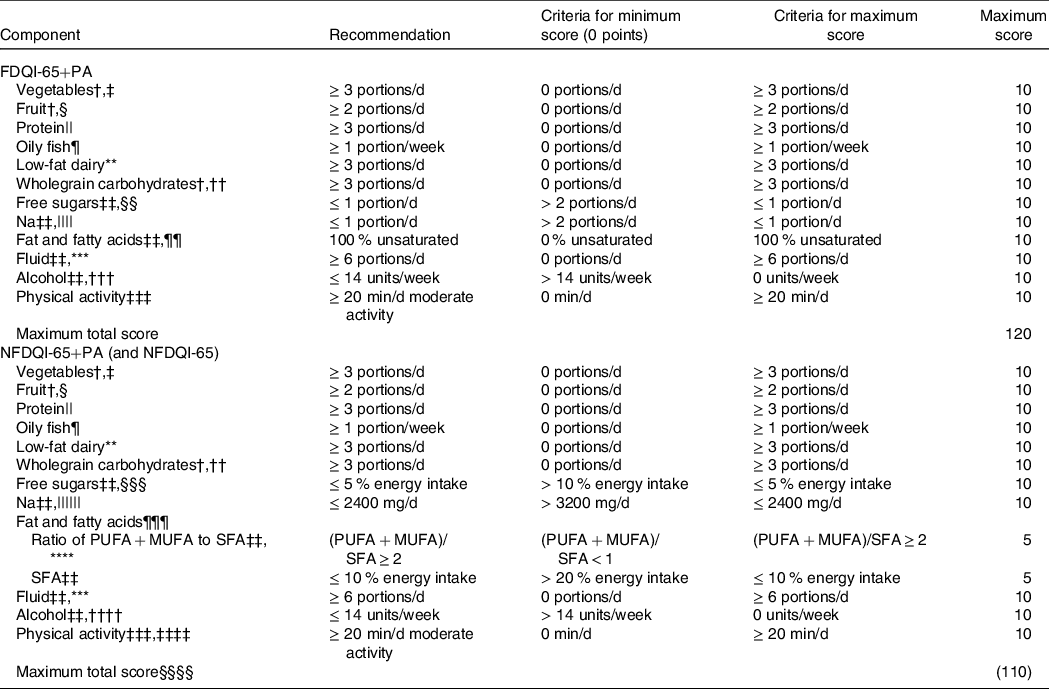
DQI-65, Diet Quality Index for older adults; FDQI-65+PA, Food-based Diet Quality Index for older adults with Physical Activity; NDNS, National Diet and Nutrition Survey; NFDQI-65, Nutrient and Food-based Diet Quality Index for older adults; NFDQI-65+PA, Nutrient and Food-based Diet Quality Index for older adults with Physical Activity; SACN, Scientific Advisory Committee for Nutrition.
* % energy intake refers to total energy.
† Quantification based on the UK Eatwell Guide recommendations(31).
‡ Portion sizes based on standard portions(31): 80 g vegetables or legumes, 15 g tomato puree; only up to 1 portion of legumes and 1 portion of tomato puree allowed.
§ Portion sizes based on standard portions(31): 80 g fruit, 150 ml fruit juice, 30 g dried fruit; only up to 1 portion of dried fruit or fruit juice allowed.
|| Represents food group from the UK Eatwell Guide (31); based on portions required to meet our previously proposed protein recommendations(Reference Dorrington, Fallaize and Hobbs27); standard portion sizes used(40): 70 g red meat, 100 g poultry, 140 g fish or shellfish, approximately 120 g or 2 eggs, 150 g legumes, 30 g nuts, 250 ml milk, 30 g cheese, 125 g yogurt, 100 g meat alternatives; only up to 1 portion of red meat (not processed meat), 1 portion of legumes or nuts and 1 portion of dairy or alternatives allowed per day.
¶ Quantification and portion size based on SACN advice(25); portion size 140 g cooked fish.
** Represents food group from the UK Eatwell Guide (31); quantification based on portions required to meet proposed Ca recommendations; low-fat milk, low-fat yogurt, reduced fat or low-fat cheese only, no other dairy included nor dairy alternatives; high fat dairy if BMI < 18·5 kg/m2; portion sizes based on standard portions(40): 250 ml milk, 30 g cheese, 125 g yogurt; 1 portion of cheese allowed per day.
†† Portion sizes based on standard portions(40): 190 g cooked pasta, rice or grains, 80 g bread or crackerbreads, 30 g breakfast cereals or flour.
‡‡ Quantification based on our previously proposed nutritional recommendations(Reference Dorrington, Fallaize and Hobbs27).
§§ Foods chosen are main contributors to free sugar intake in NDNS; portion sizes based on average available portions: 40 g cakes, biscuits or cereal bars, 100 g buns, pastries, pancakes, dairy desserts and sponge puddings, 20 g confectionery or sweet preserves, 330 ml sugar sweetened beverages, 15 g sugar.
|||| Foods chosen are main contributors to Na intake in NDNS; portion sizes based on average available portions or standard portion sizes(42): 25 g salty savoury snacks, crisps or salted nuts, 70 g processed meat.
¶¶ Based on cooking oils and spreads; percentage of spreads and oils predominantly comprised of unsaturated fatty acids; unsaturated oils and spreads defined as having fat composition of (MUFA + PUFA)/SFA ≥ 2; percentage calculated as proportion of MUFA/PUFA oils and spreads out of total oils and spreads; score of 5 assigned if no cooking oils or spreads used.
*** Portion sizes based on the UK Eatwell Guide recommendations(31): 250 ml; only up to 150 ml portion of fruit or vegetable juice allowed according to the UK Eatwell Guide (31); not including alcohol or sugar-sweetened beverages.
††† 1 portion equals 1 alcohol unit(41): 75 ml wine, 220 ml beer, lager, cider or alcoholic soft drinks, 25 ml spirits, liqueurs or fortified wine; not including low or no alcohol versions.
‡‡‡ Quantification based on UK physical activity guidelines (30); includes walking, cycling, swimming, dancing, gardening and other active leisure pursuits.
§§§ Represented as % total energy intake; based on non-milk extrinsic sugars where free sugars not available.
|||||| No lower limit set as recommendation to increase Na intake only justified based on diagnosis of low blood electrolytes; represented as mg/d; adjusted to account for underreporting in analysis based on average underreporting in NDNS sample compared with urinary Na; adjusted score based on 10 points for ≤ 2000 mg/d and 0 points for ≤ 2800 mg/d.
¶¶¶ Component split into two parts.
**** Ratio determined by recommended relative % contribution to energy intake for MUFA, PUFA and SFA.
†††† Represented as g/d; 1 unit is 8 g alcohol.
‡‡‡‡ Component not included in NFDQI-65.
§§§§ Total score for NFDQI-65 110 points.
Ability of diet quality indices to predict adherence to dietary recommendations and health markers
The three DQI-65 were assessed alongside two widely used and validated scores: the HEI-2015, which assesses adherence to the 2015–2020 USA Dietary Guidelines for Americans(Reference Krebs-Smith, Pannucci and Subar45), and the USA-based AHEI-2010, which assesses intake of foods and nutrients associated with chronic disease risk(Reference Chiuve, Fung and Rimm26).
Study design and population
Data were used for participants aged ≥ 65 years (n 1076) from years 2–6 of the UK NDNS rolling programme (2009/2010–2013/2014)(46) (the most recent available NDNS data when the DQI-65 was developed). The NDNS is a UK cross-sectional survey of randomly selected individuals aged ≥ 1·5 years designed to assess dietary intake and nutritional status of a representative UK population. The methodology of the NDNS has been fully described elsewhere(47) and is summarised in the online Supplemental Methods. Of importance, dietary assessment is based on 4-d diet diaries and physical activity measured via self-reported questionnaires on recent physical activity.
Individuals from year 1 were excluded due to the absence of physical activity data (n 174), as were participants in years 2–6 where these data were not reported (n 29), and those with energy intake <2510 kJ/d (<600 kcal/d) (2510-18828 kJ (600–4500 kcal) reflected reasonable intake(Reference Fallaize, Forster and Macready48)) (n 2), leaving a total of 871 participants in the final analysis.
Variables and measurement method
In the present analysis, data for food and nutrient intake (excluding nutrients from vitamin, mineral or other dietary supplements) from the NDNS were used to calculate DQI-65 scores for each participant as per the index criteria (Table 1). Disaggregated foods were selected from the NDNS dataset where available (fruit, vegetables, legumes, meat, fish, nuts and cheese), or data for individual food items were collated, using conversion factors and standard recipes from McCance and Widdowson’s The Composition of Foods, 6 th & 7 th Summary Editions (49,50) for obtaining cooked weights for wholegrain foods or disaggregating additional dishes where necessary to contribute to the DQI-65 calculations.
HEI-2015 and AHEI-2010 scores were also calculated for all subjects based on their original methodology(Reference Chiuve, Fung and Rimm26,Reference Krebs-Smith, Pannucci and Subar45) in a similar manner to the DQI-65. Insufficient guidance was available for calculating the Elderly Dietary Index in our population(Reference Kourlaba, Polychronopoulos and Zampelas9), so a comparison was not possible. Details of components in the HEI-2015 and AHEI-2010 are in online Supplementary Table S2.
Ethical considerations
The NDNS was conducted according to the guidelines laid down in the Declaration of Helsinki, and ethical approval for all procedures was granted by Local Research Ethics Committees covering all areas covered in the survey. All participants gave informed consent.
Statistical analysis
Mean component and total scores, and percentages of subjects achieving maximum component scores, were calculated for the DQI-65, HEI-2015 and AHEI-2010 to assess adherence to index recommendations. Data are expressed as mean (sd) or percentages. Where mean (sd) is used, data are also represented as percentages to facilitate comparison between scores.
Statistical tests were performed in SPSS Version 25.0 (SPSS Inc.), where P-values <0·01 were considered statistically significant on account of multiple testing. Data were visually inspected for normality. Variables identified as not normally distributed were log-transformed prior to analysis (see table footnotes). Sample weights were generated by the NDNS to adjust for differences in probability of selection and for non-response. The three types of weights used were (1) interviewer weights, which were applied to demographic and dietary data to adust for non-response to the individual interview and food diaries, (2) nurse weights, which were applied to health outcome measures taken in the nurse visit (e.g. weight, blood pressure (BP)) to adjust for differences in participants and non-participants with these and (3) blood sample weights, which were applied to all biomarkers of nutritional status and health outcomes based on biochemical measures to adjust for non-response to blood samples. Full details of how sample weights were calculated have been previously published(Reference Tipping51).
To investigate the predictive ability of the DQI-65 in relation to the proposed nutritional recommendations for adults aged ≥ 65 years from our previous review(Reference Dorrington, Fallaize and Hobbs27), through which our decisions around components, portion or nutrient recommendations and scoring method could be explored, participants were classified by whether they met proposed nutritional recommendations(Reference Dorrington, Fallaize and Hobbs27) based on daily nutrient intake from NDNS data. Associations between DQI-65, HEI-2015 and AHEI-2010 scores and odds of meeting these nutritional recommendations for these categorical variables were assessed using binomial logistic regression analysis.
To investigate health markers, associations between DQI-65, HEI-2015 and AHEI-2010 total scores and (1) biochemical markers of nutritional status (plasma 25-hydroxyvitamin D, serum vitamin B12, plasma total homocysteine, Hb concentration, plasma α-tocopherol, plasma β-carotene), (2) anthropometric measures (BMI, obesity, waist circumference (WC), visceral obesity), (3) selected health indicators (medication use, longstanding illness, self-assessed health, activity limitation due to illness), (4) cardiometabolic risk factors (systolic blood pressure, DBP, hypertension, total cholesterol (TC), fasting TAG, LDL-cholesterol, HDL-cholesterol, TC:HDL-cholesterol, C-reactive protein (CRP), fasting glucose, glycated Hb, classification of the metabolic syndrome(52)) were assessed using linear regression analysis for continuous variables and logistic regression analysis for categorical variables. Missing data in the NDNS dataset meant different numbers of subjects were included in the health marker analyses. Since the maximum score available differed between scores, they were adjusted by proportional scaling for direct comparison between DQI and to allow for a greater magnitude of change to be assessed than when considering a 1-point change. Therefore, a change in unadjusted B coefficient or OR represents a 5 % change in DQI-65, AHEI-2010 and HEI-2015 scores (equivalent to a standard unit increase of six points for FDQI-65+PA and NFDQI-65+PA, 5·5 points for NFDQI-65 and AHEI-2010 and five points for HEI-2015 scores).
Analyses of associations between DQI-65, HEI-2015 and AHEI-2010 scores and odds of meeting nutritional recommendations were performed unadjusted. However, for health outcomes and biochemical markers of nutritional status, a step-wise approach for confounder adjustment was implemented to assess whether the DQI predicted risk above and beyond other potential modifying factors. Confounders adjusted for were age and sex (model 1), model 1 confounders plus BMI, WC, supplement use (nutrient biomarker analyses only), BP and/or lipid lowering medication (where applicable) and smoking status (model 2) and model 2 confounders plus income, marital status and education level (model 3). Unless specified, the results discussed are from the most adjusted model.
Results
Characteristics of study population, and diet quality index total and component scores
The mean age of the 871 subjects included in the analysis was 74 (sd 7) years, and 44·2 % were men. Study population characteristics are detailed in Table 2.
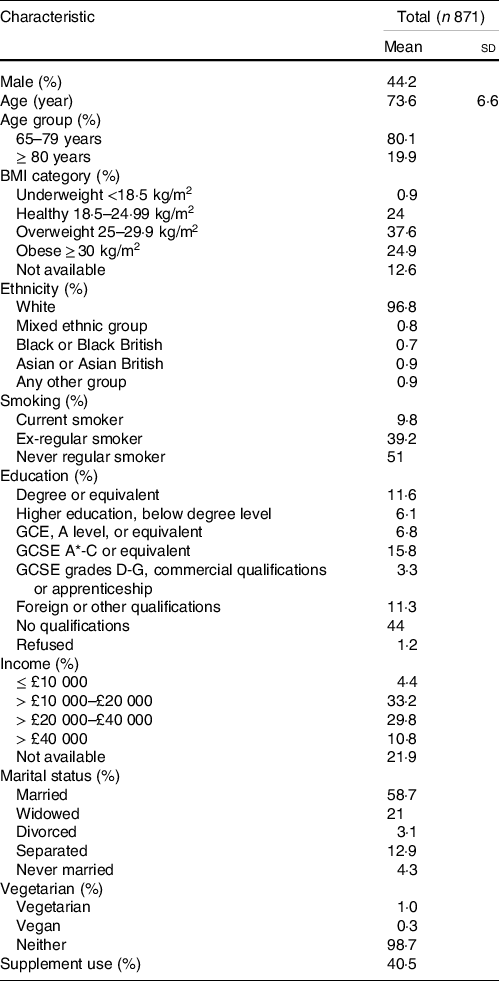
NDNS, National Diet and Nutrition Survey.
* Values for continuous variables are mean ± sd and values for categorical variables are percentages of subjects within each category; NDNS interviewer weights applied.
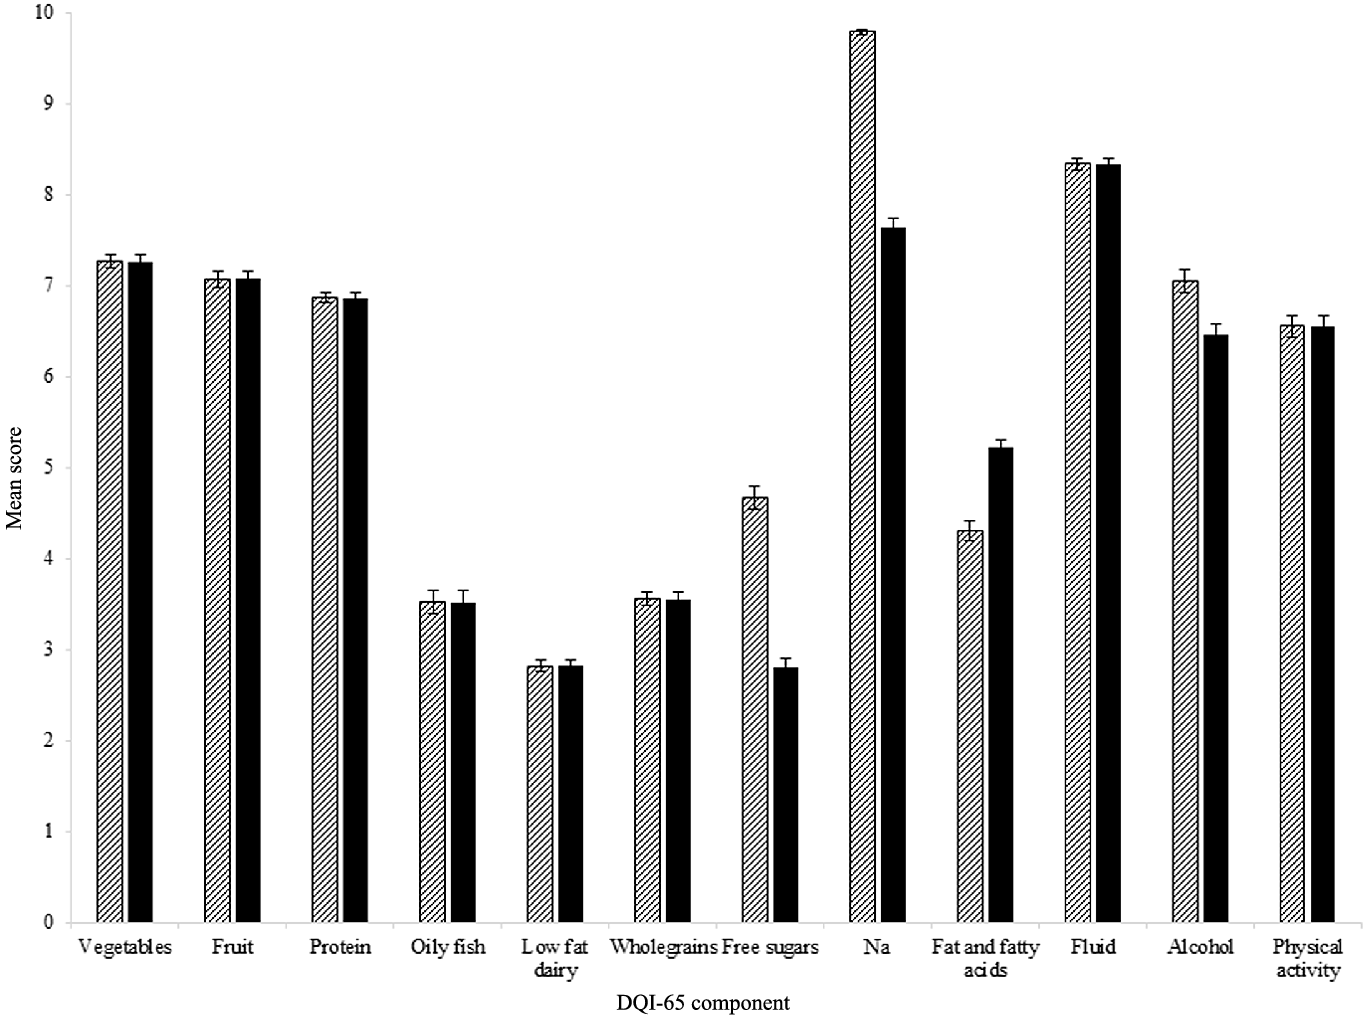
Mean total DQI-65 scores were 71·8 (15·1) out of 120 for the FDQI-65+PA (59·8 %), 68·1 (14·4) out of 120 for the NFDQI-65+PA (56·8 %) and 61·6 (12·8) out of 110 for the NFDQI-65 (56·0 %). Mean component scores in all DQI-65 were ≥ 7 out of 10 for vegetables, fruit, protein, fluid and Na, reflecting greater adherence to these recommendations, whereas they were ≤ 3 out of 10 for low-fat dairy and NFDQI-65/NFDQI-65+PA free sugars (Fig. 1). Correspondingly, ≥ 50 % of subjects scored maximum points for the Na component in all DQI-65, alcohol in the FDQI-65+PA and physical activity in the FDQI-65+PA/NFDQI-65+PA. Conversely, ≤ 10 % of subjects scored maximum points for protein, low-fat dairy, wholegrain carbohydrates and NFDQI-65/NFDQI-65+PA fat and fatty acids, suggesting low adherence to these recommendations in UK adults aged ≥ 65 years.
Mean ± sem score per component of FDQI-65+PA and NFDQI-65+PA calculated using data for adults aged ≥ 65 years from UK National Diet and Nutrition Survey (NDNS) rolling programme Years 2–6 (n 871). NFDQI-65 component scores identical to NFDQI-65+PA, except for physical activity which is not included in the NFDQI-65. Maximum score of 10 available per component. NDNS interviewer weights applied. FDQI-65+PA, Food-based Diet Quality Index for older adults with physical activity; NFDQI-65, Nutrient and Food-based Diet Quality Index for older adults; NFDQI-65+PA, Nutrient and Food-based Diet Quality Index for older adults with physical activity. ![]() , FDQI-65+PA;
, FDQI-65+PA; ![]() , NFDQI-65+PA.
, NFDQI-65+PA.
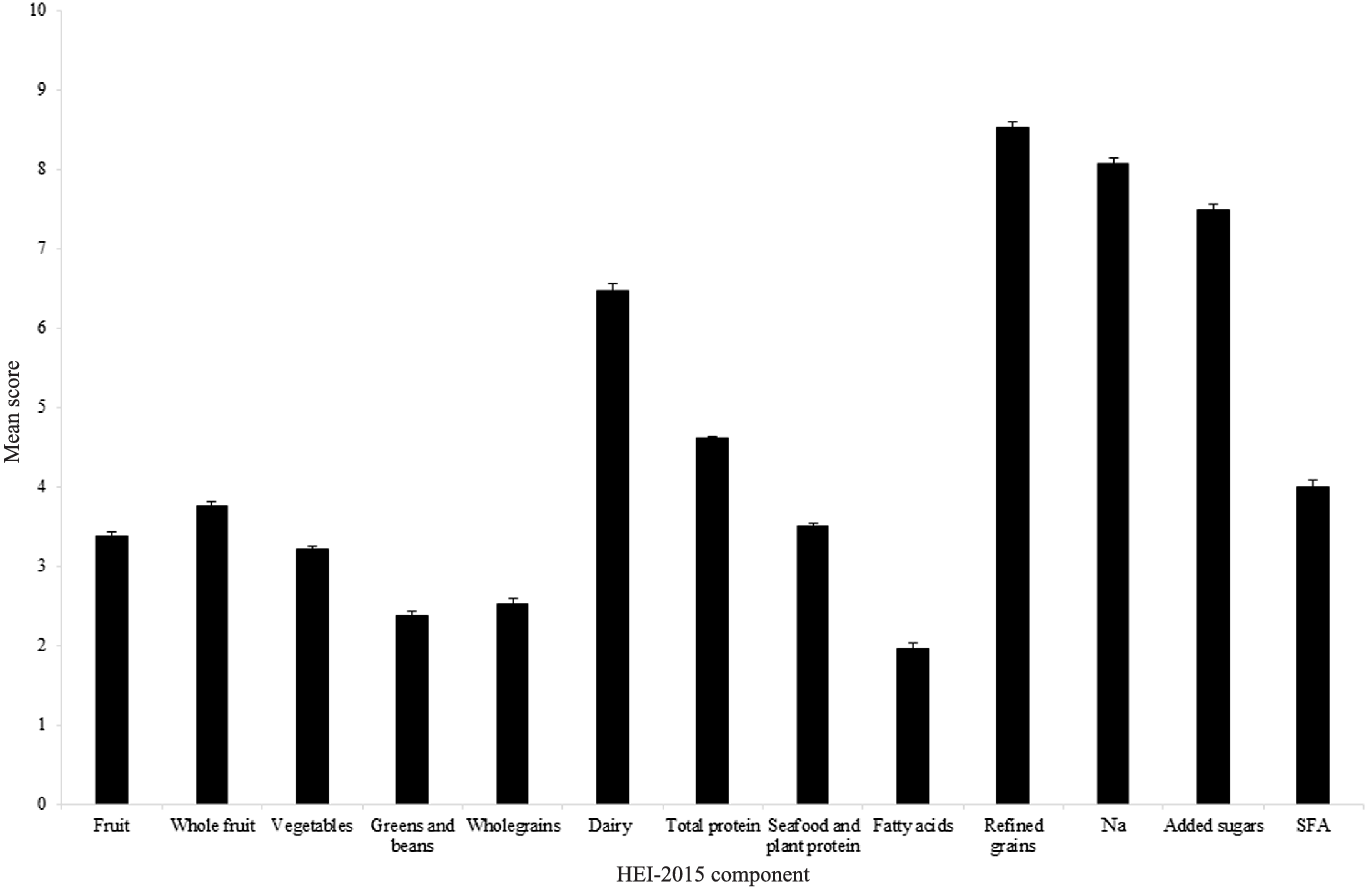
The mean HEI-2015 score was 59·9 (11·3) out of 100 (59·9 %), with component scores of ≥ 3·5 out of 5 or ≥ 7 out of 10 for total protein, refined grains, Na and added sugars, and ≤ 1·5 out of 5 or ≤ 3 out of 10 for wholegrains, fatty acids and SFA (Fig. 2). For whole fruit, total protein and refined grains, ≥ 50 % of subjects scored maximum points, yet for wholegrains, fatty acids and SFA only ≤ 10 % of subjects scored maximum points.
Mean ± sem score per component of HEI-2015 calculated using data for adults aged ≥ 65 years from UK National Diet and Nutrition Survey (NDNS) rolling programme Years 2–6 (n 871). Maximum score of 5 available for fruit, whole fruit, vegetables, greens and beans, total protein, and seafood and plant protein components. Maximum score of 10 available for wholegrains, dairy, fatty acids, refined grains, Na, added sugars and SFA components. NDNS interviewer weights applied. HEI-2015, Healthy Eating Index-2015.
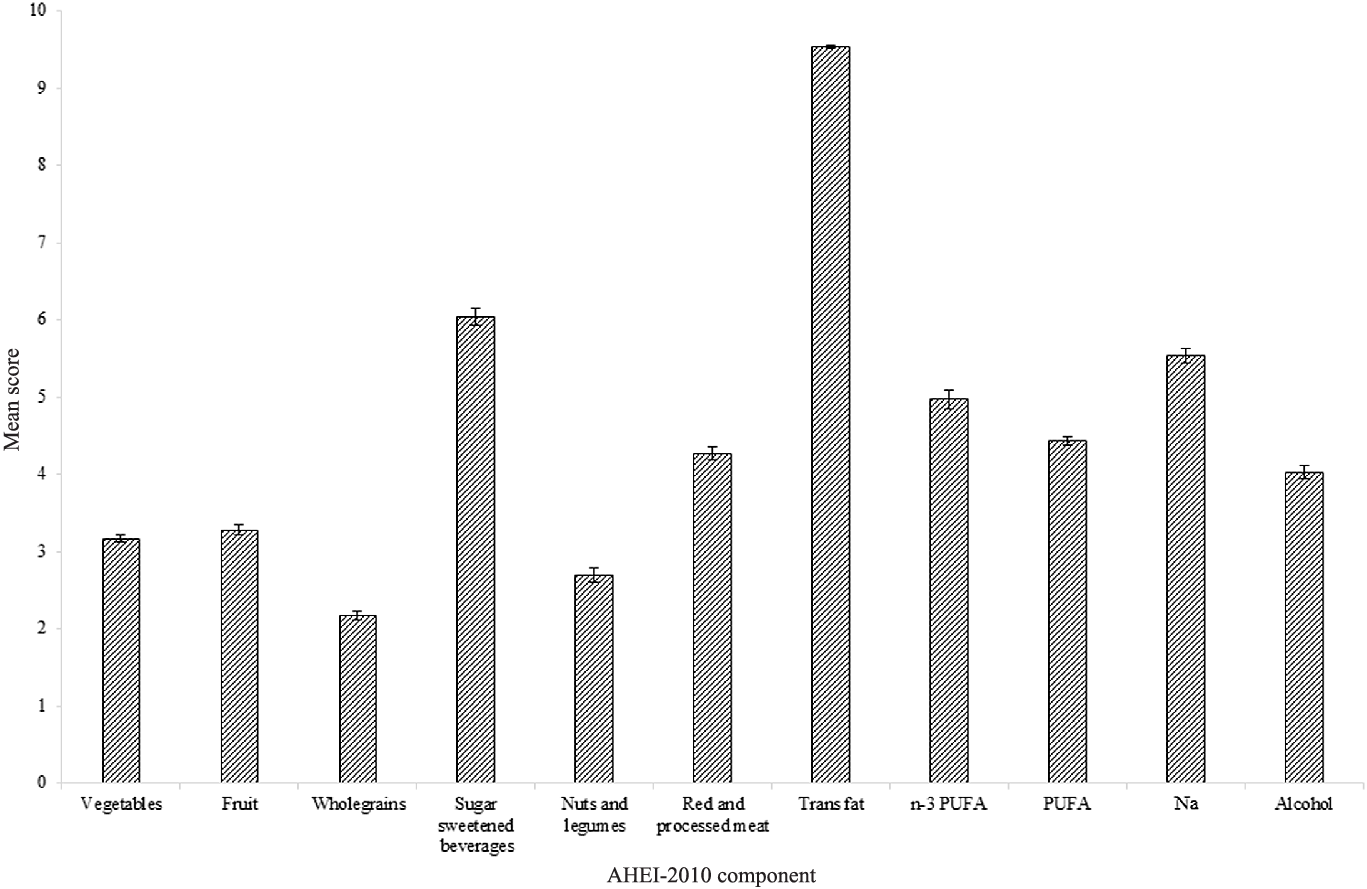
Mean AHEI-2010 score was 50·1 (11·4) out of 110 (45·5 %), with scores of ≥ 7 out of 10 for trans fatty acids, and of ≤ 3 out of 10 for the wholegrains and nuts and legumes components (Fig. 3). Proportions of subjects scoring maximum points were ≤ 10 % for vegetables, fruit, wholegrains, nuts and legumes, red and processed meat and PUFA.
Mean ± sem score per component of AHEI-2010 calculated using data for adults aged ≥ 65 years from UK National Diet and Nutrition Survey (NDNS) rolling programme Years 2–6 (n 871). Maximum score of 10 available per component. NDNS interviewer weights applied. AHEI-2010, Alternative Healthy Eating Index-2010.
Full details of mean component scores and proportions meeting recommendations for each component are in online Supplementary Table S2.
Associations between Diet Quality Index for older adults, Healthy Eating Index-2015 and Alternative Healthy Eating Index-2010 scores and nutrient intake
As per Table 3, higher FDQI-65+PA, NFDQI-65 and NFDQI-65+PA scores were significantly associated with increased odds of meeting recommendations for almost all nutrients, except carbohydrates, MUFA, PUFA, Na and alcohol for the FDQI-65+PA and MUFA and PUFA for the NFDQI-65+PA. In contrast, HEI-2015 and AHEI-2010 scores were not associated with increased odds of meeting our previously proposed nutritional recommendations(Reference Dorrington, Fallaize and Hobbs27) for several nutrients of age-specific importance including Ca, vitamin D, vitamin B12 and alcohol (for the HEI-2015), and Ca, Zn, vitamin D, folate, vitamin B12, vitamin B6 and alcohol (for the AHEI-2010).
Association between DQI-65, HEI-2015 and AHEI-2010 scores and odds of meeting nutritional recommendations for subjects aged ≥ 65 years from UK NDNS Years 2–6 (n 871)*
(Means and standard deviations; odds ratios; 95 % confidence intervals)
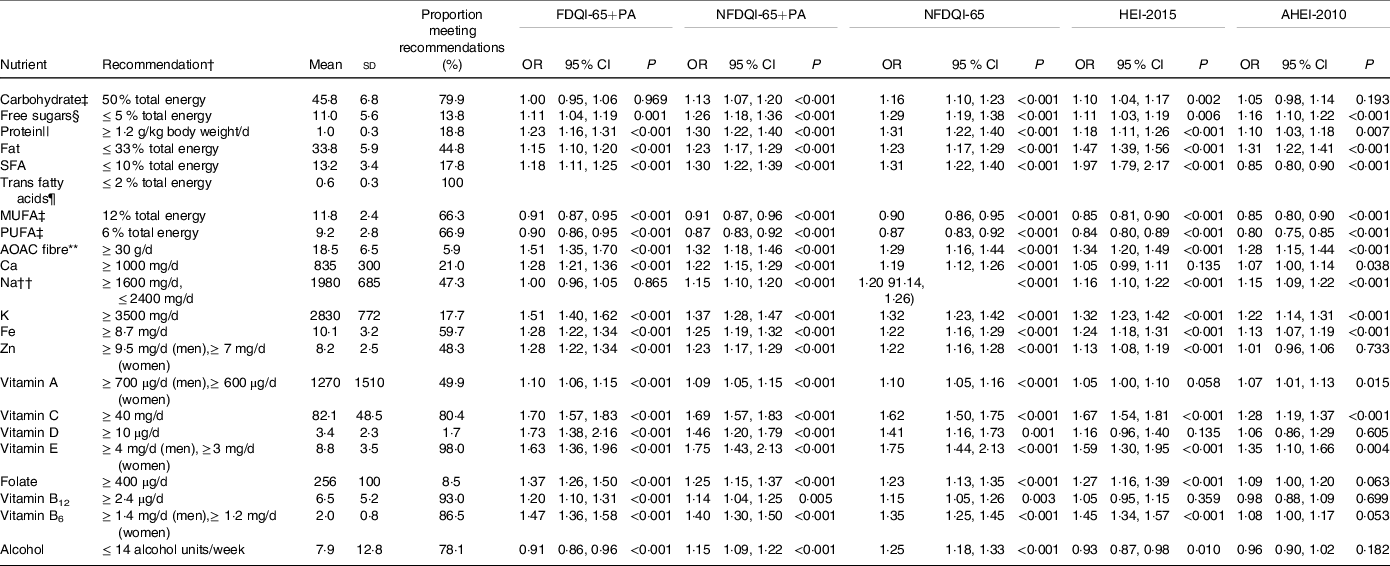
AHEI-2010, Alternative Healthy Eating Index-2010; AOAC, Association of Analytical Chemists; DQI-65, Diet Quality Index for older adults; FDQI-65+PA, Food-based Diet Quality Index for older adults with Physical Activity; HEI-2015, Healthy Eating Index-2015; NDNS, National Diet and Nutrition Survey; NFDQI-65, Nutrient and Food-based Diet Quality Index for older adults; NFDQI-65+PA, Nutrient and Food-based Diet Quality Index for older adults with Physical Activity.
* Values are OR of meeting recommendations based on a 5 % increase in DQI-65, AHEI-2010 or HEI-2015 total score; two models presented; maximum scores available 120 points (NFDQI-65, AHEI-2010 and HEI-2015 scores adjusted to maximum 120 points prior to analysis for comparison); P-values for significance of OR by logistic regression (NDNS interviewer weights applied); % energy intake refers to total energy.
† Recommendations based on nutritional requirements for UK adults ≥ 65 years proposed in our recent review(Reference Dorrington, Fallaize and Hobbs27).
‡ Nutrient recommendations set as population average; meeting recommendations classified as within ±20 % of recommendation: carbohydrates 45–55 % total energy, MUFA 10·4–15·6 % total energy, PUFA 4·8–7·2 % total energy.
§ Free sugars represented by non-milk extrinsic sugars from NDNS.
|| Results from 800 subjects due to non-response for body weight measurement.
¶ No association reported as all subjects meeting recommendations for trans fatty acids.
** Nutrient intake approximate conversion from NSP fibre to AOAC; conversion factor 1·33 as used in NDNS(63).
†† Adjusted for underreporting in analysis based on average underreporting of 25 % in NDNS from comparison with urinary Na; meeting recommendations based on 1200 mg/d–2000 mg/d instead of 1600 mg/d–2400 mg/d.
Associations between diet quality index scores and biomarkers of nutrient intake
DQI-65, HEI-2015 and AHEI-2010 scores were significantly positively associated with nutritional intake biomarkers of relevance among older adults, particularly serum vitamin B12 and plasma 25-hydroxyvitamin D, when adjusted for age and sex only, but not with Hb concentration (online Supplementary Table S3). After adjustment for all covariates, including supplement use and socio-economic factors (model 3), the associations between DQI-65 and serum vitamin B12 became non-significant (Table 4) and AHEI-2010 scores became significantly inversely associated with Hb concentration. Results for all models are in online Supplementary Table S4.
Association between DQI-65, HEI-2015 and AHEI-2010 scores and biomarkers of nutrient intake for subjects aged ≥ 65 years from UK NDNS years 2–6*
(Means and standard deviations; 95 % confidence intervals)
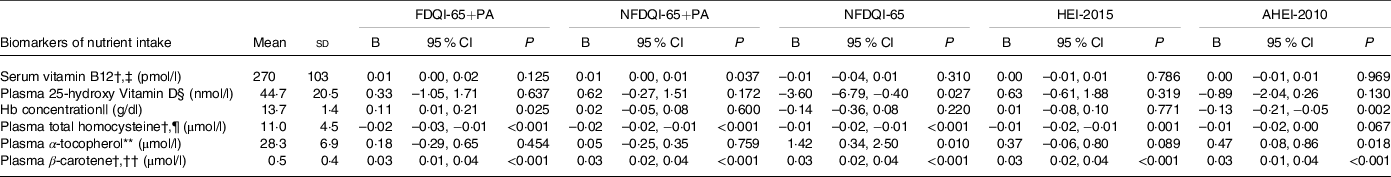
AHEI-2010, Alternative Health Eating Index-2010; DQI-65, Diet Quality Index for older adults; FDQI-65+PA, Food-based Diet Quality Index for older adults with Physical Activity; HEI-2015, Healthy Eating Index-2015; NDNS, National Diet and Nutrition Survey; NFDQI-65, Nutrient and Food-based Diet Quality Index for older adults; NFDQI-65+PA, Nutrient and Food-based Diet Quality Index for older adults with Physical Activity.
* Values are unstandardised B coefficients for continuous variables of change in dependent variable intake with a 5 % increase in DQI-65, AHEI-2010 or HEI-2015 total score and OR for categorical variables indicating odds of health outcome based on a 5 % increase in DQI-65, AHEI-2010 or HEI-2015 total score; maximum score available 120 points (FNDQI-65 no PA, AHEI-2010, HEI-2015 scores adjusted to maximum 120 points for comparison); P-values are test for significance of relationship between DQI-65, AHEI-2010 or HEI-2015 score and nutrient intake by linear regression for continuous variables or significance of OR by logistic regression for categorical variables; NDNS blood weights applied; most adjusted model presented; model 3 adjusted for age, sex, BMI, waist circumference, supplement use (and Fe medication), education, marital status and income.
† Dependent variable transformed by log10 to improve normality; unstandardised B coefficient and CI are log-increase in variable by 5 % increase in total score.
‡ n 382.
§ n 374.
|| n 326.
¶ n 306.
** n 378.
†† n 377.
Associations between diet quality index scores and health markers
When adjusting for age and sex only, DQI-65, HEI-2015 and AHEI-2010 scores were all significantly inversely associated with anthropometric measures (BMI and WC), medication use, fasting TAG, CRP and odds of being classified with the metabolic syndrome (except for NFDQI-65 and NFDQI-65+PA). They were also significantly positively associated with odds of good self-assessed health (online Supplementary Table S4). Differential associations existed with other cardiometabolic risk factors (i.e. cholesterol markers and BP), with higher FDQI-65+PA scores being significantly associated with higher TC and HDL-cholesterol, and higher NFDQI-65 and NFDQI-65+PA scores being significantly associated with lower DBP.
After adjustment for age, sex, BMI and WC (where appropriate), smoking and relevant medications (model 2), associations between FDQI-65+PA scores and TC were attenuated to become non-significant, as were associations between NFDQI-65, NFDQI-65+PA and AHEI-2010 and both TAG and the metabolic syndrome classification, and NFDQI-65 and odds of good self-assessed health. All other previously observed associations remained significant in model 2.
After full adjustment, several of the associations were further attenuated to become non-significant. However, significant inverse associations remained between all DQI and BMI, WC (except AHEI-2010 and FDQI-65+PA), medication use and CRP (Table 5). Moreover, higher FDQI-65+PA scores remained significantly associated with lower odds of being classified with the metabolic syndrome and higher odds of good self-assessed health, and higher NFDQI-65+PA and NFDQI-65 scores remained associated with lower DBP. Finally, higher HEI-2015 scores remained significantly associated with higher odds of good self-assessed health. AHEI-2010 scores did not remain associated with any other outcomes.
Associations between DQI-65, HEI-2015 and AHEI-2010 scores and health status measures and metabolic markers for subjects aged ≥ 65 years from UK NDNS years 2–6*
(Means and standard deviations; 95 % confidence intervals)
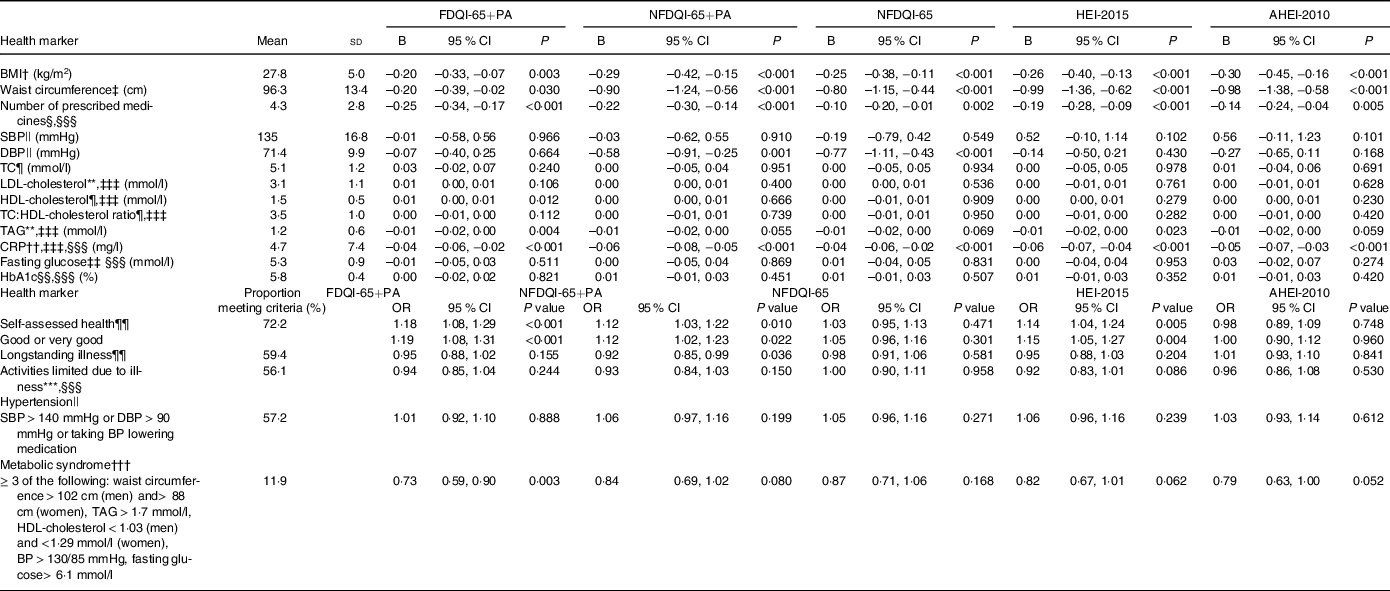
AHEI-2010, Alternative Healthy Eating Index-2010; CRP, C-reactive protein; DBP, diastolic blood pressure; DQI-65, Diet Quality Index for older adults; FDQI-65+PA, Food-based Diet Quality Index for older adults with Physical Activity; HbA1C, glycated Hb; HEI-2015, Healthy Eating Index-2015; NDNS, National Diet and Nutrition Survey; NFDQI-65, Nutrient and Food-based Diet Quality Index for older adults; NFDQI-65+PA, Nutrient and Food-based Diet Quality Index for older adults with Physical Activity; SBP, systolic blood pressure; TC, total cholesterol.
* Values are unstandardised B coefficient for continuous variables of change in dependent variable intake with a 5 % increase in DQI-65, AHEI-2010 or HEI-2015 total score and OR for categorical variables indicating odds of health outcome based on a 5 % increase in DQI-65, AHEI-2010 or HEI-2015 total score; maximum score available 120 points (NFDQI-65, AHEI-2010, HEI-2015 scores adjusted to maximum 120 points for comparison); P-values are test for significance of relationship between DQI-65 or HEI-2010 score and nutrient intake by linear regression for continuous variables or significance of OR by logistic regression for categorical variables; fully adjusted model(s) presented.
† n 767; NDNS interviewer weights applied; adjusted for age, sex, smoking, education, marital status and income.
‡ n 566; NDNS nurse weights applied; adjusted for age, sex, BMI, smoking, education, marital status and income.
§ n 471; NDNS nurse weights applied.
|| n 419; NDNS nurse weights applied; adjusted for age, sex, BMI, waist circumference, blood pressure medication (for SBP and DBP), smoking, education, marital status and income.
¶ n 333; NDNS blood weights applied; adjusted for age, sex, BMI, waist circumference, lipid medication, smoking, education, marital status and income.
** n 330; NDNS blood weights applied; adjusted for age, sex, BMI, waist circumference, lipid medication, smoking, education, marital status and income.
†† n 381; NDNS blood weights applied.
‡‡ n 336; known diabetics excluded; NDNS blood weights applied.
§§ n 333; known diabetics excluded; NDNS blood weights applied.
¶¶ n 451; NDNS interviewer weights applied; adjusted for age, sex, BMI, waist circumference, smoking, education, marital status and income; model 4 (self-assessed health only) adjusted for age, sex, BMI, waist circumference, smoking, education, marital status, income and longstanding illness.
*** n 291; NDNS interviewer weights applied.
††† n 321; subjects included if 5 variables available or ≥ 3 variables available when ≥ 3 variables meet criteria for the metabolic syndrome; NDNS blood weights applied; adjusted for age, sex, BMI, blood pressure medication, lipid medication, smoking, education, marital status and income.
‡‡‡ log10 transformation applied to improve normality; unstandardised B coefficient and CI is log-increase in variable by 5 % change in dietary score.
§§§ Adjusted for age, sex, BMI, waist circumference, smoking, education, marital status and income.
|||| n 443; NDNS nurse weights applied.
Discussion
This study developed three variations of the DQI-65, which were tailored to nutritional and, in the case of FDQI-65+PA and NFDQI-65+PA, physical activity recommendations for UK older adults aged ≥ 65 years. Unique aspects of the DQI-65 were the positive appraisal of protein, inclusion of physical activity (FDQI-65+PA/NFDQI-65+PA) and fluid, and the negative appraisal of alcohol. The DQI-65 variations differed in component assessment method, with the FDQI-65+PA using a food-based approach, such as portions/d of sugary foods, number of alcoholic drinks and ratio of unsaturated fat rich oils and spreads to those containing primarily SFA. In contrast, the NFDQI-65+PA and NFDQI-65 assessed these components using a nutrient-based approach, such as mg/d, alcohol units and percentage of total energy intake. These variations were created to assess the optimum composition of a DQI for this age group through evaluating the impact of selecting food groups (such as portions/d of sugary foods, number of alcoholic drinks), which would more easily translate into dietary and lifestyle advice) v. food groups and nutrients (such as sugar as percentage of total energy, alcohol units), and of the inclusion of physical activity on associations with the index.
All three of the DQI-65 scores were associated with increased odds of meeting almost all of our previously proposed nutritional recommendations(Reference Dorrington, Fallaize and Hobbs27) when using UK population nutritional intake data for those aged ≥ 65 years. This demonstrates the DQI-65, as composite indexes, effectively represent individual age-specific nutritional recommendations upon which they were developed. This was particularly the case for certain nutrients of importance among older adults such as protein, Ca, vitamin D and Zn, for which the DQI-65 demonstrated greater association with adherence to recommendations of these nutrients (based on larger magnitude of effect) relative to the HEI-2015 and AHEI-2010. Since the nutritional recommendations assessed against were also used to develop the DQI-65, these findings may be considered biased. However, it seems prudent that any DQI to be used within this age group (whether this be the novel DQI-65 or existing HEI-2015/AHEI-2010) should predict adherence to these evidence-based recommendations.
In contrast to the NFDQI-65 and NFDQI-65+PA, higher FDQI-65+PA scores were associated with a lower likelihood of meeting recommendations for alcohol intake. This was surprising as all scores assessed units of alcohol, whether directly or via numbers of drinks. It may be that those with higher alcohol intakes also had greater diet quality when considering other components (e.g. lower intakes of salty or sugary foods, higher intakes of vegetables) resulting in this unexpected association. Furthermore, there was a lack of association between FDQI-65+PA scores and Na intake. This may be due to the assessment of portions/d of salty foods rather than absolute Na intakes (as per the NFDQI-65/NFDQI-65+PA). It is likely that Na intake was underestimated in the FDQI-65+PA as only key sources of Na were included in the ‘salty foods’ classification. Therefore, component choices (food v. nutrition based) and scoring methods are important in DQI design, with current findings suggesting the NFDQI-65 and NFDQI-65+PA may be superior to the FDQI-65+PA when assessing nutritional intake in relation to evidence-based requirements.
Similarly, results suggest that the NFDQI-65 and NFDQI-65+PA may be more suited to assessing the dietary quality of UK older adults in relation to adequacy of nutritional intake than the HEI-2015 and AHEI-2010. For example, the HEI-2015 showed weaker associations with Ca and vitamin A intake than the DQI-65, which could be attributed to the quantification method for dairy, a rich source of these nutrients, where the HEI-2015 sums total dairy irrespective of type (including fortified soya products), yet the DQI-65 account for typical portion sizes of milk, yogurt and cheese, which vary in their nutritional profiles. As Ca intake is key in preserving bone health(Reference Dorrington, Fallaize and Hobbs27), this approach may enhance predictive ability for musculoskeletal outcomes, although this would need confirmation using markers of bone health. Moreover, neither the HEI-2015 nor AHEI-2010 was associated with odds of meeting vitamin B12 recommendations, deficiency in which is prevalent among older adults due to impaired absorption with ageing and poor intake of vitamin B12-rich foods(Reference Fernández-Barrés, Martín and Canela53). Dairy and other animal products are also good sources of vitamin B12, therefore the higher weighting towards animal products in the DQI-65 may have contributed to the positive association with odds of meeting vitamin B12 recommendations, supporting its use to assess nutritional quality in an older population. Due to the HEI-2015 and AHEI-2010 being developed for a US rather than UK population, and based on the DQI-65 closely reflecting the proposed nutritional recommendations against which they were tested, greater suitability of the DQI-65 may be unsurprising. Further investigation is required to confirm this conclusion.
The DQI-65, HEI-2015 and AHEI-2010 were all associated with various markers of cardiometabolic risk. For example, NFDQI-65 and NFDQI-65+PA (but not FDQI-65+PA, HEI-2015 and AHEI-2010) scores were inversely associated with DBP, and high BP is considered the leading risk factor for morbidity and mortality globally(Reference Forouzanfar, Afshin and Alexander54), particularly relating to CVD(Reference Forouzanfar, Liu and Roth55). Na intake has been positively associated with DBP in older adults(Reference Alam, Purdie and Johnson36); therefore, lack of association between DBP and the FDQI-65+PA may result from differential assessment of Na intake as previously discussed.
Higher DQI-65 scores were associated with lower medication use, and the FDQI-65+PA with better self-assessed health, like the HEI-2015. This suggests potential value of these indexes in predicting quality of life measures in an older population. The NFDQI-65+PA, NFDQI-65 and HEI-2015 were also associated with lower WC, yet the FDQI-65+PA was not. Higher WC is considered an independent risk factor for mortality(Reference Cerhan, Moore and Jacobs56), a key indicator of insulin resistance and overall cardiometabolic health(Reference Després, Lemieux and Bergeron57), and has been inversely associated with grip strength(Reference Keevil, Luben and Dalzell58), which is a component of Fried’s frailty phenotype(Reference Fried, Tangen and Walston19). Finally, significant negative associations were also observed between CRP and all five DQI. Like WC, higher CRP is associated with lower grip strength(Reference Hamer and Molloy59) and increased disability risk(Reference Legrand, Vaes and Mathei60).
When comparing the NFDQI-65 with and without physical activity, the magnitude of effect for associations between the NFDQI-65+PA and both CRP and number of medications was higher than for the NFDQI-65, whereas this was lower for associations with DBP. Few other differences existed in the present analysis with overall associations between the two NFDQI-65 (with/without physical activity) and nutrient, biochemical and health variables similar in both significance and magnitude of effect. Therefore, without statistical comparison between indexes it cannot be concluded whether including a physical activity component in the DQI-65 impacts associations and requires further investigation. In contrast, the NFDQI-65s may potentially be superior to the FDQI-65+PA due to marginally greater associations with adherence to nutritional recommendations and some important health markers (e.g. BMI, WC and DBP). However, associations with health markers are limited by the methodology of the statistical analysis. Specifically, the cross-sectional NDNS data result in potential for reverse causality where dietary change has occurred following chronic disease diagnosis or identification of risk factors (e.g. high BP or TC), or where functional decline affects food accessibiliy, meal preparation and impairs food choice. This affects validity of associations, prevents cause and effect from being established and limits conclusions regarding both the predictive and comparative value of individual DQI. In addition, 4-d diet diaries may not reflect habitual diet, especially for components with weekly recommendations (e.g. oily fish and alcohol), and bias may exist in dietary records; therefore, it is possible that subject misclassification exists. Consequently, prospective cohort studies using dietary assessment methods that capture longer term habitual diet (such as FFQ) would help explore associations with clinical events, morbidity and mortality to determine the value of the novel DQI-65 in assessing dietary quality in relation to health outcomes. This is a future aim to scientifically validate the DQI-65.
This study’s strengths include the development of three DQI-65 variations and comparison with validated and widely used indexes. Moreover, despite high non-response rates in the NDNS for biological risk factors, applying sample weights reduced risk of selection and non-response bias(Reference Tipping51) and facilitated validation within a representative sample of UK older adults. However, some limitations exist. Development of the DQI-65 required subjectivity and, although decisions were justified by current research, different components and scoring methods may alter associations. For example, assumptions were made in equally weighting components (in line with approaches used by HEI-2015 and AHEI-2010) due to the absence of qualitative evidence to support a different approach and the aim of targeting a range of health outcomes and markers of diet quality. Also, factor analysis was not performed to ensure that all included components relate to a single underlying dimension. Protein recommendations of 1·2 g/kg per d may also be insufficient for those who undertake high levels of physical activity which would not be captured in the index. Moreover, maximum DQI-65 scores were only obtainable if both dairy and oily fish were consumed as some consider the anabolic potential of animal protein in older adults higher than plant protein(Reference Gorissen and Witard61); however, applicability to vegetarian or vegan groups is limited. Further investigation is required to justify these decisions. Some measures of nutrient status (e.g. Hb) may not directly reflect dietary intake due to physical adaptation to low status increasing bioavailability, affecting interpretation of results. Na content of water, which can be significant, was not fully quantified in NDNS data and may have impacted assessment of Na intake. Furthermore, less than 10 % of individuals met many of our nutritional recommendations and criteria for health marker variables, so the commonly used OR (Reference Xu, Houston and Locher18,Reference Huijbregts, Fekens and Räsänen62) may not be the optimal measure, and multiple testing was not formally accounted for as analyses were treated independently. Although a more conservative P-value for statistical significance was used, <0·01, the potential for false positive results still cannot be excluded. Finally, linearity across the DQI score range has been assumed. This is unlikely to be the case in all score categories; however, this approach is used widely in DQI analyses(Reference Xu, Houston and Locher17,Reference Chiuve, Fung and Rimm26) . Nonetheless, scope for further investigations exists, including scientific assessment of the validity and reliability of the DQI.
In conclusion, three variations of a novel DQI-65 were developed that effectively assess adherence to our previously proposed evidence-based age-specific nutritional recommendations for UK adults aged ≥ 65 years, potentially to a greater degree than existing indexes tested. In addition, this cross-sectional analysis found the DQI-65, HEI-2015 and AHEI-2010 to be associated with a range of important health markers related to morbidity and mortality within a UK representative sample of adults aged ≥ 65 years, although methodological limitations may affect the validity of conclusions. The data from this analysis suggest the DQI-65 may be valuable tools for assessing diet quality in older adults in the UK, particularly when aiming to evaluate nutrient intake, and could support delivery of tailored nutritional advice. It is possible that the NFDQI-65/(NFDQI-65+PA) may be superior to the FDQI-65+PA; however, the added benefit of including physical activity within the index is uncertain. Assessment of the DQI-65 predictability in relation to clinical and health outcomes was limited, yet these results indicate that further exploration is warranted. This would require use of longitudinal study data, including clinical outcomes and mortality, with further comparisons against existing indexes to support DQI-65 validation.
Acknowledgements
This work was supported by the Rank Prize Fund.
N. D., R. F., M. W. and J. A. L. designed research; N. D. conducted research; N. D. analysed data; D. H. assisted in calculation of diet quality scores; N. D. drafted the paper. All authors read and approved the final manuscript.
No conflicts of interests. J. A. L. sits on the UK Government’s Scientific Advisory Committee for Nutrition (SACN). This paper reflects independent research.
Supplementary material
For supplementary materials referred to in this article, please visit https://doi.org/10.1017/S0007114521005043


