
Introduction
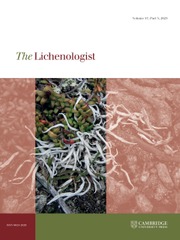
Lichens are used as indicators of environmental factors such as toxic pollutants (Cislaghi & Nimis Reference Cislaghi and Nimis1997; Brunialti & Frati Reference Brunialti and Frati2007), acid rain (Gauslaa Reference Gauslaa1995; Purvis et al. Reference Purvis, Dubbin, Chimonides, Jones and Read2008), nitrogen deposition (van Herk et al. Reference van Herk, Mathijssen-Spiekman and de Zwart2003; Frati et al. Reference Frati, Brunialti and Loppi2008; Hauck Reference Hauck2010; Johansson et al. Reference Johansson, Nordin, Olofsson and Palmqvist2010), ecological continuity in forest ecosystems (Rose Reference Rose and Brown1976; McCune et al. Reference McCune, Rosentreter, Ponzetti and Shaw2000; Bolliger et al. Reference Bolliger, Bergamini, Stofer, Kienast and Scheidegger2007; Fritz et al. Reference Fritz, Gustafsson and Larsson2008), forest edge microclimate (Renhorn et al. Reference Renhorn, Esseen, Palmqvist and Sundberg1997; Esseen & Renhorn Reference Esseen and Renhorn1998; Coxson & Stevenson Reference Coxson and Stevenson2007b ) and climate change (Cornelissen et al. Reference Cornelissen, Callaghan, Alatalo, Michelsen, Graglia, Hartley, Hik, Hobbie, Press and Robinson2001; Walker et al. Reference Walker, Wahren, Hollister, Henry, Ahlquist, Alatalo, Bret-Harte, Calef, Callaghan and Carroll2006; Lang et al. Reference Lang, Cornelissen, Hölzer, ter Braak, Ahrens, Callaghan and Aerts2009). With their poikilohydric way of life, lichens also tell stories about spatial and temporal variation in hydration sources. Because many epiphytic lichens, macrolichens in particular, are exposed to ambient air with large area/biomass-ratios, they likely rank among the more responsive organisms to humidity. For example, two similar spruce canopies in one single valley with relatively low rainfall can host totally different epiphytic communities; the one exposed to atmospheric hydration sources only is heavily loaded with pendulous hair lichens (Fig. 1A), and the other, additionally influenced by liquid water from the spray zone of a waterfall, is loaded with foliose lichens (Fig. 1B). Many lichen species with broad distribution ranges seem to respond more strongly to humidity factors than to temperature. For example, Jørgensen (Reference Jørgensen1996) showed that c. 50 oceanic lichen species occurring in Norway have their main distribution area in tropical/subtropical rainforests, this notwithstanding that some of them extend northwards to boreal rainforests at the arctic circle.
The lower parts of two spruce (Picea engelmannii x glauca) canopies located in the Clearwater valley, southern inland British Columbia. A, a tree in the upper-elevation forests (altitude 1800 m) of the Trophy Mountains with dense cover of Alectoria sarmentosa and various Bryoria spp., but without cephalo- or cyanolichens; B, a tree along the Murtle River within the outer spray zone of Dawson Falls (altitude 800 m), influenced by liquid water from the spray zone. This locality has a strong dominance of the cephalolichen Lobaria pulmonaria, with minor occurrences of cyanolichens such as L. hallii, L. scrobiculata, Pseudocyphellaria anomala, Leptogium spp. and Collema spp. Photographs: Y. Gauslaa. In colour online.
Recent efforts to model lichen distributions (Ellis et al. Reference Ellis, Coppins and Dawson2007a , Reference Ellis, Coppins, Dawson and Seaward b ; Braidwood & Ellis Reference Braidwood and Ellis2012), as well as lichen growth (Eaton & Ellis Reference Eaton and Ellis2012), by means of climatic variables have shown that climate matters, although such models consider rainfall as the only humidity parameter. Internal lichen parameters such as photobiont type (Lange & Kilian Reference Lange and Kilian1985), water-holding capacity (Green & Lange Reference Green and Lange1991; Gauslaa & Solhaug Reference Gauslaa and Solhaug1998), growth form (Kershaw Reference Kershaw1985), hydrophobicity of lichen surfaces (Lakatos et al. Reference Lakatos, Rascher and Büdel2006) and presence/absence of cortex (Pardow et al. Reference Pardow, Hartard and Lakatos2010) also greatly influence moisture relations in lichens. For example, gel lichens such as the cyanobacterial Collema spp. accumulate considerable quanbities of water that keep the thallus hydrated for long periods (Galun Reference Galun1963; Lange et al. Reference Lange, Belnap and Reichenberger1998; Lange Reference Lange2000). It is well known that the lichen water-holding capacity, which depends on morphological adaptation as well as on acclimation (Kershaw Reference Kershaw1985; Gauslaa & Coxson Reference Gauslaa and Coxson2011), determines the duration of hydration periods (e.g. Gauslaa & Solhaug Reference Gauslaa and Solhaug1998). Furthermore, species-specific internal factors influence lichen responses after hydration events (Jonsson et al. Reference Jonsson, Moen and Palmqvist2008). While several reviews pertaining to water relations in lichens have been published over the years (e.g. Blum Reference Blum, Ahmadjian and Hale1973; Kappen Reference Kappen and Ahmadjian1973; Kershaw Reference Kershaw1985; Green et al. Reference Green, Sancho and Pintado2011), an overview linking the various sources of hydration to lichen morphology, function and distribution is lacking. This study attempts to combine and compare spatial distribution of the three main water sources of rain, dew and humid air with water-related traits of epiphytic macrolichens in a conceptual and functional model that may be useful for future modelling of lichens in climate change scenarios.
Main sources of hydration in lichens and their interaction with light
In order to visualize hydration patterns, the three main atmospheric hydration sources for lichens, rain, water vapour condensation (dew) and humid air, are placed as corners in a triangle (Fig. 2). Each location inside the triangle represents a certain combination of hydration sources. Hydration sources are partly coupled: rain and dew necessarily imply high air humidity, but humid air can occur without the presence of liquid water. Liquid water can also come as fog/mist, but because fog provides droplets of water, fog is included under rain.
Hydration source model for lichens, visualizing relationships between the three main sources of lichen hydration (rain, dew, humid air) and some important abiotic factors (temperature, light and liquid water availability). Each location inside the triangle represents a certain combination of hydration sources. △T refers to the diurnal temperature amplitude.
Light availability during hydration periods drives lichen photosynthesis and growth (Palmqvist Reference Palmqvist2000), although hydration during nights may also stimulate growth (Bidussi et al. Reference Bidussi, Gauslaa and Solhaug2013a ). Even so, light availability (as shown in Fig. 2) is partly confounded with hydration sources (Stoutjesdijk & Barkman Reference Stoutjesdijk and Barkman1987) because solar radiation is also a driver of surface temperatures and thus strongly influences water loss and air humidity. At physical scales relevant to lichen physiology, the air during daylight hours is often more humid in the shade of forests than in open, well-lit places, but this relationship becomes inverted at night when cooling is strongest outside a shielding canopy (Geiger Reference Geiger1950). This implies that dew is particularly frequent in forest gaps [open shade habitats sensu Stoutjesdijk (Reference Stoutjesdijk1974)] which receive much diffuse sky light but little direct sun. Indirect light stimulates lichen growth (Gauslaa et al. Reference Gauslaa, Lie, Solhaug and Ohlson2006, Reference Gauslaa, Palmqvist, Solhaug, Holien, Hilmo, Nybakken, Myhre and Ohlson2007). In marked contrast, direct exposure to sunlight causes rapid drying (Lange et al. Reference Lange, Büdel, Meyer, Zellner and Zotz2004) and adversely impacts epiphytic lichen growth (Gauslaa & Goward Reference Gauslaa and Goward2012; Bidussi et al. Reference Bidussi, Goward and Gauslaa2013b ), although short-time sunflecks can have positive effects (Lakatos et al. Reference Lakatos, Rascher and Büdel2006; Coxson & Stevenson Reference Coxson and Stevenson2007a ). Light experienced during prolonged dry periods causes much more damage than desiccation per se, and substantially retards photosynthetic activation during subsequent hydration (Lidén et al. Reference Lidén, Jonsson Cabrajic, Ottosson-Löfvenius, Palmqvist and Lundmark2010; Gauslaa et al. Reference Gauslaa, Coxson and Solhaug2012), particularly in epiphytic cephalolichens and shade-adapted chlorolichens (Gauslaa & Solhaug Reference Gauslaa and Solhaug1996; Jonsson Cabrajic et al. Reference Jonsson Čabrajič, Lidén, Lundmark, Ottosson-Löfvenius and Palmqvist2010).
Spatial variation in hydration sources
Regional scales
At regional scales (Fig. 3A), vegetation generally becomes more open and/or well spaced with increasing aridity (e.g. Walter & Breckle Reference Walter and Breckle1984). Under otherwise similar conditions, nocturnal cooling is much stronger in open spaces than inside forests (Stoutjesdijk & Barkman Reference Stoutjesdijk and Barkman1987). Pre-dawn dewfall in open habitats (Fig. 3B–D) increases with decreasing cloud cover (Xiao et al. Reference Xiao, Meissner, Seeger, Rupp, Borg and Zhang2013), increasing nocturnal cooling and thus increasing air humidity (e.g. Geiger Reference Geiger1950). A critical wind speed is needed to maximize dewfall rates; if wind is faster, which is often the case in coastal sites, condensation is offset by turbulent warming; if too slow, water for condensation cannot be replenished from humid air above (Oke Reference Oke1987; Xiao et al. Reference Xiao, Meissner, Seeger, Rupp, Borg and Zhang2013). Strong dew formation is thus more common in inland climates (Fig. 3A). Dew and humid air in particular, are inaccessible to most vascular plants, but useful to lichens. Dry valleys of south-eastern Norway, located in rain shadows behind snow-capped mountains, have merely 300 mm rainfall (Fig. 4) and are surrounded by fairly dry areas (<700 mm according to Moen Reference Moen1999; see Fig. 4). Surprisingly, these low rainfall areas support some oceanic lichens (Tønsberg et al. Reference Tønsberg, Gauslaa, Haugan, Holien and Timdal1996). One example is Menegazzia terebrata (Fig. 4), which mainly grows on tree trunks in rainforests receiving ≥2000 mm rain along the western coast (enclosed by the solid line in Fig. 4; Moen Reference Moen1999). Because canopies reduce the nocturnal cooling required for reaching the dew point, oceanic epiphytes cannot grow on their normal substratum of bark in the dry inland. Yet, they thrive on boulders and rocks in open, low-rainfall inland valleys. Their location in valleys with cold-air ponding ensures some, but little, wind replenishing moisture at ground level and causes heavy nocturnal dewfall (Oke Reference Oke1987). Lichens in places with frequent dew experience less nutrient loss to leaching than their counterparts in rainy climates. This may contribute to higher diversity and abundance of members of the generally nutrient-demanding taxonomic groups Physciaceae and Teloschistales in dry valleys, compared to leached coastal and montane rainforests where such species are strongly associated with eutrophic habitats.
Basic ideas and hypotheses regarding the hydration source model (Fig. 2) for lichen responses. A–D shows patterns on spatial scales; E–H, responses of forest lichens to hydration sources.
Distribution map of Menegazzia terebrata in southern Norway, generated 24 October 2013 from the Norwegian Lichen Database (http://nhm2.uio.no/lav/web/index.html), The Lichen Herbarium, Natural History Museum, University of Oslo. Solid line oval: rainforest region (≥2000 mm rain) of western Norway with mainly epiphytic occurrences. Dotted line oval: rain shadow sites in dry inner valleys (300 mm rain). Short dashed circle: relatively dry areas (≤700 mm rainfall). In the dry areas the species grows on rocks and boulders in open landscapes.
Dewfall can also be frequent in some deserts, as for example the Negev Desert which receives dew on an average of 198 nights per year (Lange et al. Reference Lange, Schulze and Koch1970, Reference Lange, Meyer, Zellner, Ullmann and Wessels1990). In the Namib Desert, dew alone resulted in photosynthetic activation providing 58–63% of total carbon gain in three epiphytic lichens (Lange et al. Reference Lange, Green, Meyer and Zellner2007). In the arid coastal parts of northern Chile, condensation is so strong that fog oases develop, associated with fairly hydrophytic lichen communities on spines of cacti (Lange & Redon Reference Lange and Redon1983; Redon & Lange Reference Redon and Lange1983). Dew events can be rare and/or seasonal in some arid habitats, but nocturnal cooling may still substantially raise the humidity and thus activate lichen photosynthesis (Lange et al. Reference Lange, Schulze and Koch1970).
Rain is most frequent on mountainous coasts along large oceans subjected to convective energy and moisture from the sea (Fig. 3A). Winds and cloud cover reduce nocturnal cooling. Hence there is often a trade-off between rainfall and dewfall. For example, the mean diurnal temperature amplitude increases from the rainy Pacific coastal forests of north-western North America to the inland rainforests further east (Table 1-1 in DellaSala et al. Reference DellaSala, Alaback, Spribille, von Wehrden, Nauman and DellaSala2011b ) with much less rain (Stevenson et al. Reference Stevenson, Armleder, Arsenault, Coxson, DeLong and Jull2011; 788–1240 mm per year). The occurrence of similar epiphytic vegetation in these two areas (Goward & Spribille Reference Goward and Spribille2005; Radies et al. Reference Radies, Coxson, Johnson and Konwicki2009; DellaSala et al. Reference DellaSala, Alaback, Craighead, Goward, Paquet, Spribille and DellaSala2011a ), supporting many liquid water-demanding cyanolichens (Goward & Arsenault Reference Goward and Arsenault2000), is probably caused by heavy dewfall compensating for less rain inland. In fact, cephalo- and cyanolichens became fully hydrated every morning by pre-dawn dew over two dry August weeks in the inland of British Columbia (Y. Gauslaa, pers. obs.). Because dew measured in mm of water is not enough to compensate for the large reduction in rainfall from the coast to the inland, the frequency of hydration rather than the total amount of rainfall matters for the rainforest lichen community.
Landscape scales
Stepping from regions down to a landscape scale, rainfall increases in intensity and frequency with altitude (orographic rain; e.g. Roe Reference Roe2005) and thus causes longer periods of hydration on hill tops and rough terrain (Fig. 3B). Dewfall (Fig. 3B) is strong in lower parts of U-shaped valleys influenced by cold-air ponding (Oke Reference Oke1987). Thereby a trade-off between increasing orographic rain and decreasing pre-dawn dew may occur with altitude above the valley bottom. As orographic rain is common during daytime, whereas pre-dawn dew consistently occurs at the diurnal minimum temperature, the growth rates of lichens in U-shaped valleys are not necessarily affected by elevation (Bidussi et al. Reference Bidussi, Goward and Gauslaa2013b ). Dew is also frequent on northern slopes in the Northern Hemisphere (Kappen et al. Reference Kappen, Lange, Schulze, Buschbom and Evenari1980), where photosynthetic periods for lichens are substantially prolonged compared to eastern slopes (Lange et al. Reference Lange, Schulze and Koch1970).
Humid air habitats are forested ravines, shaded mountainsides and the surroundings of water bodies and mire complexes.
Stand scales
At a stand level (Fig. 3C), clear-cuts and forest gaps of certain sizes (Geiger 1950) are associated with frequent dew, particularly at northern exposures. Dew is probably an important reason why transplanted old forest lichens sometimes grow better in sheltered clear-cuts than inside intact old forests (Gauslaa et al. Reference Gauslaa, Lie, Solhaug and Ohlson2006; Larsson et al. Reference Larsson, Solhaug and Gauslaa2012). Epiphytic lichens are not necessarily absent in clear-cuts just because of low water availability, but because stable substrata are scarce or absent. However, intact forests retain humidity after, for example, rain for longer periods than open sites during daylight, allowing accumulation of high lichen biomass (Esseen et al. Reference Esseen, Renhorn and Pettersson1996; see also Fig. 1 showing high biomass loadings).
Tree scales
Moving to the spatial scale of a tree (Fig. 3D), rain drains away from the stem and from the inner parts of the canopy (Beier et al. Reference Beier, Hansen and Gundersen1993), especially in the centrifugal type of crowns with hanging branches like most conifers (as reviewed by Barkman Reference Barkman1958). Rainfall is thus heaviest in the upper crown and in outer portions of branches. At the same time, dewfall is heaviest in the outer portions of branches at the north-facing edges of large gaps (Stoutjesdijk Reference Stoutjesdijk1974; Stoutjesdijk & Barkman Reference Stoutjesdijk and Barkman1987), where light is optimal for lichen growth. Dew can also be substantial in the upper, exposed canopy (Lüdi & Zoller Reference Lüdi and Zoller1953). Generally speaking, the lower forest canopy tends to be humid during the day (Geiger Reference Geiger1950), but lower canopy lichens often experience insufficient light for rapid growth. Slower drying inside shaded canopies compared to more light-exposed sites may partly compensate for the low photosynthetic rates associated with shade, although sunflecks have been shown to be important for the diurnal C-gain (Lakatos et al. Reference Lakatos, Rascher and Büdel2006). Tree trunks and other habitats shielded from rain and run-off water may support ombrophobous lichen communities (see Barkman Reference Barkman1958), in which humidity is the only or main source of hydration. Recently, midday dew was found to be a significant source of humidity for crustose lichens on trunks in tropical rainforests (Lakatos et al. Reference Lakatos, Obregón, Büdel and Bendix2012) because of strongly delayed diurnal temperature minima in trunks acting as a heat reservoir. In principle, this should imply that the larger the trunk, the more delayed the dew event will be, leading to substantial benefits for tightly attached lichens because dew will then form during the daylight period. The highly interesting study of Lakatos et al. (Reference Lakatos, Obregón, Büdel and Bendix2012) may explain why the lower portions of large trunks also in boreal and temperate environments often host rare lichens, and why ombrophobous lichen communities in old forests can host a high lichen diversity (Holien Reference Holien1996). Such a mechanism depends on close thermal contact with the trunk. It thus works mainly for crustose lichens.
Links between lichen functioning and water-holding capacity
Water-holding capacity, WHC=[saturated wet mass (WM) – dry mass (DM)] / thallus area (A), gives the amount of water at saturation. This parameter is based on the thallus area that takes up and transpires water, harvests light and fixes carbon. From an ecological perspective, WHC (Fig. 5A) is thus a more functional measure than percent water at saturation (Fig. 5B), which is equivalent to the parameter WHCDM=(WM-DM)/DM. WHCDM is commonly used in fields such as soil science, but is less useful in lichen ecology. However, WHC as used in this paper (=WHCA) directly translates to rain or dewfall (10 mg H2O cm–2 equates to 0·1 mm dew or rain), and determines the duration of the physiologically active period across species and/or specimens subsequent to a hydration event (Fig. 5A).
The relationship between the duration of active metabolism in the cyanolichen Degelia plumbea at low light and A, the water-holding capacity (WHC) at saturation after shaking and B, the percent water content at the same conditions. The insert shows the relationship between WHC and the total thickness of the thalli studied with a size range of 1·1–36·4 cm2. The data are from Gauslaa & Solhaug (Reference Gauslaa and Solhaug1998); A is redrawn from this paper; B and the insert are unpublished plots from the same data set.
Both WHC and percentage of water at saturation normally refer to water content after the fully hydrated thallus has been shaken or blotted with the proviso that water content is: 1) substantially higher after shaking than after blotting, and 2) higher when measured in the field than in the laboratory (i.e. owing to the presence of external water droplets; Lange et al. Reference Lange, Büdel, Heber, Meyer, Zellner and Green1993a ). WHCblotting mainly represents the internal WHC of a lichen thallus, whereas WHCshaking-WHCblotting refers to external surface water removed by blotting (Green et al. Reference Green, Snelgar, Wilkins and Brown1985). Apparently, common rates of dewfall (Xiao et al. Reference Xiao, Meissner, Seeger, Rupp, Borg and Zhang2013) are often just enough to fill the WHCblotting of an average chlorolichen (Gauslaa & Coxson Reference Gauslaa and Coxson2011). The average WHCblotting across lichens studied is 20 mg H2O cm-2 (Gauslaa & Coxson Reference Gauslaa and Coxson2011) and can fully utilize an average good dewfall of 0·2 mm (Jacobs et al. Reference Jacobs, Heusinkveld and Berkowicz2002, Reference Jacobs, Heusinkveld, Kruit and Berkowicz2006; Richards Reference Richards2002; Hao et al. Reference Hao, Li, Guo, Ma, Ayup and Chen2012; Xiao et al. Reference Xiao, Meissner, Seeger, Rupp, Borg and Zhang2013). Such a link suggests that many lichens have evolved to function optimally with dew rather than rain. This hypothesis is consistent with the findings of Lange (Lange Reference Lange2003) showing the importance of days with dew, but no rain, for the annual lichen carbon gain. By contrast, WHCshaking can mainly be filled with rain, as maximal dewfall rates seem to be just 0·04 mm h–1 (Xiao et al. Reference Xiao, Meissner, Seeger, Rupp, Borg and Zhang2013). Thus both these WHC measures are ecologically relevant. Measurement of WHCblotting is simpler to reproduce and compare, evidenced by the substantially lower standard errors (Table 1). For the lichens studied (Table 1), the average WHCshaking/WHCblotting ratio was 1·4–2·1. Therefore blotting removes substantial amounts of water. There is a need for WHCshaking data from more species and/or habitats. Unless specifically stated, WHC in this paper refers to WHCblotting.
Comparison of water-holding capacity (mean±standard error; in mg H2O cm–2) after shaking (WHCshaking) and after blotting (WHCblotting) in four lichen species.
*Gauslaa & Ustvedt (Reference Gauslaa and Ustvedt2003); †Gauslaa & Goward (Reference Gauslaa and Goward2012) WHCshaking unpublished data; ‡Computed from data in Green et al. (Reference Green, Snelgar, Wilkins and Brown1985).
Gauslaa & Coxson (Reference Gauslaa and Coxson2011) showed that specific thallus mass, STM=DM/A, is the important driver for WHC in foliose lichens (Fig. 3F). STM is the inverse equivalent of the frequently used parameter specific leaf area (SLA=A/DM) in plant sciences (e.g. Poorter & Remkes Reference Poorter and Remkes1990), intimately connected to the resource use economy of plants (Reich et al. Reference Reich, Ellsworth and Walters1998; Wright et al. Reference Wright, Groom, Lamont, Poot, Prior, Reich, Schulze, Veneklaas and Westoby2004). This parameter was emphasized by Kershaw (Reference Kershaw1985) as an important lichen parameter for water loss and water uptake. STM is a rough measure of thallus thickness, and is higher in sun-adapted than in shade-adapted thalli. With increasing solar radiation exposure in nature from shaded forests to open sea cliffs, STM in studied chlorolichens increased from c. 7 (shade-adapted Platismatia glauca) to 70 mg DM cm–2 (Anaptychia runcinata thalli from open seashore), with a concurring increase in WHC from 7 to 70 mg H2O cm–2 (Gauslaa & Coxson Reference Gauslaa and Coxson2011). The 1:1 relationship found between WHC and STM in many foliose chlorolichens (Gauslaa & Coxson Reference Gauslaa and Coxson2011) was also shown to hold fairly well for fruticose epiphytic chlorolichens in an oceanic oak forest in south-western Norway (Fig. 6; original data). Also for fruticose lichens, intra- and interspecific differences in WHC occur (Fig. 6). The strong 1:1 WHC-STM relationship for chlorolichens implies that WHC≈STM. Because lichen wet mass at saturation per thallus area (WM)=STM+WHC, a rough estimate of WHC in a chlorolichen approximates WM/2. The 1:1 WHC-STM relationship in Fig. 6 shows that enhanced internal water storage requires additional investment in carbon per thallus area, which in turn may imply a change in the balance between water use efficiency versus light use efficiency. The contrasts in thallus thickness between species suggest that STM is at least partly genetically determined.
Specific thallus mass (mg dry matter cm–2) and water-holding capacity (mg H2O cm–2) in fully hydrated thalli after removing surface water by blotting. All fruticose epiphytic lichen species found in an Atlantic oak forest in Spindanger, Farsund, south-western Norway were included. •, Evernia prunastri; ○, Pseudevernia furfuracea, ▼, Ramalina farinacea; △, Usnea cornuta; ▪, Usnea subfloridana; □, Sphaerophorus globosus; species specific regression lines are shown. Thallus area in E. prunastri, P. furfuracea, R. farinacea and S. globosus was measured with a LI3100 Licor Area Meter (Lincoln, Nebraska, USA); areas in the two Usnea spp. were computed by imaging tools (ImageJ 1.46f version). In all species, a range of thallus sizes as measured (original data)
The intraspecific variation in STM and WHC for the fruticose lichens (see Fig. 6) is mainly an effect of thallus size (data not shown). A range of sizes from small to large was measured for all species, and STM and WHC positively correlated with size. Also, for foliose canopy lichens WHC strongly increases with thallus size, from tiny juveniles to old reproducing stages (Merinero et al. Reference Merinero, Hilmo and Gauslaa2014). As common intensities of dew and low rainfall match the WHC of specific size classes of lichens, the local hydration regime probably influences the maximal size of a lichen species in a given habitat.
Acclimation of STM has been noted after lichens were transplanted to new environments (e.g. Gauslaa et al. Reference Gauslaa, Lie, Solhaug and Ohlson2006, Reference Gauslaa, Palmqvist, Solhaug, Hilmo, Holien, Nybakken and Ohlson2009). From a seasonal perspective, STM significantly increases when the lichen is exposed to high light and dry conditions, and again decreases during long darker and wetter periods (Larsson et al. Reference Larsson, Solhaug and Gauslaa2012). Intraspecific STM responses triggered by increasing evaporative demands have also been noted in natural populations (Snelgar & Green Reference Snelgar and Green1981; Gauslaa & Coxson Reference Gauslaa and Coxson2011; Merinero et al. Reference Merinero, Hilmo and Gauslaa2014). To generalize, changes in STM effectively improve the storage of water in sites and during times when hydration is suboptimal. Prolonged exposure to full hydration has a stronger positive impact on thallus area growth than on biomass gain (Bidussi et al. Reference Bidussi, Gauslaa and Solhaug2013a ), presumably because prolonged high turgor pressure stimulates fungal expansion, as discussed by Larsson et al. (Reference Larsson, Solhaug and Gauslaa2012) and Bidussi et al. (Reference Bidussi, Gauslaa and Solhaug2013a ). Such responses probably tune the WHC to seasonal and spatial evaporative demands.
Lichen responses to hydration sources
Many green algal lichens (chloro- and cephalolichens) can initiate photosynthetic activity in the absence of liquid moisture, although activation in humid air often occurs at slow rates (Jonsson Cabrajic et al. Reference Jonsson Čabrajič, Lidén, Lundmark, Ottosson-Löfvenius and Palmqvist2010). The relative humidity needs to exceed 75–80%, corresponding to a water potential ≈−38 MPa (Nash III et al. Reference Nash, Reiner, Demmig-Adams, Kilian, Kaiser and Lange1990) or lower (Green et al. Reference Green, Sancho and Pintado2011). Therefore, the term ‘humid air’ in Fig. 2 (right corner) refers to humidity levels above ≈80%. Cyanolichens by contrast require liquid water as rain or dew to initiate normal photosynthesis (Lange et al. Reference Lange, Kilian and Ziegler1986, Reference Lange, Green and Ziegler1988, Reference Lange, Bilger, Rimke and Schreiber1989, Reference Lange, Büdel, Meyer and Kilian1993b ); their photosynthetic water compensation point is much higher than in chlorolichens, as reviewed by Green et al. (Reference Green, Sancho and Pintado2011). Accordingly, cyanolichens are restricted to the left portion of the triangle, indicating a requirement for dew and rain (see e.g. Marini et al. Reference Marini, Nascimbene and Nimis2011), whereas chloro- and cephalolichens utilize all available hydration sources and are hence, as a group, more widespread (Fig. 3G). The fact, however, that cyanolichens often have substantially higher WHC than chloro- and cephalolichens (Gauslaa & Coxson Reference Gauslaa and Coxson2011), may partly compensate for their more stringent hydration requirements for photosynthetic activation. At the same time, the cyanolichen Lobaria scrobiculata requires 2·5 times greater hydration for activation than the cephalolichen L. pulmonaria (MacKenzie & Campbell Reference MacKenzie and Campbell2001), which complicates the story and emphasizes the need for further studies on lichen water use efficiency, as proposed by Máguas et al. (Reference Máguas, Valladares and Brugnoli1997).
The bottom panel of triangles (Fig. 3E–H) summarizes various lichen responses to hydration. Excess hydration by liquid water often suppresses lichen photosynthesis, a phenomenon referred to as suprasaturation depression (Lange & Matthes Reference Lange and Matthes1981; Lange et al. Reference Lange, Büdel, Heber, Meyer, Zellner and Green1993a , Reference Lange, Green and Heber2001). Suprasaturation depression does not occur during water uptake in humid air, but can instantaneously take place after additional spraying with water (Lange & Kilian Reference Lange and Kilian1985), unless the lichen surface is water-repellent (Lakatos et al. Reference Lakatos, Rascher and Büdel2006; Hauck et al. Reference Hauck, Jürgens, Brinkmann and Herminghaus2008; Pardow et al. Reference Pardow, Hartard and Lakatos2010). In a continuous year-long gas exchange measurement of the chlorolichen Lecanora muralis in an open habitat in Germany, 74 days of heavy rain resulted in only 2·4% of the annual carbon gain, whereas 105 days with dew accounted for 40% (Lange Reference Lange2003). Depression of lichen photosynthesis by excess water is thus common in rainy events, rare with dew, and absent in humid air (Fig. 3E). As bryophytes in general are much better than lichens in handling excess water (Green et al. 2011), there is a higher bryophyte/lichen biomass ratio in rainy regions where bryophytes rather than lichens tend to dominate tree canopies.
Finely dissected and/or thin lichens (Fig. 1A) take up humidity rapidly, whereas thick and/or compact growth forms need a long time to become hydrated in humid air (Larson & Kershaw Reference Larson and Kershaw1976; Larson Reference Larson1981; Lange & Kilian Reference Lange and Kilian1985; Lange et al. Reference Lange, Kilian and Ziegler1986). Chlorolichens across studied macrolichen growth forms and taxonomic groups follow the 1:1 line in WHC-STM plots, equivalent to ≈100% water at saturation [Fig. 5 shows this for fruticose lichens; Gauslaa & Coxson (Reference Gauslaa and Coxson2011) shows foliose lichens]. Epiphytic cyanolichens tend to follow the 2:1 line equivalent to ≈200% water (Gauslaa & Coxson Reference Gauslaa and Coxson2011). Such relationships suggest that chlorolichens have an opportunistic water economy, as the lower mass per thallus area allows more rapid use of humidity from the air. Cyanolichens have a more conservative water economy. They need higher water content in order to maximize the duration of hydration to compensate for the rarer hydration events by liquid water.
Alectorioid lichens (Figs 1A & 3H) are among the lichens with the largest surface area to biomass ratio. Among the alectorioid lichens, Bryoria species and Ramalina thrausta are the thinnest. As chlorolichens, they rapidly activate photosynthesis in equilibrium with high ambient air humidity (Lange et al. Reference Lange, Kilian and Ziegler1986). Bryoria biomass is much higher in inland regions with less rain than in coastal forests subjected to heavy rain (as shown for Scandinavia by Ahlner Reference Ahlner1948; Bruteig Reference Bruteig1993). Furthermore, excess rain or melting water from snow has been shown to damage Bryoria in western North America (Goward Reference Goward1998), as well as being associated with temporary Bryoria dieback in Norwegian spruce canopies during unusually wet autumns (Y. Gauslaa, pers. obs.). Similar die-off events have been observed in foliose chlorolichens during an exceptional wet late autumn when no damage occurred in cephalo- and cyanolichens (Gauslaa Reference Gauslaa2002). The alectorioid genus Usnea is more flexible with respect to water sources than Bryoria, Alectoria and Ramalina thrausta. The genus as such has a highly variable morphology and anatomy (Motyka Reference Motyka1947), and occurs in well-lit portions of rainforests in most regions of the world (Halonen et al. Reference Halonen, Clerc, Goward, Brodo and Wulff1998; Kantvilas & Jarman Reference Kantvilas and Jarman1999; Antoine & McCune Reference Antoine and McCune2004), as well as in drier forests with abundant Bryoria biomass. Usnea is often represented with more species in the more oceanic areas than in dry areas (Bjerke et al. Reference Bjerke, Elvebakk and Elverland2006), and growth rates in species such as Usnea longissima increase with increasing rainfall (Gauslaa et al. Reference Gauslaa, Palmqvist, Solhaug, Holien, Hilmo, Nybakken, Myhre and Ohlson2007). The Usnea species shown in Fig. 6 have fairly high WHC, but they came from a coastal site where rain and wind are frequent and dew rarely appears, and where no specimens of Bryoria occurred. In contrast to other alectorioid lichens (Alectoria, Bryoria, Ramalina thrausta), thick coastal Usnea species may depend on rain and may thus have optimized their water storage.
Individual lichen species may occupy narrow or wide species-specific areas within the triangle in Fig. 2. To give a few examples, the delicate, pendulous, capillary branches of Ramalina thrausta are apparently optimized for rapid, highly efficient activation in humid air, an inference supported by this species' remarkable ability to inhabit sites partially sheltered from rain and dew. By contrast, the foliose genera Sticta and Pseudocyphellaria, including cephalo- as well as cyanolichen members, inhabit rainy climates (Green & Lange Reference Green and Lange1991). Apparently, the presence of cyphellae and pseudocyphellae in Sticta and Pseudocyphellaria, respectively, permits CO2 exchange through the lower cortex which allows more of the remaining thallus to store water without too severe suprasaturation depression (Green et al. Reference Green, Snelgar and Brown1981, Reference Green, Snelgar, Wilkins and Brown1985). Suprasaturation depression under rainforest conditions was less, or even absent, in Sticta at 500% water content having cyphellae than in Lobaria in which these structures are lacking (Lange et al. Reference Lange, Büdel, Meyer, Zellner and Zotz2004). Another rain-dependent species is the cyanolichen Degelia plumbea, with such a high WHC (Gauslaa & Solhaug Reference Gauslaa and Solhaug1998) that it can never be fully activated by dew alone.
Conclusion
Various groups and species of epiphytic lichens have specialized morphology, anatomy and symbiotic relationships in order to function optimally under specific hydration regimes. In this respect, growth forms and photobiont type are important lichen traits. There is a need to quantify STM and WHC in more lichen species and growth forms. So far, WHC data are lacking for the many green-algal pendulous and fruticose lichens, as well as for cyanobacterial gel lichens. Another promising investigation would be to study the links between STM and activation time of photosynthetic acitivity in chloro- and cephalolichens in humid air. Such data are needed to establish quantitative links between availability of hydration sources and lichen traits in the model (Fig. 3E–H). Specifying the sources of hydration and including internal lichen variables such as water-holding capacity will probably improve modelling local and global future scenarios on lichen distribution and biomass production.
This study was supported by Formas, Sweden, through a grant (230-2011-1559) to Per-Anders Esseen. Thanks go to him for useful discussions. Thanks also to Trevor Goward for comments, discussions and field visits from the start to the end of this work, and to Michael Lakatos and Kristin Palmqvist for their constructive referee comments.


