1 Introduction
Magnetic fields pervade the universe. From the scales of planets up to galaxy clusters and beyond, they are not only ubiquitous but have also proven dramatically important in a wide variety of astrophysical and geophysical processes. Despite this, our understanding the mechanisms that lead to their creation and sustenance is hazy, and improving this remains an outstanding theoretical challenge. Much of the theory of field generation focuses on turbulent dynamo, in which magnetic fields are stretched and twisted by turbulent fluctuations in such a way as to increase their strength, resulting in exponential instability. Through this process, very small seed fields – arising, for example, from the Biermann battery or kinetic instabilities – might be amplified enormously by plasma motions to the levels seen throughout the universe today.
Interestingly, magnetic fields are generically observed to be correlated over larger scales than the underlying fluid motions, and such large-scale dynamos are of vital importance for explaining astrophysical fields. The classic mechanism to allow such behaviour is the kinematic
 ${\it\alpha}$
effectFootnote
1
(Moffatt Reference Moffatt1978; Krause & Rädler Reference Krause and Rädler1980). Here, the small-scale fluid turbulence interacts with a large-scale magnetic field in such a way that an electromotive force (EMF, represented by
${\it\alpha}$
effectFootnote
1
(Moffatt Reference Moffatt1978; Krause & Rädler Reference Krause and Rädler1980). Here, the small-scale fluid turbulence interacts with a large-scale magnetic field in such a way that an electromotive force (EMF, represented by
 $\boldsymbol{{\mathcal{E}}}$
) is created in proportion the magnetic field itself (
$\boldsymbol{{\mathcal{E}}}$
) is created in proportion the magnetic field itself (
 $\boldsymbol{{\mathcal{E}}}\sim {\it\alpha}\boldsymbol{B}$
), potentially causing an instability to develop. To allow such behaviour, the turbulence must break statistical symmetry in some way, either through a net helicity or through stratification. However, various problems with large scale
$\boldsymbol{{\mathcal{E}}}\sim {\it\alpha}\boldsymbol{B}$
), potentially causing an instability to develop. To allow such behaviour, the turbulence must break statistical symmetry in some way, either through a net helicity or through stratification. However, various problems with large scale
 ${\it\alpha}$
dynamos become apparent when one considers how field growth rates change with the scale of the field – specifically, the smallest scales always grow the most rapidly (Kulsrud & Anderson Reference Kulsrud and Anderson1992; Boldyrev, Cattaneo & Rosner Reference Boldyrev, Cattaneo and Rosner2005). In addition, as a consequence of the conservation of magnetic helicity, these small-scale magnetic fields act to decrease the large-scale growth rate in a way that scales very unfavourably to high Reynolds numbers – the problem of ‘catastrophic quenching’ (Gruzinov & Diamond Reference Gruzinov and Diamond1994; Bhattacharjee & Yuan Reference Bhattacharjee and Yuan1995; Cattaneo & Hughes Reference Cattaneo and Hughes2009). While a variety of solutions to such problems have been explored, primarily focused on the transport of magnetic helicity (Vishniac & Cho Reference Vishniac and Cho2001; Blackman & Field Reference Blackman and Field2002; Subramanian & Brandenburg Reference Subramanian and Brandenburg2004; Ebrahimi & Bhattacharjee Reference Ebrahimi and Bhattacharjee2014; Tobias & Cattaneo Reference Tobias and Cattaneo2014), the scaling of
${\it\alpha}$
dynamos become apparent when one considers how field growth rates change with the scale of the field – specifically, the smallest scales always grow the most rapidly (Kulsrud & Anderson Reference Kulsrud and Anderson1992; Boldyrev, Cattaneo & Rosner Reference Boldyrev, Cattaneo and Rosner2005). In addition, as a consequence of the conservation of magnetic helicity, these small-scale magnetic fields act to decrease the large-scale growth rate in a way that scales very unfavourably to high Reynolds numbers – the problem of ‘catastrophic quenching’ (Gruzinov & Diamond Reference Gruzinov and Diamond1994; Bhattacharjee & Yuan Reference Bhattacharjee and Yuan1995; Cattaneo & Hughes Reference Cattaneo and Hughes2009). While a variety of solutions to such problems have been explored, primarily focused on the transport of magnetic helicity (Vishniac & Cho Reference Vishniac and Cho2001; Blackman & Field Reference Blackman and Field2002; Subramanian & Brandenburg Reference Subramanian and Brandenburg2004; Ebrahimi & Bhattacharjee Reference Ebrahimi and Bhattacharjee2014; Tobias & Cattaneo Reference Tobias and Cattaneo2014), the scaling of
 ${\it\alpha}$
dynamos to astrophysically relevant regimes is still far from understood. Such issues are not necessarily confined to the
${\it\alpha}$
dynamos to astrophysically relevant regimes is still far from understood. Such issues are not necessarily confined to the
 ${\it\alpha}$
effect either. Above even moderate Reynolds numbers, the fast-growing small-scale dynamo (field generation on scales at and below that of the fluid turbulence; Schekochihin et al.
Reference Schekochihin, Iskakov, Cowley, Mcwilliams, Proctor and Yousef2007) implies that velocity fluctuations should always be accompanied by magnetic fluctuations of a similar magnitude (Schekochihin et al.
Reference Schekochihin, Cowley, Taylor, Hammett, Maron and Mcwilliams2004). This challenges the relevance of the classical kinematic dynamo picture (Cattaneo & Hughes Reference Cattaneo and Hughes2009), which focuses purely on the properties of the small-scale velocity fields.
${\it\alpha}$
effect either. Above even moderate Reynolds numbers, the fast-growing small-scale dynamo (field generation on scales at and below that of the fluid turbulence; Schekochihin et al.
Reference Schekochihin, Iskakov, Cowley, Mcwilliams, Proctor and Yousef2007) implies that velocity fluctuations should always be accompanied by magnetic fluctuations of a similar magnitude (Schekochihin et al.
Reference Schekochihin, Cowley, Taylor, Hammett, Maron and Mcwilliams2004). This challenges the relevance of the classical kinematic dynamo picture (Cattaneo & Hughes Reference Cattaneo and Hughes2009), which focuses purely on the properties of the small-scale velocity fields.
In this paper – as well as in Squire & Bhattacharjee (Reference Squire and Bhattacharjee2015b
) (hereafter Paper I), Squire & Bhattacharjee (Reference Squire and Bhattacharjee2015c
) (hereafter Paper II) and Squire & Bhattacharjee (Reference Squire and Bhattacharjee2015d
) (hereafter Paper III) – we suggest and explore a new dynamo mechanism in which the small-scale magnetic fluctuations, in combination with a background shear flow, are the primary driver of the large-scale field growth. Termed the ‘magnetic shear-current effect’, by analogy to earlier kinematic suggestions (Urpin Reference Urpin1999; Rogachevskii & Kleeorin Reference Rogachevskii and Kleeorin2003), the effect is non-helical (the dynamo
 ${\it\alpha}$
coefficient is zero), and is driven by an off-diagonal component of the turbulent resistivity tensor. There are two principal reasons for our interest in this effect. The first is that the mechanism is not an
${\it\alpha}$
coefficient is zero), and is driven by an off-diagonal component of the turbulent resistivity tensor. There are two principal reasons for our interest in this effect. The first is that the mechanism is not an
 ${\it\alpha}$
effect, which implies that the dynamo can operate in turbulence with a high degree of symmetry. This makes it a possible mechanism to explain the dynamo seen in the central regions of accretion disk simulations (Brandenburg et al.
Reference Brandenburg, Nordlund, Stein and Torkelsson1995; Hawley, Gammie & Balbus Reference Hawley, Gammie and Balbus1996), and we have seen good evidence that this is indeed the case (see § 4, as well as Squire & Bhattacharjee Reference Squire and Bhattacharjee2015a
). The second reason for our interest in the magnetic shear-current effect stems from the intriguing possibility of a large-scale dynamo being driven by the saturated state of the small-scale dynamo. In some sense, this is the inverse of the quenching described in the previous paragraph – the small-scale dynamo, far from quenching large-scale growth, is its primary driver. Such a large-scale dynamo paradigm is far removed from classical kinematic theory, relying on saturation of the small-scale turbulent fields. Accordingly, the magnetic shear-current effect is an inherently nonlinear dynamo mechanism (Tobias, Cattaneo & Brummell Reference Tobias, Cattaneo and Brummell2011a
), although it can be driven by a turbulent velocity field rather than resulting from the nonlinear development of a laminar instability.
${\it\alpha}$
effect, which implies that the dynamo can operate in turbulence with a high degree of symmetry. This makes it a possible mechanism to explain the dynamo seen in the central regions of accretion disk simulations (Brandenburg et al.
Reference Brandenburg, Nordlund, Stein and Torkelsson1995; Hawley, Gammie & Balbus Reference Hawley, Gammie and Balbus1996), and we have seen good evidence that this is indeed the case (see § 4, as well as Squire & Bhattacharjee Reference Squire and Bhattacharjee2015a
). The second reason for our interest in the magnetic shear-current effect stems from the intriguing possibility of a large-scale dynamo being driven by the saturated state of the small-scale dynamo. In some sense, this is the inverse of the quenching described in the previous paragraph – the small-scale dynamo, far from quenching large-scale growth, is its primary driver. Such a large-scale dynamo paradigm is far removed from classical kinematic theory, relying on saturation of the small-scale turbulent fields. Accordingly, the magnetic shear-current effect is an inherently nonlinear dynamo mechanism (Tobias, Cattaneo & Brummell Reference Tobias, Cattaneo and Brummell2011a
), although it can be driven by a turbulent velocity field rather than resulting from the nonlinear development of a laminar instability.
Proving the existence and importance of a dynamo instability can be delicate: numerical simulations of turbulence are necessarily noisy, one is limited in available Reynolds numbers (and thus the ability to prove a dynamo will remain active at high values), and when large-scale field growth is observed, it can be difficult to show convincingly that it is not some other (possibly unknown) mechanism that is responsible. These problems are exacerbated in the magnetically driven case studied in this work. In particular, due to the finite size of any numerically realizable mean-field average, the large-scale field will quickly come into equipartition with the turbulent bath of fluctuations, robbing the researcher of the ability to study the dynamo during a long period of exponential growth. In other words, the dynamo will very quickly transition into its saturated state (where the large-scale fields have a strong influence on the small-scale turbulence), exacerbating measurement of the properties of the linear growth phase, or even the observation of its qualitative behaviour. For these reasons, we have attempted to tackle the problem from a variety of different angles, including analytically with the second-order correlation approximation (Paper III), through quasi-linear theory and statistical simulation (Paper II) and using direct numerical simulations (Paper I; Paper II). We also employ the novel technique of using an ensemble of simulations to study the statistics of the mean field without taking time averages. Our hope is that with this variety of methods, which all lead to the same general conclusions, we present convincing evidence for the existence of the magnetic shear-current effect and its potential importance in astrophysical dynamo theory.
The present paper serves two purposes. The first is to give a more heuristic and physical description of the magnetic shear-current effect, which is done throughout § 2. Following a basic description of the mechanism in the language of mean-field dynamo theory, we describe (with diagrams and simple explanations) how magnetic fluctuations, interacting with a large-scale magnetic field and shear flow, can generate the correlated velocity perturbations that are required for a mean-field dynamo instability. Interestingly, we find that the pressure response of the velocity fluctuations is fundamental to the operation of the dynamo, and simple arguments based on the directions of induced perturbations explain qualitatively why one might expect the magnetic effect to be stronger than the kinematic effect. The second purpose of this paper, discussed in § 3, is to expand upon, and provide further details for, the analysis and simulations presented in Paper I. In particular, these simulations demonstrate for the first time (as far as we are aware) that the saturated state of the small-scale dynamo can drive a large-scale dynamo. Our method for showing this involves measuring the transport coefficients before and after small-scale dynamo saturation. This illustrates that strong magnetic fluctuations can decrease, and change the sign of, a particularly important component of the tensorial turbulent resistivity (termed
 ${\it\eta}_{yx}$
throughout the text), in a way that is consistent with observed mean-field evolution. Since the methods used to show this are somewhat non-standard, considerable effort is put into explaining these and ensuring that the coefficients are determined accurately. This is done both through direct comparison with standard methods in lower Reynolds number kinematic dynamos (appendix A), and by using the measured coefficients to solve for the expected large-scale field evolution.
${\it\eta}_{yx}$
throughout the text), in a way that is consistent with observed mean-field evolution. Since the methods used to show this are somewhat non-standard, considerable effort is put into explaining these and ensuring that the coefficients are determined accurately. This is done both through direct comparison with standard methods in lower Reynolds number kinematic dynamos (appendix A), and by using the measured coefficients to solve for the expected large-scale field evolution.
Finally, in § 4, we conclude and present a more in-depth discussion of why the magnetic shear-current effect is interesting as a mechanism for large-scale dynamo. This includes some analysis of the evidence for the effect’s importance in driving the dynamo in the central regions of accretion disks, which is primarily based on the Prandtl number dependence of its nonlinear saturation (Squire & Bhattacharjee Reference Squire and Bhattacharjee2015a ).
2 The physical mechanism for the magnetic shear-current effect
In this section we describe how homogeneous non-helical magnetic fluctuations, influenced by a large-scale shear flow and magnetic field gradient, can generate an EMF that acts to reinforce the large-scale magnetic field. We shall start by describing the form of the EMF that allows for such behaviour, as well as constraints due to the symmetries of the system, then consider a simplified cartoon picture for how the interaction of magnetic fluctuations with velocity shear and a large-scale field gradient might produce this EMF.
All studies in this work are carried out in the context of the incompressible MHD equations with a background shear flow
 $\boldsymbol{U}_{0}=-Sx\hat{\boldsymbol{y}}$
,
$\boldsymbol{U}_{0}=-Sx\hat{\boldsymbol{y}}$
,
 $$\begin{eqnarray}\displaystyle & \displaystyle \frac{\partial \boldsymbol{U}_{T}}{\partial t}-Sx\frac{\partial \boldsymbol{U}_{T}}{\partial y}+\!\left(\boldsymbol{U}_{T}\boldsymbol{\cdot }\boldsymbol{{\rm\nabla}}\right)\boldsymbol{U}_{T}+2{\it\Omega}\hat{\boldsymbol{z}}\times \boldsymbol{U}_{T}+\boldsymbol{{\rm\nabla}}p=SU_{Tx}\hat{\boldsymbol{y}}+\boldsymbol{B}_{T}\boldsymbol{\cdot }\boldsymbol{{\rm\nabla}}\boldsymbol{B}_{T}+\bar{{\it\nu}}{\rm\nabla}^{2}\boldsymbol{U}_{T}+{\bf\sigma}_{\boldsymbol{u}}, & \displaystyle \nonumber\\ \displaystyle & & \displaystyle\end{eqnarray}$$
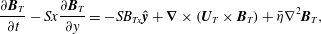 $$\begin{eqnarray}\displaystyle \frac{\partial \boldsymbol{B}_{T}}{\partial t}-Sx\frac{\partial \boldsymbol{B}_{T}}{\partial y}=-SB_{Tx}\hat{\boldsymbol{y}}+\boldsymbol{{\rm\nabla}}\times \left(\boldsymbol{U}_{T}\times \boldsymbol{B}_{T}\right)+\bar{{\it\eta}}{\rm\nabla}^{2}\boldsymbol{B}_{T},\end{eqnarray}$$
 $$\begin{eqnarray}\displaystyle & \displaystyle \boldsymbol{{\rm\nabla}}\boldsymbol{\cdot }\boldsymbol{U}_{T}=0,\quad \boldsymbol{{\rm\nabla}}\boldsymbol{\cdot }\boldsymbol{B}_{T}=0. & \displaystyle\end{eqnarray}$$
Here
 ${\it\Omega}$
is a mean rotation of the frame, and
${\it\Omega}$
is a mean rotation of the frame, and
 $\bar{{\it\nu}}$
and
$\bar{{\it\nu}}$
and
 $\bar{{\it\eta}}$
are the normalized viscosity and resistivity, respectively. Since all quantities are normalized to one it is convenient to define
$\bar{{\it\eta}}$
are the normalized viscosity and resistivity, respectively. Since all quantities are normalized to one it is convenient to define
 $\mathit{Re}=1/\bar{{\it\nu}}$
and
$\mathit{Re}=1/\bar{{\it\nu}}$
and
 $\mathit{Rm}=1/\bar{{\it\eta}}$
for the Reynolds and magnetic Reynolds number, and their ratio is the Prandtl number
$\mathit{Rm}=1/\bar{{\it\eta}}$
for the Reynolds and magnetic Reynolds number, and their ratio is the Prandtl number
 $\mathit{Pm}=\mathit{Rm}/\mathit{Re}$
.
$\mathit{Pm}=\mathit{Rm}/\mathit{Re}$
.
 ${\bf\sigma}_{\boldsymbol{u}}$
denotes a non-helical driving noise source, white in time, which can be used to generate an homogenous bath of small-scale velocity fluctuations.
${\bf\sigma}_{\boldsymbol{u}}$
denotes a non-helical driving noise source, white in time, which can be used to generate an homogenous bath of small-scale velocity fluctuations.
 $\boldsymbol{U}_{T}$
and
$\boldsymbol{U}_{T}$
and
 $\boldsymbol{B}_{T}$
in (2.1) are simply the standard turbulent velocity and magnetic fields (
$\boldsymbol{B}_{T}$
in (2.1) are simply the standard turbulent velocity and magnetic fields (
 $\boldsymbol{U}_{T}$
is the velocity not including the background shear). Throughout this work we consider initially homogenous turbulence with zero average helicity.
$\boldsymbol{U}_{T}$
is the velocity not including the background shear). Throughout this work we consider initially homogenous turbulence with zero average helicity.
2.1 Non-helical dynamo mechanisms
To examine field generation mechanisms in this geometry, it is helpful to start by defining mean and fluctuating fields through the relation
 $\boldsymbol{B}_{T}=\overline{\boldsymbol{B}}_{T}+\boldsymbol{b}=\boldsymbol{B}+\boldsymbol{b}$
. Here
$\boldsymbol{B}_{T}=\overline{\boldsymbol{B}}_{T}+\boldsymbol{b}=\boldsymbol{B}+\boldsymbol{b}$
. Here
 $\bar{\cdot }$
is the mean-field average, which is taken to be a spatial average over
$\bar{\cdot }$
is the mean-field average, which is taken to be a spatial average over
 $x$
and
$x$
and
 $y$
. An average of the induction equation (2.1b
) leads to the well-known mean-field dynamo equations for the mean magnetic field
$y$
. An average of the induction equation (2.1b
) leads to the well-known mean-field dynamo equations for the mean magnetic field
 $\boldsymbol{B}$
(Moffatt Reference Moffatt1978; Krause & Rädler Reference Krause and Rädler1980),
$\boldsymbol{B}$
(Moffatt Reference Moffatt1978; Krause & Rädler Reference Krause and Rädler1980),
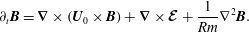 $$\begin{eqnarray}\partial _{t}\boldsymbol{B}=\boldsymbol{{\rm\nabla}}\times \left(\boldsymbol{U}_{0}\times \boldsymbol{B}\right)+\boldsymbol{{\rm\nabla}}\times \boldsymbol{{\mathcal{E}}}+\frac{1}{\mathit{Rm}}{\rm\nabla}^{2}\boldsymbol{B}.\end{eqnarray}$$
Here
 $\boldsymbol{{\mathcal{E}}}=\overline{\boldsymbol{u}\times \boldsymbol{b}}$
is the EMF, which provides the connection between the small-scale turbulence and large-scale fields. If we assume scale separation between the mean and fluctuating fields, a Taylor expansion of
$\boldsymbol{{\mathcal{E}}}=\overline{\boldsymbol{u}\times \boldsymbol{b}}$
is the EMF, which provides the connection between the small-scale turbulence and large-scale fields. If we assume scale separation between the mean and fluctuating fields, a Taylor expansion of
 $\boldsymbol{{\mathcal{E}}}$
leads to the form
$\boldsymbol{{\mathcal{E}}}$
leads to the form
 $$\begin{eqnarray}{\mathcal{E}}_{i}={\it\alpha}_{ij}B_{j}-{\it\eta}_{ij}J_{j}+\cdots \,,\end{eqnarray}$$
where
 ${\it\alpha}_{ij}$
and
${\it\alpha}_{ij}$
and
 ${\it\eta}_{ij}$
are the transport coefficients, and the lack of
${\it\eta}_{ij}$
are the transport coefficients, and the lack of
 $(x,y)$
dependence of the mean fields has been used to reduce the number of
$(x,y)$
dependence of the mean fields has been used to reduce the number of
 ${\it\eta}$
coefficients from
${\it\eta}$
coefficients from
 $27$
to
$27$
to
 $4$
(note that
$4$
(note that
 $B_{z}=0$
). In the case where the mean fields can be considered a small perturbation to some background turbulent state specified by statistics of
$B_{z}=0$
). In the case where the mean fields can be considered a small perturbation to some background turbulent state specified by statistics of
 $\boldsymbol{u}$
and
$\boldsymbol{u}$
and
 $\boldsymbol{b}$
(which are influenced by shear and rotation),
$\boldsymbol{b}$
(which are influenced by shear and rotation),
 ${\it\alpha}$
and
${\it\alpha}$
and
 ${\it\eta}$
must be independent of
${\it\eta}$
must be independent of
 $\boldsymbol{B}$
.
$\boldsymbol{B}$
.
Due to reflectional symmetry, with a non-helical forcing function
 ${\bf\sigma}_{\boldsymbol{u}}$
, the
${\bf\sigma}_{\boldsymbol{u}}$
, the
 ${\it\alpha}_{ij}$
coefficients are constrained to vanish on average in this geometry. Instead, we shall study the possibility of a mean-field dynamo that arises purely from the off-diagonal components of
${\it\alpha}_{ij}$
coefficients are constrained to vanish on average in this geometry. Instead, we shall study the possibility of a mean-field dynamo that arises purely from the off-diagonal components of
 ${\it\eta}_{ij}$
, which can be non-zero due to the anisotropy of the turbulence. Combining (2.2) and (2.3), one obtains
${\it\eta}_{ij}$
, which can be non-zero due to the anisotropy of the turbulence. Combining (2.2) and (2.3), one obtains
 $$\begin{eqnarray}\displaystyle & \displaystyle \partial _{t}B_{x}=-{\it\alpha}_{yx}\partial _{z}B_{x}-{\it\alpha}_{yy}\partial _{z}B_{y}-{\it\eta}_{yx}\partial _{z}^{2}B_{y}+({\it\eta}_{yy}+\bar{{\it\eta}})\partial _{z}^{2}B_{x}, & \displaystyle\end{eqnarray}$$
 $$\begin{eqnarray}\displaystyle & \displaystyle \partial _{t}B_{y}=-SB_{x}+{\it\alpha}_{xx}\partial _{z}B_{x}+{\it\alpha}_{xy}\partial _{z}B_{y}-{\it\eta}_{xy}\partial _{z}^{2}B_{x}+({\it\eta}_{xx}+\bar{{\it\eta}})\partial _{z}^{2}B_{y}, & \displaystyle\end{eqnarray}$$
 ${\it\alpha}_{ij}$
components must vanish. From these equations (with
${\it\alpha}_{ij}$
components must vanish. From these equations (with
 ${\it\alpha}_{ij}=0$
), it is straightforward to show that an eigenmode with the spatial structure
${\it\alpha}_{ij}=0$
), it is straightforward to show that an eigenmode with the spatial structure
 $B_{i}=B_{i0}\text{e}^{\text{i}kz}$
has the growth rate
$B_{i}=B_{i0}\text{e}^{\text{i}kz}$
has the growth rate  $$\begin{eqnarray}{\it\gamma}_{{\it\eta}}=k\sqrt{{\it\eta}_{yx}\left(-S+k^{2}{\it\eta}_{xy}\right)}-k^{2}{\it\eta}_{t},\end{eqnarray}$$
where we have set
 ${\it\eta}_{yy}={\it\eta}_{xx}={\it\eta}_{t}$
for simplicity. Neglecting
${\it\eta}_{yy}={\it\eta}_{xx}={\it\eta}_{t}$
for simplicity. Neglecting
 ${\it\eta}_{xy}$
by assuming
${\it\eta}_{xy}$
by assuming
 $|k^{2}{\it\eta}_{xy}|\ll S$
(for all
$|k^{2}{\it\eta}_{xy}|\ll S$
(for all
 $k$
for which scale separation holds), one finds that positive dynamo growth is possible if
$k$
for which scale separation holds), one finds that positive dynamo growth is possible if
 $-S{\it\eta}_{yx}>0$
and
$-S{\it\eta}_{yx}>0$
and
 $k\sqrt{-{\it\eta}_{yx}S}>k^{2}{\it\eta}_{t}$
. The physical mechanism for the instability involves the
$k\sqrt{-{\it\eta}_{yx}S}>k^{2}{\it\eta}_{t}$
. The physical mechanism for the instability involves the
 $B_{x}$
generated by
$B_{x}$
generated by
 $B_{y}$
(through
$B_{y}$
(through
 $-{\it\eta}_{yx}\partial _{z}^{2}B_{y}$
) feeding back on
$-{\it\eta}_{yx}\partial _{z}^{2}B_{y}$
) feeding back on
 $B_{y}$
through stretching by the mean shear flow (the
$B_{y}$
through stretching by the mean shear flow (the
 $-SB_{x}$
term in (2.4)). Thus the possibility of such a non-helical dynamo rests crucially on the phase between
$-SB_{x}$
term in (2.4)). Thus the possibility of such a non-helical dynamo rests crucially on the phase between
 $B_{x}$
and
$B_{x}$
and
 $B_{y}$
and therefore on the transport coefficient
$B_{y}$
and therefore on the transport coefficient
 ${\it\eta}_{yx}$
, which must be less than zero.
${\it\eta}_{yx}$
, which must be less than zero.
Whether
 ${\it\eta}_{yx}$
is positive or negative depends on the properties of the turbulence in question, in particular, on the sign of
${\it\eta}_{yx}$
is positive or negative depends on the properties of the turbulence in question, in particular, on the sign of
 $(\overline{\boldsymbol{u}\times \boldsymbol{b}})_{y}$
that arises in the presence of a
$(\overline{\boldsymbol{u}\times \boldsymbol{b}})_{y}$
that arises in the presence of a
 $B_{y}$
gradient. The standard kinematic approach in dynamo theory has been to consider strong underlying hydrodynamic fluctuations (denoted by
$B_{y}$
gradient. The standard kinematic approach in dynamo theory has been to consider strong underlying hydrodynamic fluctuations (denoted by
 $\boldsymbol{u}_{0}$
), which generate
$\boldsymbol{u}_{0}$
), which generate
 $\boldsymbol{b}$
fluctuations through interaction with
$\boldsymbol{b}$
fluctuations through interaction with
 $\boldsymbol{{\rm\nabla}}\boldsymbol{B}$
(and
$\boldsymbol{{\rm\nabla}}\boldsymbol{B}$
(and
 $\boldsymbol{B}$
). Although various early analytic works argued for a kinematic shear-current dynamo of this type (Urpin Reference Urpin1999, Reference Urpin2002; Rogachevskii & Kleeorin Reference Rogachevskii and Kleeorin2003), subsequently several authors found that kinematically
$\boldsymbol{B}$
). Although various early analytic works argued for a kinematic shear-current dynamo of this type (Urpin Reference Urpin1999, Reference Urpin2002; Rogachevskii & Kleeorin Reference Rogachevskii and Kleeorin2003), subsequently several authors found that kinematically
 ${\it\eta}_{yx}>0$
(at least at low
${\it\eta}_{yx}>0$
(at least at low
 $\mathit{Rm}$
) and thus concluded that a coherent kinematic dynamo cannot explain the field generation observed in numerical experiments (Rädler & Stepanov Reference Rädler and Stepanov2006, Brandenburg et al.
Reference Brandenburg, Rädler, Rheinhardt and Käpylä2008a
, Singh & Jingade Reference Singh and Jingade2015; Paper II). Here we argue instead that strong homogenous magnetic fluctuations (denoted by
$\mathit{Rm}$
) and thus concluded that a coherent kinematic dynamo cannot explain the field generation observed in numerical experiments (Rädler & Stepanov Reference Rädler and Stepanov2006, Brandenburg et al.
Reference Brandenburg, Rädler, Rheinhardt and Käpylä2008a
, Singh & Jingade Reference Singh and Jingade2015; Paper II). Here we argue instead that strong homogenous magnetic fluctuations (denoted by
 $\boldsymbol{b}_{0}$
) can generate
$\boldsymbol{b}_{0}$
) can generate
 $\boldsymbol{u}$
fluctuations with the required correlations to cause a negative
$\boldsymbol{u}$
fluctuations with the required correlations to cause a negative
 ${\it\eta}_{yx}$
. Such
${\it\eta}_{yx}$
. Such
 $\boldsymbol{b}_{0}$
fluctuations should be ubiquitous in MHD turbulence at high Reynolds numbers, since the small-scale dynamo will be unstable (with a large growth rate set by the smallest scales in the turbulence), creating a turbulent state with
$\boldsymbol{b}_{0}$
fluctuations should be ubiquitous in MHD turbulence at high Reynolds numbers, since the small-scale dynamo will be unstable (with a large growth rate set by the smallest scales in the turbulence), creating a turbulent state with
 $\boldsymbol{b}_{0}\sim \boldsymbol{u}_{0}$
(Schekochihin et al.
Reference Schekochihin, Cowley, Taylor, Hammett, Maron and Mcwilliams2004).
$\boldsymbol{b}_{0}\sim \boldsymbol{u}_{0}$
(Schekochihin et al.
Reference Schekochihin, Cowley, Taylor, Hammett, Maron and Mcwilliams2004).
Before continuing, it is worth mentioning another possibility for large-scale field generation in this geometry – the so-called, stochastic-
 ${\it\alpha}$
effect. This arises through fluctuations in the
${\it\alpha}$
effect. This arises through fluctuations in the
 ${\it\alpha}_{ij}$
coefficients, even though their mean must vanish (Vishniac & Brandenburg Reference Vishniac and Brandenburg1997; Heinemann, McWilliams & Schekochihin Reference Heinemann, Mcwilliams and Schekochihin2011; Mitra & Brandenburg Reference Mitra and Brandenburg2012). This dynamo is not mean field in the usual sense since it relies on the finite size of the system to cause the
${\it\alpha}_{ij}$
coefficients, even though their mean must vanish (Vishniac & Brandenburg Reference Vishniac and Brandenburg1997; Heinemann, McWilliams & Schekochihin Reference Heinemann, Mcwilliams and Schekochihin2011; Mitra & Brandenburg Reference Mitra and Brandenburg2012). This dynamo is not mean field in the usual sense since it relies on the finite size of the system to cause the
 ${\it\alpha}$
fluctuations that lead to mean-field growth; nonetheless, given that the universe is sampling a single realization of turbulence, not the ensemble average, such effects could be entirely physical. (That said, one consequence of this incoherent dynamo mechanism is that the growth rate can be arbitrarily increased or decreased by changing the volume of the mean-field average, which hints that coherent effects should dominate when a very large range of scales are present.) While we shall not examine the stochastic-
${\it\alpha}$
fluctuations that lead to mean-field growth; nonetheless, given that the universe is sampling a single realization of turbulence, not the ensemble average, such effects could be entirely physical. (That said, one consequence of this incoherent dynamo mechanism is that the growth rate can be arbitrarily increased or decreased by changing the volume of the mean-field average, which hints that coherent effects should dominate when a very large range of scales are present.) While we shall not examine the stochastic-
 ${\it\alpha}$
effect in detail in this work (see Paper II), it is important to be mindful of the possibility, since it complicates the analysis of simulation results where large-scale field growth is observed. One distinguishing feature from the shear-current effect is that
${\it\alpha}$
effect in detail in this work (see Paper II), it is important to be mindful of the possibility, since it complicates the analysis of simulation results where large-scale field growth is observed. One distinguishing feature from the shear-current effect is that
 $\boldsymbol{B}(z,t)$
cannot have a constant phase in time as it grows, since the average of
$\boldsymbol{B}(z,t)$
cannot have a constant phase in time as it grows, since the average of
 $\boldsymbol{B}$
over an ensemble of realizations vanishes, implying
$\boldsymbol{B}$
over an ensemble of realizations vanishes, implying
 $\boldsymbol{B}$
must be uncorrelated with itself after
$\boldsymbol{B}$
must be uncorrelated with itself after
 $t\gtrsim (k^{2}{\it\eta}_{t})^{-1}$
Footnote
2
. More information, including analyses of the relative importance of the coherent and incoherent shear-dynamo mechanisms in low-
$t\gtrsim (k^{2}{\it\eta}_{t})^{-1}$
Footnote
2
. More information, including analyses of the relative importance of the coherent and incoherent shear-dynamo mechanisms in low-
 $\mathit{Rm}$
systems, can be found in Paper II.
$\mathit{Rm}$
systems, can be found in Paper II.
2.2 The mechanism for the magnetic shear-current effect
In this section we discuss the mean-field generation mechanism of the magnetic shear-current effect. The stability analysis given in § 2.1 makes it clear that we require
 ${\it\eta}_{yx}<0$
for a coherent dynamo instability. In the present context, with both the mean magnetic field and flow in the
${\it\eta}_{yx}<0$
for a coherent dynamo instability. In the present context, with both the mean magnetic field and flow in the
 $y$
direction and their prescribed spatial dependencies (see figure 3
a), this is equivalent to requiring that the
$y$
direction and their prescribed spatial dependencies (see figure 3
a), this is equivalent to requiring that the
 $y$
component of the turbulent EMF be negative. The challenge is then for us to explain how this can come about in the present geometry. The cartoon picture that we present has its origins in the analytic ‘second-order correlation approximation’ (SOCA) calculations presented in Paper III. In particular, by selectively removing terms from the calculation and examining the effects on the final
$y$
component of the turbulent EMF be negative. The challenge is then for us to explain how this can come about in the present geometry. The cartoon picture that we present has its origins in the analytic ‘second-order correlation approximation’ (SOCA) calculations presented in Paper III. In particular, by selectively removing terms from the calculation and examining the effects on the final
 ${\it\eta}_{yx}$
, one can unambiguously determine from where the effect arises (at least within the quasi-linear approximation). Most importantly, this exercise shows that the magnetic shear-current effect arises exclusively from the pressure response of the velocity fluctuations. The mechanism is fundamentally related to the lack of turbulent resistivity quenching by the magnetic field (often referred to as a lack of ‘
${\it\eta}_{yx}$
, one can unambiguously determine from where the effect arises (at least within the quasi-linear approximation). Most importantly, this exercise shows that the magnetic shear-current effect arises exclusively from the pressure response of the velocity fluctuations. The mechanism is fundamentally related to the lack of turbulent resistivity quenching by the magnetic field (often referred to as a lack of ‘
 ${\it\beta}$
quenching’; see Gruzinov & Diamond (Reference Gruzinov and Diamond1994) and Bhattacharjee & Yuan (Reference Bhattacharjee and Yuan1995)), which results from a cancellation between a turbulent magnetic resistivity (of the same form as kinematic turbulent resistivity), and an equal and opposite contribution from the pressure response (Avinash Reference Avinash1991).
${\it\beta}$
quenching’; see Gruzinov & Diamond (Reference Gruzinov and Diamond1994) and Bhattacharjee & Yuan (Reference Bhattacharjee and Yuan1995)), which results from a cancellation between a turbulent magnetic resistivity (of the same form as kinematic turbulent resistivity), and an equal and opposite contribution from the pressure response (Avinash Reference Avinash1991).
We divide our discussion up as answers to three questions: (i) how do we generate the fluctuations needed to support the required EMF? (ii) What happens in the absence of flow shear? And (iii) what happens in the presence of flow shear?
2.2.1 How do we generate the fluctuations needed to support the required EMF?
The fluctuations needed to support our physical picture are magnetically driven. In contrast to kinematic dynamos, the Maxwell stress
 $\boldsymbol{B}_{T}\boldsymbol{\cdot }\boldsymbol{{\rm\nabla}}\boldsymbol{B}_{T}$
is fundamental for a magnetically driven dynamo, since this is required to generate
$\boldsymbol{B}_{T}\boldsymbol{\cdot }\boldsymbol{{\rm\nabla}}\boldsymbol{B}_{T}$
is fundamental for a magnetically driven dynamo, since this is required to generate
 $\boldsymbol{u}$
from
$\boldsymbol{u}$
from
 $\boldsymbol{b}$
(in the same way the Lorentz force
$\boldsymbol{b}$
(in the same way the Lorentz force
 $\boldsymbol{{\rm\nabla}}\times (\boldsymbol{U}_{T}\times \boldsymbol{B}_{T})$
generates correlated
$\boldsymbol{{\rm\nabla}}\times (\boldsymbol{U}_{T}\times \boldsymbol{B}_{T})$
generates correlated
 $\boldsymbol{b}$
fluctuations in kinematic dynamos). Such dynamos can still be analysed linearly if one assumes that the interaction of fluctuations with mean fields is more important for the EMF than the interaction with themselves; that is,
$\boldsymbol{b}$
fluctuations in kinematic dynamos). Such dynamos can still be analysed linearly if one assumes that the interaction of fluctuations with mean fields is more important for the EMF than the interaction with themselves; that is,
 $$\begin{eqnarray}\boldsymbol{b}\boldsymbol{\cdot }\boldsymbol{{\rm\nabla}}\boldsymbol{B}+\boldsymbol{B}\boldsymbol{\cdot }\boldsymbol{{\rm\nabla}}\boldsymbol{b}\text{ is more important than }\boldsymbol{b}\boldsymbol{\cdot }\boldsymbol{{\rm\nabla}}\boldsymbol{b}-\overline{\boldsymbol{b}\boldsymbol{\cdot }\boldsymbol{{\rm\nabla}}\boldsymbol{b}}.\end{eqnarray}$$
This approximation – which along with a similar approximation for the Lorentz force, is the basis for SOCA – is valid only at low Reynolds numbers and non-zero mean fields, but allows one to consider how small-scale eddies and field loops would interact with large-scale field and flow gradients in a relatively straightforward way. Note that, ‘is more important’ in (2.6) refers to the terms’ relative importance for the generation of an EMF that is correlated with
 $\boldsymbol{B}$
(this correlation is necessary for a large-scale dynamo). Since only the part of
$\boldsymbol{B}$
(this correlation is necessary for a large-scale dynamo). Since only the part of
 $\boldsymbol{b}$
that is influenced by
$\boldsymbol{b}$
that is influenced by
 $\boldsymbol{B}$
can contribute to this correlation, it seems reasonable to surmise that results should be qualitatively applicable outside their true validity range. In other words, since the interaction of
$\boldsymbol{B}$
can contribute to this correlation, it seems reasonable to surmise that results should be qualitatively applicable outside their true validity range. In other words, since the interaction of
 $\boldsymbol{b}$
with
$\boldsymbol{b}$
with
 $\boldsymbol{B}$
is the cause of the magnetic shear-current effect in the first place, we shall focus on this (rather than the much more complicated nonlinear terms) for the development of our simple cartoon model.
$\boldsymbol{B}$
is the cause of the magnetic shear-current effect in the first place, we shall focus on this (rather than the much more complicated nonlinear terms) for the development of our simple cartoon model.
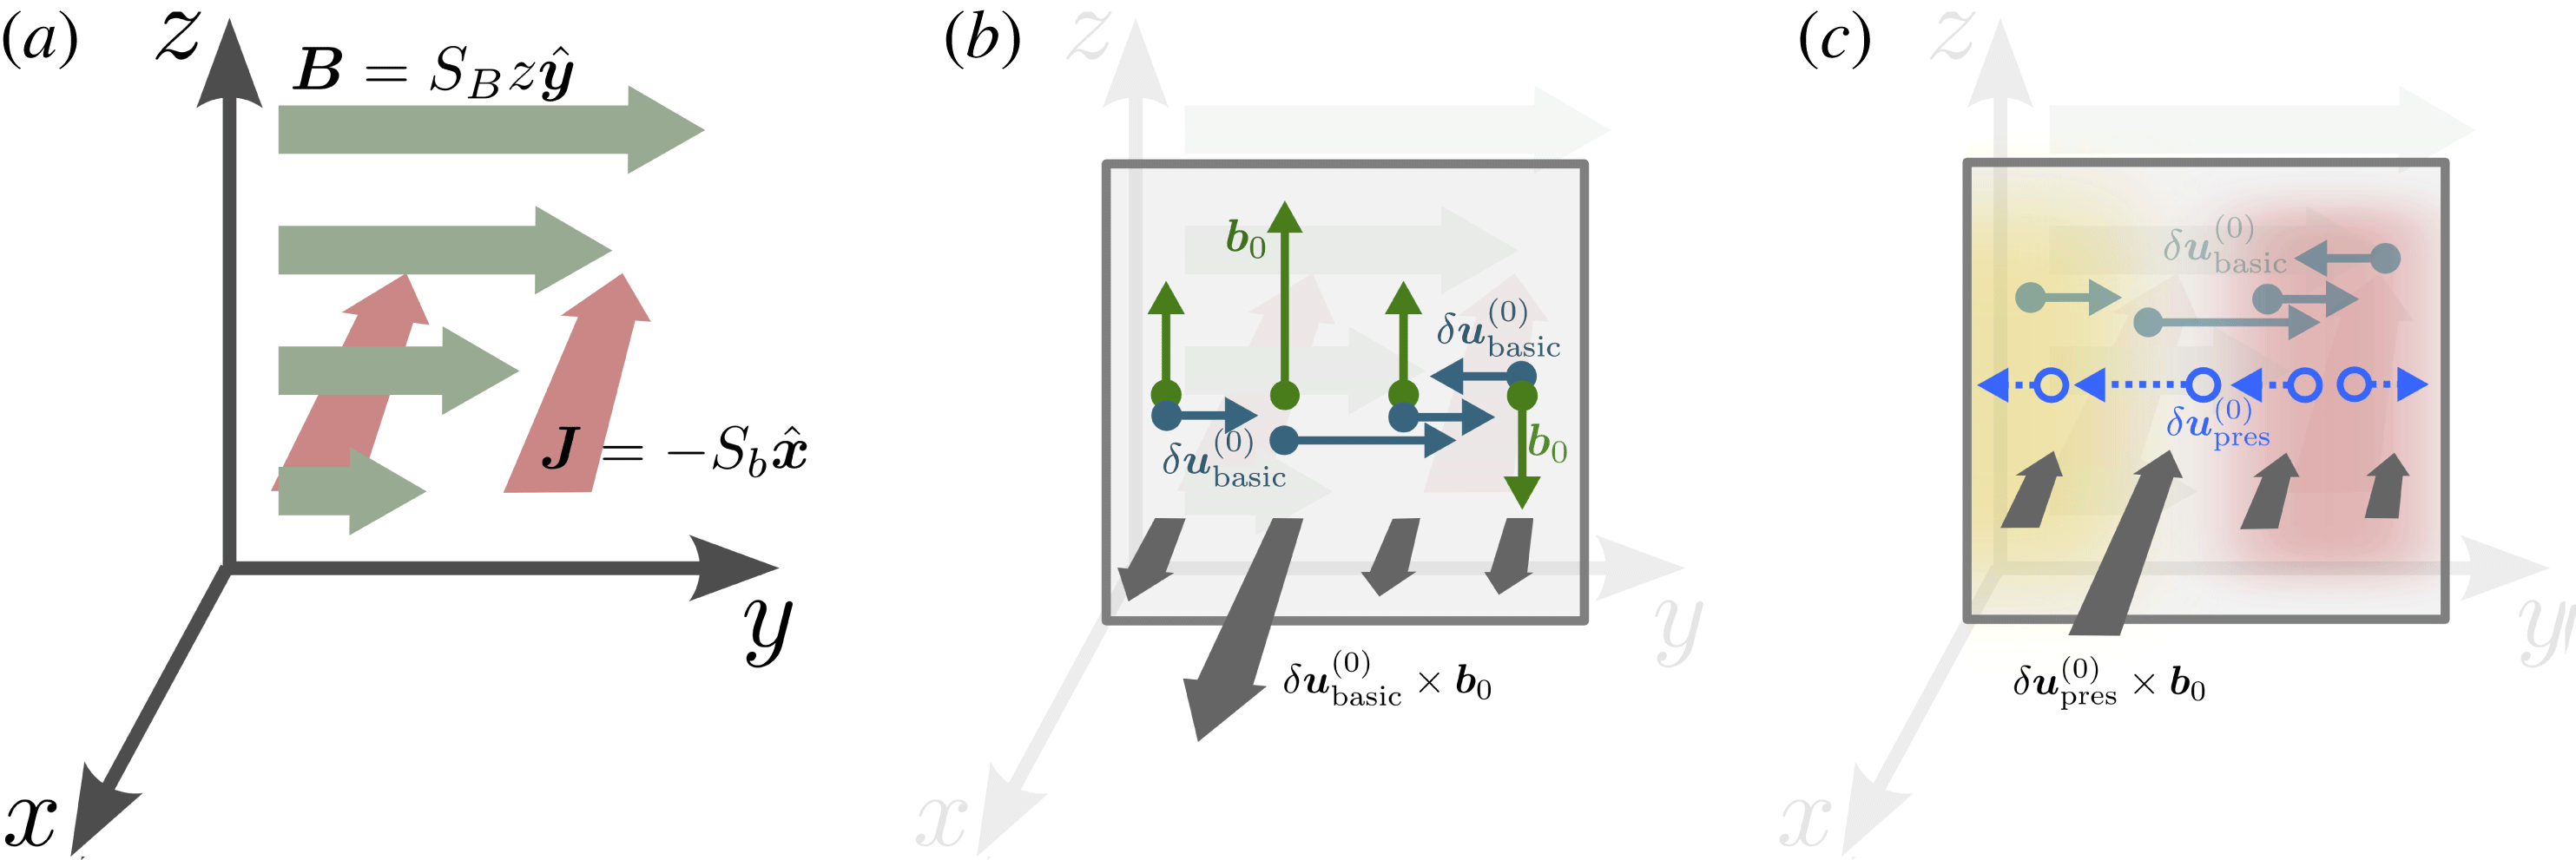
Depiction of the interactions between fluctuations (
 $\boldsymbol{b}_{0}$
,
$\boldsymbol{b}_{0}$
,
 $\boldsymbol{u}^{(i)}$
and
$\boldsymbol{u}^{(i)}$
and
 $\boldsymbol{b}^{(i)}$
) and a mean magnetic field
$\boldsymbol{b}^{(i)}$
) and a mean magnetic field
 $\boldsymbol{B}$
or a shear flow
$\boldsymbol{B}$
or a shear flow
 $\boldsymbol{U}$
, that can lead to a non-zero shear-current effect through
$\boldsymbol{U}$
, that can lead to a non-zero shear-current effect through
 $\overline{\boldsymbol{u}\times \boldsymbol{b}}$
, starting from strong homogenous magnetic fluctuations
$\overline{\boldsymbol{u}\times \boldsymbol{b}}$
, starting from strong homogenous magnetic fluctuations
 $\boldsymbol{b}_{0}$
. Here the straight black arrows, with either
$\boldsymbol{b}_{0}$
. Here the straight black arrows, with either
 $\boldsymbol{B}$
or
$\boldsymbol{B}$
or
 $\boldsymbol{U}$
, depict an interaction that creates one fluctuating field from another, which will be correlated with the original fluctuation and thus can contribute to the EMF (for instance
$\boldsymbol{U}$
, depict an interaction that creates one fluctuating field from another, which will be correlated with the original fluctuation and thus can contribute to the EMF (for instance
 $\boldsymbol{u}^{(0)}\sim {\it\tau}_{c}\boldsymbol{B}\boldsymbol{\cdot }\boldsymbol{{\rm\nabla}}\boldsymbol{b}_{0}+{\it\tau}_{c}\boldsymbol{b}_{0}\boldsymbol{\cdot }\boldsymbol{{\rm\nabla}}\boldsymbol{B}$
). The double headed (blue) arrows indicate the lowest-order combinations of
$\boldsymbol{u}^{(0)}\sim {\it\tau}_{c}\boldsymbol{B}\boldsymbol{\cdot }\boldsymbol{{\rm\nabla}}\boldsymbol{b}_{0}+{\it\tau}_{c}\boldsymbol{b}_{0}\boldsymbol{\cdot }\boldsymbol{{\rm\nabla}}\boldsymbol{B}$
). The double headed (blue) arrows indicate the lowest-order combinations of
 $\boldsymbol{b}_{0}$
,
$\boldsymbol{b}_{0}$
,
 $\boldsymbol{u}^{(i)}$
and
$\boldsymbol{u}^{(i)}$
and
 $\boldsymbol{b}^{(i)}$
that can lead to non-zero
$\boldsymbol{b}^{(i)}$
that can lead to non-zero
 ${\it\eta}_{yx}$
, with the interaction studied in § 2.2 shown by the solid line.
${\it\eta}_{yx}$
, with the interaction studied in § 2.2 shown by the solid line.
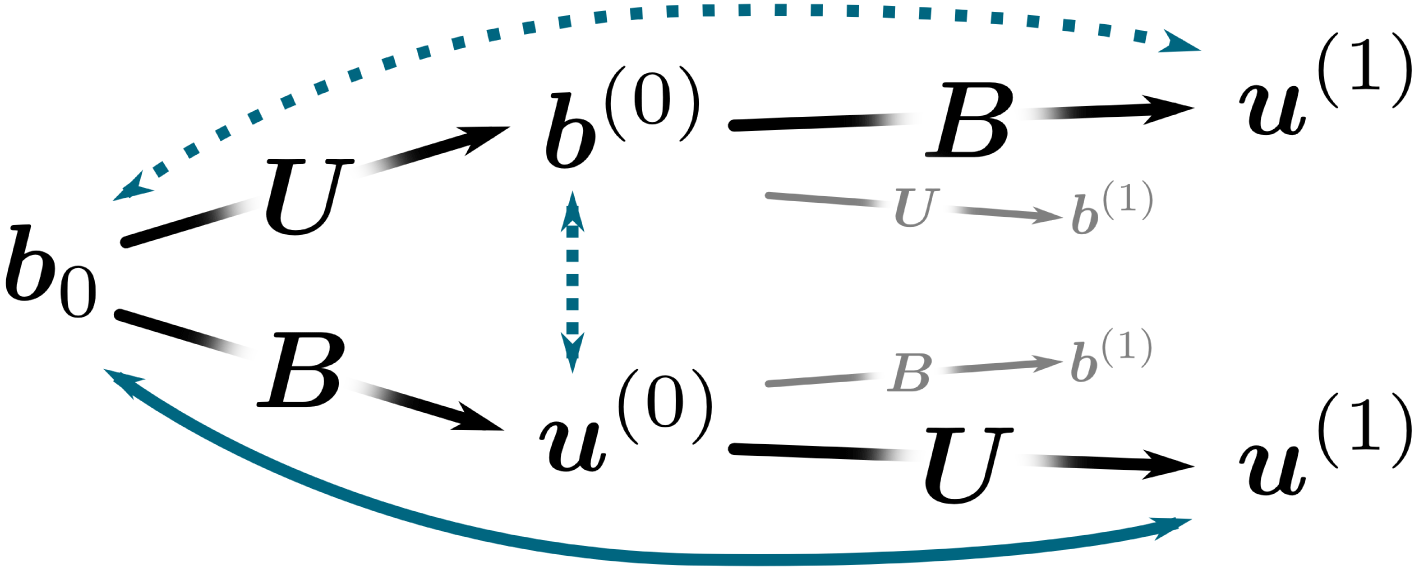
The shear-current effect requires both a field gradient and a flow gradient (shear flow). Thus, any perturbation
 $\boldsymbol{b}_{0}$
(arising as part of the bath of statistically homogenous magnetic fluctuations) must interact with both
$\boldsymbol{b}_{0}$
(arising as part of the bath of statistically homogenous magnetic fluctuations) must interact with both
 $\boldsymbol{U}$
and
$\boldsymbol{U}$
and
 $\boldsymbol{B}$
to generate a
$\boldsymbol{B}$
to generate a
 $\boldsymbol{u}$
fluctuation. The possible ways in which this can happen are illustrated in figure 1, where the notation is the same as that used in Paper III, with
$\boldsymbol{u}$
fluctuation. The possible ways in which this can happen are illustrated in figure 1, where the notation is the same as that used in Paper III, with
 $\boldsymbol{f}^{(0)}$
indicating a field that arises directly from the interaction of
$\boldsymbol{f}^{(0)}$
indicating a field that arises directly from the interaction of
 $\boldsymbol{b}_{0}$
(or
$\boldsymbol{b}_{0}$
(or
 $\boldsymbol{u}_{0}$
) with the mean fields, and
$\boldsymbol{u}_{0}$
) with the mean fields, and
 $\boldsymbol{f}^{(1)}$
indicating one that arises through
$\boldsymbol{f}^{(1)}$
indicating one that arises through
 $\boldsymbol{f}^{(0)}$
. In addition, we use
$\boldsymbol{f}^{(0)}$
. In addition, we use
 $(\cdot )_{b}$
to denote the part of a transport coefficient that is due to homogenous magnetic fluctuations; for example,
$(\cdot )_{b}$
to denote the part of a transport coefficient that is due to homogenous magnetic fluctuations; for example,
 $({\it\eta}_{yx})_{b}$
. From the momentum equation, a
$({\it\eta}_{yx})_{b}$
. From the momentum equation, a
 $\boldsymbol{b}$
perturbation can generate a
$\boldsymbol{b}$
perturbation can generate a
 $\boldsymbol{u}$
perturbation through
$\boldsymbol{u}$
perturbation through
 $\boldsymbol{b}\boldsymbol{\cdot }\boldsymbol{{\rm\nabla}}\boldsymbol{B}+\boldsymbol{B}\boldsymbol{\cdot }\boldsymbol{{\rm\nabla}}\boldsymbol{b}$
, while a
$\boldsymbol{b}\boldsymbol{\cdot }\boldsymbol{{\rm\nabla}}\boldsymbol{B}+\boldsymbol{B}\boldsymbol{\cdot }\boldsymbol{{\rm\nabla}}\boldsymbol{b}$
, while a
 $\boldsymbol{u}$
perturbation can generate a
$\boldsymbol{u}$
perturbation can generate a
 $\boldsymbol{u}$
perturbation through
$\boldsymbol{u}$
perturbation through
 $-\boldsymbol{u}\boldsymbol{\cdot }\boldsymbol{{\rm\nabla}}\boldsymbol{U}-\boldsymbol{U}\boldsymbol{\cdot }\boldsymbol{{\rm\nabla}}\boldsymbol{u}$
. Similarly, from the induction equation a
$-\boldsymbol{u}\boldsymbol{\cdot }\boldsymbol{{\rm\nabla}}\boldsymbol{U}-\boldsymbol{U}\boldsymbol{\cdot }\boldsymbol{{\rm\nabla}}\boldsymbol{u}$
. Similarly, from the induction equation a
 $\boldsymbol{b}$
perturbation is generated through either a
$\boldsymbol{b}$
perturbation is generated through either a
 $\boldsymbol{u}$
perturbation (
$\boldsymbol{u}$
perturbation (
 $\boldsymbol{B}\boldsymbol{\cdot }\boldsymbol{{\rm\nabla}}\boldsymbol{u}$
), or through a
$\boldsymbol{B}\boldsymbol{\cdot }\boldsymbol{{\rm\nabla}}\boldsymbol{u}$
), or through a
 $\boldsymbol{b}$
perturbation (
$\boldsymbol{b}$
perturbation (
 $-\boldsymbol{U}\boldsymbol{\cdot }\boldsymbol{{\rm\nabla}}\boldsymbol{b}$
). We see from figure 1 that there are three possibilities for contributing to
$-\boldsymbol{U}\boldsymbol{\cdot }\boldsymbol{{\rm\nabla}}\boldsymbol{b}$
). We see from figure 1 that there are three possibilities for contributing to
 $({\it\eta}_{yx})_{b}$
:
$({\it\eta}_{yx})_{b}$
:
 $\boldsymbol{u}^{(0)}\times \boldsymbol{b}^{(0)}$
,
$\boldsymbol{u}^{(0)}\times \boldsymbol{b}^{(0)}$
,
 $(\boldsymbol{u}^{(1)}\times \boldsymbol{b}_{0})_{1}$
and
$(\boldsymbol{u}^{(1)}\times \boldsymbol{b}_{0})_{1}$
and
 $(\boldsymbol{u}^{(1)}\times \boldsymbol{b}_{0})_{2}$
. Here
$(\boldsymbol{u}^{(1)}\times \boldsymbol{b}_{0})_{2}$
. Here
 $(\boldsymbol{u}^{(1)}\times \boldsymbol{b}_{0})_{1}$
refers to the pathway for generating
$(\boldsymbol{u}^{(1)}\times \boldsymbol{b}_{0})_{1}$
refers to the pathway for generating
 $\boldsymbol{u}^{(1)}$
through
$\boldsymbol{u}^{(1)}$
through
 $\boldsymbol{u}^{(0)}$
(shown by the solid arrow in figure 1), while
$\boldsymbol{u}^{(0)}$
(shown by the solid arrow in figure 1), while
 $(\boldsymbol{u}^{(1)}\times \boldsymbol{b}_{0})_{2}$
refers to the pathway through
$(\boldsymbol{u}^{(1)}\times \boldsymbol{b}_{0})_{2}$
refers to the pathway through
 $\boldsymbol{b}^{(0)}$
(shown by the top dashed arrow). Out of these, we have determined from the calculations in Paper III that
$\boldsymbol{b}^{(0)}$
(shown by the top dashed arrow). Out of these, we have determined from the calculations in Paper III that
 $(\boldsymbol{u}^{(1)}\times \boldsymbol{b}_{0})_{1}$
is both the simplest and contributes the most to
$(\boldsymbol{u}^{(1)}\times \boldsymbol{b}_{0})_{1}$
is both the simplest and contributes the most to
 $({\it\eta}_{yx})_{b}$
. In particular, the mechanism does not directly rely on dissipation to generate the required correlations, as will be seen belowFootnote
3
. We have found empirically that the
$({\it\eta}_{yx})_{b}$
. In particular, the mechanism does not directly rely on dissipation to generate the required correlations, as will be seen belowFootnote
3
. We have found empirically that the
 $\boldsymbol{u}^{(0)}\times \boldsymbol{b}^{(0)}$
contribution is moderate in size (generally a factor of
$\boldsymbol{u}^{(0)}\times \boldsymbol{b}^{(0)}$
contribution is moderate in size (generally a factor of
 ${\sim}2$
smaller than
${\sim}2$
smaller than
 $\boldsymbol{u}^{(1)}\times \boldsymbol{b}_{0}$
) and also always negative, while the
$\boldsymbol{u}^{(1)}\times \boldsymbol{b}_{0}$
) and also always negative, while the
 $(\boldsymbol{u}^{(1)}\times \boldsymbol{b}_{0})_{2}$
contribution (dotted line in figure 1) can change sign but is much smaller in magnitude.
$(\boldsymbol{u}^{(1)}\times \boldsymbol{b}_{0})_{2}$
contribution (dotted line in figure 1) can change sign but is much smaller in magnitude.
2.2.2 What happens in the absence of flow shear?
As mentioned above, in the absence of flow shear, there is no quenching of the turbulent resistivity. This effect – which could also be stated as
 $({\it\eta}_{xx})_{b}=({\it\eta}_{yy})_{b}=0$
in the notation of (2.4) – arises through the pressure response of the fluid. We feel it helpful to first explain this mechanism in more detail, since the form of the pressure response has not been discussed in detail in previous literature (so far as we are aware)Footnote
4
and the magnetic shear-current effect is essentially an extension of this. As can be seen using SOCA (or the
$({\it\eta}_{xx})_{b}=({\it\eta}_{yy})_{b}=0$
in the notation of (2.4) – arises through the pressure response of the fluid. We feel it helpful to first explain this mechanism in more detail, since the form of the pressure response has not been discussed in detail in previous literature (so far as we are aware)Footnote
4
and the magnetic shear-current effect is essentially an extension of this. As can be seen using SOCA (or the
 ${\it\tau}$
approximation; see Rädler, Kleeorin & Rogachevskii Reference Rädler, Kleeorin and Rogachevskii2003), the effect occurs because the pressure response has an equal and opposite effect to the primary velocity perturbation (Avinash Reference Avinash1991). This behaviour is illustrated graphically in figure 2, which shows the response of the fluid to a magnetic perturbation in the linearly varying magnetic field
${\it\tau}$
approximation; see Rädler, Kleeorin & Rogachevskii Reference Rädler, Kleeorin and Rogachevskii2003), the effect occurs because the pressure response has an equal and opposite effect to the primary velocity perturbation (Avinash Reference Avinash1991). This behaviour is illustrated graphically in figure 2, which shows the response of the fluid to a magnetic perturbation in the linearly varying magnetic field
 $\boldsymbol{B}=S_{B}z\hat{\boldsymbol{y}}$
. Due to the mean-field geometry, the velocity perturbation
$\boldsymbol{B}=S_{B}z\hat{\boldsymbol{y}}$
. Due to the mean-field geometry, the velocity perturbation
 ${\it\delta}\boldsymbol{u}_{\mathit{basic}}^{(0)}\sim {\it\tau}_{c}\boldsymbol{b}\boldsymbol{\cdot }\boldsymbol{{\rm\nabla}}\boldsymbol{B}$
(where
${\it\delta}\boldsymbol{u}_{\mathit{basic}}^{(0)}\sim {\it\tau}_{c}\boldsymbol{b}\boldsymbol{\cdot }\boldsymbol{{\rm\nabla}}\boldsymbol{B}$
(where
 ${\it\tau}_{c}$
is some turbulent correlation time) is simply
${\it\tau}_{c}$
is some turbulent correlation time) is simply
 $S_{B}b_{0z}\hat{\boldsymbol{y}}$
; i.e. only the
$S_{B}b_{0z}\hat{\boldsymbol{y}}$
; i.e. only the
 $z$
component of
$z$
component of
 $\boldsymbol{b}_{0}$
contributes. Note that the other contribution
$\boldsymbol{b}_{0}$
contributes. Note that the other contribution
 ${\it\delta}\boldsymbol{u}_{\mathit{basic}}^{(0)}\sim {\it\tau}_{c}\boldsymbol{B}\boldsymbol{\cdot }\boldsymbol{{\rm\nabla}}\boldsymbol{b}$
, will only contribute directly to the EMF if there is a mean correlation between
${\it\delta}\boldsymbol{u}_{\mathit{basic}}^{(0)}\sim {\it\tau}_{c}\boldsymbol{B}\boldsymbol{\cdot }\boldsymbol{{\rm\nabla}}\boldsymbol{b}$
, will only contribute directly to the EMF if there is a mean correlation between
 $\boldsymbol{b}$
and
$\boldsymbol{b}$
and
 $\boldsymbol{{\rm\nabla}}\boldsymbol{b}$
, which occurs if there is net current helicity (this term is the origin of the magnetic
$\boldsymbol{{\rm\nabla}}\boldsymbol{b}$
, which occurs if there is net current helicity (this term is the origin of the magnetic
 ${\it\alpha}$
effect)Footnote
5
. Obviously, the perturbation
${\it\alpha}$
effect)Footnote
5
. Obviously, the perturbation
 ${\it\delta}\boldsymbol{u}_{\mathit{basic}}^{(0)}\sim S_{B}b_{0z}\hat{\boldsymbol{y}}$
is correlated with
${\it\delta}\boldsymbol{u}_{\mathit{basic}}^{(0)}\sim S_{B}b_{0z}\hat{\boldsymbol{y}}$
is correlated with
 $\boldsymbol{b}_{0}$
and it is straightforward to see (see figure 2
b) that a net
$\boldsymbol{b}_{0}$
and it is straightforward to see (see figure 2
b) that a net
 $\boldsymbol{{\mathcal{E}}}$
is created in the
$\boldsymbol{{\mathcal{E}}}$
is created in the
 $\hat{\boldsymbol{x}}$
direction, opposite to the mean current and thus acting as a turbulent dissipation for the mean field.
$\hat{\boldsymbol{x}}$
direction, opposite to the mean current and thus acting as a turbulent dissipation for the mean field.
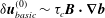
Graphical illustration of the mean-field resistivity – or lack thereof – generated by homogenous small-scale magnetic fluctuations, with the geometry of the mean field illustrated in (a). (b) Shows how
 $b_{0z}$
perturbations (from an homogeneous turbulent bath) lead to a
$b_{0z}$
perturbations (from an homogeneous turbulent bath) lead to a
 $\boldsymbol{u}$
perturbation (labelled
$\boldsymbol{u}$
perturbation (labelled
 ${\it\delta}\boldsymbol{u}_{\mathit{basic}}^{(0)}$
) through
${\it\delta}\boldsymbol{u}_{\mathit{basic}}^{(0)}$
) through
 $\boldsymbol{b}\boldsymbol{\cdot }\boldsymbol{{\rm\nabla}}\boldsymbol{B}=S_{B}b_{0z}\hat{\boldsymbol{y}}$
, resulting in an EMF in the
$\boldsymbol{b}\boldsymbol{\cdot }\boldsymbol{{\rm\nabla}}\boldsymbol{B}=S_{B}b_{0z}\hat{\boldsymbol{y}}$
, resulting in an EMF in the
 $-\boldsymbol{J}$
direction. (c) Shows how the pressure response to this
$-\boldsymbol{J}$
direction. (c) Shows how the pressure response to this
 ${\it\delta}\boldsymbol{u}_{\mathit{basic}}^{(0)}$
(labelled
${\it\delta}\boldsymbol{u}_{\mathit{basic}}^{(0)}$
(labelled
 ${\it\delta}\boldsymbol{u}_{\mathit{pres}}^{(0)}$
), which arises due to its non-zero divergence (yellow and red shaded regions for
${\it\delta}\boldsymbol{u}_{\mathit{pres}}^{(0)}$
), which arises due to its non-zero divergence (yellow and red shaded regions for
 $\boldsymbol{{\rm\nabla}}\boldsymbol{\cdot }{\it\delta}\boldsymbol{u}_{\mathit{basic}}^{(0)}>0$
and
$\boldsymbol{{\rm\nabla}}\boldsymbol{\cdot }{\it\delta}\boldsymbol{u}_{\mathit{basic}}^{(0)}>0$
and
 $\boldsymbol{{\rm\nabla}}\boldsymbol{\cdot }{\it\delta}\boldsymbol{u}_{\mathit{basic}}^{(0)}<0$
respectively), leads to an EMF that opposes that from
$\boldsymbol{{\rm\nabla}}\boldsymbol{\cdot }{\it\delta}\boldsymbol{u}_{\mathit{basic}}^{(0)}<0$
respectively), leads to an EMF that opposes that from
 ${\it\delta}\boldsymbol{u}_{\mathit{basic}}^{(0)}$
. A more careful calculation shows that the cancellation is exact (in incompressible turbulence at low
${\it\delta}\boldsymbol{u}_{\mathit{basic}}^{(0)}$
. A more careful calculation shows that the cancellation is exact (in incompressible turbulence at low
 $\mathit{Rm}$
), so the turbulent resistivity due to magnetic fluctuations vanishes. See text for further discussion.
$\mathit{Rm}$
), so the turbulent resistivity due to magnetic fluctuations vanishes. See text for further discussion.
However, as is clear from figure 2, the
 ${\it\delta}\boldsymbol{u}_{\mathit{basic}}^{(0)}$
perturbation is not divergence free, given any
${\it\delta}\boldsymbol{u}_{\mathit{basic}}^{(0)}$
perturbation is not divergence free, given any
 $y$
variation in
$y$
variation in
 $b_{0z}$
. In figure 2(c), the shaded regions illustrate where the divergence of
$b_{0z}$
. In figure 2(c), the shaded regions illustrate where the divergence of
 ${\it\delta}\boldsymbol{u}_{\mathit{basic}}^{(0)}$
is positive (yellow) or negative (red). Given the incompressibility of the fluid, a non-zero divergence is not possible, and the
${\it\delta}\boldsymbol{u}_{\mathit{basic}}^{(0)}$
is positive (yellow) or negative (red). Given the incompressibility of the fluid, a non-zero divergence is not possible, and the
 $\boldsymbol{{\rm\nabla}}p$
term responds appropriately, creating a flow perturbation from regions of negative divergence to positive divergence (mathematically,
$\boldsymbol{{\rm\nabla}}p$
term responds appropriately, creating a flow perturbation from regions of negative divergence to positive divergence (mathematically,
 ${\it\delta}\boldsymbol{u}_{\mathit{pres}}^{(0)}={\rm\nabla}^{-2}[-\boldsymbol{{\rm\nabla}}(\boldsymbol{{\rm\nabla}}\boldsymbol{\cdot }{\it\delta}\boldsymbol{u}_{\mathit{basic}}^{(0)})]$
). As shown in figure 2(c) this perturbation is anticorrelated with
${\it\delta}\boldsymbol{u}_{\mathit{pres}}^{(0)}={\rm\nabla}^{-2}[-\boldsymbol{{\rm\nabla}}(\boldsymbol{{\rm\nabla}}\boldsymbol{\cdot }{\it\delta}\boldsymbol{u}_{\mathit{basic}}^{(0)})]$
). As shown in figure 2(c) this perturbation is anticorrelated with
 ${\it\delta}\boldsymbol{u}_{\mathit{basic}}^{(0)}$
and thus creates an oppositely directed EMF, in the
${\it\delta}\boldsymbol{u}_{\mathit{basic}}^{(0)}$
and thus creates an oppositely directed EMF, in the
 $+\boldsymbol{J}$
direction. Further, since
$+\boldsymbol{J}$
direction. Further, since
 $\boldsymbol{{\rm\nabla}}\boldsymbol{\cdot }(\boldsymbol{b}\boldsymbol{\cdot }\boldsymbol{{\rm\nabla}}\boldsymbol{B})=\boldsymbol{{\rm\nabla}}\boldsymbol{\cdot }(\boldsymbol{B}\boldsymbol{\cdot }\boldsymbol{{\rm\nabla}}\boldsymbol{b})$
, each of these linear contributions to the Maxwell stress add in the same way to the pressure perturbation, and a more careful calculation shows that the effect exactly cancels the original EMF on average. Given its reliance on the pressure response, the effect will be reduced in a compressible flow (presumably becoming negligible for high Mach number flows), and one would expect
$\boldsymbol{{\rm\nabla}}\boldsymbol{\cdot }(\boldsymbol{b}\boldsymbol{\cdot }\boldsymbol{{\rm\nabla}}\boldsymbol{B})=\boldsymbol{{\rm\nabla}}\boldsymbol{\cdot }(\boldsymbol{B}\boldsymbol{\cdot }\boldsymbol{{\rm\nabla}}\boldsymbol{b})$
, each of these linear contributions to the Maxwell stress add in the same way to the pressure perturbation, and a more careful calculation shows that the effect exactly cancels the original EMF on average. Given its reliance on the pressure response, the effect will be reduced in a compressible flow (presumably becoming negligible for high Mach number flows), and one would expect
 $\boldsymbol{b}_{0}$
fluctuations to increase the turbulent diffusivity in this case (the magnetic shear-current effect will also be less effective in a compressible flow). Finally, it is worth mentioning that
$\boldsymbol{b}_{0}$
fluctuations to increase the turbulent diffusivity in this case (the magnetic shear-current effect will also be less effective in a compressible flow). Finally, it is worth mentioning that
 $z$
variation of the initial
$z$
variation of the initial
 $\boldsymbol{b}_{0}$
perturbation will not contribute since this creates a
$\boldsymbol{b}_{0}$
perturbation will not contribute since this creates a
 $({\it\delta}\boldsymbol{u}_{\mathit{pres}}^{(0)})_{z}$
(which is zero in a cross-product with
$({\it\delta}\boldsymbol{u}_{\mathit{pres}}^{(0)})_{z}$
(which is zero in a cross-product with
 $b_{0z}$
), while
$b_{0z}$
), while
 $x$
variation of
$x$
variation of
 $\boldsymbol{b}_{0}$
produces a
$\boldsymbol{b}_{0}$
produces a
 $({\it\delta}\boldsymbol{u}_{\mathit{pres}}^{(0)})_{x}$
that is out of phase with the original
$({\it\delta}\boldsymbol{u}_{\mathit{pres}}^{(0)})_{x}$
that is out of phase with the original
 $b_{0z}$
perturbation.
$b_{0z}$
perturbation.
Graphical illustration of the magnetic shear-current effect, which should be interpreted as follows. (a) The geometry of the mean field and shear flow. (b) The flow perturbation (both
 ${\it\delta}\boldsymbol{u}_{\mathit{basic}}^{(0)}$
and
${\it\delta}\boldsymbol{u}_{\mathit{basic}}^{(0)}$
and
 ${\it\delta}\boldsymbol{u}_{\mathit{pres}}^{(0)}$
) that arises due to
${\it\delta}\boldsymbol{u}_{\mathit{pres}}^{(0)}$
) that arises due to
 $x$
,
$x$
,
 $y$
dependence of the initial
$y$
dependence of the initial
 $b_{0z}$
, before interaction with the shear flow (note the rotation of the axes compared to (a)). (c) The
$b_{0z}$
, before interaction with the shear flow (note the rotation of the axes compared to (a)). (c) The
 ${\it\delta}\boldsymbol{u}^{(1)}$
perturbation that arises from
${\it\delta}\boldsymbol{u}^{(1)}$
perturbation that arises from
 ${\it\delta}\boldsymbol{u}^{(0)}$
due to stretching by the flow, which illustrates a correlation between
${\it\delta}\boldsymbol{u}^{(0)}$
due to stretching by the flow, which illustrates a correlation between
 ${\it\delta}\boldsymbol{u}_{\mathit{pres}}^{(1)}$
and the original
${\it\delta}\boldsymbol{u}_{\mathit{pres}}^{(1)}$
and the original
 $b_{0z}$
structure. The resulting
$b_{0z}$
structure. The resulting
 $\boldsymbol{{\mathcal{E}}}$
is pointing in the
$\boldsymbol{{\mathcal{E}}}$
is pointing in the
 $-\hat{\boldsymbol{y}}$
direction, corresponding to a negative
$-\hat{\boldsymbol{y}}$
direction, corresponding to a negative
 ${\it\eta}_{yx}$
. (b) The yellow (red) shading indicates where
${\it\eta}_{yx}$
. (b) The yellow (red) shading indicates where
 ${\it\delta}\boldsymbol{u}_{\mathit{basic}}^{(0)}$
has a positive (negative) divergence, while the shading in panel (c) shows the same for
${\it\delta}\boldsymbol{u}_{\mathit{basic}}^{(0)}$
has a positive (negative) divergence, while the shading in panel (c) shows the same for
 ${\it\delta}\boldsymbol{u}_{\mathit{basic}}^{(1)}$
. More information and discussion is given in the main text.
${\it\delta}\boldsymbol{u}_{\mathit{basic}}^{(1)}$
. More information and discussion is given in the main text.

2.2.3 What happens in the presence of flow shear?
In the presence of flow shear, the cancellation discussed in the previous section leaves a residual
 $x$
-directed
$x$
-directed
 $\boldsymbol{u}$
perturbation. This perturbation – which arises from the interaction of the pressure perturbation in figure 2 with the mean shear, followed by the pressure response to this secondary perturbation – leads to the magnetic shear-current effect. This rather complex process is illustrated in graphically in figure 3, using similar conventions (and colour schemes) to figure 2. A shear flow in the
$\boldsymbol{u}$
perturbation. This perturbation – which arises from the interaction of the pressure perturbation in figure 2 with the mean shear, followed by the pressure response to this secondary perturbation – leads to the magnetic shear-current effect. This rather complex process is illustrated in graphically in figure 3, using similar conventions (and colour schemes) to figure 2. A shear flow in the
 $\hat{\boldsymbol{y}}$
direction is included in addition to the mean field
$\hat{\boldsymbol{y}}$
direction is included in addition to the mean field
 $\boldsymbol{B}=S_{B}z\hat{\boldsymbol{y}}$
, which corresponds exactly to the geometry discussed in § 2.1 and (2.4b
). Recall that
$\boldsymbol{B}=S_{B}z\hat{\boldsymbol{y}}$
, which corresponds exactly to the geometry discussed in § 2.1 and (2.4b
). Recall that
 ${\it\eta}_{yx}<0$
is equivalent to
${\it\eta}_{yx}<0$
is equivalent to
 ${\mathcal{E}}_{y}<0$
in this geometry (see (3.2)). Figure 3(b) illustrates the same effect as shown in figure 2, now including
${\mathcal{E}}_{y}<0$
in this geometry (see (3.2)). Figure 3(b) illustrates the same effect as shown in figure 2, now including
 $x$
and
$x$
and
 $y$
dependence of the
$y$
dependence of the
 $b_{0z}$
perturbation. As is evident, even though
$b_{0z}$
perturbation. As is evident, even though
 ${\it\delta}\boldsymbol{u}_{\mathit{basic}}^{(0)}$
points only in the
${\it\delta}\boldsymbol{u}_{\mathit{basic}}^{(0)}$
points only in the
 $y$
direction, the pressure response includes equally strong
$y$
direction, the pressure response includes equally strong
 $x$
directed flows, since it arises from the spatial dependence of
$x$
directed flows, since it arises from the spatial dependence of
 $\boldsymbol{{\rm\nabla}}\boldsymbol{\cdot }{\it\delta}\boldsymbol{u}_{\mathit{basic}}^{(0)}$
. The resulting
$\boldsymbol{{\rm\nabla}}\boldsymbol{\cdot }{\it\delta}\boldsymbol{u}_{\mathit{basic}}^{(0)}$
. The resulting
 $({\it\delta}\boldsymbol{u}^{(0)})_{x}$
is out of phase with
$({\it\delta}\boldsymbol{u}^{(0)})_{x}$
is out of phase with
 $\boldsymbol{b}_{0}$
, so does not contribute to an EMF itself, but it is sheared by the background flow through
$\boldsymbol{b}_{0}$
, so does not contribute to an EMF itself, but it is sheared by the background flow through
 ${\it\delta}\boldsymbol{u}_{\mathit{basic}}^{(1)}\sim -{\it\tau}_{c}\boldsymbol{u}^{(0)}\boldsymbol{\cdot }\boldsymbol{{\rm\nabla}}\boldsymbol{U}={\it\tau}_{x}Su_{x}^{(0)}\hat{\boldsymbol{y}}$
, which is shown in figure 3(b). Again, since only the
${\it\delta}\boldsymbol{u}_{\mathit{basic}}^{(1)}\sim -{\it\tau}_{c}\boldsymbol{u}^{(0)}\boldsymbol{\cdot }\boldsymbol{{\rm\nabla}}\boldsymbol{U}={\it\tau}_{x}Su_{x}^{(0)}\hat{\boldsymbol{y}}$
, which is shown in figure 3(b). Again, since only the
 $x$
component contributes,
$x$
component contributes,
 ${\it\delta}\boldsymbol{u}_{\mathit{basic}}^{(1)}$
is not divergence free (shaded yellow and red regions for
${\it\delta}\boldsymbol{u}_{\mathit{basic}}^{(1)}$
is not divergence free (shaded yellow and red regions for
 $\boldsymbol{{\rm\nabla}}\boldsymbol{\cdot }{\it\delta}\boldsymbol{u}_{\mathit{basic}}^{(1)}>0$
and
$\boldsymbol{{\rm\nabla}}\boldsymbol{\cdot }{\it\delta}\boldsymbol{u}_{\mathit{basic}}^{(1)}>0$
and
 $\boldsymbol{{\rm\nabla}}\boldsymbol{\cdot }{\it\delta}\boldsymbol{u}_{\mathit{basic}}^{(1)}<0$
respectively). We see that the
$\boldsymbol{{\rm\nabla}}\boldsymbol{\cdot }{\it\delta}\boldsymbol{u}_{\mathit{basic}}^{(1)}<0$
respectively). We see that the
 $x$
component of the pressure response towards (away from) regions where
$x$
component of the pressure response towards (away from) regions where
 $\boldsymbol{{\rm\nabla}}\boldsymbol{\cdot }{\it\delta}\boldsymbol{u}_{\mathit{basic}}^{(1)}>0$
(
$\boldsymbol{{\rm\nabla}}\boldsymbol{\cdot }{\it\delta}\boldsymbol{u}_{\mathit{basic}}^{(1)}>0$
(
 $\boldsymbol{{\rm\nabla}}\boldsymbol{\cdot }{\it\delta}\boldsymbol{u}_{\mathit{basic}}^{(1)}<0$
) is now correlated and in phase with the original perturbation. Most importantly, its direction is such that
$\boldsymbol{{\rm\nabla}}\boldsymbol{\cdot }{\it\delta}\boldsymbol{u}_{\mathit{basic}}^{(1)}<0$
) is now correlated and in phase with the original perturbation. Most importantly, its direction is such that
 $\boldsymbol{{\mathcal{E}}}={\it\delta}\boldsymbol{u}^{(1)}\times \boldsymbol{b}_{0}$
is always in the
$\boldsymbol{{\mathcal{E}}}={\it\delta}\boldsymbol{u}^{(1)}\times \boldsymbol{b}_{0}$
is always in the
 $-\hat{\boldsymbol{y}}$
direction, leading to
$-\hat{\boldsymbol{y}}$
direction, leading to
 $({\it\eta}_{yx})_{b}<0$
. Note that here, unlike in discussion of figure 2, the effect relies on the
$({\it\eta}_{yx})_{b}<0$
. Note that here, unlike in discussion of figure 2, the effect relies on the
 $x$
component of the pressure response (perpendicular to
$x$
component of the pressure response (perpendicular to
 ${\it\delta}\boldsymbol{u}_{\mathit{basic}}$
), which must occur for any perturbation that varies in
${\it\delta}\boldsymbol{u}_{\mathit{basic}}$
), which must occur for any perturbation that varies in
 $x$
because the response is the gradient of a scalar field (i.e.
$x$
because the response is the gradient of a scalar field (i.e.
 $-\boldsymbol{{\rm\nabla}}p$
).
$-\boldsymbol{{\rm\nabla}}p$
).
At this point, the reader could be forgiven for viewing the magnetic shear-current mechanism explained above with some scepticism – how do we know there are no opposing mechanisms to cancel out such effects? The simplest answer is that we have derived the physical picture in figure 3 from the SOCA calculation, by noting that
 $({\it\eta}_{yx})_{b}$
is unchanged by removal of all contributions to the velocity perturbation other than
$({\it\eta}_{yx})_{b}$
is unchanged by removal of all contributions to the velocity perturbation other than
 $\boldsymbol{{\rm\nabla}}p$
, and through the exploration of the different pathways in figure 1. More physically, the reason the pressure is necessary for the shear-current effect arises from the mean field and flow geometry. In particular, if a small-scale fluctuation interacts with either
$\boldsymbol{{\rm\nabla}}p$
, and through the exploration of the different pathways in figure 1. More physically, the reason the pressure is necessary for the shear-current effect arises from the mean field and flow geometry. In particular, if a small-scale fluctuation interacts with either
 $\boldsymbol{U}$
or
$\boldsymbol{U}$
or
 $\boldsymbol{B}$
through
$\boldsymbol{B}$
through
 $\boldsymbol{u}\boldsymbol{\cdot }\boldsymbol{{\rm\nabla}}\boldsymbol{U}$
,
$\boldsymbol{u}\boldsymbol{\cdot }\boldsymbol{{\rm\nabla}}\boldsymbol{U}$
,
 $\boldsymbol{u}\boldsymbol{\cdot }\boldsymbol{{\rm\nabla}}\boldsymbol{B}$
,
$\boldsymbol{u}\boldsymbol{\cdot }\boldsymbol{{\rm\nabla}}\boldsymbol{B}$
,
 $\boldsymbol{b}\boldsymbol{\cdot }\boldsymbol{{\rm\nabla}}\boldsymbol{U}$
or
$\boldsymbol{b}\boldsymbol{\cdot }\boldsymbol{{\rm\nabla}}\boldsymbol{U}$
or
 $\boldsymbol{b}\boldsymbol{\cdot }\boldsymbol{{\rm\nabla}}\boldsymbol{B}$
, the resulting perturbation is always in the
$\boldsymbol{b}\boldsymbol{\cdot }\boldsymbol{{\rm\nabla}}\boldsymbol{B}$
, the resulting perturbation is always in the
 $\pm \hat{\boldsymbol{y}}$
direction. Obviously, such a perturbation cannot lead to a non-zero
$\pm \hat{\boldsymbol{y}}$
direction. Obviously, such a perturbation cannot lead to a non-zero
 ${\mathcal{E}}_{y}$
. Thus,
${\mathcal{E}}_{y}$
. Thus,
 ${\it\eta}_{yx}$
is both very important for dynamo action and particularly complicated to generate, because the flow and mean field are in the same direction as the required EMF. This explains why
${\it\eta}_{yx}$
is both very important for dynamo action and particularly complicated to generate, because the flow and mean field are in the same direction as the required EMF. This explains why
 ${\it\eta}_{yx}$
is seen to be much smaller than
${\it\eta}_{yx}$
is seen to be much smaller than
 ${\it\eta}_{xy}$
in numerical simulation and calculations (Brandenburg et al.
Reference Brandenburg, Rädler, Rheinhardt and Käpylä2008a
; Singh & Sridhar Reference Singh and Sridhar2011; Paper II), as well as the capricious nature of the kinematic shear-current effect (the sign of
${\it\eta}_{xy}$
in numerical simulation and calculations (Brandenburg et al.
Reference Brandenburg, Rädler, Rheinhardt and Käpylä2008a
; Singh & Sridhar Reference Singh and Sridhar2011; Paper II), as well as the capricious nature of the kinematic shear-current effect (the sign of
 $({\it\eta}_{yx})_{u}$
may depend on the Reynolds numbers, while analytic results depend on the closure method used), for which these same arguments applyFootnote
6
. Note that the requirements for
$({\it\eta}_{yx})_{u}$
may depend on the Reynolds numbers, while analytic results depend on the closure method used), for which these same arguments applyFootnote
6
. Note that the requirements for
 ${\mathcal{E}}_{y}\neq 0$
in figure 3 are very specific – a
${\mathcal{E}}_{y}\neq 0$
in figure 3 are very specific – a
 $y$
variation of the
$y$
variation of the
 $x$
variation of
$x$
variation of
 $b_{0z}$
– and it is straightforward to see that this is the only possibility for generation of a
$b_{0z}$
– and it is straightforward to see that this is the only possibility for generation of a
 ${\it\delta}u_{x}$
in this way. This implies we can ignore both the other
${\it\delta}u_{x}$
in this way. This implies we can ignore both the other
 $\boldsymbol{b}$
components and any variation in
$\boldsymbol{b}$
components and any variation in
 $z$
. Thus, although figures 2 and 3 show the fluid response to a rather specific form for
$z$
. Thus, although figures 2 and 3 show the fluid response to a rather specific form for
 $\boldsymbol{b}_{0}$
, the important features of the resulting perturbations (shown in panel (c) in each case) are relatively generic for more general
$\boldsymbol{b}_{0}$
, the important features of the resulting perturbations (shown in panel (c) in each case) are relatively generic for more general
 $\boldsymbol{b}_{0}$
. Further, since the effect is linear, Fourier modes (such as that shown in figure 3) can be added to form a more general
$\boldsymbol{b}_{0}$
. Further, since the effect is linear, Fourier modes (such as that shown in figure 3) can be added to form a more general
 $\boldsymbol{b}$
perturbation, and we are sure to obtain
$\boldsymbol{b}$
perturbation, and we are sure to obtain
 ${\mathcal{E}}_{y}<0$
.
${\mathcal{E}}_{y}<0$
.
We have thus seen how magnetic fluctuations can produce a negative
 ${\it\eta}_{yx}$
through their interaction with large-scale field and flow gradients, which can in some cases lead to large-scale dynamo action. In addition, the reliance of the effect on the fluid pressure response, as well as the general difficulty of creating perturbations that create an EMF parallel to both the mean flow and field, help explain the relative dominance of the magnetic over the kinematic shear-current effect.
${\it\eta}_{yx}$
through their interaction with large-scale field and flow gradients, which can in some cases lead to large-scale dynamo action. In addition, the reliance of the effect on the fluid pressure response, as well as the general difficulty of creating perturbations that create an EMF parallel to both the mean flow and field, help explain the relative dominance of the magnetic over the kinematic shear-current effect.
3 Numerical evidence
In this section we illustrate numerically that the magnetic shear-current mechanism discussed above is indeed realizable in MHD turbulence. We show using direct numerical simulation that it is possible and realizable to have the small-scale dynamo drive the growth of the large-scale dynamo. So far as we are aware, this is the first demonstration of this interesting behaviour.
The methods used to illustrate this effect in numerical simulation are somewhat non-standard in the dynamo literature. In particular, at each set of physical parameters we carry out an ensemble of simulations, each with different noise realizations. We then measure transport coefficients before and after small-scale saturation in each simulation, which shows (after an ensemble average) that
 ${\it\eta}_{yx}$
becomes more negative after the saturation of the small-scale dynamo. That this can drive a coherent dynamo is illustrated by qualitative observation of the mean-field pattern, as well as solution of the mean-field equations (2.4) using the measured transport coefficients. The ensemble of simulations is required as a result of the relatively short period of large-scale dynamo growth before nonlinear saturation effects become significant. This is because the large-scale magnetic field starts its growth (when the small-scale dynamo saturates) at relatively large amplitudes, being in approximate equipartition with the small-scale fluctuations due to the finite size of the mean-field average. We shall see that in many cases, the growth of the mean field lasts little more than
${\it\eta}_{yx}$
becomes more negative after the saturation of the small-scale dynamo. That this can drive a coherent dynamo is illustrated by qualitative observation of the mean-field pattern, as well as solution of the mean-field equations (2.4) using the measured transport coefficients. The ensemble of simulations is required as a result of the relatively short period of large-scale dynamo growth before nonlinear saturation effects become significant. This is because the large-scale magnetic field starts its growth (when the small-scale dynamo saturates) at relatively large amplitudes, being in approximate equipartition with the small-scale fluctuations due to the finite size of the mean-field average. We shall see that in many cases, the growth of the mean field lasts little more than
 $20\rightarrow 30$
shearing times before saturating, and that its behaviour can vary substantially between realizations. Because of this, the ensemble average over simulations is highly advantageous for accurate determination of the transport coefficients. (In other work we have used statistical simulation to circumvent this problem, but this requires a quasi-linear approximation, which eliminates in small-scale dynamo; see Paper II).
$20\rightarrow 30$
shearing times before saturating, and that its behaviour can vary substantially between realizations. Because of this, the ensemble average over simulations is highly advantageous for accurate determination of the transport coefficients. (In other work we have used statistical simulation to circumvent this problem, but this requires a quasi-linear approximation, which eliminates in small-scale dynamo; see Paper II).
The method for measuring the transport coefficients from simulation data after small-scale dynamo saturation (termed the ‘projection method’) is also non-standard, and will be explained in some detail. Because test-field methods that explicitly include the magnetic fluctuations are rather complex and in the early stages of development (Rheinhardt & Brandenburg Reference Rheinhardt and Brandenburg2010), we instead choose to measure transport coefficients directly from mean field and EMF data taken from simulations. The method, which is a modified version of that proposed in Brandenburg & Sokoloff (Reference Brandenburg and Sokoloff2002) and is also used with some success in Racine et al. (Reference Racine, Charbonneau, Ghizaru, Bouchat and Smolarkiewicz2011) and Simard, Charbonneau & Bouchat (Reference Simard, Charbonneau and Bouchat2013), involves approximately solving
 ${\mathcal{E}}_{i}={\it\alpha}_{ij}B_{j}-{\it\eta}_{ij}J_{j}$
at each time step and taking spatio-temporal averages to obtain transport coefficients. To ensure that correct results are obtained, the projection method is checked in two independent ways: first, it is used to compute transport coefficients for low-
${\mathcal{E}}_{i}={\it\alpha}_{ij}B_{j}-{\it\eta}_{ij}J_{j}$
at each time step and taking spatio-temporal averages to obtain transport coefficients. To ensure that correct results are obtained, the projection method is checked in two independent ways: first, it is used to compute transport coefficients for low-
 $\mathit{Rm}$
kinematic shear dynamos and compared directly to the test-field method (this is presented in appendix A). Second, we solve the mean-field equations using the measured time-dependent transport coefficients and compare to the mean-field evolution from the simulations. This provides a thorough check that the measured coefficients are correct, without relying on any assumptions about the type of dynamo, or simplifications to the form of
$\mathit{Rm}$
kinematic shear dynamos and compared directly to the test-field method (this is presented in appendix A). Second, we solve the mean-field equations using the measured time-dependent transport coefficients and compare to the mean-field evolution from the simulations. This provides a thorough check that the measured coefficients are correct, without relying on any assumptions about the type of dynamo, or simplifications to the form of
 $\boldsymbol{{\mathcal{E}}}$
.
$\boldsymbol{{\mathcal{E}}}$
.
Calculations are carried out using the nonlinear MHD equations (2.1), with homogenous Cartesian geometry, periodic boundary conditions in the azimuthal (
 $y$
) and vertical (
$y$
) and vertical (
 $z$
) directions and shearing periodic boundary conditions in the radial (
$z$
) directions and shearing periodic boundary conditions in the radial (
 $x$
) direction. We use the Snoopy code (Lesur & Longaretti Reference Lesur and Longaretti2007), which applies the Fourier pseudospectral method (in the shearing frame), and system rotation is included in some simulations through a mean Coriolis force. The flow field forcing (
$x$
) direction. We use the Snoopy code (Lesur & Longaretti Reference Lesur and Longaretti2007), which applies the Fourier pseudospectral method (in the shearing frame), and system rotation is included in some simulations through a mean Coriolis force. The flow field forcing (
 ${\bf\sigma}_{\boldsymbol{u}}$
in (2.1)) is non-helical, white noise in time, isotropic and centred in wavenumber space at
${\bf\sigma}_{\boldsymbol{u}}$
in (2.1)) is non-helical, white noise in time, isotropic and centred in wavenumber space at
 $|\boldsymbol{k}|=6{\rm\pi}$
(with width
$|\boldsymbol{k}|=6{\rm\pi}$
(with width
 $6{\rm\pi}/5$
). All simulations presented here use a box of size
$6{\rm\pi}/5$
). All simulations presented here use a box of size
 $(L_{x},L_{y},L_{z})=(1,4,2)$
with a resolution of
$(L_{x},L_{y},L_{z})=(1,4,2)$
with a resolution of
 $(N_{x},N_{y},N_{z})=(64,128,128)$
, and we take
$(N_{x},N_{y},N_{z})=(64,128,128)$
, and we take
 $\bar{{\it\eta}}=1/2000$
(
$\bar{{\it\eta}}=1/2000$
(
 $\mathit{Rm}=2000$
)
$\mathit{Rm}=2000$
)
 $\mathit{Pm}=8$
(
$\mathit{Pm}=8$
(
 $\mathit{Re}=250$
). To test convergence, we have run several cases (both with and without rotation) at twice the resolution, and there is no discernible difference with lower resolution runs in either the spectrum, turbulence level or mean-field evolutionFootnote
7
.
$\mathit{Re}=250$
). To test convergence, we have run several cases (both with and without rotation) at twice the resolution, and there is no discernible difference with lower resolution runs in either the spectrum, turbulence level or mean-field evolutionFootnote
7
.
Our choice of this numerical set-up for the simulation ensembles is motivated both by the calculations of Yousef et al. (Reference Yousef, Heinemann, Rincon, Schekochihin, Kleeorin, Rogachevskii, Cowley and Mcwilliams2008a
) with unstable small-scale dynamo (see their figure 9), and from studies of magnetorotational instability (MRI) driven turbulence in the shearing boxFootnote
8
. In particular, the relatively low Reynolds numbers are chosen both for computational reasons (100 simulations are run for each parameter set), and so that there is no transition to self-sustaining turbulence if
 ${\bf\sigma}_{\boldsymbol{u}}=0$
. Thus, we choose Reynolds numbers that are intermediate between the small-scale dynamo being stable (on the low side) and the system transitioning to turbulence in the absence of noise (on the high side). While similar mechanisms may be operating in the case of self-sustaining turbulence (Lesur & Ogilvie Reference Lesur and Ogilvie2008a
,Reference Lesur and Ogilvie
b
), it is certainly a complicating influence that is more easily ignored for the purposes of this study. The relatively high
${\bf\sigma}_{\boldsymbol{u}}=0$
. Thus, we choose Reynolds numbers that are intermediate between the small-scale dynamo being stable (on the low side) and the system transitioning to turbulence in the absence of noise (on the high side). While similar mechanisms may be operating in the case of self-sustaining turbulence (Lesur & Ogilvie Reference Lesur and Ogilvie2008a
,Reference Lesur and Ogilvie
b
), it is certainly a complicating influence that is more easily ignored for the purposes of this study. The relatively high
 $\mathit{Pm}$
is chosen for the obvious reason of enhancing
$\mathit{Pm}$
is chosen for the obvious reason of enhancing
 $\boldsymbol{b}$
in comparison to
$\boldsymbol{b}$
in comparison to
 $\boldsymbol{u}$
, while still allowing for a moderate range of scales in
$\boldsymbol{u}$
, while still allowing for a moderate range of scales in
 $\boldsymbol{u}$
. It seems worth emphasizing that we do not consider these measurements to be firm proof of the magnetic shear-current effect’s importance at high
$\boldsymbol{u}$
. It seems worth emphasizing that we do not consider these measurements to be firm proof of the magnetic shear-current effect’s importance at high
 $\mathit{Rm}$
; rather, they serve as a demonstration that it is possible for the small-scale dynamo to significantly change
$\mathit{Rm}$
; rather, they serve as a demonstration that it is possible for the small-scale dynamo to significantly change
 ${\it\eta}_{yx}$
, and as motivation for further studies at higher Reynolds numbers and with different numerical set-ups.
${\it\eta}_{yx}$
, and as motivation for further studies at higher Reynolds numbers and with different numerical set-ups.
3.1 Measurement of the transport coefficients
In this section we describe the methods – the test-field method (Schrinner et al.
Reference Schrinner, Rädler, Schmitt, Rheinhardt and Christensen2005), and the projection method (based on Brandenburg & Sokoloff Reference Brandenburg and Sokoloff2002) – for obtaining the transport coefficients from simulations. Those readers who are primarily interested in results may wish to skip directly to § 3.2. Since the projection method is uncommon in the dynamo literature, its accuracy is verified in appendix A through direct comparison to test-field method calculations for low-
 $Rm$
non-helical shear dynamos over a range of
$Rm$
non-helical shear dynamos over a range of
 ${\it\eta}_{yx}$
. While the test-field method gives unambiguous answers for kinematic transport coefficients (before the small-scale dynamo saturation), results can become more difficult to interpret in the presence of magnetic fluctuations (Cattaneo & Hughes Reference Cattaneo and Hughes2009; Hubbard et al.
Reference Hubbard, Del Sordo, Käpylä and Brandenburg2009; Rheinhardt & Brandenburg Reference Rheinhardt and Brandenburg2010). In contrast, the projection method does not rely on any assumptions regarding the importance of small-scale magnetic fields, operating purely from the mean-field data from a given simulation. In addition to this method, we have also applied a weighted least squares method, fitting simulation data for a single mode (Kowal, Otmianowska-Mazur & Hanasz Reference Kowal, Otmianowska-Mazur and Hanasz2005). This has led to almost identical results for the low-
${\it\eta}_{yx}$
. While the test-field method gives unambiguous answers for kinematic transport coefficients (before the small-scale dynamo saturation), results can become more difficult to interpret in the presence of magnetic fluctuations (Cattaneo & Hughes Reference Cattaneo and Hughes2009; Hubbard et al.
Reference Hubbard, Del Sordo, Käpylä and Brandenburg2009; Rheinhardt & Brandenburg Reference Rheinhardt and Brandenburg2010). In contrast, the projection method does not rely on any assumptions regarding the importance of small-scale magnetic fields, operating purely from the mean-field data from a given simulation. In addition to this method, we have also applied a weighted least squares method, fitting simulation data for a single mode (Kowal, Otmianowska-Mazur & Hanasz Reference Kowal, Otmianowska-Mazur and Hanasz2005). This has led to almost identical results for the low-
 $\mathit{Rm}$
test cases and the main results given here. However, the least squares method was generally found to be somewhat less reliable and rather delicate, and we do not discuss the details. Another possibility for measuring transport coefficients, which could be explored for non-helical shear dynamos in future work, is given in Tobias & Cattaneo (Reference Tobias and Cattaneo2013).
$\mathit{Rm}$
test cases and the main results given here. However, the least squares method was generally found to be somewhat less reliable and rather delicate, and we do not discuss the details. Another possibility for measuring transport coefficients, which could be explored for non-helical shear dynamos in future work, is given in Tobias & Cattaneo (Reference Tobias and Cattaneo2013).
3.1.1 Test-field method
The test-field method (Schrinner et al.
Reference Schrinner, Rädler, Schmitt, Rheinhardt and Christensen2005), which is used for calculating transport coefficients before small-scale dynamo saturation, has become a standard tool in dynamo studies (Brandenburg et al.
Reference Brandenburg, Rädler, Rheinhardt and Käpylä2008a
), so we discuss this only briefly. The method involves solving for a set of
 $Q$
‘test fields’
$Q$
‘test fields’
 $\boldsymbol{b}^{q}$
(where
$\boldsymbol{b}^{q}$
(where
 $q=1\rightarrow Q$
), in addition to the standard MHD equations. The test fields satisfy the small-scale induction equation,
$q=1\rightarrow Q$
), in addition to the standard MHD equations. The test fields satisfy the small-scale induction equation,
 $$\begin{eqnarray}\partial _{t}\boldsymbol{b}^{q}=\boldsymbol{{\rm\nabla}}\times (\boldsymbol{u}\times \boldsymbol{B}^{q})+\boldsymbol{{\rm\nabla}}\times (\boldsymbol{U}\times \boldsymbol{b}^{q})+\boldsymbol{{\rm\nabla}}\times (\boldsymbol{u}\times \boldsymbol{b}^{q}-\overline{\boldsymbol{u}\times \boldsymbol{b}^{q}}\,)+\bar{{\it\eta}}{\rm\nabla}^{2}\boldsymbol{b}^{q},\end{eqnarray}$$
where
 $\boldsymbol{B}^{q}$
are a set of
$\boldsymbol{B}^{q}$
are a set of
 $Q$
test mean fields (specified at the start of the simulation), and
$Q$
test mean fields (specified at the start of the simulation), and
 $\boldsymbol{u}$
and
$\boldsymbol{u}$
and
 $\boldsymbol{U}$
are taken from the simulation. By calculating the EMF
$\boldsymbol{U}$
are taken from the simulation. By calculating the EMF
 $\boldsymbol{{\mathcal{E}}}^{q}=\overline{\boldsymbol{u}\times \boldsymbol{b}^{q}}$
that results from a variety of
$\boldsymbol{{\mathcal{E}}}^{q}=\overline{\boldsymbol{u}\times \boldsymbol{b}^{q}}$
that results from a variety of
 $\boldsymbol{B}^{q}$
, one can determine the transport coefficients. The test-field method’s simplest – and most obviously meaningful – use, is to utilize a
$\boldsymbol{B}^{q}$
, one can determine the transport coefficients. The test-field method’s simplest – and most obviously meaningful – use, is to utilize a
 $\boldsymbol{u}$
field that is unaffected by
$\boldsymbol{u}$
field that is unaffected by
 $\boldsymbol{b}$
or
$\boldsymbol{b}$
or
 $\boldsymbol{B}$
, thus calculating kinematic transport coefficientsFootnote
9
. A simple extension is the ‘quasi-kinematic’ method (Brandenburg et al.
Reference Brandenburg, Rädler, Rheinhardt and Subramanian2008b
; Hubbard et al.
Reference Hubbard, Del Sordo, Käpylä and Brandenburg2009), for which one runs an MHD simulation in which
$\boldsymbol{B}$
, thus calculating kinematic transport coefficientsFootnote
9
. A simple extension is the ‘quasi-kinematic’ method (Brandenburg et al.
Reference Brandenburg, Rädler, Rheinhardt and Subramanian2008b
; Hubbard et al.
Reference Hubbard, Del Sordo, Käpylä and Brandenburg2009), for which one runs an MHD simulation in which
 $\boldsymbol{u}$
is influenced by self-consistent magnetic fields, and extracts
$\boldsymbol{u}$
is influenced by self-consistent magnetic fields, and extracts
 $\boldsymbol{u}$
to insert into the test-field equations. This can most obviously be used to understand how the modification of
$\boldsymbol{u}$
to insert into the test-field equations. This can most obviously be used to understand how the modification of
 $\boldsymbol{u}$
by
$\boldsymbol{u}$
by
 $\boldsymbol{b}$
or
$\boldsymbol{b}$
or
 $\boldsymbol{B}$
affects the kinematic coefficients (see, for example, Gressel, Bendre & Elstner Reference Gressel, Bendre and Elstner2013), but the direct effect of
$\boldsymbol{B}$
affects the kinematic coefficients (see, for example, Gressel, Bendre & Elstner Reference Gressel, Bendre and Elstner2013), but the direct effect of
 $\boldsymbol{b}$
fluctuations is not included. A variety of subtleties exist, however, and care must be used in interpreting results; see Hubbard et al. (Reference Hubbard, Del Sordo, Käpylä and Brandenburg2009).
$\boldsymbol{b}$
fluctuations is not included. A variety of subtleties exist, however, and care must be used in interpreting results; see Hubbard et al. (Reference Hubbard, Del Sordo, Käpylä and Brandenburg2009).
3.1.2 Projection method
Inclusion of the direct effect of
 $\boldsymbol{b}$
on transport coefficients in the test-field method introduces significant complications and ambiguities, primarily because it can be difficult to ensure that the test fields
$\boldsymbol{b}$
on transport coefficients in the test-field method introduces significant complications and ambiguities, primarily because it can be difficult to ensure that the test fields
 $\boldsymbol{b}^{q}$
and
$\boldsymbol{b}^{q}$
and
 $\boldsymbol{u}^{q}$
are linear in the test mean fields. A method has been proposed and explored in Rheinhardt & Brandenburg (Reference Rheinhardt and Brandenburg2010); however, given its complications and early stage of development, we choose to use the projection method detailed below to calculate mean-field transport coefficients after small-scale dynamo saturation. This method makes no assumptions regarding the importance of small-scale magnetic fluctuations, simply utilizing mean field and EMF data extracted from standard MHD simulation.
$\boldsymbol{u}^{q}$
are linear in the test mean fields. A method has been proposed and explored in Rheinhardt & Brandenburg (Reference Rheinhardt and Brandenburg2010); however, given its complications and early stage of development, we choose to use the projection method detailed below to calculate mean-field transport coefficients after small-scale dynamo saturation. This method makes no assumptions regarding the importance of small-scale magnetic fluctuations, simply utilizing mean field and EMF data extracted from standard MHD simulation.
The starting point of the method is the standard Taylor expansion of
 $\boldsymbol{{\mathcal{E}}}$
in terms of
$\boldsymbol{{\mathcal{E}}}$
in terms of
 $\boldsymbol{B}$
. In coordinates this is (cf. (2.4)),
$\boldsymbol{B}$
. In coordinates this is (cf. (2.4)),
 $$\begin{eqnarray}\displaystyle & \displaystyle {\mathcal{E}}_{x}={\it\alpha}_{xx}B_{x}+{\it\alpha}_{xy}B_{y}-{\it\eta}_{xy}\partial _{z}B_{x}+{\it\eta}_{xx}\partial _{z}B_{y}, & \displaystyle\end{eqnarray}$$
 $$\begin{eqnarray}\displaystyle & \displaystyle {\mathcal{E}}_{y}={\it\alpha}_{yx}B_{x}+{\it\alpha}_{yy}B_{y}-{\it\eta}_{yy}\partial _{z}B_{x}+{\it\eta}_{yx}\partial _{z}B_{y}. & \displaystyle\end{eqnarray}$$
 $\boldsymbol{B}$
, since
$\boldsymbol{B}$
, since
 ${\it\alpha}_{ij}$
and
${\it\alpha}_{ij}$
and
 ${\it\eta}_{ij}$
are not assumed constant. The basic idea of the projection method, proposed in Brandenburg & Sokoloff (Reference Brandenburg and Sokoloff2002), is to extract time-series data for
${\it\eta}_{ij}$
are not assumed constant. The basic idea of the projection method, proposed in Brandenburg & Sokoloff (Reference Brandenburg and Sokoloff2002), is to extract time-series data for
 ${\mathcal{E}}_{i}$
and
${\mathcal{E}}_{i}$
and
 $B_{i}$
from nonlinear simulation, solving for the transport coefficients in (3.2) at each time point. In principle, all coefficients can be solved for directly, given
$B_{i}$
from nonlinear simulation, solving for the transport coefficients in (3.2) at each time point. In principle, all coefficients can be solved for directly, given
 $\boldsymbol{B}$
and
$\boldsymbol{B}$
and
 $\boldsymbol{{\mathcal{E}}}$
data that consists of at least 2 Fourier modes. One calculates
$\boldsymbol{{\mathcal{E}}}$
data that consists of at least 2 Fourier modes. One calculates  $$\begin{eqnarray}\unicode[STIX]{x1D640}^{(i)}=\left(\left\langle B_{x}{\mathcal{E}}_{i}\right\rangle ,\left\langle B_{y}{\mathcal{E}}_{i}\right\rangle ,\left\langle \partial _{z}B_{x}{\mathcal{E}}_{i}\right\rangle ,\left\langle \partial _{z}B_{x}{\mathcal{E}}_{i}\right\rangle \right)^{\text{T}}\end{eqnarray}$$
and the matrix
 $$\begin{eqnarray}\unicode[STIX]{x1D648}=\left(\begin{array}{@{}cccc@{}}\left\langle B_{x}B_{x}\right\rangle & \left\langle B_{x}B_{y}\right\rangle & \left\langle B_{x}\partial _{z}B_{x}\right\rangle & \left\langle B_{x}\partial _{z}B_{x}\right\rangle \\ \left\langle B_{y}B_{x}\right\rangle & \left\langle B_{y}B_{y}\right\rangle & \left\langle B_{y}\partial _{z}B_{x}\right\rangle & \left\langle B_{y}\partial _{z}B_{y}\right\rangle \\ \left\langle \partial _{z}B_{x}B_{x}\right\rangle & \left\langle \partial _{z}B_{x}B_{y}\right\rangle & \left\langle \partial _{z}B_{x}\partial _{z}B_{x}\right\rangle & \left\langle \partial _{z}B_{x}\partial _{z}B_{y}\right\rangle \\ \left\langle \partial _{z}B_{y}B_{x}\right\rangle & \left\langle \partial _{z}B_{y}B_{y}\right\rangle & \left\langle \partial _{z}B_{y}\partial _{z}B_{x}\right\rangle & \left\langle \partial _{z}B_{y}\partial _{z}B_{y}\right\rangle \end{array}\right),\end{eqnarray}$$
where
 $\langle \cdot \rangle$
here denotes an average over
$\langle \cdot \rangle$
here denotes an average over
 $z$
and possibly time (the system statistically homogenous in
$z$
and possibly time (the system statistically homogenous in
 $z$
). Then, solving
$z$
). Then, solving
 $$\begin{eqnarray}\unicode[STIX]{x1D640}^{(i)}=\unicode[STIX]{x1D648}\unicode[STIX]{x1D63E}^{(i)},\end{eqnarray}$$
for
 $C^{(1)}=({\it\alpha}_{xx},{\it\alpha}_{xy},-{\it\eta}_{xy},{\it\eta}_{xx})$
,
$C^{(1)}=({\it\alpha}_{xx},{\it\alpha}_{xy},-{\it\eta}_{xy},{\it\eta}_{xx})$
,
 $C^{(2)}=({\it\alpha}_{yx},{\it\alpha}_{yy},-{\it\eta}_{yy},{\it\eta}_{yx})$
, one obtains the full set of transport coefficients.
$C^{(2)}=({\it\alpha}_{yx},{\it\alpha}_{yy},-{\it\eta}_{yy},{\it\eta}_{yx})$
, one obtains the full set of transport coefficients.
The data for
 $\boldsymbol{{\mathcal{E}}}$
and
$\boldsymbol{{\mathcal{E}}}$
and
 $\boldsymbol{B}$
are generally quite noisy and some care is required to avoid spurious effects that lead to incorrect results. In particular, while pure white noise in each variable will average to zero over time, there are correlations between components that can significantly pollute the data. These correlations arise from the fact that (3.2) is not the only expected relationship between components of
$\boldsymbol{B}$
are generally quite noisy and some care is required to avoid spurious effects that lead to incorrect results. In particular, while pure white noise in each variable will average to zero over time, there are correlations between components that can significantly pollute the data. These correlations arise from the fact that (3.2) is not the only expected relationship between components of
 $\boldsymbol{B}$
and
$\boldsymbol{B}$
and
 $\boldsymbol{{\mathcal{E}}}$
;
$\boldsymbol{{\mathcal{E}}}$
;
 $\boldsymbol{B}$
is also directly driven by
$\boldsymbol{B}$
is also directly driven by
 $\boldsymbol{{\mathcal{E}}}$
, and itself, through
$\boldsymbol{{\mathcal{E}}}$
, and itself, through
 $$\begin{eqnarray}\partial _{t}\boldsymbol{B}=-SB_{x}\hat{\boldsymbol{y}}+\boldsymbol{{\rm\nabla}}\times \boldsymbol{{\mathcal{E}}}+\bar{{\it\eta}}{\rm\Delta}\boldsymbol{B}.\end{eqnarray}$$
From (3.6) and by examining data, it is found that the most harmful of the correlations are a correlation between
 $B_{x}$
and
$B_{x}$
and
 $B_{y}$
(as expected due to
$B_{y}$
(as expected due to
 $-SB_{x}$
in (3.6)) and a correlation between fluctuations in
$-SB_{x}$
in (3.6)) and a correlation between fluctuations in
 ${\mathcal{E}}_{y}$
and
${\mathcal{E}}_{y}$
and
 $B_{x}$
(
$B_{x}$
(
 $B_{x}$
is directly driven by
$B_{x}$
is directly driven by
 $\partial _{z}{\mathcal{E}}_{y}$
)Footnote
10
. Note that this correlation of
$\partial _{z}{\mathcal{E}}_{y}$
)Footnote
10
. Note that this correlation of
 ${\mathcal{E}}_{y}$
and
${\mathcal{E}}_{y}$
and
 $B_{x}$
is not the same as a non-zero
$B_{x}$
is not the same as a non-zero
 ${\it\alpha}_{yx}$
or
${\it\alpha}_{yx}$
or
 ${\it\eta}_{yy}$
coefficient. Specifically, a noisy change in the imaginary part of
${\it\eta}_{yy}$
coefficient. Specifically, a noisy change in the imaginary part of
 ${\mathcal{E}}_{y}$
by
${\mathcal{E}}_{y}$
by
 ${\it\epsilon}$
will cause a change in
${\it\epsilon}$
will cause a change in
 $B_{x}$
of
$B_{x}$
of
 ${\sim}k{\it\epsilon}{\rm\Delta}t$
after some time
${\sim}k{\it\epsilon}{\rm\Delta}t$
after some time
 ${\rm\Delta}t$
(related to the correlation time of the
${\rm\Delta}t$
(related to the correlation time of the
 ${\mathcal{E}}_{y}$
noise). If the noise fluctuations are of similar or larger magnitude than the range of
${\mathcal{E}}_{y}$
noise). If the noise fluctuations are of similar or larger magnitude than the range of
 $B_{x}$
and
$B_{x}$
and
 ${\mathcal{E}}_{y}$
explored over the course of the calculation, this correlation can cause a negative value for the fit parameter
${\mathcal{E}}_{y}$
explored over the course of the calculation, this correlation can cause a negative value for the fit parameter
 ${\it\eta}_{yy}$
, since the scatter of the data has a preferred slope. In fact, a consistently negative calculated value for
${\it\eta}_{yy}$
, since the scatter of the data has a preferred slope. In fact, a consistently negative calculated value for
 ${\it\eta}_{yy}$
is the most prominent spurious effect in simulations, which was also noted in Brandenburg & Sokoloff (Reference Brandenburg and Sokoloff2002) without explanation. That this is purely a consequence of the projection method, and not physical, can be established by comparison to test-field calculations (see appendix A). Importantly, the value of
${\it\eta}_{yy}$
is the most prominent spurious effect in simulations, which was also noted in Brandenburg & Sokoloff (Reference Brandenburg and Sokoloff2002) without explanation. That this is purely a consequence of the projection method, and not physical, can be established by comparison to test-field calculations (see appendix A). Importantly, the value of
 ${\it\eta}_{yy}$
is coupled to that of
${\it\eta}_{yy}$
is coupled to that of
 ${\it\alpha}_{iy}$
and
${\it\alpha}_{iy}$
and
 ${\it\eta}_{yx}$
. This implies one cannot simply ignore this effect and settle with not knowing
${\it\eta}_{yx}$
. This implies one cannot simply ignore this effect and settle with not knowing
 ${\it\eta}_{yy}$
, since the average values of other coefficients will also become polluted.
${\it\eta}_{yy}$
, since the average values of other coefficients will also become polluted.
The basic approach to overcoming these issues described above is to minimize the influence of
 $B_{x}$
on the calculation, to the extent possible. This is motivated by the fact that
$B_{x}$
on the calculation, to the extent possible. This is motivated by the fact that
 $B_{x}$
is very noisy in comparison to
$B_{x}$
is very noisy in comparison to
 $B_{y}$
, and is involved in both of the aforementioned damaging correlations. The approach works very well for shear dynamos because
$B_{y}$
, and is involved in both of the aforementioned damaging correlations. The approach works very well for shear dynamos because
 $B_{x}$
is much smaller than
$B_{x}$
is much smaller than
 $B_{y}$
(e.g. in the simulations presented in this work,
$B_{y}$
(e.g. in the simulations presented in this work,
 $B_{x}$
is usually between 25 and 150 times smaller than
$B_{x}$
is usually between 25 and 150 times smaller than
 $B_{y}$
depending on the realization). In addition, those transport coefficients that require
$B_{y}$
depending on the realization). In addition, those transport coefficients that require
 $B_{x}$
for their calculation (e.g.
$B_{x}$
for their calculation (e.g.
 ${\it\eta}_{xy}$
) are substantially less interesting, since they do not significantly affect the dynamo growth rate. To enable this reduction in the influence of
${\it\eta}_{xy}$
) are substantially less interesting, since they do not significantly affect the dynamo growth rate. To enable this reduction in the influence of
 $B_{x}$
, two approximations are made to (3.2). The first and most important is to assume that diagonal transport coefficients are equal,
$B_{x}$
, two approximations are made to (3.2). The first and most important is to assume that diagonal transport coefficients are equal,
 ${\it\eta}_{yy}={\it\eta}_{xx}$
and
${\it\eta}_{yy}={\it\eta}_{xx}$
and
 ${\it\alpha}_{yy}={\it\alpha}_{xx}$
. This is not strictly required by the symmetries of the turbulence with shear (Rädler & Stepanov Reference Rädler and Stepanov2006; Paper III), but a variety of test-field calculations, including those after saturation of the small-scale dynamo (i.e. quasi-kinematic calculations; see Hubbard et al.
Reference Hubbard, Del Sordo, Käpylä and Brandenburg2009; Gressel Reference Gressel2010; Gressel & Pessah Reference Gressel and Pessah2015), have shown this to be the case to a high degree of accuracy. The second approximation is to neglect
${\it\alpha}_{yy}={\it\alpha}_{xx}$
. This is not strictly required by the symmetries of the turbulence with shear (Rädler & Stepanov Reference Rädler and Stepanov2006; Paper III), but a variety of test-field calculations, including those after saturation of the small-scale dynamo (i.e. quasi-kinematic calculations; see Hubbard et al.
Reference Hubbard, Del Sordo, Käpylä and Brandenburg2009; Gressel Reference Gressel2010; Gressel & Pessah Reference Gressel and Pessah2015), have shown this to be the case to a high degree of accuracy. The second approximation is to neglect
 ${\it\eta}_{xy}$
and
${\it\eta}_{xy}$
and
 ${\it\alpha}_{yx}$
. This is justified by the fact that
${\it\alpha}_{yx}$
. This is justified by the fact that
 $B_{x}\ll B_{y}$
and
$B_{x}\ll B_{y}$
and
 ${\it\eta}_{xy}<{\it\eta}_{xx}$
on average, thus its effect on the mean value of
${\it\eta}_{xy}<{\it\eta}_{xx}$
on average, thus its effect on the mean value of
 ${\it\eta}_{xx}$
should be very small. This approximation is not strictly necessary and similar results can be obtained with
${\it\eta}_{xx}$
should be very small. This approximation is not strictly necessary and similar results can be obtained with
 ${\it\eta}_{xy}$
and
${\it\eta}_{xy}$
and
 ${\it\alpha}_{yx}$
included; however, these coefficients fluctuate wildly in time (far more than
${\it\alpha}_{yx}$
included; however, these coefficients fluctuate wildly in time (far more than
 ${\it\eta}_{xx}$
for example) and cause increased fluctuations in the values of the other transport coefficients.
${\it\eta}_{xx}$
for example) and cause increased fluctuations in the values of the other transport coefficients.
It is useful to briefly consider the proportional error in
 ${\it\eta}_{xx}$
and
${\it\eta}_{xx}$
and
 ${\it\eta}_{yx}$
that might arise from these approximations. First, in considering the neglect of
${\it\eta}_{yx}$
that might arise from these approximations. First, in considering the neglect of
 ${\it\eta}_{xy}$
, one starts with the conservative estimate
${\it\eta}_{xy}$
, one starts with the conservative estimate
 $25B_{x}\approx B_{y}$
. Noting that test-field calculations give
$25B_{x}\approx B_{y}$
. Noting that test-field calculations give
 ${\it\eta}_{xy}\sim 0.25{\it\eta}_{xx}$
for the simulations given in the manuscript (see also Brandenburg et al.
Reference Brandenburg, Rädler, Rheinhardt and Käpylä2008a
), we see that this approximation should cause less than a
${\it\eta}_{xy}\sim 0.25{\it\eta}_{xx}$
for the simulations given in the manuscript (see also Brandenburg et al.
Reference Brandenburg, Rädler, Rheinhardt and Käpylä2008a
), we see that this approximation should cause less than a
 $1\,\%$
systematic error in
$1\,\%$
systematic error in
 ${\it\eta}_{xx}$
. Second, since we are primarily interested in determining
${\it\eta}_{xx}$
. Second, since we are primarily interested in determining
 ${\it\eta}_{yx}$
, let us consider the error in
${\it\eta}_{yx}$
, let us consider the error in
 ${\it\eta}_{yx}$
that results from an error in
${\it\eta}_{yx}$
that results from an error in
 ${\it\eta}_{yy}$
(caused by either the neglect of
${\it\eta}_{yy}$
(caused by either the neglect of
 ${\it\eta}_{xy}$
or the assumption
${\it\eta}_{xy}$
or the assumption
 ${\it\eta}_{xx}={\it\eta}_{yy}$
). Noting that
${\it\eta}_{xx}={\it\eta}_{yy}$
). Noting that
 $B_{x}\sim -k\sqrt{{\it\eta}_{yx}/S}B_{y}$
for a coherent shear dynamo, we can estimate that
$B_{x}\sim -k\sqrt{{\it\eta}_{yx}/S}B_{y}$
for a coherent shear dynamo, we can estimate that
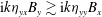 $\text{i}k{\it\eta}_{yx}B_{y}\gtrsim \text{i}k{\it\eta}_{yy}B_{x}$
when
$\text{i}k{\it\eta}_{yx}B_{y}\gtrsim \text{i}k{\it\eta}_{yy}B_{x}$
when
 $k{\it\eta}_{yy}\lesssim \sqrt{|S{\it\eta}_{yx}|}$
. This inequality is satisfied if the coherent dynamo has a positive growth rate; thus, very approximately, at marginality one would expect the proportional errors in
$k{\it\eta}_{yy}\lesssim \sqrt{|S{\it\eta}_{yx}|}$
. This inequality is satisfied if the coherent dynamo has a positive growth rate; thus, very approximately, at marginality one would expect the proportional errors in
 ${\it\eta}_{yx}$
and
${\it\eta}_{yx}$
and
 ${\it\eta}_{yy}$
to be similar. Combining these two conclusions, one should expect the two approximations to cause very little systematic error in the determination of
${\it\eta}_{yy}$
to be similar. Combining these two conclusions, one should expect the two approximations to cause very little systematic error in the determination of
 ${\it\eta}_{yx}$
, despite the coefficient’s small values.
${\it\eta}_{yx}$
, despite the coefficient’s small values.
To summarize the previous paragraphs, we shall fit
 $$\begin{eqnarray}\displaystyle & \displaystyle {\mathcal{E}}_{x}={\it\alpha}_{yy}B_{x}+{\it\alpha}_{xy}B_{y}+{\it\eta}_{xx}\partial _{z}B_{y}, & \displaystyle\end{eqnarray}$$
 $$\begin{eqnarray}\displaystyle & \displaystyle {\mathcal{E}}_{y}={\it\alpha}_{yy}B_{y}-{\it\eta}_{xx}\partial _{z}B_{x}+{\it\eta}_{yx}\partial _{z}B_{y}, & \displaystyle\end{eqnarray}$$
 $\unicode[STIX]{x1D640}^{(i)}$
, the matrix equations are solved in the least squares sense. One final difference from the method as utilized in Brandenburg & Sokoloff (Reference Brandenburg and Sokoloff2002) is a filtering of the data to include only the first two Fourier modes. This is done to improve scale separation, since the small scales of the mean field will be dominated by fluctuations due to the finite size of the horizontal average, and cannot be expected to conform to the ansatz in (3.2)Footnote
11
.
$\unicode[STIX]{x1D640}^{(i)}$
, the matrix equations are solved in the least squares sense. One final difference from the method as utilized in Brandenburg & Sokoloff (Reference Brandenburg and Sokoloff2002) is a filtering of the data to include only the first two Fourier modes. This is done to improve scale separation, since the small scales of the mean field will be dominated by fluctuations due to the finite size of the horizontal average, and cannot be expected to conform to the ansatz in (3.2)Footnote
11
.
Finally, we note that
 ${\it\alpha}$
coefficients can be excluded from these calculations altogether, and since their average over long times vanishes, this does not affect the results for
${\it\alpha}$
coefficients can be excluded from these calculations altogether, and since their average over long times vanishes, this does not affect the results for
 ${\it\eta}_{ij}$
. We have chosen to permit non-zero
${\it\eta}_{ij}$
. We have chosen to permit non-zero
 ${\it\alpha}$
in all calculations presented below, both as a consistency check and because over shorter time windows
${\it\alpha}$
in all calculations presented below, both as a consistency check and because over shorter time windows
 ${\it\alpha}$
may not average to exactly zero. Nonetheless, repeating all calculations presented below and in appendix A with
${\it\alpha}$
may not average to exactly zero. Nonetheless, repeating all calculations presented below and in appendix A with
 ${\it\alpha}_{ij}=0$
imposed artificially, one obtains the same results (to within the margin of error). This illustrates that in the neglect of transport coefficients considered above (e.g.
${\it\alpha}_{ij}=0$
imposed artificially, one obtains the same results (to within the margin of error). This illustrates that in the neglect of transport coefficients considered above (e.g.
 ${\it\alpha}_{yx}$
), it is only necessary to consider the errors arising from neglect of
${\it\alpha}_{yx}$
), it is only necessary to consider the errors arising from neglect of
 ${\it\eta}$
coefficients, since those due to neglect of
${\it\eta}$
coefficients, since those due to neglect of
 ${\it\alpha}$
coefficients average to zero.
${\it\alpha}$
coefficients average to zero.
3.1.3 Verification
To ensure the accuracy of results – especially with regards to possible systematic errors – it is crucial to verify the projection method. We do this with two independent approaches. First, in appendix A, the projection method is used to calculate kinematic transport coefficients for low-
 $\mathit{Rm}$
non-helical shear dynamos, allowing a direct comparison to the kinematic test-field method. The study is carried out for dynamos with a range of positive and negative
$\mathit{Rm}$
non-helical shear dynamos, allowing a direct comparison to the kinematic test-field method. The study is carried out for dynamos with a range of positive and negative
 ${\it\eta}_{yx}$
by changing the rotation (see Paper II), and is in a regime where the stochastic-
${\it\eta}_{yx}$
by changing the rotation (see Paper II), and is in a regime where the stochastic-
 ${\it\alpha}$
effect is significant. This ensures that the projection method does not inadvertently capture a property of the dynamo growth rate, rather than the coherent transport coefficients. Second, we verify the calculated transport coefficients are correct a posteriori for the main simulation results (§ 3.2). This is done by solving the mean-field equations (2.4) using the time-dependent transport coefficients
${\it\alpha}$
effect is significant. This ensures that the projection method does not inadvertently capture a property of the dynamo growth rate, rather than the coherent transport coefficients. Second, we verify the calculated transport coefficients are correct a posteriori for the main simulation results (§ 3.2). This is done by solving the mean-field equations (2.4) using the time-dependent transport coefficients
 ${\it\alpha}_{ij}(t)$
and
${\it\alpha}_{ij}(t)$
and
 ${\it\eta}_{ij}(t)$
calculated with the projection method. Comparison with the mean-field evolution taken directly from the simulation provides a thorough check that the transport coefficients are being calculated correctly, without relying on assumptions about the nature of the dynamo (aside from the mean-field ansatz), or the importance of approximations made to the form of the EMF (i.e. (3.7)).
${\it\eta}_{ij}(t)$
calculated with the projection method. Comparison with the mean-field evolution taken directly from the simulation provides a thorough check that the transport coefficients are being calculated correctly, without relying on assumptions about the nature of the dynamo (aside from the mean-field ansatz), or the importance of approximations made to the form of the EMF (i.e. (3.7)).
(a) Time development of the average mean-field energy
 $E_{B}=L_{z}^{-1}\int \,\text{d}z\,\boldsymbol{B}^{2}$
for the rotating simulation set. Each faded colour curve illustrates a single realization, while the thick black curve shows the mean over all realizations. The dotted vertical lines indicate the saturation of the small-scale dynamo and the nonlinear saturation of the large-scale dynamo (the projection method is applied between these), while the dashed line is simply an approximate fit to the large-scale dynamo growth phase. (b) Shell-averaged turbulent spectra (of
$E_{B}=L_{z}^{-1}\int \,\text{d}z\,\boldsymbol{B}^{2}$
for the rotating simulation set. Each faded colour curve illustrates a single realization, while the thick black curve shows the mean over all realizations. The dotted vertical lines indicate the saturation of the small-scale dynamo and the nonlinear saturation of the large-scale dynamo (the projection method is applied between these), while the dashed line is simply an approximate fit to the large-scale dynamo growth phase. (b) Shell-averaged turbulent spectra (of
 $\boldsymbol{B}_{T}$
and
$\boldsymbol{B}_{T}$
and
 $\boldsymbol{U}_{T}$
) for the rotating simulations shown in (a). The coloured lines (from blue to yellow) illustrate the growth of the magnetic spectrum in time (averaged over all simulations), with the spectra at
$\boldsymbol{U}_{T}$
) for the rotating simulations shown in (a). The coloured lines (from blue to yellow) illustrate the growth of the magnetic spectrum in time (averaged over all simulations), with the spectra at
 $t=50$
,
$t=50$
,
 $t=100$
and
$t=100$
and
 $t=150$
highlighted by thicker lines. The solid black line illustrates the velocity spectrum (peaked at
$t=150$
highlighted by thicker lines. The solid black line illustrates the velocity spectrum (peaked at
 $k\approx 6{\rm\pi}$
), while the dashed line shows the magnetic spectrum from an identical simulation, but without velocity shear (
$k\approx 6{\rm\pi}$
), while the dashed line shows the magnetic spectrum from an identical simulation, but without velocity shear (
 $S=0$
), and averaged in time from
$S=0$
), and averaged in time from
 $t=50$
to
$t=50$
to
 $t=150$
. Evidently, as also seen in Yousef et al. (Reference Yousef, Heinemann, Rincon, Schekochihin, Kleeorin, Rogachevskii, Cowley and Mcwilliams2008a
), the second period of large-scale field growth is absent when
$t=150$
. Evidently, as also seen in Yousef et al. (Reference Yousef, Heinemann, Rincon, Schekochihin, Kleeorin, Rogachevskii, Cowley and Mcwilliams2008a
), the second period of large-scale field growth is absent when
 $S=0$
(note that the velocity spectrum is essentially identical to the case with velocity shear). The dotted line simply illustrates a
$S=0$
(note that the velocity spectrum is essentially identical to the case with velocity shear). The dotted line simply illustrates a
 $k^{-5/3}$
spectrum for the sake of clarity. The slight bump in the spectrum at high
$k^{-5/3}$
spectrum for the sake of clarity. The slight bump in the spectrum at high
 $k$
is caused by spectral reflection from the grid cutoff; however, since this is well into the exponential fall off and at very low energy we are confident that this does not affect large-scale evolution (note that the spectrum in the few double resolution simulations is essentially identical, aside, at and above the bump itself).
$k$
is caused by spectral reflection from the grid cutoff; however, since this is well into the exponential fall off and at very low energy we are confident that this does not affect large-scale evolution (note that the spectrum in the few double resolution simulations is essentially identical, aside, at and above the bump itself).

3.2 Numerical results – the magnetically driven dynamo
In this section, we show that small-scale fields arising self-consistently through the small-scale dynamo can drive a coherent large-scale dynamo. To this end, we apply the methods discussed in the previous section to calculate transport coefficients before and after the saturation of the small-scale dynamo. The technique is applied to ensembles of 100 simulations, both with and without Keplerian rotation.
Example spatio-temporal
 $B_{y}$
evolutions for (a,b) non-rotating (
$B_{y}$
evolutions for (a,b) non-rotating (
 ${\it\Omega}=0$
), and (c,d) Keplerian rotating (
${\it\Omega}=0$
), and (c,d) Keplerian rotating (
 ${\it\Omega}=2/3$
) driven turbulence (parameters described in the text). The first examples in each case (a,c) show
${\it\Omega}=2/3$
) driven turbulence (parameters described in the text). The first examples in each case (a,c) show
 $B_{y}$
when a coherent dynamo develops, while the second examples (b,d) illustrate the case when it is more incoherent. The main factors in distinguishing these are the coherency in phase of
$B_{y}$
when a coherent dynamo develops, while the second examples (b,d) illustrate the case when it is more incoherent. The main factors in distinguishing these are the coherency in phase of
 $B_{y}$
over some time period and the amplitude at saturation, which is larger in the coherent cases. In general the rotating simulations are substantially more coherent. The hatched area illustrates the region of small-scale dynamo growth. The projection method used to compute transport coefficients (see figure 6) is applied between the dashed lines (
$B_{y}$
over some time period and the amplitude at saturation, which is larger in the coherent cases. In general the rotating simulations are substantially more coherent. The hatched area illustrates the region of small-scale dynamo growth. The projection method used to compute transport coefficients (see figure 6) is applied between the dashed lines (
 $t=50\rightarrow 100$
).
$t=50\rightarrow 100$
).

Before continuing, we demonstrate that there is indeed a large-scale dynamo that develops after saturation of the small-scale dynamo. This is shown both in figure 4, which gives the time development of the mean-field energy and turbulent spectra, and in figure 5, which illustrates the spatio-temporal evolution of
 $B_{y}(z,t)$
in several example realizations. From figure 4, we clearly see the fast growth of the small-scale dynamo until its saturation at
$B_{y}(z,t)$
in several example realizations. From figure 4, we clearly see the fast growth of the small-scale dynamo until its saturation at
 $t\approx 50$
. (This is observable in figure 4(a), which shows only the mean field, because
$t\approx 50$
. (This is observable in figure 4(a), which shows only the mean field, because
 $\boldsymbol{B}$
is in approximate equipartition with the small scales due to the finite domain.) Following this there is a slower period of growth in only the largest scales of the box (this is
$\boldsymbol{B}$
is in approximate equipartition with the small scales due to the finite domain.) Following this there is a slower period of growth in only the largest scales of the box (this is
 $k_{1z}={\rm\pi}$
, a factor of six less than the forcing scale), with this saturating around
$k_{1z}={\rm\pi}$
, a factor of six less than the forcing scale), with this saturating around
 $t=100$
on average. Importantly, this second period of slower growth in the mean field is not present without the mean shear (see figure 4(b), dashed line), despite the velocity spectrum being essentially identical. This illustrates that the shear causes large-scale field generation after saturation, as also noted in Yousef et al. (Reference Yousef, Heinemann, Rincon, Schekochihin, Kleeorin, Rogachevskii, Cowley and Mcwilliams2008a
),
$t=100$
on average. Importantly, this second period of slower growth in the mean field is not present without the mean shear (see figure 4(b), dashed line), despite the velocity spectrum being essentially identical. This illustrates that the shear causes large-scale field generation after saturation, as also noted in Yousef et al. (Reference Yousef, Heinemann, Rincon, Schekochihin, Kleeorin, Rogachevskii, Cowley and Mcwilliams2008a
),
As shown in figures 4(a) and 5, at these parameters, the prevalence of a coherent large-scale dynamo after saturation of the small-scale dynamo varies significantly between realizations. Specifically, it appears that the coherent effect cannot always overcome fluctuations in
 $\boldsymbol{{\mathcal{E}}}$
immediately after small-scale saturation, although the dynamo always develops after a sufficiently long time (e.g. figure 5(d) near
$\boldsymbol{{\mathcal{E}}}$
immediately after small-scale saturation, although the dynamo always develops after a sufficiently long time (e.g. figure 5(d) near
 $t=150$
). This behaviour seems generic when the coherent dynamo is close to its threshold for excitation, and similar structures were observed at lower
$t=150$
). This behaviour seems generic when the coherent dynamo is close to its threshold for excitation, and similar structures were observed at lower
 $Rm$
in Paper II, where forcing in the induction equation was used to create an homogeneous bath of magnetic fluctuations. Nonetheless, despite this variability in the dynamo’s qualitative behaviour, measurement of the transport coefficients over the ensemble of simulations illustrates a significant decrease in
$Rm$
in Paper II, where forcing in the induction equation was used to create an homogeneous bath of magnetic fluctuations. Nonetheless, despite this variability in the dynamo’s qualitative behaviour, measurement of the transport coefficients over the ensemble of simulations illustrates a significant decrease in
 ${\it\eta}_{yx}$
after the magnetic fluctuations reach approximate equipartition with velocity fluctuations at small scales.
${\it\eta}_{yx}$
after the magnetic fluctuations reach approximate equipartition with velocity fluctuations at small scales.
At low times, before
 $t\approx 50$
, the kinematic
$t\approx 50$
, the kinematic
 ${\it\alpha}$
and
${\it\alpha}$
and
 ${\it\eta}$
are measured using the test-field method, fixing the mean field and calculating
${\it\eta}$
are measured using the test-field method, fixing the mean field and calculating
 $\boldsymbol{{\mathcal{E}}}$
, with no Lorentz force (Brandenburg & Subramanian Reference Brandenburg and Subramanian2005; Brandenburg et al.
Reference Brandenburg, Rädler, Rheinhardt and Käpylä2008a
). Calculations are run from
$\boldsymbol{{\mathcal{E}}}$
, with no Lorentz force (Brandenburg & Subramanian Reference Brandenburg and Subramanian2005; Brandenburg et al.
Reference Brandenburg, Rädler, Rheinhardt and Käpylä2008a
). Calculations are run from
 $t=0\rightarrow 2000$
with the errors estimated through the standard deviation of the mean over 100 segments. Since the small-scale dynamo grows quickly, test fields are reset every
$t=0\rightarrow 2000$
with the errors estimated through the standard deviation of the mean over 100 segments. Since the small-scale dynamo grows quickly, test fields are reset every
 $t=5$
. After small-scale saturation, we utilize the projection method (§ 3.1) to measure coefficients directly from the observed mean field and EMF evolutionFootnote
12
. The time window of these measurements has been limited to
$t=5$
. After small-scale saturation, we utilize the projection method (§ 3.1) to measure coefficients directly from the observed mean field and EMF evolutionFootnote
12
. The time window of these measurements has been limited to
 $t=50\rightarrow 100$
, since growth is seen to stop at
$t=50\rightarrow 100$
, since growth is seen to stop at
 $t\approx 100$
in many realizations (see figures 4 and 5
a,c). Since this saturation presumably occurs due to a nonlinear change in the transport coefficients at large
$t\approx 100$
in many realizations (see figures 4 and 5
a,c). Since this saturation presumably occurs due to a nonlinear change in the transport coefficients at large
 $\boldsymbol{B}$
(e.g. a change in sign of
$\boldsymbol{B}$
(e.g. a change in sign of
 ${\it\eta}_{yx}$
), it is important to not include this saturation phase in the measurement of
${\it\eta}_{yx}$
), it is important to not include this saturation phase in the measurement of
 ${\it\eta}_{yx}$
. As should be expected from figure 5 and due to the short time window, measurements of the transport coefficients after small-scale saturation vary significantly between realization. Nonetheless, an average over the ensemble illustrates a statistically significant change in
${\it\eta}_{yx}$
. As should be expected from figure 5 and due to the short time window, measurements of the transport coefficients after small-scale saturation vary significantly between realization. Nonetheless, an average over the ensemble illustrates a statistically significant change in
 ${\it\eta}_{yx}$
that is consistent with observed behaviour, in both the rotating and non-rotating simulation ensembles.
${\it\eta}_{yx}$
that is consistent with observed behaviour, in both the rotating and non-rotating simulation ensembles.
Measurements of the turbulent transport coefficients for 100 realizations of the simulations in figure 5; (a)
 ${\it\eta}_{xx}$
coefficients, no rotation, (b)
${\it\eta}_{xx}$
coefficients, no rotation, (b)
 ${\it\eta}_{yx}$
coefficients, no rotation, (c)
${\it\eta}_{yx}$
coefficients, no rotation, (c)
 ${\it\eta}_{xx}$
coefficients, rotating, (d)
${\it\eta}_{xx}$
coefficients, rotating, (d)
 ${\it\eta}_{yx}$
coefficients, rotating. Unfilled markers in each plot (circles and squares for non-rotating and rotating runs respectively) show coefficients measured from each of the individual realizations, with mean values displayed by solid markers and the shaded regions indicating error in the mean (2 standard deviations). Black markers illustrate the kinematic transport coefficients, with grey shaded regions indicating the error. After saturation of the small-scale dynamo,
${\it\eta}_{yx}$
coefficients, rotating. Unfilled markers in each plot (circles and squares for non-rotating and rotating runs respectively) show coefficients measured from each of the individual realizations, with mean values displayed by solid markers and the shaded regions indicating error in the mean (2 standard deviations). Black markers illustrate the kinematic transport coefficients, with grey shaded regions indicating the error. After saturation of the small-scale dynamo,
 ${\it\eta}_{ij}$
is calculated using the projection method, taking the mean from
${\it\eta}_{ij}$
is calculated using the projection method, taking the mean from
 $t=50$
to
$t=50$
to
 $t=100$
. This limited time window is chosen to avoid capturing the saturation phase of the large-scale dynamo, since
$t=100$
. This limited time window is chosen to avoid capturing the saturation phase of the large-scale dynamo, since
 ${\it\eta}_{ij}$
is presumably modified in this phase. In both methods used to compute transport coefficients, the corresponding
${\it\eta}_{ij}$
is presumably modified in this phase. In both methods used to compute transport coefficients, the corresponding
 ${\it\alpha}$
coefficients are also calculated. In all cases these are zero to within error as expected, and the scatter between simulations is of a similar magnitude to that of
${\it\alpha}$
coefficients are also calculated. In all cases these are zero to within error as expected, and the scatter between simulations is of a similar magnitude to that of
 ${\it\eta}_{ij}$
if their different units are accounted for (it is necessary to divide
${\it\eta}_{ij}$
if their different units are accounted for (it is necessary to divide
 ${\it\alpha}$
by a characteristic
${\it\alpha}$
by a characteristic
 $k$
value).
$k$
value).
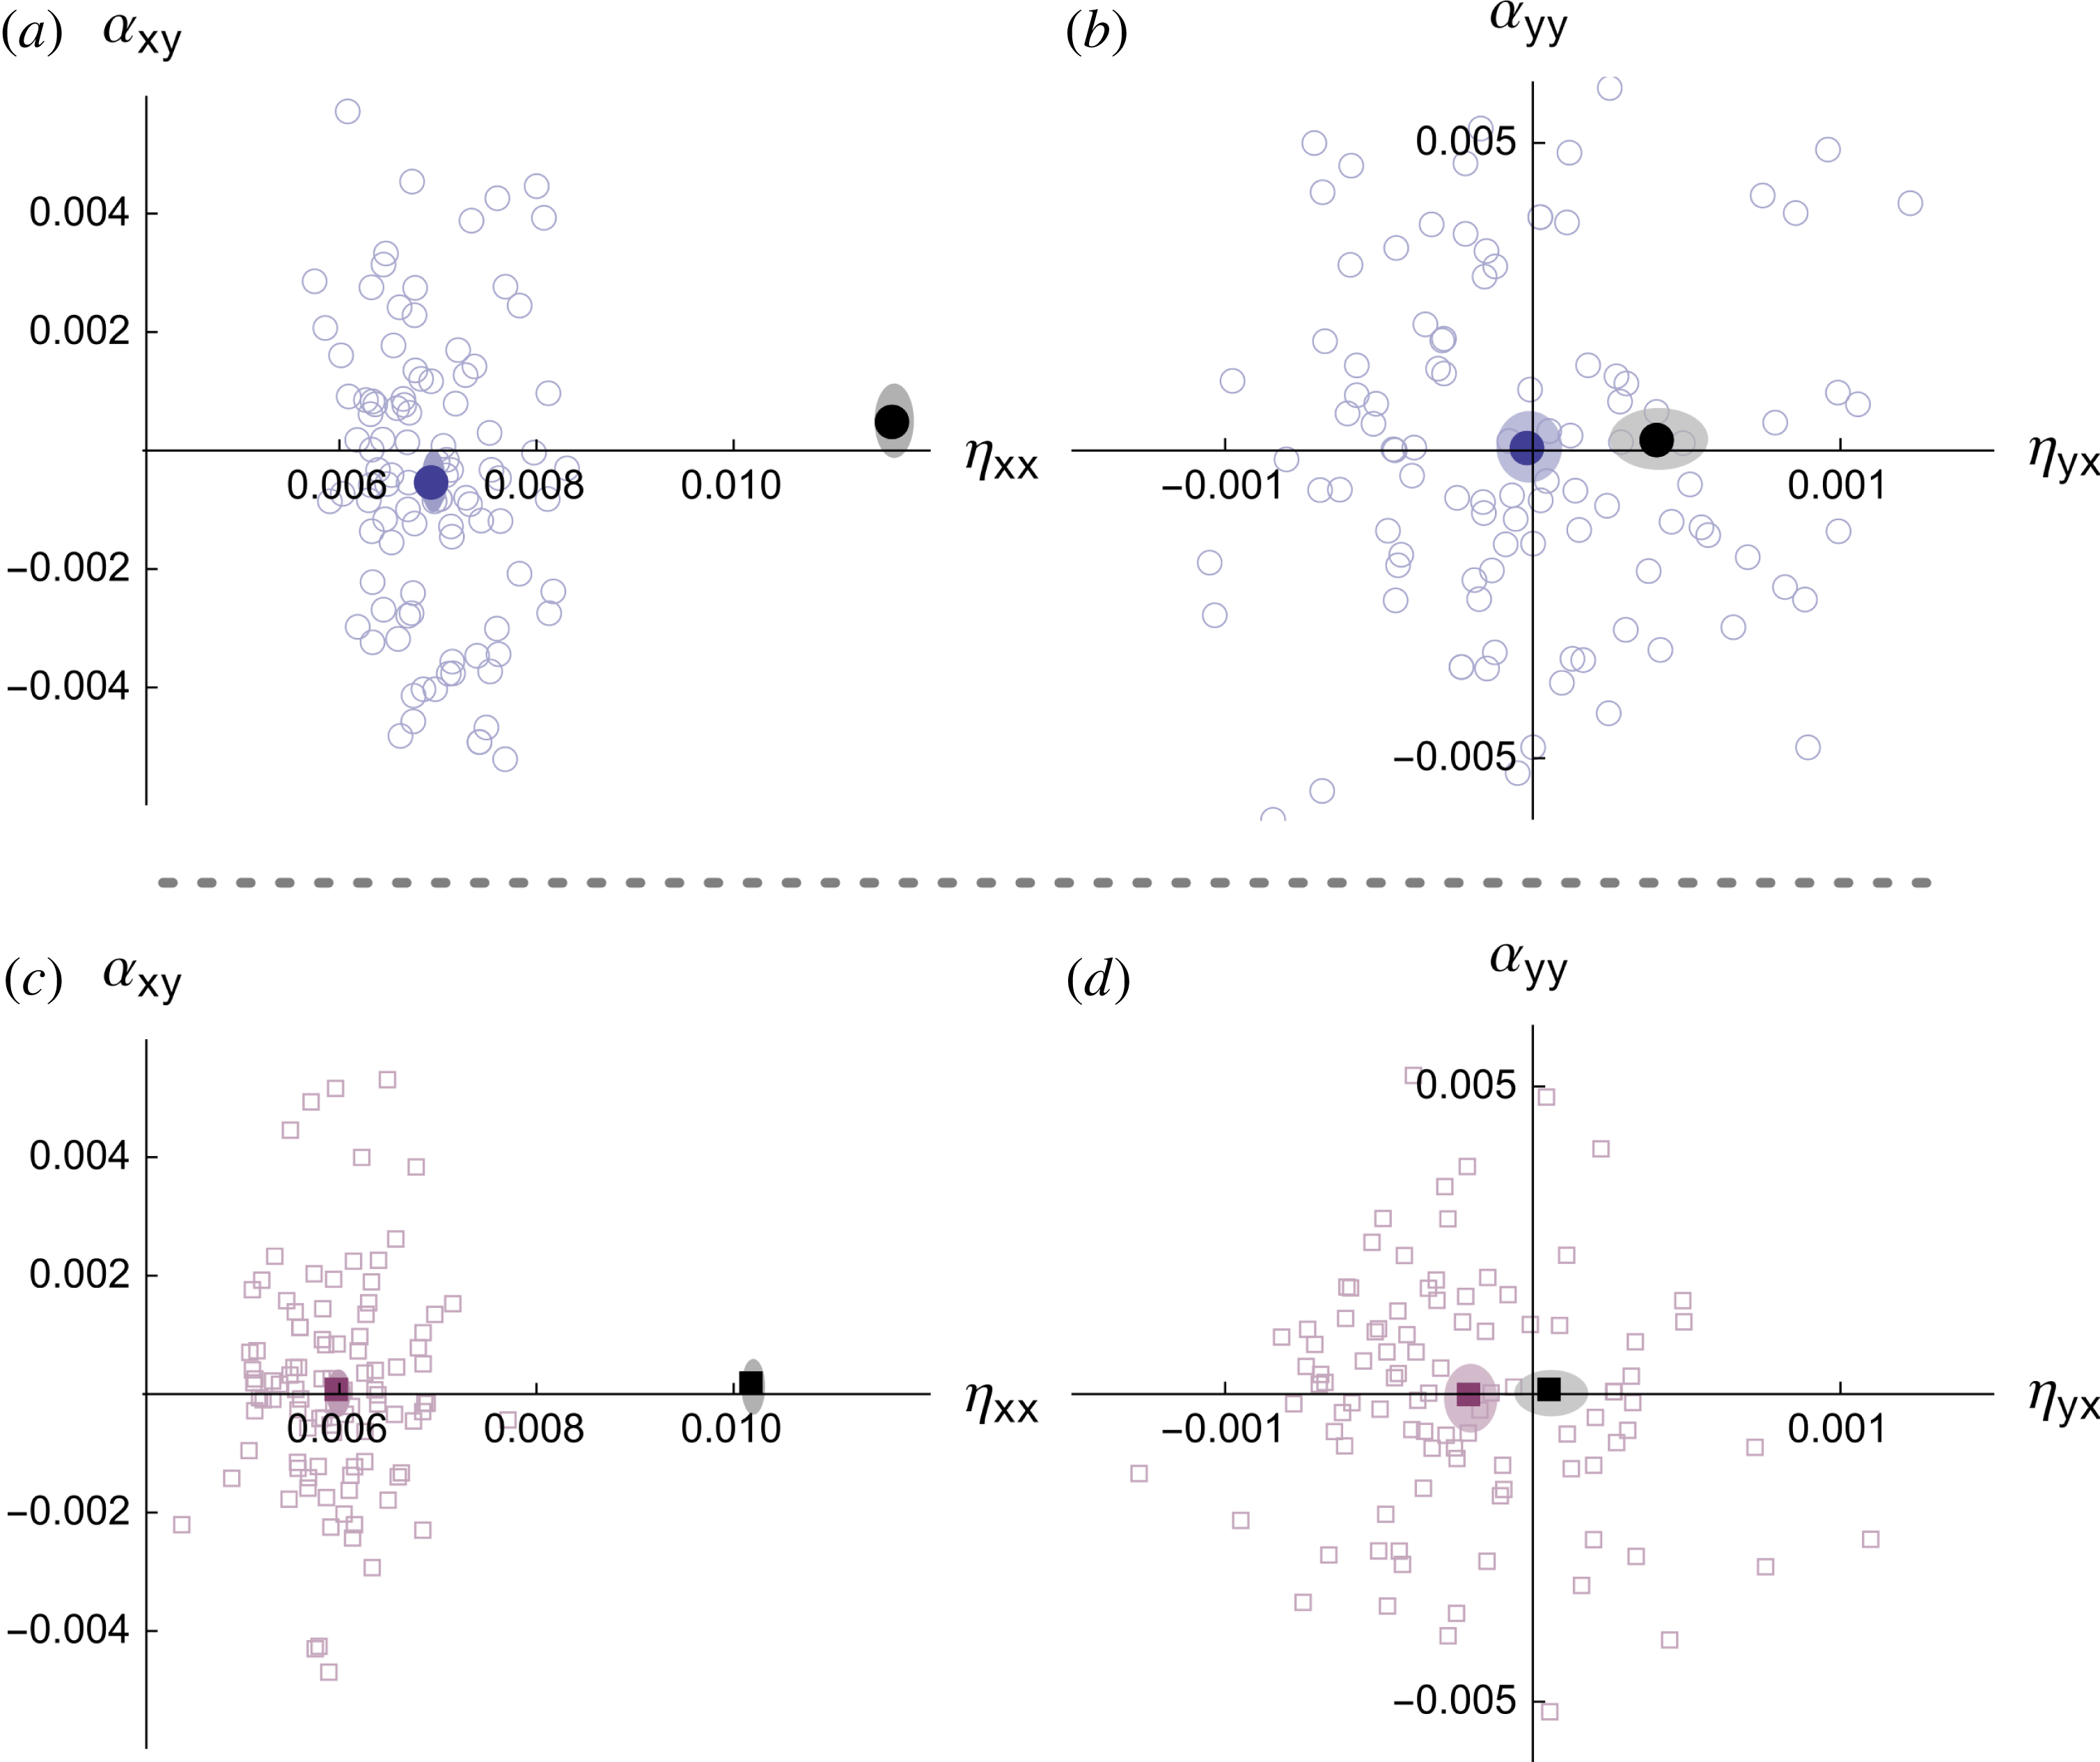
Figure 6 illustrates the results. In the kinematic phase without rotation, we see
 ${\it\eta}_{yx}=(4.1\pm 1.6)\times 10^{-4}$
, in qualitative agreement with previous studies (Brandenburg et al.
Reference Brandenburg, Rädler, Rheinhardt and Käpylä2008a
). With rotation, we find
${\it\eta}_{yx}=(4.1\pm 1.6)\times 10^{-4}$
, in qualitative agreement with previous studies (Brandenburg et al.
Reference Brandenburg, Rädler, Rheinhardt and Käpylä2008a
). With rotation, we find
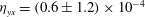 ${\it\eta}_{yx}=(0.6\pm 1.2)\times 10^{-4}$
, consistent with a reduction in
${\it\eta}_{yx}=(0.6\pm 1.2)\times 10^{-4}$
, consistent with a reduction in
 ${\it\eta}_{yx}$
due to the
${\it\eta}_{yx}$
due to the
 ${\it\bf\Omega}\times \boldsymbol{J}$
effect (Krause & Rädler Reference Krause and Rädler1980, but note the deviation from the lower-
${\it\bf\Omega}\times \boldsymbol{J}$
effect (Krause & Rädler Reference Krause and Rädler1980, but note the deviation from the lower-
 $\mathit{Rm}$
case and SOCA result, which predicts negative
$\mathit{Rm}$
case and SOCA result, which predicts negative
 ${\it\eta}_{yx}$
). After saturation of the small-scale dynamo,
${\it\eta}_{yx}$
). After saturation of the small-scale dynamo,
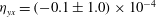 ${\it\eta}_{yx}=(-0.1\pm 1.0)\times 10^{-4}$
for the non-rotating case, while
${\it\eta}_{yx}=(-0.1\pm 1.0)\times 10^{-4}$
for the non-rotating case, while
 ${\it\eta}_{yx}\approx -(2.0\pm 0.8)\times 10^{-4}$
in the rotating case. The reduction of each is the same to within error. Values for the diagonal resistivity are smaller after saturation, which is consistent with the observed decrease in the velocity fluctuation energy (by a factor
${\it\eta}_{yx}\approx -(2.0\pm 0.8)\times 10^{-4}$
in the rotating case. The reduction of each is the same to within error. Values for the diagonal resistivity are smaller after saturation, which is consistent with the observed decrease in the velocity fluctuation energy (by a factor
 ${\sim}1.4$
).
${\sim}1.4$
).
The numerical values of
 ${\it\eta}_{xx}$
and
${\it\eta}_{xx}$
and
 ${\it\eta}_{yx}$
show that the coherent dynamo is slightly stable on average in the non-rotating case and marginal in the rotating case. However, the coefficients vary significantly between realizations, sometimes yielding larger growth rates, and it is important to check that the observed mean-field evolution has some relation to this variation. This serves two purposes. First, it acts as a check that the projection method is measuring the transport coefficients correctly. Second, it illustrates that those realizations exhibiting the strongest growth are indeed being driven by the shear-current mechanism; that is, they are driven by
${\it\eta}_{yx}$
show that the coherent dynamo is slightly stable on average in the non-rotating case and marginal in the rotating case. However, the coefficients vary significantly between realizations, sometimes yielding larger growth rates, and it is important to check that the observed mean-field evolution has some relation to this variation. This serves two purposes. First, it acts as a check that the projection method is measuring the transport coefficients correctly. Second, it illustrates that those realizations exhibiting the strongest growth are indeed being driven by the shear-current mechanism; that is, they are driven by
 ${\it\eta}_{yx}$
rather than residual variation of
${\it\eta}_{yx}$
rather than residual variation of
 ${\it\alpha}$
about mean zero. This corroborates the earlier conclusion that the approximately constant phase of
${\it\alpha}$
about mean zero. This corroborates the earlier conclusion that the approximately constant phase of
 $B_{y}(z,t)$
in the development of the dynamo (figure 5) is inconsistent with an
$B_{y}(z,t)$
in the development of the dynamo (figure 5) is inconsistent with an
 ${\it\alpha}$
effect.
${\it\alpha}$
effect.
As stated previously, the method for checking this consistency is to use the measured transport coefficients to solve for the expected evolution of the largest Fourier mode of
 $B_{i}$
(using (2.4)), comparing this to the observed evolution from the full simulation. Note that we use the time-dependent coefficients
$B_{i}$
(using (2.4)), comparing this to the observed evolution from the full simulation. Note that we use the time-dependent coefficients
 ${\it\alpha}_{ij}(t)$
and
${\it\alpha}_{ij}(t)$
and
 ${\it\eta}_{ij}(t)$
, rather than the time average that is shown in figure 6, since this provides much more information about the details of the evolution. The check is carried out for each realization separately, initializing using the mean-field data and filtering transport coefficients in time with a Gaussian filter of width
${\it\eta}_{ij}(t)$
, rather than the time average that is shown in figure 6, since this provides much more information about the details of the evolution. The check is carried out for each realization separately, initializing using the mean-field data and filtering transport coefficients in time with a Gaussian filter of width
 $5$
to remove the rapid fluctuations. Results from the first 12 realizations for rotating runs (chosen since the dynamo is stronger than in the non-rotating cases) are shown in figure 7. The agreement is generally good, with qualitatively similar features between calculated and measured evolution in all realizations, and many cases showing quantitative agreement. It seems that in most instances for which there is a substantial divergence between the predicted and observed mean-field evolution, it is due to a slight error building up in
$5$
to remove the rapid fluctuations. Results from the first 12 realizations for rotating runs (chosen since the dynamo is stronger than in the non-rotating cases) are shown in figure 7. The agreement is generally good, with qualitatively similar features between calculated and measured evolution in all realizations, and many cases showing quantitative agreement. It seems that in most instances for which there is a substantial divergence between the predicted and observed mean-field evolution, it is due to a slight error building up in
 $B_{x}$
that subsequently gets amplified enormously due to the
$B_{x}$
that subsequently gets amplified enormously due to the
 $-SB_{x}$
term in the
$-SB_{x}$
term in the
 $B_{y}$
equation.
$B_{y}$
equation.
Evolution of the mean-field magnitude for the first 12 of the ensemble of rotating simulations discussed in the manuscript. Here
 $B(|\hat{B}_{x}^{1}|^{2}+|\hat{B}_{y}^{1}|^{2})^{1/2}$
is the mean-field magnitude, where
$B(|\hat{B}_{x}^{1}|^{2}+|\hat{B}_{y}^{1}|^{2})^{1/2}$
is the mean-field magnitude, where
 $\hat{B}_{i}^{1}$
is the largest scale Fourier mode of
$\hat{B}_{i}^{1}$
is the largest scale Fourier mode of
 $B_{i}$
. In each plot the solid blue curve shows data taken from the simulation. The dashed red curve shows the corresponding expected evolution, using the smoothed calculated values of the transport coefficients (see text). Finally, the dotted black curve illustrates the expected evolution, artificially setting all
$B_{i}$
. In each plot the solid blue curve shows data taken from the simulation. The dashed red curve shows the corresponding expected evolution, using the smoothed calculated values of the transport coefficients (see text). Finally, the dotted black curve illustrates the expected evolution, artificially setting all
 ${\it\alpha}$
coefficients to zero. We list the measured mean of
${\it\alpha}$
coefficients to zero. We list the measured mean of
 ${\it\eta}_{yx}$
in each plot to show that higher absolute values (i.e. more negative values) do generally lead to substantially more growth of the mean field as expected for a coherent dynamo. For reference, at the measured
${\it\eta}_{yx}$
in each plot to show that higher absolute values (i.e. more negative values) do generally lead to substantially more growth of the mean field as expected for a coherent dynamo. For reference, at the measured
 ${\it\eta}_{xx}\approx 0.006$
, the coherent dynamo is unstable below
${\it\eta}_{xx}\approx 0.006$
, the coherent dynamo is unstable below
 ${\it\eta}_{yx}=-0.00036$
.
${\it\eta}_{yx}=-0.00036$
.
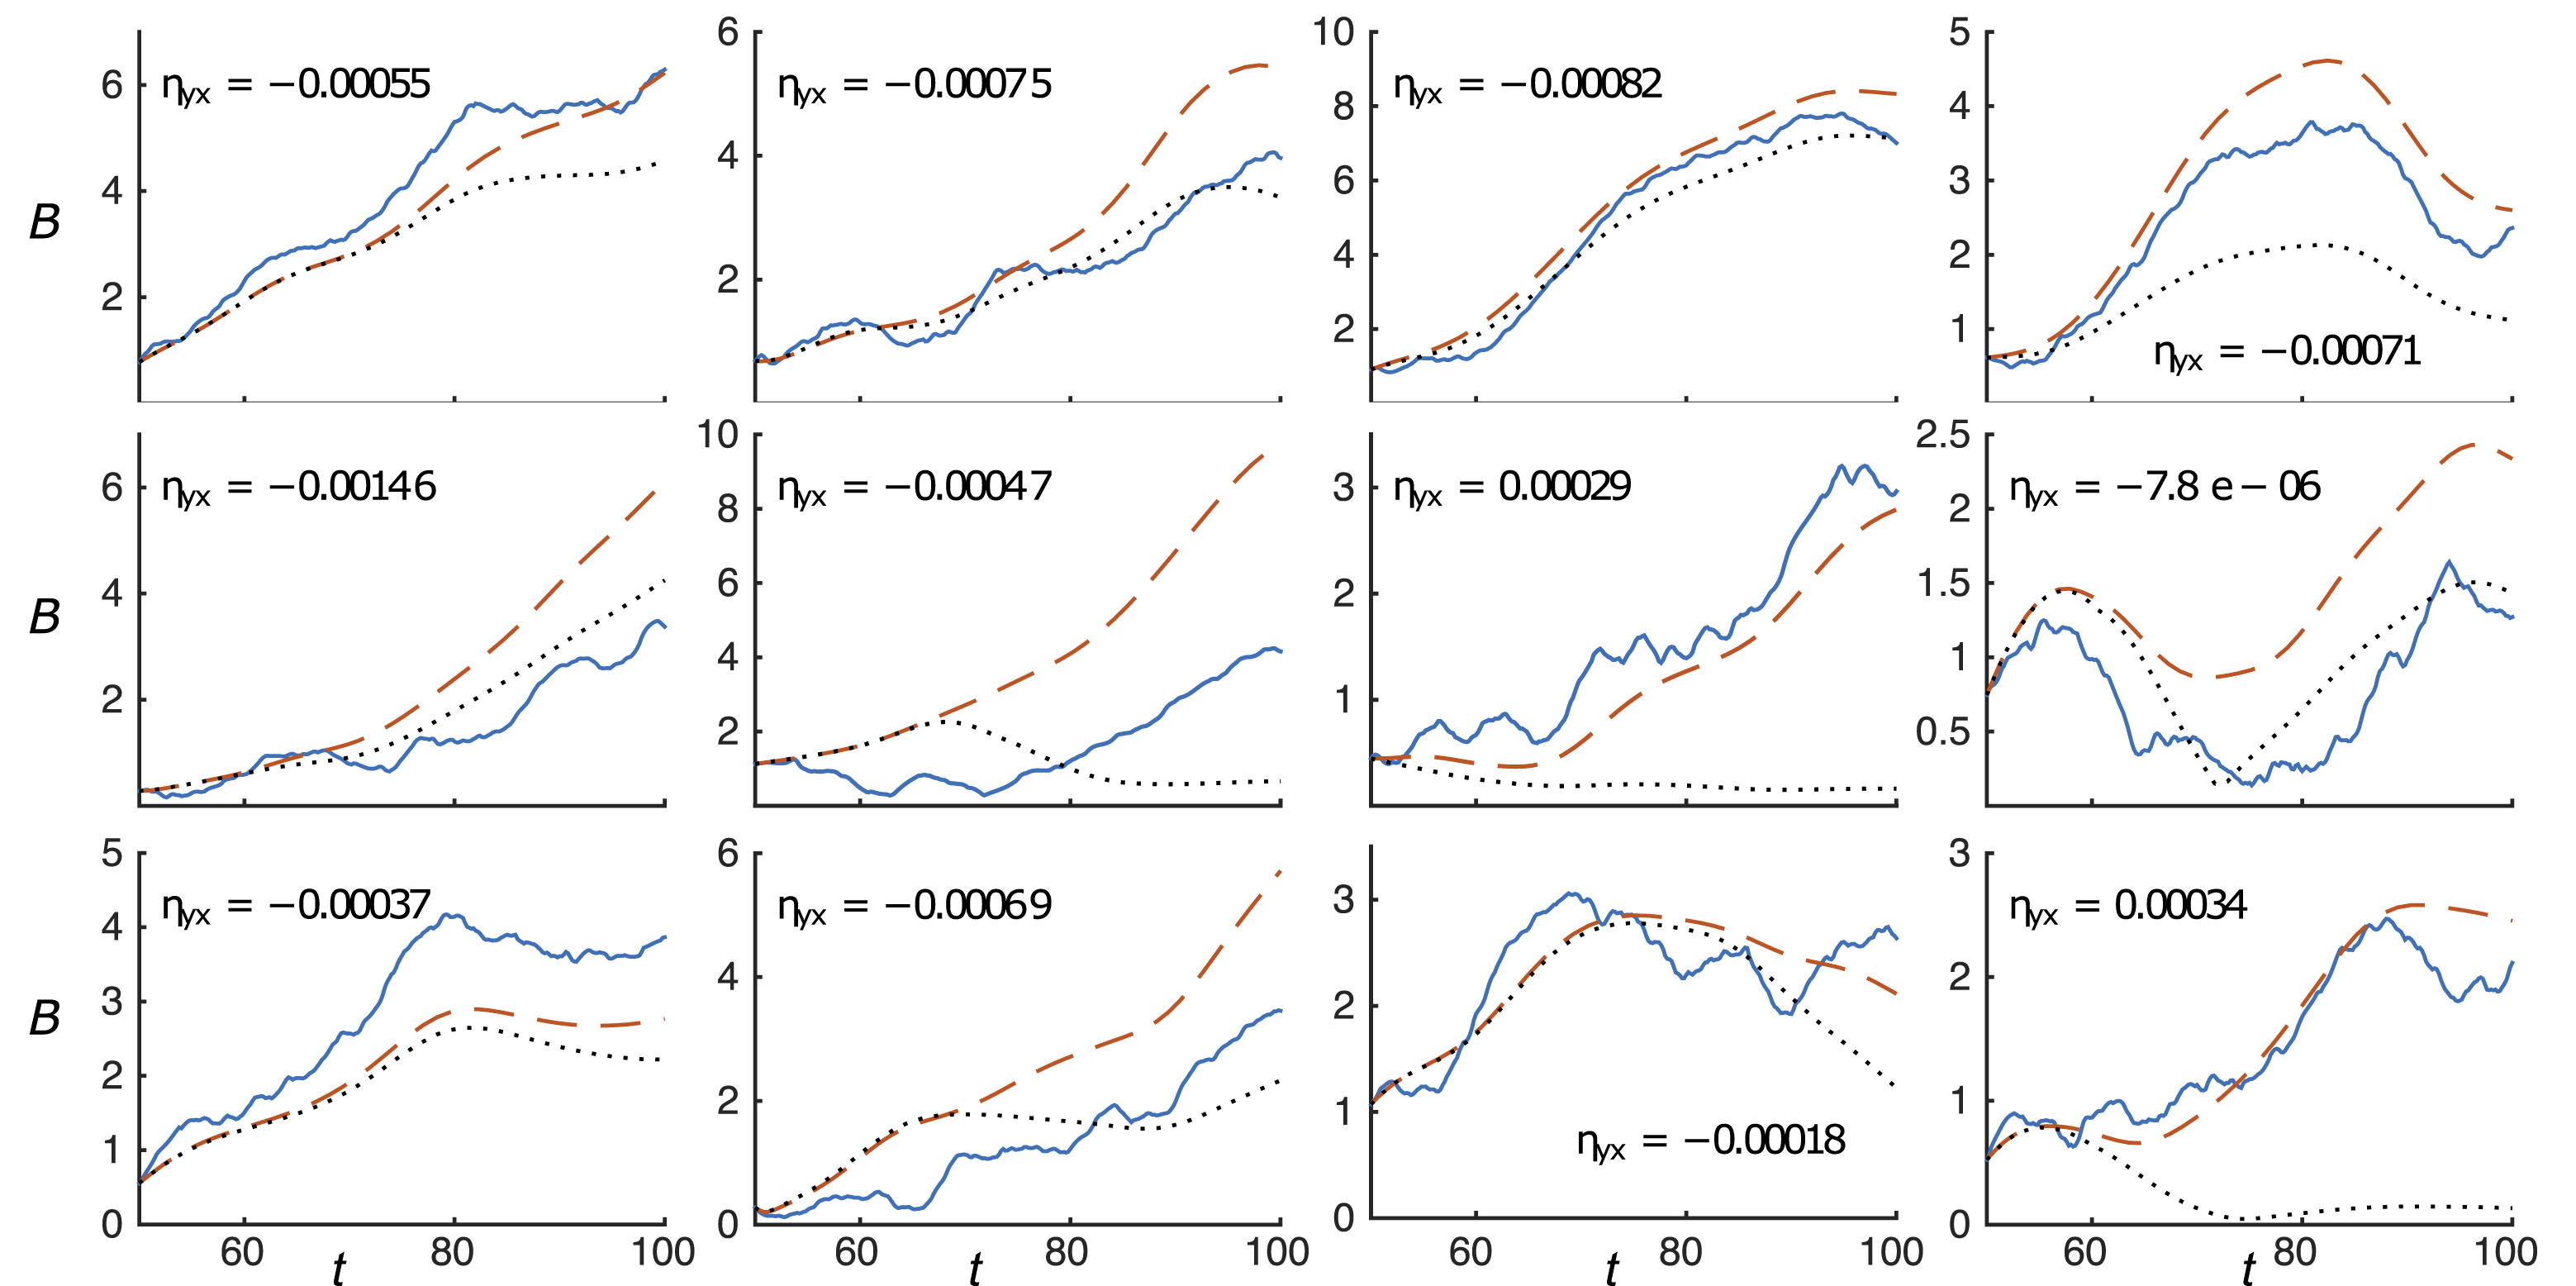
In addition to solving for expected evolution using both
 ${\it\eta}_{ij}(t)$
and
${\it\eta}_{ij}(t)$
and
 ${\it\alpha}_{ij}(t)$
measurements, we present calculations obtained in an identical way, but with
${\it\alpha}_{ij}(t)$
measurements, we present calculations obtained in an identical way, but with
 ${\it\alpha}_{ij}(t)$
coefficients artificially set to zero. The purpose of this analysis is to examine the degree to which the dynamo is driven by
${\it\alpha}_{ij}(t)$
coefficients artificially set to zero. The purpose of this analysis is to examine the degree to which the dynamo is driven by
 ${\it\eta}_{yx}$
, rather than variation in
${\it\eta}_{yx}$
, rather than variation in
 ${\it\alpha}$
about its mean of zero. Through a comparison of the curves with and without
${\it\alpha}$
about its mean of zero. Through a comparison of the curves with and without
 ${\it\alpha}_{ij}$
it is clear that in many realizations of the rotating simulation set, the dynamo is primarily driven by
${\it\alpha}_{ij}$
it is clear that in many realizations of the rotating simulation set, the dynamo is primarily driven by
 ${\it\eta}_{yx}$
, as shown by the agreement between dashed and dotted curves. Furthermore, the mean of
${\it\eta}_{yx}$
, as shown by the agreement between dashed and dotted curves. Furthermore, the mean of
 ${\it\eta}_{yx}$
over the time interval (printed on each subfigure; these are taken from figure 6) agrees nicely with the observed behaviour. That is, large negative values for
${\it\eta}_{yx}$
over the time interval (printed on each subfigure; these are taken from figure 6) agrees nicely with the observed behaviour. That is, large negative values for
 ${\it\eta}_{yx}$
correspond to those realizations with both strong dynamo growth and good agreement between evolution with and without
${\it\eta}_{yx}$
correspond to those realizations with both strong dynamo growth and good agreement between evolution with and without
 ${\it\alpha}$
. In contrast, realizations with lower absolute values of
${\it\alpha}$
. In contrast, realizations with lower absolute values of
 ${\it\eta}_{yx}$
(i.e. values for which the dynamo is stable) either grow very little or diverge substantially between evolution with and without
${\it\eta}_{yx}$
(i.e. values for which the dynamo is stable) either grow very little or diverge substantially between evolution with and without
 ${\it\alpha}$
. This shows that sometimes, for realizations in which the magnetic shear-current effect is weaker, a stochastic
${\it\alpha}$
. This shows that sometimes, for realizations in which the magnetic shear-current effect is weaker, a stochastic
 ${\it\alpha}$
effect is the primary driver. A similar examination of the non-rotating case shows that coherent dynamo growth is much less prevalent. In particular, while the agreement between the true and calculated evolution is satisfactory (similar to figure 7), there is generally much less mean-field growth and larger differences with calculations for which
${\it\alpha}$
effect is the primary driver. A similar examination of the non-rotating case shows that coherent dynamo growth is much less prevalent. In particular, while the agreement between the true and calculated evolution is satisfactory (similar to figure 7), there is generally much less mean-field growth and larger differences with calculations for which
 ${\it\alpha}_{ij}$
is artificially set to zero. Since in most realizations
${\it\alpha}_{ij}$
is artificially set to zero. Since in most realizations
 ${\it\eta}_{yx}$
is larger than the threshold at which the coherent dynamo becomes unstable even after the decrease due to magnetic fluctuations, this is not surprising.
${\it\eta}_{yx}$
is larger than the threshold at which the coherent dynamo becomes unstable even after the decrease due to magnetic fluctuations, this is not surprising.
We thus conclude that small-scale magnetic fluctuations act to make
 ${\it\eta}_{yx}$
more negative, and that in some realizations (or after a sufficiently long time period) a coherent large-scale dynamo develops as a result. This demonstrates that magnetic fluctuations, excited by small-scale dynamo action, can drive large-scale magnetic field generation. The consistency of the numerical simulations with theoretical expectations, as well as the general agreement of measured transport coefficients with observed mean-field evolution, give us confidence that the observed large-scale dynamo is indeed a coherent effect. The mechanism is the magnetic shear-current effect, arising through the contribution of magnetic fluctuations to the off-diagonal turbulent resistivity
${\it\eta}_{yx}$
more negative, and that in some realizations (or after a sufficiently long time period) a coherent large-scale dynamo develops as a result. This demonstrates that magnetic fluctuations, excited by small-scale dynamo action, can drive large-scale magnetic field generation. The consistency of the numerical simulations with theoretical expectations, as well as the general agreement of measured transport coefficients with observed mean-field evolution, give us confidence that the observed large-scale dynamo is indeed a coherent effect. The mechanism is the magnetic shear-current effect, arising through the contribution of magnetic fluctuations to the off-diagonal turbulent resistivity
 ${\it\eta}_{yx}$
in the presence of large-scale shear flow.
${\it\eta}_{yx}$
in the presence of large-scale shear flow.
The most significant limitation of the studies presented in this section is the relatively low Reynolds numbers, which were chosen to be slightly below the transition to self-sustaining turbulence (in the absence of driving noise), as well as for computational reasons (since an ensemble of simulations was required). Specifically, the dynamo is likely far from any asymptotic regime at high
 $\mathit{Re}$
and
$\mathit{Re}$
and
 $\mathit{Rm}$
. This is almost certainly true for both the small-scale dynamo and its saturationFootnote
13
, as well as for the large-scale magnetic shear-current effect itself. Further, the diffusion time scale of the large-scale modes is
$\mathit{Rm}$
. This is almost certainly true for both the small-scale dynamo and its saturationFootnote
13
, as well as for the large-scale magnetic shear-current effect itself. Further, the diffusion time scale of the large-scale modes is
 $t\approx (\bar{{\it\eta}}(2{\rm\pi}/L_{z})^{2})\approx 200$
, which is only an order of magnitude different from the time scale of growth of the large-scale field (
$t\approx (\bar{{\it\eta}}(2{\rm\pi}/L_{z})^{2})\approx 200$
, which is only an order of magnitude different from the time scale of growth of the large-scale field (
 $t\approx 30$
, as can be seen from figure 7). The same is true of the separation between the turbulent forcing scale
$t\approx 30$
, as can be seen from figure 7). The same is true of the separation between the turbulent forcing scale
 $k_{f}\approx 19$
, and that of the large-scale field
$k_{f}\approx 19$
, and that of the large-scale field
 $k_{1}=2{\rm\pi}/L_{z}={\rm\pi}$
. While such limitations are hardly unique in the dynamo literature, it is obviously pertinent to undertake future studies at much higher resolutions. Further discussion of some of the difficulties involved with truly understanding the astrophysical relevance of the magnetic shear-current effect is given in the next section.
$k_{1}=2{\rm\pi}/L_{z}={\rm\pi}$
. While such limitations are hardly unique in the dynamo literature, it is obviously pertinent to undertake future studies at much higher resolutions. Further discussion of some of the difficulties involved with truly understanding the astrophysical relevance of the magnetic shear-current effect is given in the next section.
4 Discussion and conclusions
This paper has revolved around exploration of the ‘magnetic shear-current effect’ as a viable mechanism to drive large-scale dynamos in non-helical shear flows. The suggestion is that a bath of homogeneous non-helical magnetic fluctuations, influenced by the velocity shear, can cause a large-scale dynamo instability through an off-diagonal turbulent resistivity, even if there is no
 ${\it\alpha}$
effect. More specifically, in response to a large-scale azimuthal magnetic field
${\it\alpha}$
effect. More specifically, in response to a large-scale azimuthal magnetic field
 $B_{y}$
, a bath of magnetic fluctuations will produce an azimuthal electromotive force
$B_{y}$
, a bath of magnetic fluctuations will produce an azimuthal electromotive force
 ${\mathcal{E}}_{y}$
, proportional to
${\mathcal{E}}_{y}$
, proportional to
 $\partial _{z}B_{y}$
. This
$\partial _{z}B_{y}$
. This
 ${\mathcal{E}}_{y}$
causes the generation of a radial magnetic field, which in turn amplifies the azimuthal field through stretching by the mean flow (the
${\mathcal{E}}_{y}$
causes the generation of a radial magnetic field, which in turn amplifies the azimuthal field through stretching by the mean flow (the
 ${\it\Omega}$
effect), resulting in a dynamo instability. The effect rests crucially on the sign of the proportionality between
${\it\Omega}$
effect), resulting in a dynamo instability. The effect rests crucially on the sign of the proportionality between
 ${\mathcal{E}}_{y}$
and
${\mathcal{E}}_{y}$
and
 $\partial _{z}B_{y}$
(termed
$\partial _{z}B_{y}$
(termed
 ${\it\eta}_{yx}$
) – if the product
${\it\eta}_{yx}$
) – if the product
 ${\it\eta}_{yx}(\boldsymbol{{\rm\nabla}}\times \boldsymbol{U})_{z}$
is negative, the induced radial field will act to damp, rather than amplify, the azimuthal field.
${\it\eta}_{yx}(\boldsymbol{{\rm\nabla}}\times \boldsymbol{U})_{z}$
is negative, the induced radial field will act to damp, rather than amplify, the azimuthal field.
The physical picture for the magnetic shear-current effect – how magnetic fluctuations can interact with velocity shear and a large-scale field gradient to produce an
 $\boldsymbol{{\mathcal{E}}}$
of the required direction – is somewhat different from dynamo mechanisms described in previous literature (see, for example, Brandenburg & Subramanian Reference Brandenburg and Subramanian2005, Yokoi Reference Yokoi2013). In particular, it relies on the pressure response of the fluid to the Maxwell stress
$\boldsymbol{{\mathcal{E}}}$
of the required direction – is somewhat different from dynamo mechanisms described in previous literature (see, for example, Brandenburg & Subramanian Reference Brandenburg and Subramanian2005, Yokoi Reference Yokoi2013). In particular, it relies on the pressure response of the fluid to the Maxwell stress
 $\boldsymbol{B}_{T}\boldsymbol{\cdot }\boldsymbol{{\rm\nabla}}\boldsymbol{B}_{T}$
. The basic effect arises because
$\boldsymbol{B}_{T}\boldsymbol{\cdot }\boldsymbol{{\rm\nabla}}\boldsymbol{B}_{T}$
. The basic effect arises because
 $\boldsymbol{b}\boldsymbol{\cdot }\boldsymbol{{\rm\nabla}}\boldsymbol{B}$
creates
$\boldsymbol{b}\boldsymbol{\cdot }\boldsymbol{{\rm\nabla}}\boldsymbol{B}$
creates
 $\boldsymbol{B}$
-directed velocity perturbations from magnetic perturbations in the direction of magnetic shear (i.e. the
$\boldsymbol{B}$
-directed velocity perturbations from magnetic perturbations in the direction of magnetic shear (i.e. the
 $\boldsymbol{{\rm\nabla}}$
direction). This implies that any variation of the
$\boldsymbol{{\rm\nabla}}$
direction). This implies that any variation of the
 $\boldsymbol{b}$
perturbation along the
$\boldsymbol{b}$
perturbation along the
 $\boldsymbol{B}$
direction will create a velocity perturbation with non-zero divergence, leading to a significant pressure response. Without velocity shear, the response is well known and fundamental for turbulent diffusion; it exactly cancels another term and causes the contribution to the turbulent mean-field resistivity from magnetic fluctuations to vanish (this is also known as the absence of
$\boldsymbol{B}$
direction will create a velocity perturbation with non-zero divergence, leading to a significant pressure response. Without velocity shear, the response is well known and fundamental for turbulent diffusion; it exactly cancels another term and causes the contribution to the turbulent mean-field resistivity from magnetic fluctuations to vanish (this is also known as the absence of
 ${\it\beta}$
-quenching; Gruzinov & Diamond Reference Gruzinov and Diamond1994). In the presence of velocity shear, a secondary pressure response, arising due to the stretching of the primary pressure response by the mean shear, causes perpendicular velocity fluctuations that are correlated with the original magnetic fluctuations. The resulting EMF is in the required direction to generate a
${\it\beta}$
-quenching; Gruzinov & Diamond Reference Gruzinov and Diamond1994). In the presence of velocity shear, a secondary pressure response, arising due to the stretching of the primary pressure response by the mean shear, causes perpendicular velocity fluctuations that are correlated with the original magnetic fluctuations. The resulting EMF is in the required direction to generate a
 $\boldsymbol{B}$
that is stretched by the shear flow, enhancing the mean field that caused the effect in the first place. Thus, a mean-field dynamo instability can ensue at sufficiently long wavelength.
$\boldsymbol{B}$
that is stretched by the shear flow, enhancing the mean field that caused the effect in the first place. Thus, a mean-field dynamo instability can ensue at sufficiently long wavelength.
Why is magnetic shear-current mechanism interesting? We would like to give two answers to this question: the first relates generally to dynamo theory, the second to the specific case of the dynamo seen in simulations of turbulence in accretion disks (the MRI dynamo).
General mean-field dynamo theory. Much of mean-field dynamo theory in recent years has focused on the issue of
 ${\it\alpha}$
quenching (Kulsrud & Anderson Reference Kulsrud and Anderson1992; Gruzinov & Diamond Reference Gruzinov and Diamond1994). This is specifically related to the adverse influence of small-scale magnetic fields on large-scale dynamo action. Since small-scale dynamos grow faster than large-scale fields above moderate Reynolds numbers, large-scale dynamos may always have to grow on a bath of small-scale magnetic fluctuations (Cattaneo & Hughes Reference Cattaneo and Hughes2009, but see also Tobias & Cattaneo Reference Tobias and Cattaneo2014). With this in mind, the magnetic shear-current effect is the first suggestion (of which we are aware) for a large-scale dynamo driven by small-scale magnetic fluctuations (although quenching of the turbulent resistivity can lead to a dynamo with spatial variation of transport coefficients; Parker Reference Parker1993; Tobias Reference Tobias1996)Footnote
14
. Thus, in some sense, the effect is the inverse of dynamo quenching; rather than magnetic fluctuations overwhelming a desirable kinematic effect, mean-field growth starts after small-scale dynamo saturation, driven by the small-scale field itself. In this work, we have given an example of this interesting behaviour through targeted numerical experiments. These illustrate that the magnetic fluctuations resulting from saturation of the small-scale dynamo cause a significant decrease (and in some cases, a sign change) of the crucial
${\it\alpha}$
quenching (Kulsrud & Anderson Reference Kulsrud and Anderson1992; Gruzinov & Diamond Reference Gruzinov and Diamond1994). This is specifically related to the adverse influence of small-scale magnetic fields on large-scale dynamo action. Since small-scale dynamos grow faster than large-scale fields above moderate Reynolds numbers, large-scale dynamos may always have to grow on a bath of small-scale magnetic fluctuations (Cattaneo & Hughes Reference Cattaneo and Hughes2009, but see also Tobias & Cattaneo Reference Tobias and Cattaneo2014). With this in mind, the magnetic shear-current effect is the first suggestion (of which we are aware) for a large-scale dynamo driven by small-scale magnetic fluctuations (although quenching of the turbulent resistivity can lead to a dynamo with spatial variation of transport coefficients; Parker Reference Parker1993; Tobias Reference Tobias1996)Footnote
14
. Thus, in some sense, the effect is the inverse of dynamo quenching; rather than magnetic fluctuations overwhelming a desirable kinematic effect, mean-field growth starts after small-scale dynamo saturation, driven by the small-scale field itself. In this work, we have given an example of this interesting behaviour through targeted numerical experiments. These illustrate that the magnetic fluctuations resulting from saturation of the small-scale dynamo cause a significant decrease (and in some cases, a sign change) of the crucial
 ${\it\eta}_{yx}$
transport coefficient, which can in turn drive a large-scale dynamo. Study of such magnetic dynamos in direct numerical simulations is confounded by the very short period of exponential growth that can be observed (in contrast with kinematic shear dynamos; Yousef et al.
Reference Yousef, Heinemann, Schekochihin, Kleeorin, Rogachevskii, Iskakov, Cowley and Mcwilliams2008b
; Paper II), and more work is needed to better assess regimes where the effect might be dominant, or even if it continues to operate at very high Reynolds numbers. Nonetheless, it is an interesting possibility that may find application across a wide variety of astrophysical objects.
${\it\eta}_{yx}$
transport coefficient, which can in turn drive a large-scale dynamo. Study of such magnetic dynamos in direct numerical simulations is confounded by the very short period of exponential growth that can be observed (in contrast with kinematic shear dynamos; Yousef et al.
Reference Yousef, Heinemann, Schekochihin, Kleeorin, Rogachevskii, Iskakov, Cowley and Mcwilliams2008b
; Paper II), and more work is needed to better assess regimes where the effect might be dominant, or even if it continues to operate at very high Reynolds numbers. Nonetheless, it is an interesting possibility that may find application across a wide variety of astrophysical objects.
The MRI dynamo. The central regions of accretion disks are both unstratified and lack a source of net kinetic or magnetic helicity, implying that an
 ${\it\alpha}$
effect is not possible. In addition, a variety of authors have found from simulation and theory that the crucial
${\it\alpha}$
effect is not possible. In addition, a variety of authors have found from simulation and theory that the crucial
 ${\it\eta}_{yx}$
is of the wrong sign for a kinematic non-helical shear dynamo (Rädler & Stepanov Reference Rädler and Stepanov2006; Rüdiger & Kitchatinov Reference Rüdiger and Kitchatinov2006; Singh & Sridhar Reference Singh and Sridhar2011; Paper II). What then is the cause of the apparent large-scale dynamo seen in simulations? While there is the possibility that it is driven by fluctuations in the
${\it\eta}_{yx}$
is of the wrong sign for a kinematic non-helical shear dynamo (Rädler & Stepanov Reference Rädler and Stepanov2006; Rüdiger & Kitchatinov Reference Rüdiger and Kitchatinov2006; Singh & Sridhar Reference Singh and Sridhar2011; Paper II). What then is the cause of the apparent large-scale dynamo seen in simulations? While there is the possibility that it is driven by fluctuations in the
 ${\it\alpha}$
coefficients (Vishniac & Brandenburg Reference Vishniac and Brandenburg1997; Vishniac Reference Vishniac2009), we would argue that the magnetic shear-current effect is a more likely candidate: MRI simulations exhibit stronger magnetic than kinetic fluctuations, the Keplerian rotation is favourable for dynamo growth, the velocity shear is obviously important, and the nonlinear behaviour of the effect bears strong similarities to mean-field dynamics in unstratified MRI simulations. In addition, the basic importance of
${\it\alpha}$
coefficients (Vishniac & Brandenburg Reference Vishniac and Brandenburg1997; Vishniac Reference Vishniac2009), we would argue that the magnetic shear-current effect is a more likely candidate: MRI simulations exhibit stronger magnetic than kinetic fluctuations, the Keplerian rotation is favourable for dynamo growth, the velocity shear is obviously important, and the nonlinear behaviour of the effect bears strong similarities to mean-field dynamics in unstratified MRI simulations. In addition, the basic importance of
 ${\it\eta}_{yx}$
in the MRI dynamo has been concluded from nonlinear simulation (Lesur & Ogilvie Reference Lesur and Ogilvie2008b
) and perturbative calculations of the evolution of MRI modes (Lesur & Ogilvie Reference Lesur and Ogilvie2008a
). Our suggestion that small-scale magnetic fields are in fact the primary driver thus ties together formal mean-field dynamo theory with these studies and explains the special importance of strong magnetic fluctuations in MRI turbulence and dynamo.
${\it\eta}_{yx}$
in the MRI dynamo has been concluded from nonlinear simulation (Lesur & Ogilvie Reference Lesur and Ogilvie2008b
) and perturbative calculations of the evolution of MRI modes (Lesur & Ogilvie Reference Lesur and Ogilvie2008a
). Our suggestion that small-scale magnetic fields are in fact the primary driver thus ties together formal mean-field dynamo theory with these studies and explains the special importance of strong magnetic fluctuations in MRI turbulence and dynamo.
Some of the most compelling evidence that the magnetic shear-current effect is indeed responsible for the unstratified MRI dynamo comes from statistical simulation of the saturation of MRI turbulence (Squire & Bhattacharjee Reference Squire and Bhattacharjee2015a
). Statistical simulation (Tobias, Dagon & Marston Reference Tobias, Dagon and Marston2011b
, Farrell & Ioannou Reference Farrell and Ioannou2012) involves formulating equations for statistics of the small-scale fields
 $\boldsymbol{u}$
and
$\boldsymbol{u}$
and
 $\boldsymbol{b}$
in the mean fields (
$\boldsymbol{b}$
in the mean fields (
 $\boldsymbol{U}$
and
$\boldsymbol{U}$
and
 $\boldsymbol{B}$
), and solving these, rather than a single turbulent realization. Importantly for the shear dynamo, this completely eliminates the possibility of a stochastic-
$\boldsymbol{B}$
), and solving these, rather than a single turbulent realization. Importantly for the shear dynamo, this completely eliminates the possibility of a stochastic-
 ${\it\alpha}$
effect, since the
${\it\alpha}$
effect, since the
 $\boldsymbol{{\mathcal{E}}}$
that drives
$\boldsymbol{{\mathcal{E}}}$
that drives
 $\boldsymbol{B}$
is calculated directly from fluctuation statistics. Coupled with the fact that the kinematic effect is too weak to explain the dynamo (Paper II), it is clear that the magnetic shear-current effect is the only possible field generation mechanism in these calculations. Despite this, the agreement with nonlinear simulation is very good (see figure 2 of Squire & Bhattacharjee Reference Squire and Bhattacharjee2015a
). Most important is the observed strong increase in the saturated mean
$\boldsymbol{B}$
is calculated directly from fluctuation statistics. Coupled with the fact that the kinematic effect is too weak to explain the dynamo (Paper II), it is clear that the magnetic shear-current effect is the only possible field generation mechanism in these calculations. Despite this, the agreement with nonlinear simulation is very good (see figure 2 of Squire & Bhattacharjee Reference Squire and Bhattacharjee2015a
). Most important is the observed strong increase in the saturated mean
 $\boldsymbol{B}$
field, and consequently in the turbulent angular momentum transport, as the magnetic Prandtl number is increased at fixed
$\boldsymbol{B}$
field, and consequently in the turbulent angular momentum transport, as the magnetic Prandtl number is increased at fixed
 $\mathit{Re}$
. This counterintuitive trend has been the source of much discussion in the MRI turbulence literature (see, for example, Fromang et al.
Reference Fromang, Papaloizou, Lesur and Heinemann2007, Lesur & Longaretti Reference Lesur and Longaretti2007, Meheut et al.
Reference Meheut, Fromang, Lesur, Joos and Longaretti2015). The considerations above illustrate that it is, at least in part, a consequence of the
$\mathit{Re}$
. This counterintuitive trend has been the source of much discussion in the MRI turbulence literature (see, for example, Fromang et al.
Reference Fromang, Papaloizou, Lesur and Heinemann2007, Lesur & Longaretti Reference Lesur and Longaretti2007, Meheut et al.
Reference Meheut, Fromang, Lesur, Joos and Longaretti2015). The considerations above illustrate that it is, at least in part, a consequence of the
 $\mathit{Pm}$
dependence of the saturation of the magnetic shear-current effect.
$\mathit{Pm}$
dependence of the saturation of the magnetic shear-current effect.
Looking past the unstratified MRI dynamo, we might wonder about other applications of the magnetic shear-current effect. Large-scale velocity shear is inescapable in the universe due to the influence of gravity, while the generic instability of small-scale dynamo at large Reynolds numbers implies that plasma turbulence should always be accompanied by small-scale magnetic fluctuations in near equipartition with velocity fluctuations (Schekochihin et al.
Reference Schekochihin, Iskakov, Cowley, Mcwilliams, Proctor and Yousef2007). However, the simulations discussed in § 3 are intended to illustrate that the magnetic shear-current effect is possible, not necessarily that it should be important in every situation. Unfortunately, estimating the relevance of the effect in astrophysical scenarios in any detail requires more knowledge about its dependence on physical parameters – particularly the Reynolds numbers (and magnetic Prandtl number). There are numerous complicating factors that will arise in estimating these dependencies. Most obvious is the variation of transport coefficients themselves (especially
 ${\it\eta}_{yx}$
) for a given level of magnetic fluctuations. While it is certainly encouraging that a variety of different methods agree on the sign of
${\it\eta}_{yx}$
) for a given level of magnetic fluctuations. While it is certainly encouraging that a variety of different methods agree on the sign of
 ${\it\eta}_{yx}$
, most results are truly valid only at low Reynolds numbersFootnote
15
. More subtly, the relevance of the effect could depend significantly on the saturation level of the small-scale dynamo, which would be especially important if the kinematic shear-current effect has the incorrect sign for dynamo action (
${\it\eta}_{yx}$
, most results are truly valid only at low Reynolds numbersFootnote
15
. More subtly, the relevance of the effect could depend significantly on the saturation level of the small-scale dynamo, which would be especially important if the kinematic shear-current effect has the incorrect sign for dynamo action (
 $({\it\eta}_{yx})_{u}$
may change sign with Reynolds number; see Brandenburg et al.
Reference Brandenburg, Rädler, Rheinhardt and Käpylä2008a
). This saturation level presumably depends on
$({\it\eta}_{yx})_{u}$
may change sign with Reynolds number; see Brandenburg et al.
Reference Brandenburg, Rädler, Rheinhardt and Käpylä2008a
). This saturation level presumably depends on
 $\mathit{Pm}$
, but may also change under the influence of velocity shear (at least at the larger of the small scales), an effect that may become significant only at very high Reynolds numbers (Cattaneo & Tobias Reference Cattaneo and Tobias2014; Tobias & Cattaneo Reference Tobias and Cattaneo2014). Finally, magnetic helicity and its transport are a cornerstone of modern dynamo theory (Vishniac & Cho Reference Vishniac and Cho2001; Field & Blackman Reference Field and Blackman2002), but have not been explored in our work thus far due to the focus on the linear phases of the dynamo instability. Such effects will be important to consider in future studies of the saturation and nonlinear evolution of magnetic shear-current dynamos (Rogachevskii, Kleeorin & Liverts Reference Rogachevskii, Kleeorin and Liverts2006). Overall, given the general difficulty of even measuring growth rates for magnetically driven large-scale dynamos, it seems that the magnetic shear-current effect will provide a variety of rich and interesting avenues for future exploration.
$\mathit{Pm}$
, but may also change under the influence of velocity shear (at least at the larger of the small scales), an effect that may become significant only at very high Reynolds numbers (Cattaneo & Tobias Reference Cattaneo and Tobias2014; Tobias & Cattaneo Reference Tobias and Cattaneo2014). Finally, magnetic helicity and its transport are a cornerstone of modern dynamo theory (Vishniac & Cho Reference Vishniac and Cho2001; Field & Blackman Reference Field and Blackman2002), but have not been explored in our work thus far due to the focus on the linear phases of the dynamo instability. Such effects will be important to consider in future studies of the saturation and nonlinear evolution of magnetic shear-current dynamos (Rogachevskii, Kleeorin & Liverts Reference Rogachevskii, Kleeorin and Liverts2006). Overall, given the general difficulty of even measuring growth rates for magnetically driven large-scale dynamos, it seems that the magnetic shear-current effect will provide a variety of rich and interesting avenues for future exploration.
Acknowledgements
The authors would like to thank J. Krommes, J. Goodman, H. Ji, G. Hammett, and A. Schekochihin for enlightening discussion and useful suggestions, as well as G. Lesur for distribution of the Snoopy code. J.S. acknowledges the generous support of a Burke Fellowship and the Sherman Fairchild Foundation at Caltech, as well as a Procter Fellowship at Princeton University. This work was funded by US Department of Energy grant no. DE-AC02-09-CH11466 and computations were carried out on the Dawson cluster at PPPL.
Appendix A. Verification of the projection method: low-
 $\mathit{Rm}$
shear dynamo
$\mathit{Rm}$
shear dynamo

In this appendix, we verify that the projection method discussed in § 3.1 recovers the correct transport coefficients for low-
 $\mathit{Rm}$
shear dynamos, similar to those studied in Paper II and Yousef et al. (Reference Yousef, Heinemann, Rincon, Schekochihin, Kleeorin, Rogachevskii, Cowley and Mcwilliams2008a
,Reference Yousef, Heinemann, Schekochihin, Kleeorin, Rogachevskii, Iskakov, Cowley and Mcwilliams
b
). The primary advantage of testing the method in this parameter regime is that there is no small-scale dynamo and simulations exhibit a very long kinematic growth period over which the small-scale velocity field is unaffected by the magnetic field. It is thus straightforward to compare results obtained with the projection method to those using the test-field method, where the only the fluctuating part of the induction equation is solved.
$\mathit{Rm}$
shear dynamos, similar to those studied in Paper II and Yousef et al. (Reference Yousef, Heinemann, Rincon, Schekochihin, Kleeorin, Rogachevskii, Cowley and Mcwilliams2008a
,Reference Yousef, Heinemann, Schekochihin, Kleeorin, Rogachevskii, Iskakov, Cowley and Mcwilliams
b
). The primary advantage of testing the method in this parameter regime is that there is no small-scale dynamo and simulations exhibit a very long kinematic growth period over which the small-scale velocity field is unaffected by the magnetic field. It is thus straightforward to compare results obtained with the projection method to those using the test-field method, where the only the fluctuating part of the induction equation is solved.
The simulations are carried out in the same numerical set-up as used in the main text, but at
 $\mathit{Re}=\mathit{Rm}=100$
in shearing boxes of dimension
$\mathit{Re}=\mathit{Rm}=100$
in shearing boxes of dimension
 $(L_{x},L_{y},L_{z})=(1,1,8)$
. The large
$(L_{x},L_{y},L_{z})=(1,1,8)$
. The large
 $L_{z}$
is chosen to allow for a long mean-field wavelength and thus enhance the dynamo instability (Yousef et al.
Reference Yousef, Heinemann, Rincon, Schekochihin, Kleeorin, Rogachevskii, Cowley and Mcwilliams2008a
). The velocity field is forced at
$L_{z}$
is chosen to allow for a long mean-field wavelength and thus enhance the dynamo instability (Yousef et al.
Reference Yousef, Heinemann, Rincon, Schekochihin, Kleeorin, Rogachevskii, Cowley and Mcwilliams2008a
). The velocity field is forced at
 $k=6{\rm\pi}$
to a level
$k=6{\rm\pi}$
to a level
 $u_{rms}\approx 0.8$
, using the same non-helical
$u_{rms}\approx 0.8$
, using the same non-helical
 ${\bf\sigma}_{\boldsymbol{u}}$
as detailed in the main text. Keeping
${\bf\sigma}_{\boldsymbol{u}}$
as detailed in the main text. Keeping
 $S=2$
, we present cases that are non-rotating,
$S=2$
, we present cases that are non-rotating,
 ${\it\Omega}=0$
, as well as
${\it\Omega}=0$
, as well as
 ${\it\Omega}=4/3$
(Keplerian), and
${\it\Omega}=4/3$
(Keplerian), and
 ${\it\Omega}=4$
, with the rotation added through the mean Coriolis force. As discussed in Paper II, this change in
${\it\Omega}=4$
, with the rotation added through the mean Coriolis force. As discussed in Paper II, this change in
 ${\it\Omega}$
causes
${\it\Omega}$
causes
 ${\it\eta}_{yx}$
to change sign due to the
${\it\eta}_{yx}$
to change sign due to the
 ${\it\Omega}\times J$
(or Rädler) effect. We have run 10 simulations at each parameter set from
${\it\Omega}\times J$
(or Rädler) effect. We have run 10 simulations at each parameter set from
 $t=0$
to
$t=0$
to
 $t=1000,$
although the rotating cases saturate earlier (
$t=1000,$
although the rotating cases saturate earlier (
 ${\it\Omega}=4/3$
at
${\it\Omega}=4/3$
at
 $t\approx 900$
,
$t\approx 900$
,
 ${\it\Omega}=4$
at
${\it\Omega}=4$
at
 $t\approx 500$
) due to faster dynamo growth. Note that the ratio of
$t\approx 500$
) due to faster dynamo growth. Note that the ratio of
 $B_{y}$
to
$B_{y}$
to
 $B_{x}$
in these simulations (
$B_{x}$
in these simulations (
 ${\sim}10\rightarrow 30$
during growth) is somewhat higher than that for the magnetically driven dynamos studied in § 3.2; thus, if anything, one might expect larger systematic errors in these simulations than the estimates given in § 3.1.
${\sim}10\rightarrow 30$
during growth) is somewhat higher than that for the magnetically driven dynamos studied in § 3.2; thus, if anything, one might expect larger systematic errors in these simulations than the estimates given in § 3.1.
Measured transport coefficients for
 $\mathit{Re}=\mathit{Rm}=100$
shearing box simulations (as described in the text). (a)
$\mathit{Re}=\mathit{Rm}=100$
shearing box simulations (as described in the text). (a)
 ${\it\eta}_{xx}$
, (b)
${\it\eta}_{xx}$
, (b)
 ${\it\eta}_{yx}$
. Squares, circles and triangles show
${\it\eta}_{yx}$
. Squares, circles and triangles show
 ${\it\Omega}=0$
,
${\it\Omega}=0$
,
 ${\it\Omega}=4/3$
and
${\it\Omega}=4/3$
and
 ${\it\Omega}=4$
respectively, with the hollow markers illustrating those measured from each simulation. The mean of these measurements is shown by the solid coloured marker, with its error shown with the shaded circle (calculated from the standard deviation). Test-field method results, against which least squares results should be compared, are illustrated by black markers, with the shaded area showing the error in these measurements. (We have also included the measured
${\it\Omega}=4$
respectively, with the hollow markers illustrating those measured from each simulation. The mean of these measurements is shown by the solid coloured marker, with its error shown with the shaded circle (calculated from the standard deviation). Test-field method results, against which least squares results should be compared, are illustrated by black markers, with the shaded area showing the error in these measurements. (We have also included the measured
 ${\it\alpha}$
values here, although in all cases these are zero to within error.)
${\it\alpha}$
values here, although in all cases these are zero to within error.)
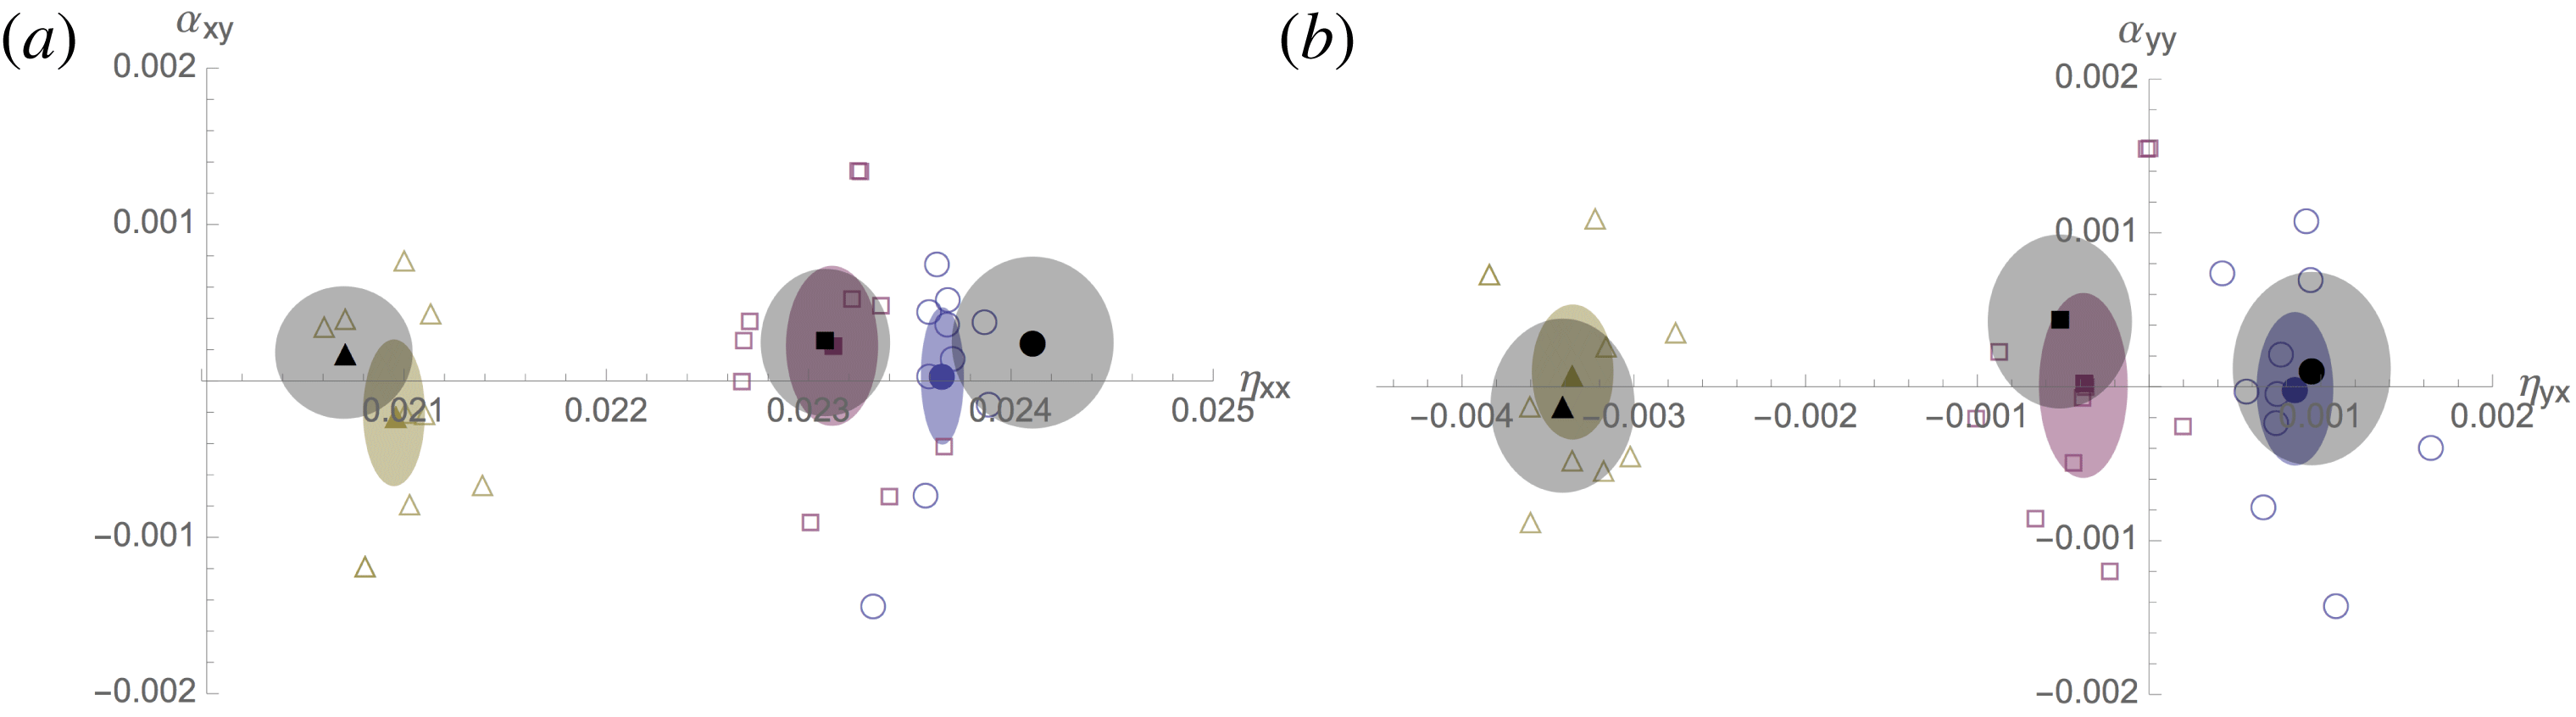
Test-field calculations are conducted as discussed in § 3.1. Due to the lack of a small-scale dynamo, the
 $\boldsymbol{b}$
fluctuations quickly reach a steady state, and an average of
$\boldsymbol{b}$
fluctuations quickly reach a steady state, and an average of
 $\boldsymbol{{\mathcal{E}}}$
is taken over
$\boldsymbol{{\mathcal{E}}}$
is taken over
 $t=0\rightarrow 1600$
to obtain
$t=0\rightarrow 1600$
to obtain
 ${\it\eta}_{xx}$
and
${\it\eta}_{xx}$
and
 ${\it\eta}_{yx}$
. Errors are obtained through the standard deviation of the mean after dividing the data set into
${\it\eta}_{yx}$
. Errors are obtained through the standard deviation of the mean after dividing the data set into
 $100$
bins (
$100$
bins (
 $\pm$
values indicate the
$\pm$
values indicate the
 $95\,\%$
confidence interval). Results from the test-field method, which we consider as the reference values against which to compare coefficients obtained using the fitting method, are illustrated in figure 8 in black. These values are comparable (in the ratio of
$95\,\%$
confidence interval). Results from the test-field method, which we consider as the reference values against which to compare coefficients obtained using the fitting method, are illustrated in figure 8 in black. These values are comparable (in the ratio of
 ${\it\eta}_{xx}$
to
${\it\eta}_{xx}$
to
 ${\it\eta}_{yx}$
) to those obtained in previous work for the non-rotating case (Brandenburg et al.
Reference Brandenburg, Rädler, Rheinhardt and Käpylä2008a
), as well as exhibiting the expected trends (Rädler & Stepanov Reference Rädler and Stepanov2006; Paper II). In all cases the test fields measured
${\it\eta}_{yx}$
) to those obtained in previous work for the non-rotating case (Brandenburg et al.
Reference Brandenburg, Rädler, Rheinhardt and Käpylä2008a
), as well as exhibiting the expected trends (Rädler & Stepanov Reference Rädler and Stepanov2006; Paper II). In all cases the test fields measured
 ${\it\alpha}_{ij}$
are zero to within error (see figure 8).
${\it\alpha}_{ij}$
are zero to within error (see figure 8).
Results obtained by using the projection method on the self-consistent MHD simulations are also illustrated in figure 8. The transport coefficients
 $({\it\alpha}_{xy},{\it\alpha}_{yy},{\it\eta}_{xx},{\it\eta}_{yx})$
are measured as described in § 3.1 for the duration of each simulation, excluding times after which the dynamo has saturated. Because of the long averaging time in comparison to the
$({\it\alpha}_{xy},{\it\alpha}_{yy},{\it\eta}_{xx},{\it\eta}_{yx})$
are measured as described in § 3.1 for the duration of each simulation, excluding times after which the dynamo has saturated. Because of the long averaging time in comparison to the
 $\mathit{Rm}=2000$
measurements presented in § 3.2, the spread of values between different simulations is quite small. It is seen that the measured coefficients agree with the test-field calculations to within error margins in all cases. The largest discrepancy is in
$\mathit{Rm}=2000$
measurements presented in § 3.2, the spread of values between different simulations is quite small. It is seen that the measured coefficients agree with the test-field calculations to within error margins in all cases. The largest discrepancy is in
 ${\it\eta}_{xx}$
at
${\it\eta}_{xx}$
at
 ${\it\Omega}=0$
, which may be related to the vorticity dynamo (i.e. mean flow generation) that develops without rotation (the difference is still only of the order of
${\it\Omega}=0$
, which may be related to the vorticity dynamo (i.e. mean flow generation) that develops without rotation (the difference is still only of the order of
 $1\,\%$
). Note that a growing dynamo is observed in all of the self-consistent simulations, and at
$1\,\%$
). Note that a growing dynamo is observed in all of the self-consistent simulations, and at
 ${\it\Omega}=0$
this is purely due to a stochastic-
${\it\Omega}=0$
this is purely due to a stochastic-
 ${\it\alpha}$
effect (as discussed in Paper II), since the measured transport coefficients indicate the dynamo should be stable. We can thus be sure that the fitting method is not somehow measuring a property of the dynamo growth rate rather than coherent transport coefficients.
${\it\alpha}$
effect (as discussed in Paper II), since the measured transport coefficients indicate the dynamo should be stable. We can thus be sure that the fitting method is not somehow measuring a property of the dynamo growth rate rather than coherent transport coefficients.