

Introduction
Therian mammals comprise the Metatheria and Eutheria, represented today by the crown clades marsupials and placentals, respectively, and belong to the boreosphenidan clade of tribosphenic mammals that is thought to have originated on the northern landmass of Laurasia (Luo et al. Reference Luo, Cifelli and Kielan-Jaworowska2001; Williamson et al. Reference Williamson, Brusatte and Wilson2014). However, despite their shared evolutionary history, marsupials and placentals have disparate modern diversities. Extant placentals comprise more than 5000 species in 20 orders and are a globally distributed group, whereas extant marsupials comprise approximately 330 species belonging to 7 orders (Reeder et al. Reference Reeder, Helgen and Wilson2007). Extant marsupials are also more limited in ecomorphological diversity (Sears Reference Sears2004; Bennett and Goswami Reference Bennett and Goswami2013) and in geographical distribution (Lillegraven Reference Lillegraven1974), which is today limited to three continents. Despite dominating the Australian mammalian fauna, marsupials are found additionally only in South and Central America (approximately 90 species) and have one species, Didelphis virginiana, in North America (Wilson and Reeder Reference Wilson and Reeder2005; Reeder et al. Reference Reeder, Helgen and Wilson2007), which only invaded the continent in the last 1 Myr (Woodburne Reference Woodburne2010).
In contrast to metatherians’ present-day distribution, their fossil record is globally distributed. The earliest metatherian, Sinodelphys szalayi (Luo et al. Reference Luo, Ji, Wible and Yuan2003), is known from the Early Cretaceous Yixian Formation of China. Other Early Cretaceous metatherians have been found elsewhere in Asia and in Europe, but their greatest Cretaceous diversity occurs in North America, where they outnumbered eutherians prior to the Cretaceous/Paleogene (hereafter, K/Pg) mass extinction (Cifelli and Davis Reference Cifelli and Davis2003; Williamson et al. Reference Williamson, Brusatte and Wilson2014).The ecological diversity of extinct metatherians has also been proposed to be higher than present, with enigmatic forms such as Thylacosmilus (Riggs Reference Riggs1934), a sabertoothed marsupial from the Pliocene of South America; Diprotodon (Owen Reference Owen1838), a hippopotamus-sized Australian herbivore; and the “marsupial woodpecker” Yalkaparidon (Archer et al. Reference Archer, Hand and Godthelp1988; Beck Reference Beck2009).
Multiple factors have been proposed as the drivers of the marked differences in the extant biodiversity of the two therian sister clades. In particular, the consequences of the marsupial reproductive strategy and current geographic distribution have been discussed at length (Lillegraven Reference Lillegraven1974, Reference Lillegraven1975; Sears Reference Sears2004; Sánchez-Villagra Reference Sánchez-Villagra2013; Bennett and Goswami Reference Bennett and Goswami2013; Goswami et al. Reference Goswami, Randau, Polly, Weisbecker, Bennett, Hautier and Sánchez-Villagra2016), although the latter in particular has not been robustly tested. The low taxonomic and morphological diversity of Metatheria have been attributed to developmental constraints stemming from their short gestation period and subsequent crawl to the pouch and lengthy period of suckling. These requirements have been implicated in restricting novel morphologies, because of the need for early-functioning mouthparts and forelimbs (Lillegraven Reference Lillegraven1975; Sears Reference Sears2004; Kelly and Sears Reference Kelly and Sears2011; Bennett and Goswami Reference Bennett and Goswami2013; Goswami et al. Reference Goswami, Randau, Polly, Weisbecker, Bennett, Hautier and Sánchez-Villagra2016). Additionally, physiological hypotheses such as lower energy efficiency of the marsupial reproductive mode, which has been suggested to limit their reproductive rate compared with placentals (Lillegraven Reference Lillegraven1975; Morton et al. Reference Morton, Recher, Thompson and Braithwaite1982), and lower basal metabolic rate (BMR) in marsupials versus placentals (Goin et al. Reference Goin, Woodburne, Zimicz, Martin and Chornogubsky2016, and references there in) have also been suggested to play a role in constraining diversity. Conversely, Sánchez-Villagra (Reference Sánchez-Villagra2013) postulated that the restriction of marsupials to the southern continents has constrained their ecological opportunities relative to the placental mammals that currently dominate the northern continents. This idea, however, fails to explain the observation that extant placental orders had already appeared by the Eocene, at which time metatherian mammals still persisted on northern continents. Indeed, as noted earlier, metatherians outnumbered eutherians in North America during an extensive portion of the Cretaceous. Thus, for a significant section of their Cenozoic evolutionary histories (until the disappearance of Laurasian metatherians in the Miocene), Metatheria declined and Eutheria thrived, despite both clades being exposed to the same changing environments.
A few recent studies have begun to quantify metatherian diversity through time, focusing on key localities or intervals (Cifelli et al. Reference Cifelli, Davis and Sames2014; Williamson et al. Reference Williamson, Brusatte and Wilson2014; Wilson Reference Wilson2013, Reference Wilson2014; Zimicz Reference Zimicz2014; Grossnickle and Newham Reference Grossnickle and Newham2016) or specific clades (e.g., koalas [Black et al. Reference Black, Price, Archer and Hand2014] Reference Wilsonand sparassodonts [Prevosti et al. Reference Prevosti, Forasiepi and Zimicz2013]). However, to date, all of these studies (with the exception of three recent papers focusing on the Cretaceous–Paleogene interval: Wilson Reference Wilson2014; Grossnickle and Newham Reference Grossnickle and Newham2016; Longrich et al. Reference Longrich, Scriberas and Wills2016) have examined raw taxonomic diversity, without considering biases in the fossil record. The fossil record is inherently incomplete, as fossilization of organisms only occurs under very particular environmental conditions (Padian and Clemens Reference Padian and Clemens1985; Badgley Reference Badgley2003; Vermeij and Leighton Reference Vermeij and Leighton2003; Kalmar and Currie Reference Kalmar and Currie2010). There is also general agreement that the fossil record includes a number of potentially nonrandom sampling biases reflecting both geological and anthropogenic factors (Alroy et al. Reference Alroy, Marshall, Bambach, Bezusko, Foote, Fürsich, Hansen, Holland, Ivany, Jablonski, Jacobs, Jones, Kosnik, Lidgard, Low, Miller, Novack-Gottshall, Olszewski, Patzkowsky, Raup, Roy, Sepkoski, Sommers, Wagner and Webber2001, Reference Alroy, Aberhan, Bottjer, Foote, Fürsich, Harries, Hendy, Holland, Ivany, Kiessling and Kosnik2008; Peters and Foote Reference Peters and Foote2001; Crampton et al. Reference Crampton, Beu, Cooper, Jones, Marshall and Maxwell2003; Fastovsky et al. Reference Fastovsky, Huang, Hsu, Martin-McNaughton, Sheehan and Weishampel2004; Smith and McGowan Reference Smith and McGowan2007; Uhen and Pyenson Reference Uhen and Pyenson2007; Fröbisch Reference Fröbisch2008; Butler et al. Reference Butler, Barrett, Nowbath and Upchurch2009, Reference Butler, Benson, Carrano, Mannnion and Upchurch2011; Wall et al. Reference Wall, Ivany and Wilkinson2009; Alroy Reference Alroy2010; Benson et al. Reference Benson, Butler, Lindgren and Smith2010; Sahney et al. Reference Sahney, Benton and Ferry2010; Benson and Butler Reference Benson and Butler2011; Benton et al. Reference Benton, Dunhill, Lloyd and Marx2011; Mannion et al. Reference Mannion, Upchurch, Carrano and Barrett2011, Reference Mannion, Benson, Carrano, Tennant, Judd and Butler2015; Lloyd and Friedman Reference Lloyd and Friedman2013; Pearson et al. Reference Pearson, Benson, Upchurch, Fröbisch and Kammerer2013; Smith and Benson Reference Smith and Benson2013; Newham et al. Reference Newham, Benson, Upchurch and Goswami2014; Nicholson et al. Reference Nicholson, Holroyd, Benson and Barrett2015). For example, sedimentary rocks in North America and Europe have been more thoroughly searched for fossils than elsewhere in the world, because paleontology has a more extensive research history in those regions and the necessary resources for fieldwork have historically been more readily available. As a result, the dating of sedimentary deposits, and the systematics of the fossil taxa they contain, are generally better understood in Europe and North America than elsewhere (e.g., Smith and McGowan Reference Smith and McGowan2007; Upchurch et al. Reference Upchurch, Mannion, Benson, Butler and Carrano2011). Moreover, formations located on either side of major extinction events or from other geologically significant periods of time are likely to receive greater attention from paleontologists, and thus can be better sampled than portions of the fossil record that are perceived to be less “spectacular” (e.g., the apparent peak in dinosaur diversity and sampling, observed shortly before the Cretaceous/Paleogene boundary potentially reflects intense interest in the lead-up to the mass extinction; Upchurch et al. Reference Upchurch, Mannion, Benson, Butler and Carrano2011). Thus, fluctuations in diversity observed directly in the fossil record could simply reflect variation in sampling intensity rather than true evolutionary change. Consequently, previous attempts to establish patterns in metatherian diversity should be treated with caution, because they have generally not accounted for potential biases in the fossil record.
Two recent works have analyzed aspects of metatherian diversity using techniques that attempt to account for the uneven sampling of the fossil record (Grossnickle and Newham Reference Grossnickle and Newham2016; Longrich et al. Reference Longrich, Scriberas and Wills2016). These studies, however, did not examine metatherian diversity in its own right, but rather included this clade in larger data sets dealing with either all mammals (Longrich et al. Reference Longrich, Scriberas and Wills2016) or Theria (Grossnickle and Newham Reference Grossnickle and Newham2016). Moreover, both of these analyses focused on the K/Pg mass extinction, and that by Longrich et al. (Reference Longrich, Scriberas and Wills2016) dealt solely with North America. Thus, while both of these studies yield valuable insights into metatherian diversity (see “Discussion”), they do not provide the global and regional perspectives over an extended portion of evolutionary history presented by the current work.
In short, despite the increasing variety and complexity of approaches to elucidating macroevolutionary patterns in past diversity (discussed in detail below), no robust, comprehensive, and quantitative analysis of metatherian diversity spanning their evolutionary history is currently available. To address this deficit, we present here a new data set on metatherian fossil occurrences based on an extensive survey of the literature. This data set is analyzed using standard rarefaction and a modified version of shareholder quorum subsampling (SQS) to produce sampling-corrected global paleodiversity estimates for metatherians throughout the Cretaceous to Pliocene interval. Finally, the resulting inferences concerning metatherian paleodiversity are placed in the wider context of previous studies of the group and global environmental change during the Cretaceous and Cenozoic.
Materials and Methods
Taxonomic Level
The choice of taxonomic level for diversity analysis has important implications for studies of extinction and origination rates, as species are shorter lived than genera, and genera are in turn shorter lived than families. Diversity is analyzed here at the genus level, because this information is available for almost every published fossil. Moreover, the use of genera can increase the amount of occurrence data available for paleodiversity analysis, because it allows the inclusion of specifically indeterminate fossils (e.g., Mannion et al. Reference Mannion, Benson, Carrano, Tennant, Judd and Butler2015).
Data Collection and Management
Data within the Paleobiology Database (PaleobioDB: https://paleobiodb.org/#), while substantial for certain taxonomic groups (e.g., marine invertebrates and dinosaurs), are lacking where mammals are concerned, particularly for those located outside the United States and for the post-Paleocene Cenozoic. Speed of data entry into the PaleobioDB and restrictions on the entry format for data, made the creation of an Access database (from which our data sets were extracted) a faster and more flexible approach here. It is the authors’ hope that the current data set will be entered into the PaleobioDB at a later date for the benefit of the wider paleontological community.
A comprehensive data set detailing published metatherian fossil finds (i.e., specimens) has been collated, including: genus name; fossil site; geographic location; and geological epoch and subepoch (where possible). Several resources were used to search for information on fossil finds. First, the key words “Metatheria,” “Metatherian,” “Marsupial,” “Fossil,” “Palaeontology,” and “Paleontology” were searched for within ISI Web of Knowledge and Google Scholar, and resources at the Natural History Museum library, London, and the PaleobioDB were also examined. Second, the reference lists of the resulting papers were then searched for relevant publications, and this process was repeated until no additional references were found. Journals in which metatherian fossil publications frequently occurred were also examined by index for any other relevant papers. The database includes all such papers published up to and including December 2016.
Taxonomic names have been corrected where reclassification literature exists, although validity of names was specifically checked for very old publications. Misclassification is, of course, a possibility in some cases because of human error. In the case of older publications and those describing plentiful cave deposits, where information regarding numbers of individual fossils is not explicit, estimates for the minimum number of individuals were recorded according to the available data.
Data not cited in the literature, for example, museum collections databases, could not be included in this study, because they would bias data toward collection efforts by museums with good online resources. Further, the classifications of these specimens have not been peer reviewed, unlike published taxa/specimens, and are thus potentially more prone to misidentification.
Metatherian fossil finds were recorded from their first appearance (~125 Ma) until the end of the Tertiary, specifically excluding the Quaternary record in order to reduce the impact of the “pull of the Recent” (e.g., Jablonski et al. Reference Jablonski, Roy, Valentine, Price and Anderson2003). Excluding Quaternary fossils also restricted the effect of an overwhelming volume of subfossil taxa at many cave deposit sites, which is not seen anywhere else in the fossil record.
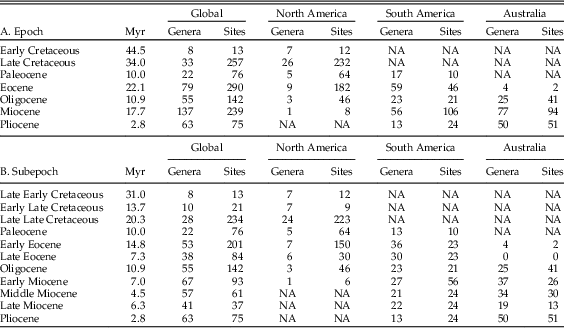
The metatherian fossil records of Asia (13 genera), Europe (8 genera), Africa (1 genus), and Antarctica (7 genera) are extremely limited and thus cannot be subjected to bias-correction techniques to provide region-specific estimates. However, the global (333 genera), North American (44 genera), South American (143 genera), and Australian (Australia, New Guinea, and adjacent islands are here in referred to as “Australian”; 129 genera) records are large enough to be robustly analyzed. Tables 1A and 1B show the number of genera and fossil sites broken down by time bin for the epoch and subepoch data sets. The full data set, comprising 1928 and 1861 occurrences at the epoch and subepoch levels, respectively, for 333 metatherian genera, and the bibliography of the references used to construct this data set, are provided in the Supplementary Data.
Number of genera and fossil sites for the global, North American, South American, and Australian data sets by epoch and subepoch. NA, not applicable, as there are no genera/sites.
Time Bins
Unfortunately, the precision of geological dates for localities bearing metatherian fossils, and mammals more generally, is often limited to the epoch level. Epochs from the Late Cretaceous through to the end Neogene are highly uneven in length, ranging from 34.5 ± 1.2 Ma (Late Cretaceous) to 2.75 Ma (Pliocene). Geologic stages for this interval are much more even, with a maximum difference of only ~10.5 Myr between the Campanian and Piacenzian, but many fewer metatherian fossil sites are dated to the stage level than to the epoch level. However, the ages of some fossil sites, although not assigned to a specific geological stage, have been estimated with a resolution greater than epoch level, that is, “middle Miocene” or “early Eocene”; these designations will be referred to as “subepochs” herein. Stage data can easily be grouped into these categories, providing a reasonable compromise between maximum time frame resolution and the inclusion of a greater number of fossils in the data set.
Local units such as continent-specific land mammal ages were avoided here, mainly because they are referred to in the literature considerably less often than epochs or stages, limiting their usefulness. They also lack definitive correlation across continents. Furthermore, they are based on occurrences of different mammal groups and are thus not independent of mammal diversity. Metatherian fossils that have previously been dated to South American, North American, or European land mammal ages were assigned to the subepoch time bins used here. Where a land mammal age spanned two subepoch bins, it was assigned to the bin covering the majority of its time span.
Cave deposits and fossils that have been transported are difficult to date with much precision, as they are not necessarily the same age as surrounding rocks. For these reasons, the temporal resolution of this study is limited by information available in the literature. There are very few radiometric dates in the literature that describe the fossils themselves. Where formations and beds were given, a literature search was conducted to find more information. Websites such as the U.S. Geological Survey (2013) and the Australian Stratigraphic Units Database (Geoscience Australia and Australian Stratigraphy Commission 2013) were used to fill in these missing data, and for many sites the University of California Museum of Paleontology collections database (2016) held more information than published with the original descriptions of taxa.
It has been argued that subsampling approaches should not be performed on time bins of unequal length because of the intuitive link between time-bin duration and the number of observable taxa (Raup Reference Raup1975; Alroy et al. Reference Alroy, Marshall, Bambach, Bezusko, Foote, Fürsich, Hansen, Holland, Ivany, Jablonski, Jacobs, Jones, Kosnik, Lidgard, Low, Miller, Novack-Gottshall, Olszewski, Patzkowsky, Raup, Roy, Sepkoski, Sommers, Wagner and Webber2001; Alroy Reference Alroy2008). Circumvention of this problem by standardizing time-bin length, however, is limited in practice by the resolution to which fossils are dated (Alroy Reference Alroy2008). In any case, there is some evidence that this issue might not be as serious a concern as previously thought. Mannion et al. (Reference Mannion, Upchurch, Carrano and Barrett2011) found that taxic diversity and sample number shared no statistically significant correlations with stage or epoch length for their sauropod data. The same result was found by Butler et al. (Reference Butler, Benson, Carrano, Mannnion and Upchurch2011) for data sets on the occurrences of all dinosaurs. Nevertheless, to investigate whether uneven time-bin length distorts the true diversity signal for metatherians, we tested for correlations between raw diversity and time-bin length (Supplementary Data). Data were log transformed, and Pearson correlations were then calculated using the ‘Hmisc’ package (Harrell and Dupont Reference Harrell and Dupont2013) in R, Version 3.1.2 (R Development Core Team 2016).
Corrections for Uneven Fossil-Record Sampling
Units of Sampling
A key step in standard rarefaction and SQS is the repeated random drawing of subsamples of the total data set, followed by calculation of the diversity represented within the subsamples. This means that diversity data (e.g., genera or species) have to be linked to units of sampling such as specimens, localities, collections, publications, etc. (Alroy et al. Reference Alroy, Marshall, Bambach, Bezusko, Foote, Fürsich, Hansen, Holland, Ivany, Jablonski, Jacobs, Jones, Kosnik, Lidgard, Low, Miller, Novack-Gottshall, Olszewski, Patzkowsky, Raup, Roy, Sepkoski, Sommers, Wagner and Webber2001, Reference Alroy, Aberhan, Bottjer, Foote, Fürsich, Harries, Hendy, Holland, Ivany, Kiessling and Kosnik2008; Bush et al. Reference Bush, Markey and Marshall2004; Alroy Reference Alroy2010). However, consistent grouping of the metatherian fossil record into “localities” or “collections” is challenging for several reasons. Finds from several field seasons are frequently grouped together, especially when the paper describes a fauna or names a new species (e.g., Travouillon et al. Reference Travouillon, Gurovich, Beck and Muirhead2010). On other occasions, particularly in older papers, but also often for more recent fossils that are not found in lithified sediments, the exact location of the specimen is not well defined (e.g., Flannery et al. Reference Flannery, Turnbull, Rich and Lundelius1987; Pledge Reference Pledge1987). Quite frequently, fossils are assigned to a fauna rather than to a lithology or exact site (e.g., Muirhead et al. Reference Muirhead, Dawson and Archer1997; Hocknull Reference Hocknull2005). The varying detail among papers also creates the potential for overlap or separation of sampling units. For these reasons, site names and/or descriptions are more consistently available in the literature. Hence, we used fossil site names and/or location descriptions as the randomly drawn units for our subsampling methods.
The subepoch-level data used in the rarefaction and SQS analyses described in the following sections are presented in Supplementary Data.
Rarefaction
Rarefaction, a relatively simple subsampling technique, has been used extensively in taxonomic diversity research (e.g., Raup Reference Raup1972, 1975Reference Lillegraven, Reference Raup1979; Miller and Foote Reference Miller and Foote1996; Alroy et al. Reference Alroy, Marshall, Bambach, Bezusko, Foote, Fürsich, Hansen, Holland, Ivany, Jablonski, Jacobs, Jones, Kosnik, Lidgard, Low, Miller, Novack-Gottshall, Olszewski, Patzkowsky, Raup, Roy, Sepkoski, Sommers, Wagner and Webber2001, Reference Alroy, Aberhan, Bottjer, Foote, Fürsich, Harries, Hendy, Holland, Ivany, Kiessling and Kosnik2008; Fastovsky et al. Reference Fastovsky, Huang, Hsu, Martin-McNaughton, Sheehan and Weishampel2004; Mannion et al. Reference Mannion, Upchurch, Carrano and Barrett2011). It involves drawing a random sample of individuals (individual based) or groups of individuals (sample based) from the entire data set to generate an expected number of taxa according to the level of sampling intensity (Raup Reference Raup1975; Miller and Foote Reference Miller and Foote1996).
Here we conducted sample-based rarefaction by randomly selecting fossil sites up to the maximum number of sites in the time bin with the fewest fossil sites, using bespoke code (Supplementary Text 1) written in R, Version 3.1.2 (R Development Core Team 2016). The number of genera present in these localities was then tallied to give a subsampled diversity estimate. This subsampling for each time bin was repeated 1000 times, and the mean genus count was plotted to produce a diversity curve. The 95% confidence intervals around the mean were also calculated.
SQS
SQS is an alternative, more sophisticated sampling standardization method (Alroy Reference Alroy2010 Reference Woodburne) that has been widely used in recent years (e.g., Newham et al. Reference Newham, Benson, Upchurch and Goswami2014; Brusatte et al. Reference Brusatte, Butler, Barrett, Carrano, Evans, Lloyd, Mannion, Norell, Pepp, Upchurch and Williamson2015; Mannion et al. Reference Mannion, Benson, Carrano, Tennant, Judd and Butler2015; Nicholson et al. Reference Nicholson, Holroyd, Benson and Barrett2015; Grossnickle and Newham Reference Grossnickle and Newham2016). SQS builds on the principle of rarefaction, but differs from the latter by taking into account the relative abundance (also known as the “frequency”) of each taxon. For each time interval, taxa are assigned frequency values according to the proportion of collections lists in which they appear. Collections lists are drawn in the same manner as detailed above until a user-defined threshold or “quorum” (the summed frequency of the unique taxa drawn) is reached. Additionally, to avoid biasing the results against intervals with particularly poor sampling, each time bin is assigned a value that estimates “coverage” (Good’s U) that reflects the proportion of “singleton” taxa (Good Reference Good1953). Good’s U ranges between 1 and 0, where a value of 1 means that all taxa in the time bin are known from at least two collections, and a value of 0 means that all taxa are each known only from one collection (i.e., they are singletons). Thus, time bins with lower Good’s U values can be regarded as having poorer coverage (i.e., they are more poorly sampled), and so we should sample them more heavily to compensate for this. Good’s U is thus used to correct the target quorum in order that intervals with poor initial coverage are sampled more heavily.
To account for further biases, two adjustments are then made that potentially have the most impact on small and idiosyncratic data sets (Alroy Reference Alroy2010: p. 1217). First, the most common taxon in each time bin, if drawn during sampling, is excluded from the frequency calculation, though still counted in the diversity estimation. Second, singletons belonging to the most diverse “collection” in any one time bin are excluded from the singleton count used to calculate coverage. This modification aims to ameliorate the distortions caused by fossil sites with exceptional preservation (Lagerstätten). The latter modification is needed, because rare taxa are more likely to be preserved in Lagerstätten than elsewhere, thus lowering the apparent coverage of that time bin. This could result in genuinely well-sampled time bins with Lagerstätten appearing to be poorly sampled because of their lower Good’s U scores, causing SQS to oversample them and therefore produce an artificially high peak in estimated diversity.
Alroy (Reference Alroy2010 Reference Woodburne) additionally adjusted the results of SQS by applying a “three-timer” equation to avoid the Signor-Lipps effect (Signor and Lipps Reference Signor and Lipps1982) and the pull of the Recent. This involves estimating the sampling probability of each time bin using the following equation:
 $$P_{s} \, {\equals}\, {}^{3}t\!/\!\left( {^{3} t\, {\plus}\, ^{{\rm P}} t} \right)$$
where P s is the sampling probability, 3 t is the number of three-timer taxa (i.e., taxa that occur in the time bin in question, as well as in the time bins immediately before and after), and P t is the number of part-timers (i.e., taxa appearing in the bins immediately before and after but not in the bin in question).
Although accounting for these factors is important, the way in which the adjustments are executed in Alroy’s (Reference Alroy2010) methodology might oversimplify some aspects of variation in sampling. For example, there is no reason to expect that there would be only one Lagerstätte site in each time bin, or that every time bin includes a Lagerstätte. To better reflect the metatherian fossil record, we therefore created diversity curves globally and by continent using Alroy’s SQS method with the following modification. As an alternative to Lagerstätten, “prolific” sites are determined a priori by taking into account two possible indicators of exceptional preservation: number of specimens and number of genera recorded for each fossil site. These measures are calculated for each site as a proportion of the total count of each for the entire data set and summed to give one value for each site. For example, suppose site X has produced 10 genera and 1000 specimens, and the total number of genera and specimens in the data set is 100 and 5000, respectively. Site X has 0.1 of the genera and 0.2 of the specimens, and so has a total score of 0.3. The sites for which this value is greater than 3 standard deviations away from the mean are considered prolific sites. These sites are then treated in the same manner as Alroy’s “most diverse site” in each time bin by excluding their singleton occurrences in the coverage calculation.
The target sampling level for all analyses was set at 0.3, except for South America, which was set at 0.1 due to extremely low coverage (Good’s U is 0.16) in the Paleocene (although see diversity curve set at 0.3 for relative comparison of Eocene–Pliocene in Supplementary Data). A target of 0.3 is lower than recommended by Alroy (Reference Alroy2010), who advised that quorum levels of 0.4–0.7 were likely to produce the best results. However, the frequency of the North American Oligocene genus Herpetotherium is 0.68: once this most abundant taxon is excluded (and given that Good’s U is nearly 1 for this region and time bin), the target sampling level cannot be higher than 0.3. In addition, as there is only one genus (again Herpetotherium) in the early Miocene of North America, SQS cannot be used to estimate diversity for this time bin. The Eocene of Australia was also excluded from SQS analysis, as Good’s U is 0. All SQS analyses were conducted in R, Version 3.1.2, and code with the “prolific site” modification is provided in Supplementary Text 2.
Taxonomic Rates and Sampling Probability
Taxonomic origination and extinction rates, along with sampling probability, are crucial metrics for understanding diversity patterns in evolution. Here we employed the method devised by Alroy (Reference Alroy2008), that standardizes data using three-timer rates. This method is based on the relative proportions of taxa appearing before and after the interval in question, as in the previously mentioned rates calculations, accounting for the overall sampling probability as follows:
 $${\rm extinction}\,{\rm rate}\, {\equals}\, {\rm log}\left( {^{{\rm 2}} t_{i} \!/^{{\rm 3}} t} \right){\plus}{\rm log}\left( {P_{{\rm s}} } \right)$$
 $${\rm origination}\,{\rm rate}\, {\equals}\, {\rm log}\left( {^{{\rm 2}} t_{i} _{{{\plus}{\rm 1}}} \!/^{{\rm 3}} t} \right){\rm }{\plus}{\rm log}\left( {P_{{\rm s}} } \right)$$
where 2 t i represents the number of taxa sampled immediately before and within the ith bin; 2 t i+1 represents the number of taxa within and immediately after the ith bin; and 3 t and P s as in eq. 1. The calculation for sampling probability assumes that sampling standardization has been successful (thus P s is constant) and that it is not systematically correlated with origination or extinction rates. However, the approach in Alroy (Reference Alroy2008) proceeds to correct for possible sampling discrepancies through time by calculating P s according to time bin, that is, using values of 3 t and P t specific to the (i+1)th and (i−1)th bins for extinction and origination, respectively.
This method for calculating origination (eq. 3) and extinction rates (eq. 2) improves upon that of Foote (Reference Foote2001), in that it reduces the Signor-Lipps effect. However, this effect might not always be significant; for example, in their study of size-related evolutionary rates in Neogene Old World mammals, Liow et al. (Reference Liow, Fortelius, Bingham, Lintulaakso, Mannila, Flynn and Stenseth2008) used Foote’s (Reference Foote2001) equation without correcting for forward and backward survivorship, because preservation rate biases were small, thus reducing the Signor-Lipps effect through time and not distorting the overall pattern of rates. Nevertheless, for larger time periods and global studies, such as the analyses here, preservation rates are an important consideration in the accurate estimation of taxonomic rates. Furthermore, Alroy’s technique is computationally simpler than Foote’s modeling approach and probably more accurate, because it is based on a larger amount of real data rather than just the first and last appearances of taxa.
Results
Time-Bin Length versus Observed Diversity
At the epoch level, no significant correlations were found between time-bin length and raw diversity for the global, North American, or South American data sets (Supplementary Data). The Australian fossil record did not span enough epochs to calculate a correlation between time-bin length and raw diversity. A similar absence of correlation between time-bin length and diversity occurs in all subepoch data sets, including that for Australia (Supplementary Data).
Therefore, although caution is required, these results suggest that it is valid to analyze the diversity of Metatheria using the available time bins of unequal length. In any case, as we noted earlier, any analysis of metatherian diversity currently requires use of these broad and uneven time bins pending more precise dating of much of this clade’s fossil record.
Metatherian Raw Taxic Diversity
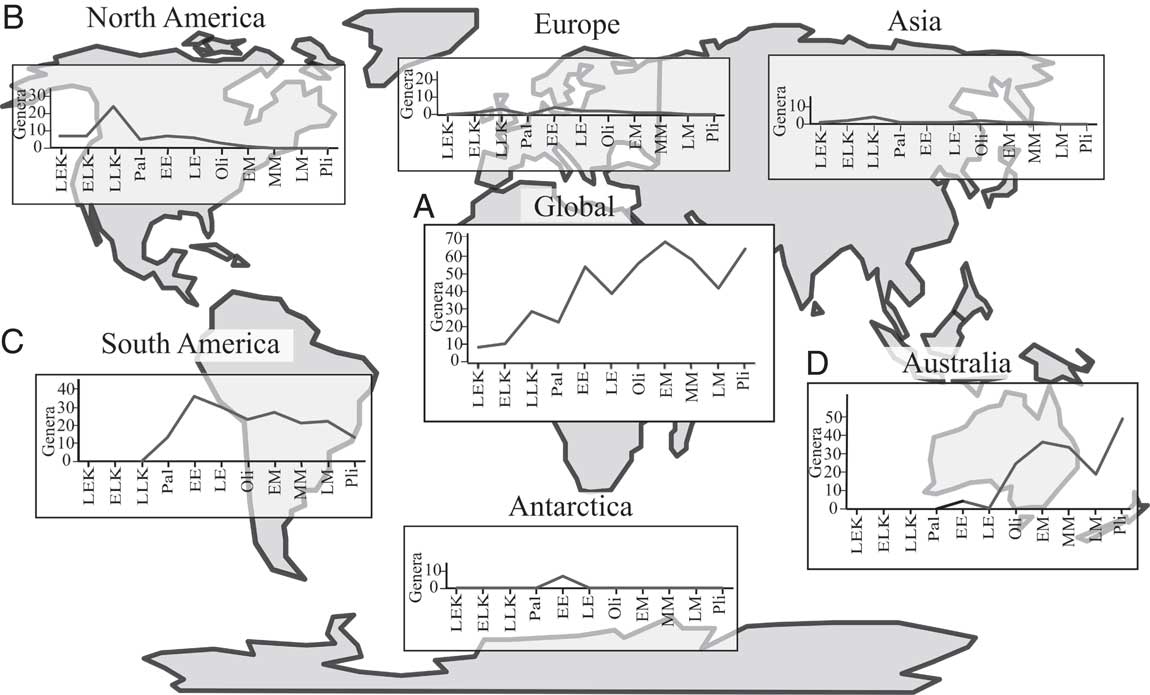
Raw metatherian taxic diversity increases from their first appearance in the Early Cretaceous to the end of the Pliocene, with notable peaks in the latest Cretaceous, early Eocene, early Miocene, and Pliocene and troughs in the Paleocene, late Eocene, and late Miocene (Fig. 1A). There is a dramatic drop in North American raw taxic diversity in the Paleocene following a considerable peak in the latest Cretaceous (Fig. 1B). Raw South American diversity peaks in the early Eocene, falls during the Oligocene, and rises again in the early Miocene. Diversity declines in the middle Miocene and is lowest in the Pliocene (Fig. 1C). Australian raw taxic diversity increases greatly between the Eocene and Oligocene, peaks in the early Miocene, declines throughout the remainder of the Miocene, and rises again to a maximum in the Pliocene (Fig. 1D).
Raw genus counts for Metatheria through time by subepoch for each continent and globally. EE, early Eocene; EK, Early Cretaceous; ELK, early Late Cretaceous; EM, early Miocene; LE, late Eocene; LEK; late Early Cretaceous; LLK, late Late Cretaceous; LK, Late Cretaceous; LM, late Miocene; MM, middle Miocene; Oli, Oligocene; Pal, Paleocene; Pli, Pliocene.
Rarefaction
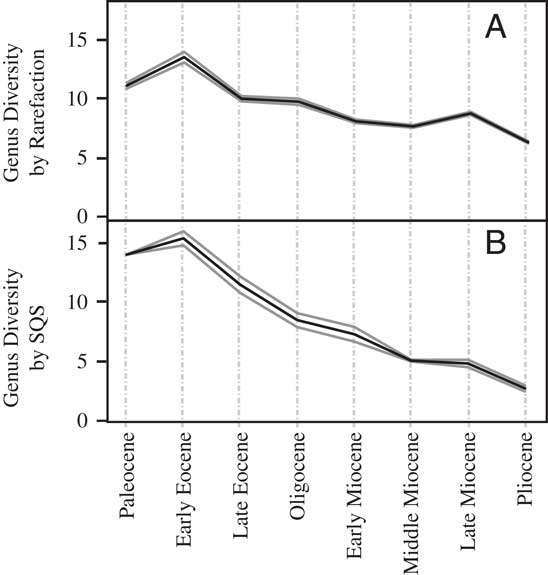
In contrast to the raw global diversity curve (Fig. 1A), the subepoch-resolution global rarefaction curve (Fig. 2A) shows a gentle rise between the Paleocene and Oligocene, although a similar peak in the early Miocene is shown. Diversity declines in the middle Miocene, rises in the late Miocene, and is followed by a slight drop to the Pliocene. The rarefaction analysis for North America (Fig. 3A) shows a rise from the early Late Cretaceous to a peak in the latest Cretaceous, a steep fall in the Paleocene, a slight rise to an Eocene plateau, and then a subsequent fall to the Miocene. The South American rarefaction curve (Fig. 4A) shows a rise to a maximum in the early Eocene and then a general decline in diversity through time, but with a slight rise in diversity in the late Miocene. Rarefaction of the Australian metatherian record (Fig. 5A) depicts diversity rising from the Oligocene to the early Miocene, falling in the middle Miocene, rising again in the late Miocene, and falling in the Pliocene.
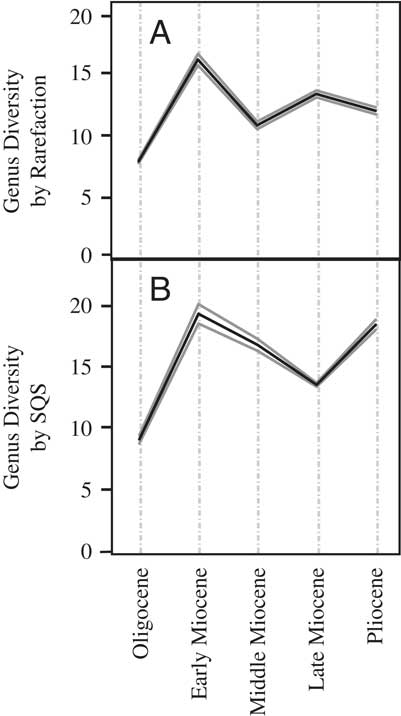
Classic rarefaction (A) and SQS sampling at 0.3 quorum level (B) of global metatherian genus diversity by number of fossil sites by subepoch. Solid gray lines represent 95% confidence intervals.

Classic rarefaction (A) and SQS sampling at 0.3 quorum level (B) of North American metatherian genus diversity by number of fossil sites by subepoch. Solid gray lines represent 95% confidence intervals.

Classic rarefaction (A) and SQS sampling at 0.1 quorum level (B) of South American metatherian genus diversity by number of fossil sites by subepoch. Solid gray lines represent 95% confidence intervals.
Classic rarefaction (A) and SQS sampling at 0.3 quorum level (B) of Australian metatherian genus diversity by number of fossil sites by subepoch. Solid gray lines represent 95% confidence intervals.
SQS
As with rarefaction, the SQS curves bear little resemblance to raw data curves (compare Figs. 1A and 2B). The global SQS curve (Fig. 2B) also contrasts with that produced by rarefaction (Fig. 2A), most notably in the Paleocene, where the former suggests that there was a rise in diversity from the Late Cretaceous. The SQS reconstruction of metatherian diversity patterns includes a plateau through the Late Cretaceous, the sharp rise to the Paleocene just noted, and a gentler rise to the early Eocene and fall to the late Eocene. Diversity then rises steeply to its maximum in the early Miocene, decreases sharply to a late Miocene trough, and then rises into the Pliocene.
For the North American record, SQS diversity rises from the Early Cretaceous to a Late Cretaceous plateau before dropping in the Paleocene (Fig. 3B). Diversity rises to a late Eocene peak before falling in the Oligocene and early Miocene (Fig. 3B). The South American SQS curve (Fig. 4B) begins with high diversity in the Paleocene, rising slightly in the early Eocene, and then decreasing continually to its lowest diversity in the Pliocene. The Australia SQS diversity curve (Fig. 5B) shows an increase in diversity between the Oligocene and its early Miocene peak. Diversity declines to the late Miocene but then rises again in the Pliocene.
Origination, Extinction, and Preservation
Origination and extinction rates (Table 2) were calculated for the early and late Eocene; Oligocene; and the early, middle, and late Miocene. Origination rate and extinction rate could not be calculated for the Late Cretaceous or Paleocene using the method of Alroy (Reference Alroy2008), because there are no three-timer (3 t) genera (i.e., taxa that appeared before, after, and in the Paleocene time bin). Although Alroy (Reference Alroy2015) has more recently proposed a new method that does not rely on 3 t genera, this is even less suitable for our data (see Supplementary Data for comparison of results). Origination and extinction rates also could not be calculated for the late Early Cretaceous and Pliocene time bins, because there are no earlier or later data, respectively, in our data set. Of the intervals for which we could calculate rates, origination rate was highest in the early Eocene and lowest in the early Miocene. Extinction rate was highest in the late Miocene and lowest in the early Miocene.
Global preservation, origination, and extinction rates by epoch. Rates are calculated according to Alroy (Reference Alroy2008). Rates marked as not applicable (NA) where they could not be calculated.
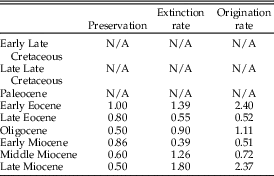
Preservation rates (Table 2 and Supplementary Data) could not be calculated using Alroy’s (Reference Alroy2008) method for the Late Cretaceous or Paleocene because of the lack of three-timers already mentioned. Where this rate could be estimated, it was lowest in the late Miocene and Oligocene (50%). Rates of preservation were highest in the early Miocene (86%) and early Eocene (100%), where there are no genera present in the Paleocene or late Eocene that are not also represented in the early Eocene.
Discussion
Methodological Issues
Despite some similarity between the two sample standardization methods applied here, there are several clear discrepancies, as noted earlier. The global Paleocene, late Eocene, and late Miocene (Fig. 2), North American early Late Cretaceous and late Eocene (Fig. 3), and the Australian late Miocene (Fig. 5) diversity patterns are reconstructed rather differently by the two approaches. These differences raise the question of whether one of the methods, and therefore its results, should be preferred over the other. If all genera occurred equally frequently (i.e., within the same proportion of fossil sites) in the time bin in question, or each fossil site comprised groups of genera with similarly varied frequencies and there were the same proportion of singletons in each time bin, then SQS and rarefaction would produce the same diversity curves. As this is clearly not the case (Fig. 6 and Supplementary Data), it is pertinent to investigate the nature of species occurrence frequencies in order to understand which method produces a more accurate estimate of diversity.
Summary of global, North American, South American, and Australian fossil record by subepoch. Bar chart vertical axes represent relative numbers of genera within each subepoch; horizontal axes represent proportion of the total number of metatherian sites for each subepoch in which genera are present. For example, a bar in only the 0.0–0.2 section depicts that all taxa appear in 20% or less of the fossil sites for that subepoch. Pie charts display in black the proportion of singleton occurrences that do not come from prolific sites in each subepoch.
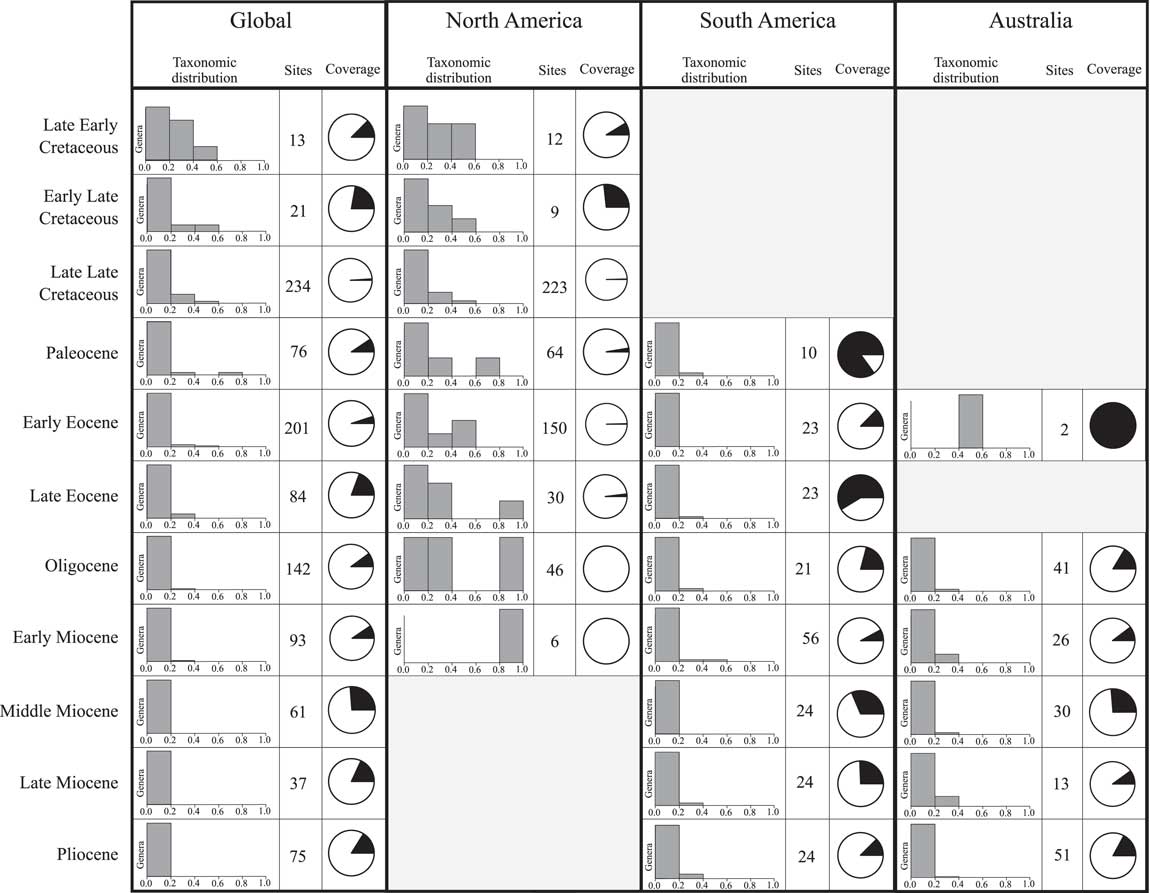
Two key methodological steps particular to SQS probably account for these discrepancies in the results: (1) sampling to a standard “quorum” level based on the cumulative occurrence frequencies of unique taxa drawn; and (2) correction of the sampling level for each time bin depending on the proportion of single-occurrence taxa (Good’s U). Distribution of genus-occurrence frequencies through time is illustrated by the histograms in Figure 6. In the global and North American metatherian record, the Paleocene distribution of occurrence frequencies explains the difference in SQS and rarefaction results. The majority of sites have only one or two unique genera, and Peradectes is present in over half these sites, while most other genera have frequencies of less than 0.02. As the most frequent genus, Peradectes is excluded from the frequency calculation, and thus many genera must be sampled to reach the target cumulative frequency. The North American fossil record also shows varying occurrence frequencies for genera through time (Fig. 6). The proportion of singleton genera not belonging to prolific sites is relatively high in the North American early Late Cretaceous (Fig. 6), thus the target sampling level is higher than for other times. Similarly, in the Australian record, the proportion of singleton genera varies through the Miocene and Pliocene, with the middle Miocene and Pliocene having higher proportions than the late Miocene (Fig. 6). As a result, SQS samples the late Miocene to a lower frequency target than the early and middle Miocene, increasing the number of genera sampled and creating a curve that is markedly different from that produced by the rarefaction analysis. As demonstrated above, the results of rarefaction are more affected by such frequency distributions than SQS results.
A further feature of the metatherian fossil record is the geographic clustering of “prolific sites” through time (Supplementary Data). When applied to the subepoch-level data, our method identified an uneven spread of “prolific sites.” On a global scale, such sites are most numerous in the early Miocene by far (six sites), whereas the late Early Cretaceous, early Late Cretaceous, late Eocene, Oligocene, and Pliocene have only one or none at all. Moreover, the regional (i.e., by continent) occurrence of prolific sites displays little overlap within time bins: for example, time bins that contain a high number of prolific North American sites tend to be different from those containing a high number of prolific South American or Australian sites. Thus, the distribution of prolific sites is highly heterogeneous both temporally and spatially. Given the nature of the available data, it is likely that SQS (especially the version used here, with its modified treatment of Lagerstätte-like localities) will provide a more accurate reconstruction of metatherian diversity patterns than will classic rarefaction (although we note that our data do not allow us to set the target sampling level in SQS as high as that recommended by Alroy [Reference Alroy2010]). For this reason, the following discussion will be based predominantly on the results of SQS.
Metatherian Paleodiversity Patterns
Early Cretaceous
It has been proposed that metatherians had diverged from eutherians by the Oxfordian (160 Ma, based on the earliest eutherian fossils and resulting ghost ranges for metatherians [Luo et al. Reference Luo, Yuan, Meng and Ji2011; Williamson et al. Reference Williamson, Brusatte and Wilson2014]). However, the Jurassic eutherian upon which this view is based has been placed outside of Theria in a recent phylogenetic analysis (Krause et al. Reference Krause, Hoffmann, Wible, Kirk, Schultz, von Koenigswald, Groenke, Rossie, O’Connor, Seiffert and Dumont2014). The earliest confirmed metatherian material occurs in the Early Cretaceous of Asia—Sinodelphys szalayi, an exceptionally well-preserved fossil from the Barremian (Luo et al. Reference Luo, Ji, Wible and Yuan2003). This genus is generally regarded as the sister taxon to all other metatherians (Luo et al. Reference Luo, Ji, Wible and Yuan2003, Reference Luo, Yuan, Meng and Ji2011; Vullo et al. Reference Vullo, Gheerbrant, de Muizon and Néraudeau2009; Williamson et al. Reference Williamson, Brusatte and Wilson2014). Aside from Sinodelphys, the Early Cretaceous record of Metatheria is extremely patchy, consisting only of jaws and teeth from North America (e.g., Cifelli et al. Reference Cifelli, Wible and Jenkins1998), including remains assignable to Deltatheroida (Kielan-Jaworowska and Cifelli Reference Kielan-Jaworowska and Cifelli2001; Davis et al. Reference Davis, Cifelli and Kielan-Jaworowska2008). This record may reflect genuine low diversity and abundance of the group during its initial radiation.
In the late Early Cretaceous, global climates were experiencing warm conditions, probably driven by high CO2 levels caused by active tectonism (Black et al. Reference Black, Archer, Hand and Godthelp2012; Tennant et al. Reference Tennant, Mannion, Upchurch, Sutton and Price2017, Reference Halliday, Upchurch and Goswamiand references therein). Mammaliaform diversity is believed to have generally increased from the Barremian to the Campanian (Wilson et al. Reference Wilson, Evans, Corfe, Smits, Fortelius and Jernvall2012; Newham et al. Reference Newham, Benson, Upchurch and Goswami2014), perhaps reflecting radiations of insectivores and nectivores in association with the diversification of angiosperms (Black et al. Reference Black, Archer, Hand and Godthelp2012). Whether or not metatherians were affected by these events is difficult to judge with so little evidence available at present. However, Grossnickle and Newham (Reference Grossnickle and Newham2016) noted that the disparity of metatherians and multituberculates (based on tooth shape and complexity) increased during the Late Cretaceous, which is in agreement with diversity patterns estimated here, and suggested that this disparity reflected the availability of frugivorous and omnivorous niches resulting from the growing ecological dominance of angiosperms.
Late Cretaceous
The Late Cretaceous provides a much more abundant fossil record across all northern continents, with metatherian taxa belonging to either the Deltatheroida or Marsupialiformes (Williamson et al. Reference Williamson, Brusatte and Wilson2014, Reference Wilsonand references therein). Deltatheroidans are particularly well known in Asia, where they were apparently more abundant than marsupialiforms (Averianov et al. Reference Averianov, Archibald and Ekdale2010; Williamson et al. Reference Williamson, Brusatte and Wilson2014). Deltatheroidans and several marsupialiform lineages (e.g., Stagodontidae, Pediomyidae, and basal Herpetotheriidae) are also present in the Late Cretaceous of North America (Case et al. Reference Case, Goin and Woodburne2004; Williamson et al. Reference Williamson, Brusatte, Carr, Weil and Standhardt2012, Reference Williamson, Brusatte and Wilson2014).
Both the rarefaction and SQS global curves estimate relatively low levels of generic diversity in the early part of the Late Cretaceous (Fig. 2A,B). In North America, however, the rarefaction curve displays a peak in the later part of the Late Cretaceous compared with earlier time bins (Fig. 3A). This latest Cretaceous regional pattern agrees with our raw diversity estimate (Fig. 1) and that of Williamson et al. (Reference Williamson, Brusatte and Wilson2014), who found peak diversity of 29 metatherian species in the Campanian. This result is consistent with the previous consensus (again based on raw taxic estimates) that a substantial metatherian radiation occurred in North America at this time (Cifelli and Davis Reference Cifelli and Davis2003; Luo et al. Reference Luo, Ji, Wible and Yuan2003; Cifelli Reference Cifelli2004), perhaps peaking in the Campanian and declining in the Maastrichtian (Kielan-Jaworowska et al. Reference Kielan-Jaworowska, Cifelli and Luo2004). However, this scenario is contradicted by the SQS curve (Fig. 3B), which indicates that metatherian diversity plateaued between the early Late Cretaceous and late Late Cretaceous. We therefore suggest that the latest Cretaceous peak in North American metatherian raw diversity is largely an artifact of relatively good sampling, which has not been fully corrected by classic rarefaction. Other authors have previously noted the high quality of the metatherian latest Cretaceous North American fossil record compared with those of most other continental regions and time periods (e.g., Cifelli et al. Reference Cifelli, Davis and Sames2014; Williamson et al. Reference Williamson, Brusatte and Wilson2014). Moreover, this view is supported here by the observations that the latest Late Cretaceous subepoch includes: (1) a very high number of prolific sites in North America (10), compared with other region/time-bin combinations; and (2) an extremely high Good’s U value (0.99) in North America (Supplementary Data). This interpretation of unusually good fossil-record sampling in the latest Cretaceous is also relevant to assessments of the impact of the K/Pg mass extinction on metatherians, discussed further below.
Paleocene
The Paleocene includes the aftermath of the end-Cretaceous (K/Pg) mass extinction that resulted in the loss of 53–64% of terrestrial vertebrate species (Archibald Reference Archibald1996; Archibald and Bryant Reference Archibald and Bryant1990) and 60% of all animal species (Schulte et al. Reference Schulte, Alegret, Arenillas, Arz, Barton, Bown, Bralower, Christeson, Claeys, Cockell and Collins2010). A recent study further suggested that extinction rates for North American mammals were markedly higher, around 93% (Longrich et al. Reference Longrich, Scriberas and Wills2016). Previous studies, based on raw diversity counts, have concluded that metatherians underwent a severe and relatively sudden extinction at the end of the Cretaceous, resulting in a marked drop in diversity (e.g., Archibald Reference Archibald1983, Reference Archibald1996; Williamson et al. Reference Williamson, Brusatte, Carr, Weil and Standhardt2012), perhaps presaged by a small decline in raw species diversity (Wilson Reference Wilson2013; Williamson et al. Reference Williamson, Brusatte and Wilson2014) Reference Wilsonand disparity (Grossnickle and Polly Reference Grossnickle and Polly2013) from the Campanian to the Maastrichtian. Mammalian community turnover has been documented in North American sites with sufficient continuous strata. For example, Hooker (Reference Hooker2000) reported that, in Montana, 79% of Cretaceous mammals are replaced by novel forms in the Paleogene. With regard to Metatheria, stagodontid and pediomyid marsupialiforms do not cross the K/Pg boundary, whereas the Glasbius+Roberthoffstetteria lineage and herpetotheriids apparently survived into the early Cenozoic (Horovitz et al. Reference Horovitz, Martin, Bloch, Ladevèze, Kurz and Sánchez-Villagra2009; Williamson et al. Reference Williamson, Brusatte, Carr, Weil and Standhardt2012, Reference Williamson, Brusatte and Wilson2014). Williamson et al. (Reference Williamson, Brusatte and Wilson2014) noted that raw species-level metatherian diversity only declined from 25 species in the Maastritchian to 23 in the Paleocene, but this “global” pattern obscures the fact the North American species’ numbers decline markedly (by 66% to 8 species, with 100% turnover of genera), whereas known South American genera rise from 0 in the latest Cretaceous to 17 in the Paleocene (Table 1).
A significant extinction among metatherians at the K/Pg boundary is also supported by recent studies that have examined mammalian or therian diversity and disparity using sampling-correction approaches. (Wilson Reference Wilson2013, Reference Wilson2014; Grossnickle and Newham Reference Grossnickle and Newham2016; Longrich et al. Reference Longrich, Scriberas and Wills2016). Wilson (Reference Wilson2013, Reference Wilson2014) found evidence for a 91% extinction of metatherian taxa in North America, based on a detailed study of localities in northeast Montana and the application of rarefaction. Similarly, Longrich et al. (Reference Longrich, Scriberas and Wills2016) estimated that North American mammalian diversity decreased by approximately 93% and 84% at the species and generic levels, respectively, including a 100% turnover of metatherians at the K/Pg boundary. Grossnickle and Newham (Reference Grossnickle and Newham2016) found that both residual diversity estimates and SQS supported a significant drop in global therian diversity and disparity during the mass extinction. The extinction of mammalian taxa appears to have been selective, with metatherians losing more taxa and taking longer to recover than eutherians or multituberculates in North America (Longrich et al. Reference Longrich, Scriberas and Wills2016), and specialist forms were particularly hard hit (Grossnickle and Newham Reference Grossnickle and Newham2016).
A sharp decrease in diversity at or near the K/Pg boundary is observed in our raw taxic diversity estimate for Europe, North America, and Asia (Fig. 1). In the rarefaction curves for North America and the global data set, there is a marked decrease in diversity in the Paleocene relative to the latest Cretaceous (Figs. 2A and 3A). SQS curves support a drop in diversity in North America (Fig. 3B), but these analyses indicate that global metatherian diversity was relatively high in the Paleocene (Fig. 2B). Thus, the raw taxic data and both our classic rarefaction and SQS results all support a major decrease in metatherian diversity in North America during the Cretaceous–Paleocene transition—a result that is consistent with the conclusions of the previous studies outlined earlier (e.g., Horovitz et al. Reference Horovitz, Martin, Bloch, Ladevèze, Kurz and Sánchez-Villagra2009; Wilson Reference Wilson2013, Reference Wilson2014; Longrich et al. Reference Longrich, Scriberas and Wills2016). It seems, however, that the North American pattern cannot be simply extrapolated to the global scale. Although our rarefaction results (Fig. 2A) support a decrease in metatherian diversity in the Paleocene relative to the latest Cretaceous, the putatively more accurate SQS global curve (Fig. 2B) indicates a marked increase. Taken at face value, this pattern could be interpreted as indicating that metatherians were adversely affected by the K/Pg mass extinction in the predominant Late Cretaceous range, North America, but rebounded quickly in new territory, particularly South America. However, the paucity of the non–North American Late Cretaceous fossil record of metatherians, coupled with the severe limitations on the temporal resolution of the ages of Paleocene taxa in many regions, warrants caution in these interpretations. First, the metatherian fossil records of Europe and Asia are so sparse that they cannot be subjected to rarefaction or SQS analysis. However, aside from Gurbanodelta, no Paleocene Asian metatherians are known, despite their relative abundance and diversity in the latest Cretaceous, and it is thus conceivable that they were largely extirpated in this region during the K/Pg mass extinction. Second, studies such as those carried out by Wilson (Reference Wilson2013, Reference Wilson2014) Reference Wilsonand Longrich et al. (Reference Longrich, Scriberas and Wills2016) focused on the 1–2 Myr on either side of the K/Pg boundary, whereas our results compare diversity in the whole of the latest Cretaceous (Campanian–Maastrichtian, ~17 Myr) and Paleocene (~11 Myr). Although our data set has the advantage of providing global and regional sampling-corrected diversity estimates, it inevitably lacks the fine-scale temporal resolution achieved by these other analyses. Thus, our global Paleocene rise in diversity might obscure a more complex pattern in which metatherians underwent a major global extinction at the K/Pg boundary, had suppressed diversity in the immediate aftermath of the mass extinction, but then recovered later in the Paleocene in regions other than North America and Asia (especially South America).
The oldest possible members of the crown group Marsupialia occur in the Paleocene (Goin et al. Reference Goin, Candela, Abello and Oliveira2009; Horovitz et al. Reference Horovitz, Martin, Bloch, Ladevèze, Kurz and Sánchez-Villagra2009; O’Leary et al. Reference O’Leary, Bloch, Flynn, Gaudin, Giallombardo, Giannini, Goldberg, Kraatz, Luo, Meng, Ni, Novacek, Perini, Randall, Rougier, Sargis, Silcox, Simmons, Spaulding, Velazco, Weksler, Wible and Cirranello2013; but see Beck Reference Beck2012), perhaps reflecting their initial radiation in the wake of the K/Pg mass extinction, although some estimates place the origin of Marsupialia in the latest Cretaceous (Williamson et al. Reference Williamson, Brusatte and Wilson2014), similar to recent estimates for the origin of Placentalia (Wible et al. Reference Wible, Rougier, Novacek and Asher2007; Meredith et al. Reference Meredith, Janečka, Gatesy, Ryder, Fisher, Teeling, Goodbla, Eizirik, Simão, Stadler and Rabosky2011; dos Reis et al. Reference dos Reis, Inoue, Hasegawa, Asher, Donoghue and Yang2012, Reference dos Reis, Donoghue and Yang2014; Halliday et al. Reference Halliday, Upchurch and Goswami2017; but see O’Leary et al. Reference O’Leary, Bloch, Flynn, Gaudin, Giallombardo, Giannini, Goldberg, Kraatz, Luo, Meng, Ni, Novacek, Perini, Randall, Rougier, Sargis, Silcox, Simmons, Spaulding, Velazco, Weksler, Wible and Cirranello2013). These findings suggest that Metatheria responded in the aftermath of the end-Cretaceous mass extinction in a manner similar to placental mammals: that is, experiencing an “explosive” and potentially adaptive radiation following the demise of the nonavian dinosaurs (Alroy Reference Alroy1999; dos Reis et al. Reference dos Reis, Inoue, Hasegawa, Asher, Donoghue and Yang2012; Goswami Reference Goswami2012; O’Leary et al. Reference O’Leary, Bloch, Flynn, Gaudin, Giallombardo, Giannini, Goldberg, Kraatz, Luo, Meng, Ni, Novacek, Perini, Randall, Rougier, Sargis, Silcox, Simmons, Spaulding, Velazco, Weksler, Wible and Cirranello2013; Slater Reference Slater2013; Halliday and Goswami Reference Halliday and Goswami2016; Halliday et al. Reference Halliday, Upchurch and Goswami2016). Unlike eutherians, however, the post-K/Pg metatherian radiation was apparently more geographically restricted, focused on the Southern Hemisphere. These ideas could be tested further by estimates of origination and extinction rates; however, the lack of new genera appearing in both the late Late Cretaceous and early Eocene means that calculation of such rates for the Paleocene is currently not possible (Table 2).
It has been suggested that high metatherian diversity in the Paleocene of South America might be due to an earlier arrival than that of eutherians (de Muizon and Cifelli Reference de Muizon and Cifelli2001; Ortiz-Jaureguizar and Pascual Reference Ortiz-Jaureguizar and Pascual2007; Pascual and Ortiz-Jaureguizar Reference Pascual and Ortiz-Jaureguizar2007). However, there are many eutherians known from the early Paleocene of South America, in the same beds as the earliest metatherians (de Muizon and Cifelli Reference de Muizon and Cifelli2000), and both of these clades are absent from Cretaceous beds of that continent. South American Cretaceous mammals include representatives of triconodonts and symmetrodonts (although see Gaetano et al. Reference Gaetano, Marsicano and Rougier2013) and “dryolestoids” and gondwanatheres (de la Fuente et al. Reference de la Fuente, Salgado, Albino, Báez, Bonaparte, Calvo, Chiappe, Codorniú, Coria, Gasparini and Riga2007), with only “dryolestoids” and gondwanatheres, surviving to the Paleocene. It has often been suggested that metatherians were absent from Gondwanan continents during the Cretaceous and only dispersed into South America (and from there to other parts of Gondwana) during the Paleogene (Clemens Reference Clemens1968; Rage Reference Rage1981, Reference Rage1986), but it is also conceivable that this apparent paleobiogeographic pattern is an artifact of poor Southern Hemisphere sampling (Rana and Wilson Reference Rana and Wilson2003; Williamson et al. Reference Williamson, Brusatte and Wilson2014). Metatherians probably arrived in South America from North America via the Greater Antilles or Aves Ridge, a volcanic arc (Iturralde-Vinent and MacPhee Reference Iturralde-Vinent and MacPhee1999; Pough et al. Reference Pough, Andrews, Cadle, Crump, Savitzky and Wells2004; Hedges Reference Hedges2006) that was subareally exposed between the Campanian and Eocene. Owing to continual fluctuations in tectonism, magmatic activity, and sea level, this created an intermittent land connection between North and South America (Gayet et al. Reference Gayet, Rage, Sempere and Gagnier1992; Case et al. Reference Case, Goin and Woodburne2004; Lowen et al. Reference Lowen, Irmins, Sertich, Currie and Sampson2013; Wilf et al. Reference Wilf, Cúneo, Escapa, Pol and Woodburne2013: though see Ezcurra and Agnolin Reference Ezcurra and Agnolin2012 for a contrary view).
Paleobotanical evidence suggests that the early Paleocene of South America was dominated by tropical and subtropical forests, as well as mangroves, swamp forest, montaine rain forest, and savanna–sclerophyllous forest, with temperate and mixed forest in the far south (Ortiz-Jaureguizar and Cladera Reference Ortiz-Jaureguizar and Cladera2006). This high diversity of arboreal habitats, which also persisted into the late Paleocene with the exception of the mangroves (Ortiz-Jaureguizar and Cladera Reference Ortiz-Jaureguizar and Cladera2006), might also have played a key role in the evolution of high metatherian diversity in clades dominated by arboreal taxa.
Eocene
Metatherians first appear in the Antarctic and Australian fossil records in the early Eocene (e.g., Blake and Aronson Reference Blake and Aronson1998; Beck Reference Beck2015). European metatherians occur in each of the four Eocene stages, yet only four genera are known: Amphiperatherium, Peratherium, Armintodelphys, and Peradectes. Asiadidelphis and Indodelphis are the only two genera known from the Asian Eocene. Given that Indodelphis comes from India (which collided with Asia during the latest Paleocene/earliest Eocene [Seton et al. Reference Seton, Müller, Zahirovic, Gaina, Torsvik, Shepard, Talsma, Gurnis, Turner, Maus and Chandler2012; Hu et al. Reference Hu, Garzanti, Wang, Huang, An and Webb2016]), it is not certain whether this form represents an immigrant into India from Laurasia or a remnant of a Gondwanan fauna. Consequently, while it is clear that metatherians were widespread at this time, much of the information on their Eocene diversity is based on a relatively rich record in North and South America and a very scant record elsewhere. According to our results, global and South American metatherian diversity underwent a moderate rise during the early Eocene (Figs. 2B and 4B), yet suffered a slight decline in North America (Fig. 3). In the late Eocene, metatherians were still present in Europe and Asia; however, there is no record in Australia because of a lack of fossiliferous rock at this time (Fig. 6). At the global scale and in South America, metatherian diversity dropped in the late Eocene (Figs. 2B and 3), yet diversity rose in North America (Fig. 3).
Lower taxonomic diversity of mammals in the early Eocene of North America coincides with a loss of habitat heterogeneity caused by tectonics, climate and other related environmental factors (Janis Reference Janis1993). The Paleocene–Eocene thermal maximum (PETM) punctuated a warming trend that began in the late Paleocene and persisted through the Eocene (Shellito and Sloan Reference Shellito and Sloan2006; Huyghe et al. Reference Huyghe, Lartaud, Emmanuel, Merle and Renaud2015). Eustatic sea level was high, and sea water temperatures were elevated in the early Eocene (Haq et al. Reference Haq, Hardenbol and Vail1987; Zachos et al. Reference Zachos, Pagani, Sloan, Thomas and Billups2001). Global warming at this time has been linked to the release of methane from continental shelf hydrates or from compressed sediments in the Gulf of Alaska, and/or CO2 linked to the North Atlantic Volcanic Province (Shellito and Sloan Reference Shellito and Sloan2006, Reference Martinand references therein), with several recent studies favoring a key role for the latter factor (e.g., Bowen et al. Reference Bowen, Maibauer, Kraus, Rohl, Westerhold, Steimke, Gingerich, Wing and Clyde2015). Latitudinal thermal gradients were at their shallowest for the past 55 Myr (Moran et al. Reference Moran, Backman, Brinkhuis, Clemens, Cronin, Dickens, Eynaud, Gattacceca, Jakobsson, Jordan, Kaminski, King, Koc, Krylov, Martinez, Matthiessen, McInroy, Moore, Onodera, O’Regan, Pälike, Rea, Rio, Sakamoto, Smith, Stein, St John, Suto, Suzuki, Takahashi, Watanabe, Yamamoto, Farrell, Frank, Kubik, Jokat and Kristoffersen2006), Reference Martinand deep-ocean circulation shifted, moving warm saltwater to higher latitudes (Rea et al. Reference Rea, Zachos, Owen and Gingerich1990).
As a consequence of these environmental changes, the early Eocene witnessed the greatest ever extent of tropical and subtropical forests (related to a poleward expansion of warm-adapted floras [Wing et al. Reference Wing, Harrington, Bloch, Boyer and Smith2004]), which in turn resulted in the most homogeneous biotas of the whole Cenozoic across northern continents (Woodburne Reference Woodburne2004), although little is known about the floras of eastern Asia at this time (Shellito and Sloan Reference Shellito and Sloan2006). Tropical forest is believed to have extended as far as 58°N and 47°S (Morley Reference Morley2000; Jaramillo Reference Jaramillo2002; Mehrotra Reference Mehrotra2003; Shellito and Sloan Reference Shellito and Sloan2006), with temperate mixed forest at higher latitudes (e.g., the Antarctic Peninsula (Hunt and Poole Reference Hunt and Poole2003) and in North America (Wing Reference Wing1998; Wolfe and Dilcher Reference Wolfe and Dilcher1999; Graham Reference Graham2000). However, unlike in North America, South American metatherians were clearly thriving in this environment (Fig. 4), continuing the phase of major radiations on this continent that began in the Paleocene.
After the PETM, global temperatures peaked again in the middle Eocene, followed by a cooling and drying trend through the late Eocene (Janis Reference Janis1993; Bohaty and Zachos Reference Bohaty and Zachos2003; Shellito and Sloan Reference Shellito and Sloan2006; Jovane et al. Reference Jovane, Florindo, Coccioni, Dinarès-Turell, Marsili, Monechi, Roberts and Sprovieri2007; Ivany et al. Reference Ivany, Lohmann, Hasiuk, Blacke, Glass, Aronson and Moody2008; Villa et al. Reference Villa, Fioroni, Pea, Bohaty and Persico2008; Bohaty et al. Reference Bohaty, Zachos, Florindo and Delaney2009; Huyghe et al. Reference Huyghe, Lartaud, Emmanuel, Merle and Renaud2015). As temperatures cooled, tropical vegetation was replaced in northern latitudes by more temperate forest (with evidence of sclerophyllous plants in North America and Patagonia), although tropical forests still remained in equatorial regions (e.g., Kohn et al. Reference Kohn, Stromberg, Madden, Dunn, Evans, Palacios and Carlini2015). The late Eocene also experienced an increase in seasonality in plant growth and the opening up of habitats as areas became less forested, as indicated by the increasing cursoriality seen in the ungulate fossil record (Janis Reference Janis1993). Although North American metatherian diversity increased at this time (Fig. 3B), South American diversity declined, perhaps due to the arrival (from Africa) of caviomorph rodents and platyrrhine primates, which appear in the South American fossil record at 41 Ma (Antoine et al. Reference Antoine, Marivaux, Croft, Billet, Ganerød, Jaramillo, Martin, Orliac, Tejada, Altamirano and Duranthon2012) Reference Beckand 39 Ma (Bond et al. Reference Bond, Tejedor, Campbell, Chornogubsky, Novo and Goin2015), respectively.
Oligocene
Metatherian diversity in the Oligocene, despite declining from late Eocene levels in both North and South America (Figs. 3 and 4), rose “globally” (Fig. 2), largely because of the marked increase in taxa in the Australian (late) Oligocene record (Fig. 5). In Asia, only two genera, Asiadidelphis and Junggaroperadectes, are known. In addition, the only undisputed African metatherian is known from the Oligocene (Simons and Bown Reference Simons and Bown1984).
By the beginning of the Oligocene, perhaps as a result of the habitat diversification of the late Eocene, North American eutherian mammals had radiated into specialized ecological groups. Lagomorphs and new rodent families had appeared, carnivorans had become more specialized to a variety of niches, and artiodactyl groups ranging from omnivores (pigs) to specialist folivores (camels and ruminants) were also present in North America (Janis Reference Janis1993). It was perhaps through competition or predation by eutherians that North American metatherian diversity fell (Fig. 3B). However, the concept of “competitive displacement” of one group by another has been criticized by a number of studies, and many workers prefer models involving opportunistic replacement (e.g., Benton Reference Benton2009, and references therein; Sanchez-Villagra 2013). Additionally, this pattern might reflect a failure of the metatherian groups in North America to adapt suitably and quickly enough to the changing habitat space. For example, declining global temperatures may not have been as tolerable to metatherians due to their lower BMR (Goin et al. Reference Goin, Woodburne, Zimicz, Martin and Chornogubsky2016).
The substantially decreased temperatures at the Eocene/Oligocene boundary (EOB), followed by cooler temperatures throughout the Oligocene (Zachos et al. Reference Zachos, Pagani, Sloan, Thomas and Billups2001), probably exerted strong environmental pressures on taxa living in southern South America. In general, South American Oligocene mammal communities were dominated by eutherian grazers such as notoungulates (Ortiz-Jaureguizar and Cladera Reference Ortiz-Jaureguizar and Cladera2006). The dominant environment was that of woodland savanna with low annual rainfall, although the acquisition of high crowned teeth by many placental notoungulate families suggests wide-ranging temperate grasslands by the late Oligocene (Patterson and Pascual Reference Patterson and Pascual1972). Given the appearance of new and varied scansorial and insectivorous–frugivorous metatherians in the South American Oligocene, such as the Paleothentidae and Abderitidae (Marshall Reference Marshall1980; Ortiz-Jaureguizar Reference Ortiz-Jaureguizar2003; Abello Reference Abello2013), borhyaenids, and the ricochetal argyrolagids (Goin et al. Reference Goin, Woodburne, Zimicz, Martin and Chornogubsky2016), it is perhaps surprising that metatherians are estimated to have declined in diversity in this region at this time (Fig. 4). However, the Oligocene was a period of significant faunal turnover (Janis Reference Janis1993), and although many new taxa occupying varied niches appeared, other South American forms such as the Polydolopidae and Groeberidae disappeared (Goin et al. Reference Goin, Woodburne, Zimicz, Martin and Chornogubsky2016; Supplementary Data). This turnover is reflected in our estimate that metatherian extinction rates peaked during the Oligocene (Table 2).
During the Oligocene, Australia experienced “icehouse” conditions as a result of its severance from Antarctica and the oceanic circulation patterns that ensued (McGowran and Hill Reference McGowran and Hill2015, Reference Beckand references therein). Forests were less diverse than those of the early Eocene (Black et al. Reference Black, Archer, Hand and Godthelp2012) Reference Beckand experienced greater seasonality and lower rainfall. Late Oligocene Australian metatherians are known from several fossil sites in central and northern Australia; those at Riversleigh have been suggested to represent open-forest habitats (Travouillon et al. Reference Travouillon, Legendre, Archer and Hand2009). Perhaps the most important environmental feature at this time was the absence of terrestrial eutherians from the continent. Although there is a contentious terrestrial placental from the early Eocene Tingamarra Fauna of southeast Queensland, Australia (Godthelp et al. Reference Godthelp, Archer and Cifelli1992), it apparently did not persist, and the continental isolation that followed the late Eocene separation likely limited further invasions. As a result, despite the globally changing biotic environment, Australian metatherians were able to diversify substantially to fill these new ecological niches with specialized insectivores, carnivores, and herbivores (Black et al. Reference Black, Archer, Hand and Godthelp2012) (Fig. 5B), unlike in North and South America (Figs. 3 and 4).
Miocene
Globally, metatherian diversity experienced a rise from the Oligocene to its maximum in the early Miocene, a drop in the middle and late Miocene, and then a rise in the Pliocene (Fig. 2). These sampling-corrected reconstructions agree with the raw diversity curve (Fig. 1).
The Miocene shows the last of the Laurasian metatherians until the northward dispersal of opossums into North America (represented by Didelphis virginiana today) from South America during the great American biotic interchange (GABI) in the Quaternary (see reviews in Bacon et al. [Reference Bacon, Silvestro, Jaramillo, Smith, Chakrabarty and Antonelli2015], Montes et al. [Reference Montes, Cardona, Jaramillo, Pardo, Silva, Valencia, Ayala, Pérez-Angel, Rodriguez-Parra, Ramirez and Niño2015], Reference Beckand Woodburne [Reference Woodburne2010] for a discussion of the complex history of the GABI). The Miocene record for North American metatherians comprises only a single genus, Herpetotherium, recovered from six early Miocene fossil sites (e.g., Whistler and Lander Reference Whistler and Lander2003). In Europe, a few metatherians have also been recorded from the early Miocene (e.g., Legendre Reference Legendre1982; Ziegler Reference Ziegler1990), but none are known after this time. In South America, metatherian diversity fell in the middle Miocene and plateaued to the late Miocene (Fig. 4). No taxa are known from the Miocene of Antarctica, although access to outcrop is of course limited by ice cover. In Australia, diversity initially increased from the Oligocene but fell in the middle and late Miocene (Fig. 5). Thus, the global pattern of metatherian diversity in the Miocene largely mirrors that of Australia.
The early Miocene was a time of greenhouse conditions with rising sea levels and warm humid climate as a result of the melting of polar ice caps (Zachos et al. Reference Zachos, Pagani, Sloan, Thomas and Billups2001). In South America, explosive volcanism in the latest early Miocene was followed by the uplift of the Andes in the middle Miocene (Uliana and Biddle Reference Uliana and Biddle1988; Echeverri et al. Reference Echeverri, Cardona, Pardo, Monsalve, Valencia, Borrero, Rosero and Lopez2015). In the early Miocene, South American habitats displayed a balance between grasslands and woodlands, with the persistence of tropical forests in Patagonia, and grasses and shrubs being more widely distributed than previously (Ortiz-Jaureguizar and Cladera Reference Ortiz-Jaureguizar and Cladera2006). Generally, at this time, subtropical forest was declining, and montane forest was increasing in dominance (Quattrocchio et al. Reference Quattrocchio, Durango de Cabrera and Galli2003). It was also in the early to middle Miocene that the first evidence of steppe-like habitats, in a relatively dry climate, is known, although some recent work has suggested that desertification of Patagonia did not occur until the late Miocene (~10 Ma) (Palazzesi and Barreda Reference Palazzesi and Barreda2012; Palazzesi et al. Reference Palazzesi, Barreda, Cuitino, Guler, Telleria and Santos2014). At this time, grazers dominated the South American fauna, followed in abundance by mixed feeders, frugivores, and browsers (Ortiz-Jaureguizar and Cladera Reference Ortiz-Jaureguizar and Cladera2006).
The South American middle to late Miocene witnessed three successive Atlantic marine transgressions known as the Paranean Sea that later gave way to new habitats of widespread plains (the “Age of the Southern Plains”) in the late Miocene (Ortiz-Jaureguizar and Cladera Reference Ortiz-Jaureguizar and Cladera2006). During this time, climate was cooler and more seasonal and environments more subdivided than in the early Miocene; this has been linked to ice cap formation in the eastern Arctic and the first evidence of glacial advance in the south (Pascual et al. Reference Pascual, Ortiz-Jaureguizar and Prado1996). The late Miocene of Patagonia was dominated by open and arid environments (Ortiz-Jaureguizar and Cladera Reference Ortiz-Jaureguizar and Cladera2006). It is at this time that certain taxa linked to subtropical woodlands, such as stegotheriine armadillos and paleothentid and aberitid marsupials, became rare or disappeared entirely.
In the early Miocene of Australia, there is evidence for widespread rain forest of the kind comparable to the mid-montane rain forests of New Guinea (Black et al. Reference Black, Archer, Hand and Godthelp2012). Conditions were drier and more seasonal in central Australia compared with northern and eastern parts of that continent, although wetter than they are at present (Martin Reference Martin2006). Northward movement of the Australian plate, after its rifting from Antarctica, resulted in a collision with Southeast Asia in the middle Miocene and subsequent closure of the deep-sea circulation between Australia and Indonesia (Kennett Reference Kennett1977). This change in circulation is correlated with ice sheet expansion in eastern Antarctica, mentioned earlier, that resulted in even lower sea level, temperatures, and precipitation (Lawver and Gahagan Reference Lawver and Gahagan2003). Thus, Australia experienced the same shift in climate as South America and much of the rest of the world after the middle Miocene climatic optimum, as greenhouse conditions with peak rainfall and sea level gave way to cooler, drier conditions (Black et al. Reference Black, Archer, Hand and Godthelp2012). This period of drying was exacerbated by mountain uplift in New Guinea and of the Eastern Dividing Range in Australia, both creating rain-shadow effects (Black et al. Reference Black, Archer, Hand and Godthelp2012). These abiotic factors inevitably influenced the biotic realm and led to the gradual replacement of central Australian rain forests by open forest and woodland, although rain forests remained on the continental margins (Black et al. Reference Black, Archer, Hand and Godthelp2012). The late Miocene of Australia saw even further cooling, and reduction and fragmentation of the rain forests (Zachos et al. Reference Zachos, Pagani, Sloan, Thomas and Billups2001). Dry open woodlands were present in central Australia, and eucalyptus trees were abundant (Martin Reference Martin1994). The diversity curves (Fig. 5) indicate that metatherian diversity decreased from the middle Miocene to the late Miocene, suggesting that they may have failed to adapt sufficiently to these drier and cooler woodland conditions.
Pliocene
In the Pliocene, metatherians are mainly known from South America and Australia, with only a few taxa in Central America; thus, their paleobiogeographic distribution at this time was essentially identical to that which is observed today, excluding the North American Didelphis virginiana. Metatherian diversity declined from the late Miocene onward in South America (Fig. 4) but increased in the Pliocene in Australia (Fig. 5). Globally, the Pliocene witnessed a fluctuation in climate with expansion and contraction of Northern and Southern Hemisphere ice sheets (Zachos et al. Reference Zachos, Pagani, Sloan, Thomas and Billups2001). The early Pliocene was characterized by global warming and marine transgression. This was followed by a major transition involving extensive arctic glaciation, global cooling, and increasing climatic instability (Shackleton et al. Reference Shackleton, Backman, Zimmerman, Kent, Hall, Roberts, Schnitker, Baldauf, Desprairies, Homrighausen, Huddlestun, Keene, Kaltenback, Krumsiek, Morton, Murray and Westberg-Smith1984; Kennett Reference Kennett1985; Shackleton Reference Shackleton1995; Zhang et al. Reference Zhang, Molnar and Downs2001; Lisiecki and Raymo Reference Lisiecki and Raymo2007).
In South America, continuing uplift of the Andean Cordillera formed a barrier to humid winds from the Pacific and created a rain-shadow effect that increased aridity (Ortiz-Jaureguizar and Cladera Reference Ortiz-Jaureguizar and Cladera2006; La Roux Reference La Roux2012). Major glaciations dominated Patagonia (Mörner and Sylwan Reference Mörner and Sylwan1989; La Roux Reference La Roux2012) Reference Beckand probably contributed to reduced continental temperatures. As a result of these climatic events, habitats were dominated by grasslands, steppes, and shrublands in arid zones, with rain forest being restricted to small areas near the Brazilian coastline, montane forest occurring in north-central Argentina, Paraguay, and Bolivia, and cool moist temperate forest growing in southwest Patagonia (Dowsett et al. Reference Dowsett, Barron, Poore, Thompson, Cronin, Ishman and Willard1999; Ortiz-Jaureguizar and Cladera Reference Ortiz-Jaureguizar and Cladera2006). The negative impact of increasing aridity on metatherian diversity potentially reflects the correlation between lactation and rainy season in extant metatherians (e.g., McNab Reference McNab1986, Reference McNab2005, Reference McNab2008; Krockenberger Reference Krockenberger2006). If metatherians were failing to lactate in dry seasons or arid conditions, this would have affected their rate of population growth and might explain their decline in South America during periods of increasing aridity.
The history of the Isthmus of Panama, and associated GABI, is now more complex than previously realized. It used to be thought that this region provided a land bridge for terrestrial dispersal between North and South America from around 5–3.5 Ma, whereas recent studies have proposed phases of biotic exchange at 20 and 6 Ma (Bacon et al. Reference Bacon, Silvestro, Jaramillo, Smith, Chakrabarty and Antonelli2015) Reference Beckand the emergence of a land connection approximately 15–13 Ma (Montes et al. Reference Montes, Cardona, Jaramillo, Pardo, Silva, Valencia, Ayala, Pérez-Angel, Rodriguez-Parra, Ramirez and Niño2015). Nevertheless, the Pliocene is associated with the beginning of high-volume immigration from North America (GABI), potentially related to climatic cooling that resulted in savannas suitable for dispersal of mammalian herbivores (Molnar Reference Molnar2008; Hoorn and Flantua Reference Hoorn and Flantua2015). GABI involved dispersal of carnivorans (including bears, dogs, and cats), rodents, and ungulates (such as camels, deer, tapirs, horses, and gomphothere proboscideans) to South America in the Pliocene (Flynn and Wyss Reference Flynn and Wyss1998). Although there is little evidence for competitive replacement of sparassodonts by eutherian carnivores (Prevosti et al. Reference Prevosti, Forasiepi and Zimicz2013), the presence of these new placental taxa likely had a large effect on metatherian communities (see Jansa et al. [Reference Jansa, Barker and Voss2014] for evidence of a didelphid extinction), perhaps through increased predation pressure and competition for resources. Moreover, it has been suggested that rodents, for example, filled similar niches to some metatherians (Pascual et al. Reference Pascual, Ortiz-Jaureguizar and Prado1996; Ortiz-Jaureguizar and Cladera Reference Ortiz-Jaureguizar and Cladera2006), potentially leading to competition among these small-bodied mammals in South America. However, see previous comments about competitive replacement. Thus, South American metatherian diversity might have decreased during the Miocene and Pliocene as a result of abiotic factors such as increasing aridity, opening up additional niches that could only be filled by the invading placental groups.
In Australia, the early Pliocene has been reconstructed as initially warm and wet before becoming increasingly arid again in the late Pliocene (Gallagher et al. Reference Gallagher, Greenwood, Taylor, Smith, Wallace and Holdgate2003). There were considerable gradients in climate (and hence also vegetation) across Australia, which comprised wet sclerophyll forests in peripheral regions, rain forest near the coast, and drier forest farther inland (Hill Reference Hill1992; McGowran et al. Reference McGowran, Archer, Bock, Sarragh, Godthelp, Hageman, Hand, Hill, Li, Maxwell, McNamara, Macphail, Mildenhall, Partridge, Richardson, Shafik, Truswell and Warne2000; Martin Reference Martin2006). The ecological diversity of marsupials reflected these habitats in the early Pliocene, where arboreal and browsing taxa were abundant. In the later Pliocene, rain forest persisted in southeast Australia. A shift to increased seasonality in rainfall is also indicated by the rise of herbaceous plants (Greenwood and Christophel Reference Greenwood and Christophel2005). The increasing dominance of arid shrubs and grasslands in the northwest of central Australia in the late Pliocene (Martin Reference Martin2006) might explain the significant radiation of grazing marsupials (kangaroos and wombats) at this time. The appearance of “old endemic” murids in the Australian Pliocene might have impacted metatherians (such as the rodent-like ektopodontid possums) through competitive replacement (Black et al. Reference Black, Archer, Hand and Godthelp2012).
Metatherian Fossil-Record Quality
The classic rarefaction and SQS results demonstrate that it is possible to extract sampling-corrected paleodiversity estimates for metatherians at both global and regional scales. These results, however, frequently display differences from raw taxic diversity counts. Such discrepancies indicate that the metatherian fossil record is very patchy and that sampling biases distort the true diversity pattern for this group.
Our understanding of early metatherian diversity in Asia and Europe is poor. Cretaceous Asian metatherian fossils have a record punctuated by large gaps, such as that between the first recorded metatherian, Sinodelphys (Barremian, 129.4–125 Ma) and the next Asian fossil, Sulestes (Coniacian, 89.8–86.3 Ma) (Nessov Reference Nessov1985; Supplementary Data). There are no Asian metatherians from the Santonian (86.3–83.6 Ma); only two genera, Asiatherium (Trofimov and Szalay Reference Trofimov and Szalay1994) and Deltatheridium (Rougier et al. Reference Rougier, Wible and Novacek1998) in the Campanian (83.6–72.1 Ma); and only the unnamed “Gurlin Tsav” skull (Kielan-Jaworowska and Nessov Reference Kielan-Jaworowska and Nessov1990) in the Maastrichtian. For this reason, hypotheses concerning an eastern or western dispersal route from Asia are difficult to test, as outlined by Vullo et al. (Reference Vullo, Gheerbrant, de Muizon and Néraudeau2009).
Metatherian fossils from Europe are known from the Cenomanian (100.5–93.9 Ma) and the Maastrichtian (72.1–66 Ma), but no record bridges these stages. This major gap in the fossil record might be the result of the rarity of screen-washing studies that are able to recover small fossil mammal teeth. Alternatively, metatherians might have been truly scarce or absent during this time.
We know very little of how metatherians fared during their bidirectional Antarctic dispersals between South America and Australia. The fossil record of Antarctica is greatly undersampled, owing to its current coverage in ice. Thus far, it has only yielded fossil metatherians of early Eocene age (Montes et al. Reference Montes, Nozal, Santillana, Marenssi and Olivero2013). This lack of data severely limits our understanding of the role of this landmass as a “bridge” between South America and Australia and the faunal exchanges and interactions that might have taken place.
The Australian record has yet to produce any metatherian fossils from the late Eocene, due to a paucity of fossiliferous rock. This deficit obscures our understanding of the initial diversification of Australian clades and their colonization of the continent that they still dominate. Future work must endeavor to fill these gaps in the record through exploration of potential fossil sites and increased sampling of those sites already known.
Conclusions
The quality of the metatherian fossil record varies extensively, both spatially and temporally. For example, fossil-record quality in North America contrasts greatly with that of South America, and there are many gaps in regions and time bins because of poor collection effort or lack of fossiliferous rock. Accordingly, the raw metatherian fossil record is biased by varied sampling and preservation rates through time and hence does not provide a reliable picture of paleodiversity patterns. Application of appropriate sampling-correction techniques, however, yields information on metatherian diversity that is likely to be more accurate than a simple reading of the raw fossil record. Rarefaction, and especially SQS, handle the complex and patchy nature of the metatherian fossil record and ameliorate several likely sources of bias. Given the very heterogeneous sampling, classic rarefaction is likely to give less accurate estimates of diversity than SQS.
The evidence presented here suggests that metatherian diversity was relatively low globally during the Cretaceous. Apparent decreases in global raw taxic diversity in the Paleocene are, at least in part, artifacts of poor sampling. It seems that metatherians actually diversified considerably during the mid- and late Paleocene after a substantial extinction/turnover event (which was perhaps particularly severe in Laurasia) close to the K/Pg boundary. In particular, metatherian diversity increased greatly in South America during the Paleocene, possibly reflecting the availability of varied arboreal habitats and/or a lack of competition from eutherians. Thus, Metatheria (especially Marsupalia) radiated after the K/Pg extinction in a manner resembling the diversification of contemporary placental mammals, albeit on a smaller and probably more geographically restricted scale. After the early Eocene peak, global metatherian diversity dipped until their extensive radiation within Australia. Thus, the Cenozoic diversity history of metatherians has a strongly regionalized aspect, with the clade declining markedly in Europe (and also North America after a peak in the Eocene), so that it is absent from Laurasia from the middle Miocene onward (with the exception of Didelphis which dispersed into North America in the last 1 Myr [Woodburne Reference Woodburne2010]). In the Southern Hemisphere, while South American diversity declined from an early Eocene peak, diversification of Australian forms in the Miocene–Pliocene more than compensated for these losses and those in Laurasia. This high Australian diversity accounts for the maximum peak in global diversity during the early Miocene.
Fluctuations in metatherian diversity potentially correspond with environmental factors such as climate change, habitat heterogeneity and fragmentation, and continental connectivity. Although there are exceptions (such as the Miocene–Pliocene of Australia), it seems that metatherian diversity tended to rise when arboreal habitats were varied and climates were warmer and more mesic, but decreased when more arid conditions created open grasslands, steppes, and deserts. The different styles of lactation displayed by metatherians and placentals might have played a key role in allowing the latter to exploit these more arid environments, or warmer temperatures might have been more optimal for metatherian low BMR (Goin et al. Reference Goin, Woodburne, Zimicz, Martin and Chornogubsky2016, and references within). Where environments provided opportunities for the diversification of placental mammals, metatherians usually did not follow suit. While the large-scale patterns in metatherian diversity are unlikely to have been driven directly by competition with placental mammals, it is conceivable that the absence or rarity of the latter in the Paleocene of South America and Miocene–Pliocene of Australia meant that metatherians found it easier to respond to changing habitats by radiating into new niches without facing incumbent placentals. Moreover, the developmental and/or physiological constraints potentially limited the ecomorphological evolution in Metatheria, contributing to their past and present patterns of biodiversity.
Acknowledgments
We thank Gavin Simpson for his assistance with the creation of the initial version of the SQS R code. Roger Benson and Philip Mannion provided valuable discussion concerning methodologies used to produce sampling-corrected paleodiversity estimates. We also thank Steve Brusatte and Robin Beck for helpful reviews. We are grateful to the library staff at The Natural History Museum, London, for assistance with locating many references in their care. C.V.B. was supported by Natural Environment Research Council doctoral training grant NE/H525197/1.
Supplementary Material
Data available from the Dryad Digital Repository: http://dx.doi.org/10.5061/dryad.bt651


 Open access