

 where
where Introduction
Modern glaciologists are hampered by their inability to predict the rate at which ice in glaciers and ice sheets will deform under a given applied stress. In this paper, using both published and unpublished data (the latter from Vostok station, Antarctica), we study the particular problem of closure of boreholes in ice.
When ice is subject to stress, an initial elastic deformation is followed by a period of primary or transient creep during which the stain rate decreases continuously. This deceleration leads to a strain-rate minimum, έ min, called secondary (or steady or Glen-type) creep. Recrystallization then results in acceleration and tertiary creep. These three stages of creep have been detected in borehole closure data from Devon and Agassiz Ice Caps in the Canadian Arctic and Vostok station, Antarctica (Reference PatersonPaterson, 1977; Reference Fisher and KoernerFisher and Koerner, 1986; Reference Blinov and DmitrievBlinov and Dmitriev, 1987); and also in laboratory ice-deformation experiments (e.g. Reference SteinemannSteinemann, 1958; Reference Kamb, Heard, Borg, Carter and RaleighKamb, 1972; Reference Jacka and MaccagnanJacka and Maccagnan, 1984).
Deformation rates obtained from borehole closure measurements differ systematically from those obtained by other methods. This paper explores possible reasons for this.
Background
In simple models of ideal materials (Hooke elastic, Saint-Venant plastic, and Newtonian viscous), as well as in models obtained by combining these, deformation of solids is described as a function of the rheological properties of the materials and of temperature. In Newtonian materials stress and deformation rate are proportional to one another, and the viscosity coefficient is independent of stress (Fig. 1, line a), although it may vary with temperature, impurity content, density and other factors. Reference ThomsonThomson (1888), who was awarded the title ‘baron Kelvin’ in 1892 for his scientific studies, made the first calculation of this coefficient for ice. Thomson did not report the results of his calculations, but Reference ShumskiyShumskiy (1969) estimated that it was probably ~8.46×10¹¹ Pa s.
Rheological models of ice deformation: (a) Newtonian material with viscosity coefficient of 1013 Pa s; (b) plastic material with yield stress of 100 kPa; (c) Newtonian-plastic material using Glen’s law with n = 3 and A = 50MPa–3a–1 (for ice at t = –5˚C; Paterson, 1994).

Subsequently Reference HöpplerHöppler (1941, cited by Reference PerutzPerutz, 1947) showed that the viscosity coefficient varies inversely with stress level, indicating that ice is not a Newtonian material. In 1948, E. Orowan, the keynote speaker at the joint meeting of the British Glaciological Society, the British Rheologists’ Club and the Institute of Metals, argued that ice and other crystalline solids deform as what are now known as perfectly plastic materials (British Glaciological Society, 1949). In such a material, once a yield stress has been reached, the material deforms rapidly enough to prevent the applied stress from exceeding the yield stress. Orowan observed that glaciers commonly accelerate during the spring, a fact that he attributed to an increase in stress resulting from the thin layer of snow added during the winter. We now know, of course, that the acceleration is due to changes in water pressure at the bed. For glaciers the yield stress was estimated to be 50–150 kPa (Fig. 1, line b).
The lifespan of the perfectly plastic model was short. Two years later Reference PerutzPerutz (1950), on the basis of data from a 137m borehole in the Jungfraufirn, Switzerland, suggested using a power relationship:
where έ is the effective strain rate, ![]() is the
is the
effective stress, ![]() A is an ice stiffness parameter and n is an empirical constant. Summation over repeated subscripts is understood. This simple equation was a turning point in the science of glacier dynamics. Deformation experiments performed by Reference GlenGlen (1955) and Reference SteinemannSteinemann (1958) confirmed that at stresses typically observed in glaciers and ice sheets, the deformation rate is related to a power of stress (Fig. 1, curve c), and Equation (1) has come to be known as ‘Glen’s flow law’.
A is an ice stiffness parameter and n is an empirical constant. Summation over repeated subscripts is understood. This simple equation was a turning point in the science of glacier dynamics. Deformation experiments performed by Reference GlenGlen (1955) and Reference SteinemannSteinemann (1958) confirmed that at stresses typically observed in glaciers and ice sheets, the deformation rate is related to a power of stress (Fig. 1, curve c), and Equation (1) has come to be known as ‘Glen’s flow law’.
It was soon noted that the exponent in Glen’s law appeared to increase with stress, so the power law fit only a limited range of stresses. Thus, other attempts were made to describe the flow of glaciers empirically. Examples are:
-
1. a two-term law (Reference Mellor, Smith and OuraMellor and Smith, 1967)
-
2. a polynomial law (Reference LliboutryLliboutry, 1969; Reference Colbeck and EvansColbeck and Evans, 1973)
-
3. a hyperbolic law, such as that proposed by Reference GarofaloGarofalo (1963)
In these relations, A, B, C, α and n are empirical constants, unique to the particular law.
At present, a universal constitutive law for ice flow does not exist. The appropriate law to use depends on the physical processes being studied, the stress configuration and the total strain. Frustrated with this state of affairs, Reference Lliboutry and DuvalLliboutry and Duval (1985) wrote, ‘Any attempt to determine the creep law of ice is illusory.’ Nevertheless, most glaciologists have adopted Glen’s law.
Parameters A and n in Glen’s Flow Law
Laboratory and field experiments have yielded values for n, ranging from 1.5 to 4.2 depending on the design of the experiment and, in the case of field studies, on the type of glacier and age of the ice (Reference Weertman, Whalley, Jones and GoldWeertman, 1973; Reference HookeHooke, 1981). When n = 1, the deformation rate is directly proportional to stress and the model is Newtonian. This most likely applies at very low stresses where deformation is by diffusional mechanisms. Reference HobbsHobbs (1974) thought that between –2 and –45˚C n was essentially constant at ~3, a value consistent with the dislocation glide and climb mechanisms thought to be operating (Reference WeertmanWeertman, 1983). For ice-sheet modeling, Hooke (1981) and Reference PatersonPaterson, 1994) also recommend using n = 3.
Some values of n derived from borehole closure measurements are presented in the second column of Table 1, where they cluster around 3. However, the estimates of A in the first column vary widely.
Values A –20, E, and E derived from measurements of borehole closure during secondary creep

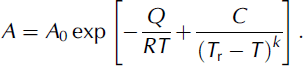
A depends on ice temperature, crystal orientation, dust content and other factors. To isolate the temperature dependency, it is common practice to use the Arrhenius relation:
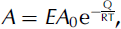
where A 0 (e.g. Reference GlenGlen, 1955) is a constant parameter, presumed to be independent of temperature and E is an empirical coefficient that takes into account the effects of crystal orientation, impurity content and other factors, Q is the activation energy for creep (J mol–1), R is the universal gas constant (8.314 J mol–1 K–1) and T is the absolute temperature (K). This function was originally used by Reference ArrheniusArrhenius (1889) to estimate the speed of chemical reactions, but later its use included the temperature dependence of thermodynamic parameters over limited temperature ranges.
In Table 2 we list some values of Q based on experimental data at temperatures below –10˚C. Consistent with Paterson (1994), and based on the assumption that some of the early experiments at very low temperatures did not reach or were not reliably extrapolated to έ min, we adopt a value of 60 kJ mol–1.
Values of Q based on literature reviews and on experiments using polycrystalline ice at temperatures below –10˚C

Between –10 and 0˚C, Q appears to increase to ~134 kJ mol–1. However, this is not a true activation energy. The increased creep rate is due to development of a liquid layer along crystal boundaries. Thus, at temperatures between –10 and 0˚C the Arrhenius relation can be used only with an artificially high value of Q.
To determine A 0 experimentally, care must be taken to ensure that E = 1. Experiments using impurity-free polycrystalline ice with randomly oriented c axes, and providing reliable estimates of έ min are best for this purpose. Based on such experiments, Hooke (1981, updated below) suggests using 9.514 ×10¹²MPa–3 a–1.
In contrast, Paterson’s (1994) recommended values of A yield A 0 = 12.6 ×10¹²MPa–3 a–1. This is probably because Paterson’s compilation includes some data from borehole tilt experiments. Because such data record deformation in a direction in which it has been occurring for a long time, tilt data should yield values of E appropriate for tertiary creep. This may be why Paterson’s value of A 0 is slightly higher than Hooke’s. We use the lower value in the computations below.
For temperatures between –10 and 0˚C, Paterson (1994) uses mean values of A from experiments (Table 3). However, Hooke (1981) fits the function
Paterson’s (1994) recommended values of A for secondary creep* and n = 3

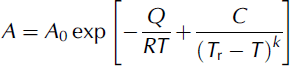
to secondary creep data covering the range 0 to –60˚C. Here, A 0 = 9.514 ×10¹²MPa–3 a–1; Q = 60 kJ mol–1, and C, T r, and k are empirical constants with values 4.2 Kk, 274.7 K and 1.25, respectively (note: these values are updated from the original paper). Equation (6) is plotted in Figure 2 along with the data upon which it is based. Also shown in this figure are Paterson’s values of A.
Mellor and Smith (1967) noted that certain properties of the Arrhenius relation at high temperatures are not utilized when it is applied to ice, and suggested that the temperature dependence of A could equally well be approximated by the simple exponential equation:
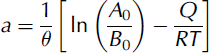
where E is an empirical coefficient, as before; B 0, like A 0, is independent of temperature; a (˚C–1) is an empirical coefficient; and θ is the Celsius temperature (a negative number).
*Paterson recommends multiplying these values by 2.5 for tertiary creep.
†Paterson calculates values for temperatures below –10oC from the Arrhenius relation [Equation (5)] using Q = 60 kJ mol–1.
Equation (7) was first used by Shumskiy (1963) to reduce the problem with the activation energy at temperatures above –10˚C. Later Reference LliboutryLliboutry (1964) and Reference BuddBudd (1968) used it, and then it was almost forgotten.
Values of a obtained in different studies are:
0.09–0.11˚C–1 obtained from various experiments (Reference BuddBudd, 1969);
0.123˚C–1 from interpretation of Paterson’s (1994) recommendations;
0.111˚C–1 from borehole closure data of Paterson (1977) and Fisher and Koerner (1986);
0.106˚C–1 from data from closure of hole 3G at Vostok Station, Antarctica (this study).
Thus a can be considered to be approximately constant, lying between 0.10 and 0.12˚C–1, as long as the temperature varies within a restricted range. However, from Equations (5) and (7):
so a varies slowly with temperature. Thus, the approximation becomes increasingly imperfect as the temperature range increases, and is not useful at temperatures above –10˚C (Fig. 2).
Variation of A with 1/T. ‘Other points’ include three from Duval (1977), four from Reference GlenGlen (1955), two from Mellor and Smith (1967) and two from Steinemann (1958). F&K: Fisher and Koerner (1986); N: Reference Naruse, Okuhira, Ohmae, Kawada and NakawoNaruse and others (1988); B&D: Blinov and Dmitriev (1987); 3G: this study. It is assumed that several of the experiments at very low temperatures did not reach έ min.
Empirical Coefficient E
As noted, E (or E) is an empirical coefficient that is used to consider the dependence of A on crystal size and orientation, impurities and other factors. E (or E) is commonly referred to as an ‘enhancement’ factor, although in some cases it is substantially less than 1. For example, when the values of A in Table 1, which are derived from borehole closure measurements, are adjusted to a common n of 3 and a common temperature of –20˚C with the use of Equations (1) and (5), the median value is 0.66 MPa–3 a–1 (Table 1, column 4). However, the value from Equation (6) at –20˚C is 4.33 MPa–3 a–1, implying E ≈ 0.15.
We think the slow closure rate of boreholes is due to prior development of crystal orientation fabrics that resist closure. Before insertion of a borehole, the ice is deforming under a stress configuration approximating a combination of simple shear and, if there is significant longitudinal extension, pure shear. Simple shear would result in a vertical preferred orientation of crystal c axes, while pure shear would yield a fabric with two poles dipping ~558 up- and down-glacier (e.g. Reference HookeHooke, 2005). After insertion of a borehole, the dominant stresses around the hole are a circumferential compressive stress, σθθ, and a radial tensile stress, σ rr, that are in directions more or less normal to these c axes. When monocrystals are squeezed in this direction they are ~50 times stronger than polycrystalline ice with a random orientation of c axes (Reference Duval, Ashby and AndermanDuval and others, 1983).
In contrast, borehole tilt data, as expected, normally yield values of E > 1 (Shreve and Sharp, 1970; Reference RaymondRaymond, 1973; Reference Dahl-Jensen and GundestrupDahl-Jensen and Gundestrup, 1987; Gundestrup and others, 1993). In addition, Wisconsin ice commonly deforms more readily than Holocene ice, a phenomenon first documented by measurements on Barnes Ice Cap, Canada, (Reference HookeHooke, 1973, Reference Hooke1976) but subsequently noted in data from both Dye 3 and Camp Century in Greenland (Dahl-Jensen and Gundestrup, 1987; Reference Gundestrup, Dahl-Jensen, Hansen and KeltyGundestrup and others, 1993). For example, at Dye 3 the mean value of E in Holocene ice was ~2.3, while in Late Wisconsin ice it was 6.0 (Fig. 3).
Enhancement factor based on measurements of borehole tilting: Dye 3 borehole, Greenland (Dahl-Jensen and Gundestrup, 1987); and GISP2 borehole, Greenland (N. Clow and K. Gundestrup, unpublished data). The smooth variation with depth in the GISP2 data is a consequence of calculating shear strain rates from a seventh-order polynomial fit to the raw velocity profile. We used values of E from an interpretation of the likely error distribution that Clow and Gundestrup feel is more ‘realistic’ rather than one that yielded values that were ~25% higher. Ordinates have been scaled so the Wisconsin/Holocene transition occurs at a common level in the graph. Calculations use A 0 = 9.514 ×10¹²MPa–3 a–1.
This contrast between Wisconsin and Holocene ice, which is also seen in borehole closure data from Agassiz Ice Cap (Fisher and Koerner, 1986), requires explanation. Careful analysis (Paterson, 1994) suggests that it, too, is due to differences in fabric. Reference PatersonPaterson (1991, 1994) noted that there is commonly an abrupt transition to fine-grained ice with a high impurity content and a strong, easily deformed single-maximum fabric across the Holocene/Wisconsin boundary. He suggested that the fine-grained ice is a consequence of high concentrations of Cl–, SO4 2–, and dust that inhibit grain growth. The smaller grain size favors processes that facilitate development of strong fabrics. The strong fabric is, in his opinion, the proximal cause of the softness of Wisconsin ice.
Measurements of borehole tilting in the GISP2 hole, Greenland, (N. Clow and K. Gundestrup, unpublished data) provide another profile of E (Fig. 3). In contrast to the data from the other sites mentioned above, below the Holocene/ Wisconsin boundary at GISP2, which is ~1370m above the bed, there is a gradual increase in E over a depth of ~700m (Fig. 2). At greater depths, as at Dye 3, E first decreases gradually and then increases sharply in the 15 m thick basal layer. Limited data suggest that these variations are also correlated with the strength of the c-axis fabric. The authors attribute the decrease in E below 700m to an increase in ‘distortion of the ice’, presumably resulting in fabrics that are not optimal for deformation.
Relevant Previous Work at Vostok Station
In 1985, hole 3G at Vostok station reached 2202 m. Ice at that depth is ~162 kyr old (Lipenkov and others, 2000). Shortly thereafter the drill became stuck at 1943 m during reaming operations, the cable broke near the connection to the drill and drilling operations ceased. The hole was then filled to within 135 m of the surface with low-temperature aircraft fuel, TS-1, mixed with ~9% (by weight) of densifier (trichlorofluoromethane – CFC 11) to minimize closure.
In 1992 the borehole fluid was sampled at ~250m intervals for density determinations (Reference Menshikov and TalalayMenshikov and Talalay, 1993). The sampler could not penetrate below 1650 m due to closure. The hydrostatic pressure of the fluid column and differential pressure on the walls of the borehole were calculated using the method of Reference Talalay and GundestrupTalalay and Gundestrup (2002). At the sampled intervals the differential pressure was negative (or inward) and varied from –0.91MPa at 135 m to –1.26MPa at 1650m (Fig. 4). The hydrostatic fluid pressure was extrapolated to 1700 m depth, where the pressure difference reached –1.28MPa (Table 4).
Temperature, pressure difference, age of ice, and measured diameter of hole 3G, at various depths

Differential pressure on walls of hole 3G at Vostok Station (January 1992). The upper 135 m of the hole is filled with air.
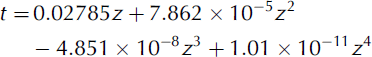
Temperature measurements were made in hole 3G by Blinov and Dmitriev (1987) and by Reference Salamatin, Vostretsov, Petit, Lipenkov and BarkovSalamatin and others (1998). Between 400 and 3600m depth, the temperature, θ (˚C), varies with depth, z (m), as follows (Talalay, unpublished information):

Subsequently, Lipenkov and others (2000) re-examined the Vostok isotope chronology, taking into account a temperature perturbation measured in deep holes, and presented a new age scale for the site. Between 100 and 3300 m depth their estimate of the age, t (ka), is reproduced to within ±8 ka (rms discrepancy ~5 ka) by (Talalay, unpublished information):
Crystal size at Vostok appears to be related to age, inasmuch as it increases gradually from 1–2mm at depths up to 300 m, to 4–5mm at depths of 1600–1800 m, and still further at greater depths (Reference Kamb, Heard, Borg, Carter and RaleighLipenkov and Barkov, 1998; Reference Lipenkov, Barkov and SalamatinLipenkov and others, 2000). However, crystals are also systematically smaller, and microparticle content is higher in ice formed during the Last Glacial Maximum (320–500m depth), between 56 and 68 ka (850–1000 m), and during marine isotope stage 6 (134–154 ka, 1880–2120 m) as well as in some deeper sections. This is consistent with observations at Agassiz, Byrd and Dye 3.
In fine-grained late glacial and Holocene ice in the upper 450m of the ice sheet at Vostok, fabrics are of the broad single-maximum type (Lipenkov and others, 1989). Stronger single-maximum fabrics are present below 2700m (Lipenkov and others, 2000). The former are characteristic of vertical compression which dominates in the upper part of an ice sheet, whereas the latter are commonly produced by simple shear at greater depths (e.g. Hooke, 2005). In the coarser-grained Eemian and early Wisconsin ice between 450 and 1800m depth, the dominant fabric has a great-circle symmetry about a horizontal axis (Lipenkov and others, 1989). This fabric is developed where low temperatures and strain rates inhibit recrystallization, and under a stress regime with a combination of longitudinal tension (in the direction of ice flow) combined with transverse and vertical compression (Reference AlleyAlley, 1988). Under this stress regime, c axes rotate away from the tensile axis, and at cold temperatures recrystallization of crystals at high angles to the tensile axis is inhibited.
Estimation of Flow Parameters For Ice Penetrated by Hole 3G
The diameter of hole 3G at Vostok station was measured repeatedly with the use of an industrial cavity meter KM-2 with accuracy ±1 mm. Measurements were made at 20m intervals from 100 to 1920m depth. Excluded from our analysis are: (1) the upper 1000 mbecause the change in hole diameter lies within the range of uncertainty in the measurements; (2) the interval from 1000 to 1080m because the initial readings appear to be anomalous; and (3) the interval from 1720 to 1920 m, because it was impossible to sample drilling fluids so the differential pressure is not known.
Data at 100m intervals from 1100 to 1700m depth are given in Table 4. A was calculated for each of these depths and survey times from:
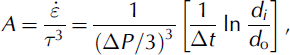
where ΔP is the differential pressure across the hole wall at the level of the measurement, d o is the initial hole diameter, di is the hole diameter at time i, and Δt is the elapsed time between the initial measurement and time i. Here, ΔP/3 is the stress on the hole wall (Reference NyeNye, 1953) and the term in square brackets is the measured strain rate (Paterson, 1977, equation (5)).
In his calculations, Paterson (1977) excluded data from initial transient creep stages and also data collected after the onset of tertiary creep. However, there is neither a clear minimum nor any evidence of acceleration in our strain data, and perhaps none should be expected. In the stress range within which we are working, the transient creep stage at Byrd Station continued to a strain of ~0.05 (Paterson, 1977), which is the upper limit of the strains we measured in hole 3G. As the duration of the transient stage appears to increase with decreasing temperature (Paterson, 1977) and hole 3G is considerably colder than Byrd (–45˚C vs –28˚C), it seems likely that the ice in hole 3G was still in the transient phase when hole diameters were logged.
Accordingly, we simply solved Equations (5) and (11) for E at 20 m depth intervals from 1000 to 1700 m depth. We used A 0 = 9.514 ×10¹²MPa–3 a–1, –Q = 60 kJ mol–1 and the initial and final borehole diameter measurements. The mean value, 0.74±0.15, is, within limits of uncertainty, equal to that obtained by Blinov and Dmitriev (1987) at Vostok, but it is more than twice that obtained by Naruse and others (1988) at Mizuho station, Antarctica, and over four times the values for Byrd Station and the four Northern Hemisphere holes that Paterson (1977) analyzed (Table 1).
To obtain a and EB0 from the data in Table 4, we regressed the natural logarithm of the values of A at the various depths against θ at those depths. This yielded a = 0.106 (as noted above) and EB0 = 14MPa–3 a–1 (R 2 = 0.73). We then did a similar regression using only the data in the first five rows of Table 1, as these holes give internally consistent values of EA 0. This yielded a = 0.111 and EB0 = 5.7 MPa–3 a–1 (R 2 = 0.99). We adopted a = 0.11. We then used Equations (5) and (7) with E = E = 1 to calculate B 0 for 0≥θ≥ –35 and found that the mean value over this temperature range was 34.3 MPa–3 a–1. Finally, we used this to calculate the values of E shown in Table 1. These values of E are indistinguishable from those of E at temperatures above –35˚C, but at lower temperatures they diverge because we used a constant value of a (see Equation (8)).
Curves of relative hole diameter calculated using E = 0.16 (first five rows of Table 1), E = 0.74 (hole 3G) and E = 1.0 (based on Paterson’s recommended values of A) are plotted in Figure 5, together with the measured changes in hole 3G from 19 July 1986 to 4 January 1990 (3.47 years).
Changes in diameter with depth over 3.47 years in borehole 3G: curve a shows experimental data; curves b, c and d are based on Equations (1) and (5) with A 0 = 9.514 ×10¹²MPa–3 a–1, n = 3 and E = 0.74 (hole 3G), E =1.0 (Paterson) and E = 0.16 (Table 1, rows 1–5), respectively.
Discussion
Minimum creep rates obtained from borehole closure measurements are significantly lower than predicted from Equation (5), with A 0 = 9.514 ×10¹²MPa–3 a–1 and E = 1 (Table 1). We now try to explain this stiffness.
Paterson (1977) noted that ice near a borehole wall may be deforming in secondary or tertiary creep while that further from the wall is still in transient creep, but also observed that as transient creep is faster than secondary creep, this should result in minimum creep rates in borehole closure experiments that are, instead, higher than one would expect from Equation (5). As noted above, we think the slow closure rates in boreholes may well be a consequence of crystal fabrics that are not well oriented for closure.
In our description of the work at Vostok station, we saw that, in the depth range with which we are dealing in hole 3G, c axes lie in a great circle or girdle with symmetry about a horizontal axis. Around a borehole, σ' rr ≈ σ' θθ » σ' zz, so the stress configuration approximates pure shear. Thus, the ideal fabric for closure of a borehole would presumably be one with two maxima at ~55–608 to one another, lying in a horizontal plane, and parallel to tangents to the hole wall. Thus, relatively few of the c axes at Vostok would be oriented in directions to facilitate closure, and many would be normal to this direction. Consequently, the observed fabric would tend to stiffen ice against flow into the borehole.
Hole 3G appears to be closing over four times faster than the Agassiz hole and the four holes that Paterson (1977) studied. These holes were all in warmer ice, and all data refer to έ min. The slower closure rates in these holes could simply reflect the fact that hole 3G may still have been undergoing transient creep. On the other hand, owing to the warmer temperatures, the higher strain rates and the prevalence of simple shear in the surrounding ice, fabrics in the undisturbed ice were, in some cases, of the vertical broad single-maximum type (Reference Gow and WilliamsonGow and Williamson, 1976; Paterson, 1977, 1991; Fisher and Koerner, 1986). Such fabrics may well resist closure even more than the girdle fabrics with horizontal symmetry that are present in the Vostok ice.
Summary and Conclusions
The best approximation for the relation between stress and deformation rate in ice is the power-law equation, commonly called Glen’s law. The coefficient, A, in this relation is generally calculated using the Arrhenius relation ![]() Alternatively, the simple exponential function A = EB0e
at
is sometimes used. However, at temperatures above –10˚C neither of these formulations captures the increase in deformation rate due to development of a liquid or liquid-like film on grain boundaries. An empirical function that does reproduce this increase is
Alternatively, the simple exponential function A = EB0e
at
is sometimes used. However, at temperatures above –10˚C neither of these formulations captures the increase in deformation rate due to development of a liquid or liquid-like film on grain boundaries. An empirical function that does reproduce this increase is
Values of E and E obtained from earlier borehole closure experiments are about one-sixth of those from laboratory uniaxial compression studies. Values obtained from closure of Vostok hole 3G in the present study are four times higher than those from earlier borehole closure studies, but still only two-thirds of those from the laboratory experiments. The slow rate of borehole closure, in general, is probably a consequence of crystal orientation fabrics that resist closure. The higher closure rate of hole 3G could reflect transient creep, but may be a consequence of a unique girdle fabric, symmetrical about a horizontal axis.
The empirical ‘enhancement’ factor, E or E, is introduced in order to take fabrics, impurities and other factors into consideration, but we are only just beginning to develop an understanding of how to choose this coefficient. For deformation of Wisconsin ice under stress configurations commonly found in ice sheets, E ≈ 3, but for most borehole closure experiments it is ~0.16, and for closure of the Vostok hole 3G it is ~0.7.
Rheological parameters obtained by Blinov and Dmitriev (1987) were used in designing the technology for deep drilling at Vostok, and in particular for determining the density of drilling fluid that would keep the closure rate below the maximum permissible value. This led to drilling deep holes with uncompensated ice overburden pressures as high as, for example, ~4.8MPa at the bottom of hole 3G (Reference Pashkevich and ChistyakovPashkevich and Chistyakov, 1982). Consequently, unfortunate mishaps occurred, including jamming of a thermal drill on two occasions and initiation of a new hole at 1969 m depth on a third occasion (Reference Ueda and TalalayUeda and Talalay, 2007). Such accidents continued to occur until the density of the drilling fluid was adjusted and the liquid level was kept as high as possible. One of the drilling engineers, V.M. Pashkevich, noted that closure rates of the Vostok boreholes calculated from the data of Blinov and Dmitriev were significantly underestimated (Reference PashkevichPashkevich, 1993). He later concluded that the ‘values of rheological parameters used for calculations should be considered as approximate and obviously undervalued’.
Acknowledgements
P.G. Talalay thanks K.V. Blinov, A.N. Markov, R.N. Vostretsov and other geophysicists of St Petersburg State Mining Institute for making field measurements and providing borehole cl5sure data. He also thanks A. Svensson, A. Boas, and V. Zagorodnov for their help in literature surveys. R.LeB. Hooke thanks P.G. Talalay for the invitation to collaborate on this paper. S. Faria’s comments on an early version of the manuscript resulted in significant improvements.


