

Recent studies implicate probiotic bacteria as putative anti-diabetic agents, since probiotic supplementation has been found to normalise glucose homeostasis in diabetic rats(Reference Yadav, Jain and Sinha1–Reference Yadav, Jain and Sinha3). The underlying mechanisms are presently unknown, but since probiotics are increasingly incorporated in food, particularly dairy products, and consumed in significant quantities worldwide, such effects may have a huge impact on clinical practice, notably with regard to dietary recommendations to both healthy individuals at risk of type 2 diabetes as well as patients with type 2 diabetes. Probiotic bacteria may be defined as ‘living microorganisms, which, when administered in adequate amounts, confer a health benefit on the host’(Reference Guarner and Schaafsma4, 5). After surviving the passage of the gastrointestinal tract, probiotics may persist as part of the gut microbiota for a certain period after intake(Reference Marco, Pavan and Kleerebezem6, Reference Jacobsen, Rosenfeldt Nielsen and Hayford7). There is growing evidence that the intestinal microbiota exert effects outside the gut, for example, by regulating whole-body energy balance through mechanisms associated with breakdown and uptake of gut contents(Reference Cani and Delzenne8, Reference Turnbaugh, Ley and Mahowald9). In addition, the intestinal microbiota may be crucial to the development and homeostasis of the immune system since most immune cells in the body are conditioned in the gut and the gut microbiota interact closely with intestinal immune cells(Reference Jia, Li and Zhao10–Reference Guarner and Malagelada13). Processes such as energy harvest and immunity could therefore be affected by changes in the composition of the intestinal flora, induced by oral supplementation of probiotics. Furthermore, specific probiotic strains improve intestinal barrier function(Reference Madsen, Cornish and Soper14), and may potentially diminish the translocation of micro-organisms and their derivatives, for example, lipopolysaccharide (LPS)(Reference Cani, Neyrinck and Fava15), from the gut to the systemic circulation, thereby reducing the concomitant release of pro-inflammatory cytokines via Toll-like receptor (TLR)-4 signalling(Reference Guha and Mackman16). So-called chronic low-grade inflammation with persistently elevated levels of circulating pro-inflammatory cytokines is considered a principal pathogenetic component of insulin resistance and type 2 diabetes(Reference Pickup, Mattock and Chusney17–Reference Shoelson, Lee and Goldfine19); we therefore speculated that probiotics may possess anti-diabetic properties, at least in part, due to immune-modulatory effects. Lactobacillus acidophilus NCFM is a probiotic strain that is widely applied in conventional foods such as dairy products and in dietary supplements. L. acidophilus NCFM has been demonstrated to interact with cells of the immune system(Reference Konstantinov, Smidt and de Vos20, Reference Chen, Chiu and Lin21) and increases intestinal integrity(Reference Ouwehand, Tiihonen and Saarinen22). The L. acidophilus NCFM strain has been investigated for its physiological, biochemical and fermentative properties in vitro and in animal studies, as reviewed by Sanders & Klaenhammer(Reference Sanders and Klaenhammer23), and its genome has been fully sequenced(Reference Altermann, Russell and Azcarate-Peril24). To our knowledge, well-controlled interventions on insulin-resistant or diabetic patients who consumed L. acidophilus NCFM have not been performed. The objective of the present study was therefore, in a randomised, double-blinded, placebo-controlled fashion, to test the hypothesis that oral supplementation with L. acidophilus NCFM improves insulin sensitivity and modulates systemic inflammation in human subjects. Hence, we investigated insulin sensitivity through hyperinsulinaemic–euglycaemic clamps(Reference DeFronzo, Tobin and Andres25) before and after a 4-week treatment course with oral supplementation of L. acidophilus NCFM or placebo. This was carried out in healthy and type 2 diabetic individuals, representing a wide continuum of insulin sensitivity. Furthermore, the effects of L. acidophilus NCFM on the systemic inflammatory response was evaluated by subjecting the participants to an intravenous injection of Escherichia coli LPS, an established and validated human in vivo model of systemic inflammation(Reference Andreasen, Krabbe and Krogh-Madsen26), before and after the treatment course.
Subjects and experimental methods
The present study was conducted according to the guidelines laid down in the Declaration of Helsinki and all procedures involving human subjects were approved by the Ethical Committee of Copenhagen and Frederiksberg Municipalities (KF 01-320695). Written informed consent was obtained from all subjects.
Subjects
After informed consent, forty-eight males, diagnosed with type 2 diabetes (n 24) or as being non-diabetic (n 24) by their general practitioner, were subjected to a thorough physical examination including a complete medical history, blood sampling for general medical screening and a fasting 2 h oral glucose tolerance test (OGTT). According to the OGTT, twenty subjects had type 2 diabetes, five had impaired glucose tolerance (IGT) and twenty-three had normal glucose tolerance (NGT) as classified by the WHO definitions of glucose tolerance(27). Of the twenty diabetic patients, a total of fourteen received medical treatment related to their condition: nine subjects were treated with metformin, three with sulfonylurea drugs, one with glitazones, and five with statins, either as monotherapy or in combination with each other. Volunteers suffering from inflammatory illnesses or being treated with insulin, steroids, non-steroidal anti-inflammatory drugs, anti-coagulants, angiotensin-converting enzyme inhibitors or angiotensin II antagonists were excluded.
Design
The study was conducted as a randomised, placebo-controlled, double-blinded trial. The volunteers were randomly assigned to intake of L. acidophilus NCFM (n 24) or placebo (n 24) for a period of 4 weeks, ensuring that twelve subjects with NGT and twelve patients with diabetes as diagnosed by their general practitioner were included in each treatment group. The participants were instructed to abstain from fermented dairy products during treatment, but otherwise maintained their usual diet and lifestyle. Strenuous physical exercise was avoided for 48 h before the OGTT and the experimental days, while oral anti-diabetics and statins were withheld for 1 week and all other medications for 24 h. A hyperinsulinaemic–euglycaemic clamp and an investigation of the LPS-induced systemic inflammatory response, respectively, were performed on two consecutive days immediately preceding the intervention as well as on two consecutive days immediately after the treatment period. The clamps were always executed the day before the LPS injection.
Oral glucose tolerance test
Subjects drank 75 g glucose diluted in 500 ml water over 5 min. Plasma glucose was measured at baseline, and at 1 and 2 h after the glucose administration.
Dual X-ray absorptiometry scan
Fat-free body mass was estimated by dual X-ray absorptiometry scanning (Lunar Prodigy Advance; GE Medical Systems Lunar, Milwaukee, WI, USA) using Prodigy software (enCORE 2004, version 8.8; GE Lunar Corp., Madison, WI, USA).
Lactobacillus acidophilus NCFM and placebo
Capsules with freeze-dried L. acidophilus NCFM, American Type Culture Collection (ATCC) 700396 (1 g; about 1010 colony-forming units), or identical capsules containing placebo, a mixture of silicium dioxide and lactose, ratio 1:1, were provided by Danisco Inc. (Madison, WI, USA), and stored at 0–5°C before use. Bacterial viability was confirmed at the Department of Food Science, Faculty of Life Science, University of Copenhagen by plating serial dilutions of bacterial suspensions onto de Man–Rogosa–Sharpe agar (Merck, Darmstadt, Germany), followed by incubation in an anaerobic jar with AnaeroGen™ (Oxoid Ltd, Basingstoke, Hants, UK) at 37°C for 48 h.
Stool sampling and detection of Lactobacillus acidophilus
Stool samples were collected 1–2 d before the intervention was initiated and on the last day of intervention. After defecation, samples were kept at 5°C and brought to the laboratory within 24 h, where they were stored at − 80°C until analysed. Total bacterial DNA was extracted from faecal samples using the QIAamp DNA Stool Mini kit (QIAGEN GmbH, Hilden, Germany) according to the manufacturer's protocol. L. acidophilus NCFM chromosomal DNA was extracted using the GenElute Bacterial Genomic DNA Kit (Sigma-Aldrich, Munich, Germany). Bacterial DNA was amplified with the use of Lactobacillus group-specific primers Lac1F (AGCAGTAGGGAATCTTCCA) and Lac2R (GC clamp –ATTYCACCGCTACACATG) under PCR conditions as described previously(Reference Walter, Hertel and Tannock28). PCR products were separated using the DCode System (Bio-Rad, Hercules, CA, USA) according to the protocol for denaturating gradient gel electrophoresis(Reference Muyzer, de Waal and Uitterlinden29). DNA fragments in faecal samples with an identical migration position as the PCR band obtained from L. acidophilus NCFM were assumed to represent L. acidophilus. This assumption was confirmed by sequencing of five random DNA fragments having the same running distances as L. acidophilus NCFM(Reference ben Omar and Ampe30); identification was done using the BLAST tool at the National Centre for Biotechnology Information database (http://www.ncbi.nlm.nih.gov/BLAST). L. acidophilus was further quantified by real-time PCR (quantitative PCR) with the use of species-specific primers: forward primer CTGCTGTTTCTTCAGCATCT and reverse primer TCAGTATTGATACCACGTGAAT. The primers were constructed from Lactobacillus cpn60 gene sequences (Chaperonin Database; http://cpndb.cbr.nrc.ca/) by sequence alignment (ClustalW; http://www.ebi.ac.uk/Tools/clustalw2/index.html) followed by identification of specific primer sites (‘Oligo’ Primer Analysis Software version 6.71; Molecular Biology Insights, Inc., Cascade, CO, USA). Specificity of the primers was evaluated in silico (BLAST; http://blast.ncbi.nlm.nih.gov/Blast.cgi). Quantification of L. acidophilus was carried out using the 7500 Fast Real-Time PCR System (Applied Biosystems, Foster City, CA, USA). The reaction mixture (20 μl) was composed of 0·5 μm of each primer, 10 μl Power SYBR Green PCR Master Mix (Applied Biosystems) and 4 μl template DNA isolated from faecal samples. The amplification program consisted of one cycle of 95°C for 10 min, followed by forty cycles of 95°C for 15 s, and 60°C for 1 min. Standard curves were constructed using 10-fold serial dilutions of chromosomal DNA, isolated from L. acidophilus NCFM. Cell numbers of L. acidophilus in faecal samples were calculated from the averaged threshold cycle values (Ct) and expressed as log10 colony-forming units per g stool.
Hyperinsulinaemic–euglycaemic clamp
After an overnight fast, subjects reported to our laboratory, where they were bed-rested. An intravenous catheter for administration of insulin, glucose and electrolytes was placed in an antecubital vein. A retrograde catheter was inserted into a dorsal vein in the contralateral hand; this hand was wrapped in a heating blanket to obtain arterialised venous blood for measurements as specified below.
The duration of the clamp was 180 min. Insulin (100 IU/ml; Actrapid, Novo Nordisk Insulin, Bagsværd, Denmark) was infused continuously at a rate of 0·120 IU/min per m2. Plasma glucose and K was measured at 5 min intervals during hour 1 and at 10 min intervals during the hours 2 and 3; plasma glucose levels were targeted at 5·0 ± 0·2 mmol/l by adjusting the infusion rates of glucose (200 g/l) on a computer-controlled infusion pump. M, the whole-body metabolic rate of glucose, was calculated from the glucose infusion rate in the interval between 120 and 180 min(Reference Ferrannini and Mari31) according to the equations of DeFronzo et al. (Reference DeFronzo, Tobin and Andres25). The ratio of M (in mg/min per kg fat-free body mass) to the mean plasma insulin concentrations (in nmol/l) (M/I) of the final 60 min of the clamp was used as an estimate of insulin sensitivity(Reference DeFronzo, Tobin and Andres25, Reference Ferrannini and Mari31, Reference Brehm, Roden and Roden32). Isotonic saline with K was continuously infused to avoid hypokalaemia. Blood for the analysis of insulin (every 30 min) was drawn into EDTA-containing tubes and centrifuged instantly. Plasma was stored at − 80°C.
Lipopolysaccharide injection
Subjects received an intravenous bolus injection of E. coli LPS (0·3 ng/kg)(Reference Taudorf, Krabbe and Berg33, Reference Andreasen, Pedersen-Skovsgaard and Mortensen34) on two experimental days, separated by the 4-week intervention period. On both days, subjects reported to the laboratory at 07.00 hours after an overnight fast and were immediately placed in bed. An intravenous catheter was placed in an antecubital vein for LPS injection and blood sampling. Non-invasive blood pressure, heart rate and tympanic temperature were monitored and recorded hourly throughout the trial. Blood samples were drawn at baseline and hourly until 8 h after LPS injection for subsequent plasma analyses. Plasma samples were stored at − 80°C until further analyses.
Biochemical analyses
Blood samples for standard medical analyses obtained during the physical examination and plasma glucose during the OGTT were analysed at the Department of Clinical Biochemistry according to usual standards. Plasma glucose and K during the clamps were measured using an ABL555 (Radiometer, Copenhagen, Denmark). Plasma insulin was determined by ELISA (LOT 594148; DakoCytomation, Ely, Cambs, UK). C-reactive protein was measured with the Tina-quant C-reactive protein (latex) high sensitive assay (Roche Diagnostics Limited, Burgess Hill, West Sussex, UK). Plasma levels of TNF-α, IL-6 and IL-1 receptor antagonist (IL-1ra) were measured using ELISA (R&D Systems, Minneapolis, MN, USA). Measurements of plasma cytokines were done in duplicate and mean concentrations calculated. The ELISA intra-assay variation was evaluated by the CV of the duplicate measurements. Due to CV above 20 %, 1 % of the TNF measurements, 2·3 % of the IL-6 and 1·2 % of the IL-1ra measurements were discarded from further analyses. A CV of, respectively, 4·5, 5·4 and 4·0 % was detected in the remaining TNF, IL-6 and IL-1ra measurements.
Statistical analyses
Data are presented as mean values and 95 % CI with the exception of TNF, IL-6 and IL-1ra concentrations, which were log-transformed before analysis due to non-normal distribution, in order to obtain a better goodness of fit of the model. The estimated mean values and 95 % CI of the cytokines were transformed back to the original scale, yielding geometric mean and 95 % CI for the presentation of results.
Between-group variation in baseline characteristics was evaluated by a one-way ANOVA (SAS 9.1 Proc GLM; SAS Institute, Inc., Cary, NC, USA). Detection of L. acidophilus in faecal samples was evaluated by exact logistic regression. Changes in M/I and baseline inflammatory markers due to probiotic treatment were evaluated by applying a one-way ANOVA on the difference of these variables between the two study days, using treatment as the explanatory variable in the model (SAS 9.1 Proc GLM; model outcome (day 1 – day 28) = treatment). If a significant effect of treatment was found, post hoc t tests were performed for subgroup analyses. The LPS-induced inflammatory responses before and after treatment were evaluated by applying an ANOVA for longitudinal measures (SAS 9.1, Proc Mixed) with time (amount of hours post-LPS), study day (before or after treatment) and treatment (L. acidophilus NCFM or placebo) as explanatory variables, subject as a random factor and an autoregressive correlation matrix. The model was fitted on each investigated variable by backward regression. Goodness of fit of the models was assessed by evaluating the distribution of the residuals. If the ANOVA indicated a significant effect of time, Dunnett-adjusted post hoc t tests were subsequently performed to identify significant differences from baseline. Statistical software SAS 9.1 (SAS Institute, Inc.) was used throughout and P < 0·05 was considered to indicate statistical significance.
Results
Subjects
Of the twenty-four volunteers that were allocated to treatment with L. acidophilus NCFM, three subjects dropped out during the trial and data from these are consequently omitted from further analyses. Thus, ten subjects with NGT, three with IGT and eight with type 2 diabetes were treated with L. acidophilus NCFM (n 21), while the placebo group included twelve volunteers with NGT, two with IGT and ten patients with type 2 diabetes (n 24). The two treatment groups were comparable with regard to baseline characteristics as summarised in Table 1.
(Mean values and 95 % confidence intervals)

NGT, normal glucose tolerance; IGT, impaired glucose tolerance; OGTT, oral glucose tolerance test; HOMA2-IR, homeostatic model assessment of insulin resistance.
* Mean value was significantly different from that for the NGT group (P < 0·05).
† Mean value was significantly different from that for the IGT group (P < 0·05).
‡ The L. acidophilus NCFM group consisted of ten subjects with NGT, three with IGT and eight patients with type 2 diabetes, while twelve subjects with NGT, two with IGT and ten with type 2 diabetes were included in the placebo group. The two treatment groups were comparable.
Detection of Lactobacillus acidophilus NCFM
Faecal samples from one subject in the L. acidophilus NCFM group were missing. Analyses were thus performed on twenty samples from participants treated with L. acidophilus NCFM and on twenty-four samples from the placebo group. In the group treated with L. acidophilus, it was detected in two out of twenty samples before and in fifteen out of twenty samples after the intervention (P < 0·01) (Table 2). Concomitantly, the concentration of L. acidophilus increased from undetectable levels in the samples collected before intervention to 6·4 (sd 0·7) colony-forming units per g stool after probiotic consumption. In the group treated with placebo (n 24), L. acidophilus was detected in six samples before and three samples after intervention (Table 2); this decrease was not statistically significant. No differences in L. acidophilus content were established between diabetic patients and individuals with NGT.
Number of faecal samples positive for Lactobacillus acidophilus detected by denaturating gradient gel electrophoresis v. total number of samples
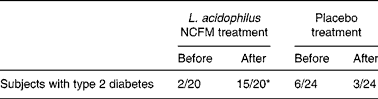
* Fractions before and after treatment differ significantly (P < 0·01).
Insulin sensitivity
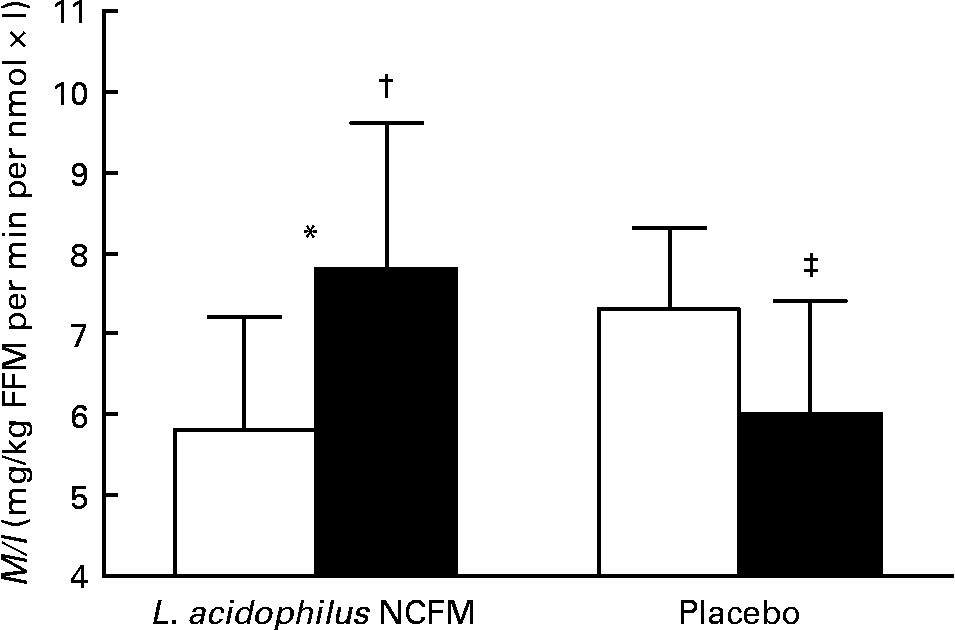
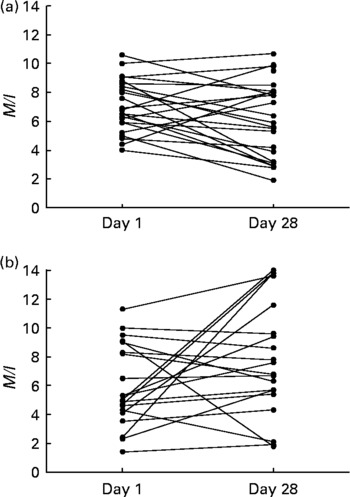
As evaluated by the one-way ANOVA, treatment allocation significantly affected the change in insulin sensitivity during the intervention period (P < 0·01) (Fig. 1). Post hoc t tests revealed that M/I decreased in the placebo group (P = 0·03), indicating decreased insulin sensitivity, while there was a non-significant increase in M/I in the L. acidophilus NCFM group (P = 0·09). When patients with or without type 2 diabetes were evaluated separately, we found the same trend in each of these groups as for the whole group. The variation in M/I of each subject is depicted in Fig. 2. Of the subjects, one diabetic subject treated with L. acidophilus NCFM did not have a dual X-ray absorptiometry scan performed and fat-free body mass was therefore not determined on this subject. Due to the lack of information on fat-free body mass, an M/I value could not be calculated, and clamp data on this subject was therefore not included in the statistical analysis.
Hyperinsulinaemic–euglycaemic clamps were performed in order to estimate insulin sensitivity, expressed as the mean ratio of the M value to plasma insulin concentrations (M/I) of the last 60 min of the clamp. M/I was calculated in forty-four males, randomised to intervention with either Lactobacillus acidophilus NCFM (n 20, including ten subjects with NGT, three with IGT and seven with type 2 diabetes) or placebo (n 24, including twelve subjects with NGT, two with IGT and ten with type 2 diabetes). The first clamp was performed at baseline (□) and the second clamp was performed after 4 weeks (28 d; ■) of intervention. Values are means, with 95 % CI represented by vertical bars. * Change in M/I was significantly different from that for the placebo group (P < 0·01). † Mean value was marginally significantly different from that at day 1 (P = 0·09). ‡ Mean value was significantly different from that at day 1 (P = 0·03). FFM, fat-free body mass.
Individual measures of insulin sensitivity, expressed as the mean ratio of the M value to plasma insulin concentration (M/I) values of the last 60 min of hyperinsulinaemic–euglycaemic clamps. M/I was calculated in forty-four males, randomised to intervention with either placebo (a) (n 24; including twelve subjects with normal glucose tolerance (NGT), two with impaired glucose tolerance (IGT) and ten with type 2 diabetes) or Lactobacillus acidophilus NCFM (b) (n 20; including ten subjects with NGT, three with IGT and seven with type 2 diabetes). The first clamp was performed at baseline and the second clamp was performed after 4 weeks (28 d) of intervention.
Cytokines
The baseline characteristics and plasma cytokine concentrations measured during the injection of LPS before the intervention are reported as part of a separate paper, evaluating the differences in the inflammatory response between diabetic and non-diabetic volunteers(Reference Andreasen, Pedersen-Skovsgaard and Berg35).
In the present study, baseline plasma concentrations of TNF, IL-6, IL-1ra and C-reactive protein were comparable between the two treatment groups before the intervention and were unaffected by treatment with either L. acidophilus NCFM or placebo (Table 3).
(Geometric mean values and 95 % confidence intervals)
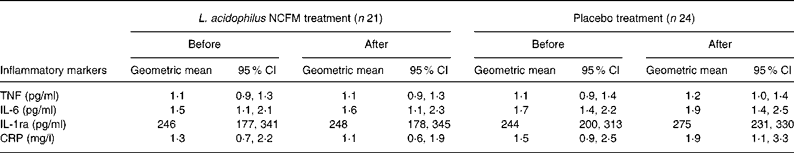
IL-1ra, IL-1 receptor antagonist; CRP, C-reactive protein.
* Baseline concentrations were similar before and after the intervention, independent of treatment allocation.
The administration of LPS triggered a systemic inflammatory response with reversible increases in temperature, heart rate and leucocyte counts (data not shown), as well as in TNF, IL-6 and IL-1ra on both study days (Fig. 3(a–f)). LPS induced significant time-dependent changes in cytokines, which were comparable before and after the treatment course and independent of treatment allocation. Subgroup analyses confirmed these results both in diabetic and non-diabetic individuals.
An intravenous bolus injection of lipopolysaccharide (LPS) at a dose of 0·3 ng/kg was given to forty-five males (type 2 diabetes, impaired glucose tolerance, or normal glucose tolerance) before (○) and after (●) treatment with either Lactobacillus acidophilus NCFM (n 21; a, c, e) or placebo (n 24; b, d, f). Data are geometric means, with 95 % CI represented by vertical bars. According to the ANOVA, LPS induced significant changes in the plasma levels of TNF (a, b), IL-6 (c, d) and IL-1 receptor antagonist (IL-1ra) (e, f) in both treatment groups as well as before and after the intervention. However, the responses before and after treatment were similar, independent of treatment allocation. * Mean values were significantly different from those at baseline both before and after the intervention (P < 0·05).

Discussion
By use of a double-blinded, randomised setup, the present study demonstrates, compared with placebo, that 4 weeks treatment with the probiotic strain L. acidophilus NCFM appears to improve insulin sensitivity in a group consisting of subjects with NGT, IGT or type 2 diabetes. Since L. acidophilus NCFM treatment affected neither baseline inflammatory markers nor the induced inflammatory response, this effect seems not to be linked to the immune function.
In most of the faecal samples collected before the intervention, the concentration of L. acidophilus was below the detection limit of denaturating gradient gel electrophoresis PCR and quantitative PCR used in the present study. Thus, the increase both in the number of subjects positive for L. acidophilus and in the concentration of L. acidophilus after the intervention provided evidence of the presence of the strain in significant amounts in the gastrointestinal tract. These results indicate a satisfactory compliance of participants, as well as an ability of the bacterium to survive gastrointestinal passage.
Subgroup analyses revealed that a consistent decrease in insulin sensitivity, which was absent in the L. acidophilus NCFM group, was evident among placebo-treated subjects. These results indicate an optimising effect of probiotic supplementation on insulin sensitivity, but the underlying mechanisms conveying this phenomenon remain unclear. A beneficial effect on glucose homeostasis is supported by a number of animal studies, in which specific probiotic strains have demonstrated anti-diabetic properties. Thus, antibiotic treatment may protect against diabetogenic changes in rodents, possibly by altering the composition of the gut microbiota(Reference Membrez, Blancher and Jaquet36, Reference Brugman, Klatter and Visser37). Furthermore, a probiotic mixture of L. acidophilus and L. casei has been found to delay the onset of glucose intolerance, hyperglycaemia, dyslipidaemia and oxidative stress in rats with diet-induced diabetes(Reference Yadav, Jain and Sinha2, Reference Yadav, Jain and Sinha3). Finally, probiotic supplementation improved high-fat diet-induced insulin resistance and hepatic steatosis(Reference Ma, Hua and Li38). We cannot entirely exclude the possibility that the differences in insulin sensitivity between the two treatment groups in the present study are in fact caused by an unknown bias, hereby leading to a falsely positive result. The strict double-blinded, randomised design of the study as well as the absence of any obvious confounding factors do, however, make this unlikely. All participants were clamped using identical equipment and procedures before and after the intervention; participants were randomly allocated to either of the two treatment groups throughout the enrolment period; the allocation was double-blinded; the two treatment groups were comparable with regard to baseline data; anti-diabetic treatment of the diabetic patients was equally frequent in the two groups; and participants were instructed to maintain their usual lifestyle throughout the study period. The most likely explanation of absence of decreased insulin sensitivity in the L. acidophilus NCFM group is therefore that a systematic decrease in insulin sensitivity was reversed by the supplementation of L. acidophilus NCFM.
We hypothesised that optimisation of insulin sensitivity due to probiotic treatment could be mediated, at least in part, through immune-modulatory effects. As mentioned above, previous studies have unveiled immune-modulatory and anti-inflammatory effects of L. acidophilus NCFM; L. acidophilus NCFM is capable of interacting with immune cells(Reference Konstantinov, Smidt and de Vos20, Reference Chen, Chiu and Lin21) and improves intestinal integrity(Reference Ouwehand, Tiihonen and Saarinen22); consequently, L. acidophilus NCFM may diminish overflow of LPS from the gut to the systemic circulation and reduce the concomitant induction of Toll-like receptor (TLR)-4 signalling and pro-inflammatory cytokines. Furthermore, specific probiotic strains influence the in vitro secretion of cytokines from immune cells; hence, co-incubation of macrophage cultures with Lactobacillus species has been found to decrease the LPS-induced TNF release from macrophages(Reference Diaz-Ropero, Martin and Sierra39). Since insulin resistance is notably associated with and induced by low-grade inflammation(Reference Pickup, Mattock and Chusney17–Reference Shoelson, Lee and Goldfine19, Reference Hotamisligil, Arner and Caro40), the beneficial effects of probiotic treatment on glucose homeostasis could potentially involve anti-inflammatory mechanisms. In the present study, TNF, IL-6, IL-1ra and C-reactive protein responses were unaffected by treatment allocation. The anti-inflammatory effects of probiotics are highly strain specific, possibly being related to surface antigens on the bacteria(Reference Fink, Zeuthen and Ferlazzo41), and the absent effect on inflammatory parameters in the present study could be due to the choice of bacterial strain. The observed improving effect on insulin sensitivity of L. acidophilus NCFM is thus evidently not related to its anti-inflammatory properties, at least not through any apparent effects on circulating cytokines, and our findings lend no support to the contention that insulin sensitivity is improved through probiotic-induced anti-inflammatory mechanisms. Alternatively, the variation in plasma cytokines due to the intervention may be so discreet that no significant changes during the treatment period were detected with the current number of volunteers included in the present study.
Altering the gut flora by means of probiotic treatment may convey beneficial effects upon insulin sensitivity through inflammation-dependent and -independent mechanisms(Reference Cani and Delzenne8). Changes in circulating gut peptides and adipokines(Reference Cani and Delzenne8), as well as adipose tissue growth(Reference Sato, Uzu and Yoshida42) upon probiotic treatment, are likely to influence insulin sensitivity. Furthermore, gut microbiota influence the capacity of energy uptake from gut contents, and may thus have an impact on obesity(Reference Turnbaugh, Ley and Mahowald9, Reference Backhed, Manchester and Semenkovich43, Reference Backhed, Ding and Wang44), which is a crucial risk factor for insulin resistance and type 2 diabetes(Reference Shoelson, Lee and Goldfine19, Reference Hotamisligil45). However, even though long-term supplementation with certain probiotic strains potentially improves insulin sensitivity in type 2 diabetics through weight loss, the time scope for this explanation goes far beyond the settings of the present study. As of now, the mechanisms causing the beneficial effects of L. acidophilus NCFM on insulin sensitivity observed in the present study therefore remain unknown.
The present study is the first double-blinded, randomised, placebo-controlled trial investigating the effects of the widely applied and recommended probiotic strain L. acidophilus NCFM on insulin sensitivity in human subjects. Furthermore, it is the first of its kind to investigate the effect of a probiotic strain on the LPS-induced inflammatory response in a human in vivo model. This bacterium is generally believed to have beneficial effects on human health; in this context, the present results suggest that L. acidophilus NCFM may indeed ‘confer health benefits on the host’.
In conclusion, compared with placebo, 4 weeks' intake of L. acidophilus NCFM preserves insulin sensitivity, but does not affect the systemic inflammatory response.
Acknowledgements
Ruth Rousing and Hanne Villumsen are acknowledged for their technical assistance and Rikke Krogh-Madsen for reading and commenting on the manuscript.
The Centre of Inflammation and Metabolism (Copenhagen, Denmark) is supported by a grant from the Danish National Research Foundation (no. 02-512-55). The present study was further supported by The Beckett Foundation, The Larsen Foundation, The Foundation of Brdr. Hartmann, The Foundation of Direktør Emil Hertz og Hustru Inger Hertz, The A.P. Møller Foundation, The Foundation of The Danish Diabetes Association, The Lærdal Foundation, and the Foundation of Kong Christian den Tiende. The Copenhagen Muscle Research Centre is supported by grants from the Capital Region of Denmark and the University of Copenhagen. Danisco, Finland, delivered L. acidophilus NCFM for the present study. The company read the manuscript before submission, but posed no restrictions to the study or the manuscript.
A. S. A., T. P.-S. and R. B. carried out the study on the human volunteers. A. S. A. drafted the manuscript, the work involving the detection of L. acidophilus in the stool samples was performed by N. L. and K. D. S. provided statistical counselling. B. K. P., M. J. and K. M. conceived of the study and participated in its design and coordination and helped draft the manuscript. All authors read and approved the final manuscript.
There are no conflicts of interest.


