


During the past decade, analyses drawing on several democracy measures have shown a global trend of democratic retrenchment. While these democracy measures use radically different methodologies, most partially or fully rely on subjective judgments to produce estimates of the level of democracy within states. Such projects continuously grapple with balancing conceptual coverage with the potential for bias (Munck and Verkuilen Reference Munck and Verkuilen2002; Przeworski et al. Reference Przeworski, Alvarez, Cheibub and Limongi2000). Little and Meng (L&M) (Reference Little and Meng2023) reintroduce this debate, arguing that “objective” measures of democracy show little evidence of recent global democratic backsliding.Footnote 1 By extension, they posit that time-varying expert bias drives the appearance of democratic retrenchment in measures that incorporate expert judgments. In this article, we engage with (1) broader debates on democracy measurement and democratic backsliding, and (2) L&M’s specific data and conclusions.
We argue that assessing whether democracy has recently declined hinges crucially on the conceptualization and operationalization of democracy. Democracy is a contested concept, and indices measuring different notions of democracy capture different aspects of political systems. For this and other reasons, including measurement error, democracy measures may disagree on levels of democracy and trends in democratic backsliding, both for individual countries and in the global aggregate. For example, figure 1 plots the relationship between L&M’s (“objective”) index and V-Dem’s Electoral Democracy Index (EDI) for all countries from 1980 to 2020 (Coppedge et al. Reference Coppedge2023a, Reference Coppedgeb; Teorell et al. Reference Teorell, Coppedge, Lindberg and Skaaning2019). There is a moderate correlation for country-years with EDI scores less than 0.4 (ρ=0.56) but a much lower correlation for country-years with EDI scores greater than or equal to 0.4 (ρ=0.16). Clearly, the two indices measure democracy very differently. The same is evident when we consider differences in country-level scores and trends.Footnote 2
We argue that assessing whether democracy has recently declined hinges crucially on the conceptualization and operationalization of democracy. Democracy is a contested concept, and indices measuring different notions of democracy capture different aspects of political systems.
Global Comparison of L&M and V-Dem EDI Indices

This article investigates the sources of such divergences in measured democracy trends. We cannot measure democratic backsliding without conceptualizing democracy and constructing democracy measures that reflect this concept. Therefore, the first section discusses conceptual issues in measuring democracy and democratic backsliding. The second section describes how V-Dem’s expert-based approach to measuring democracy limits the potential for systematic bias, using different tests to interrogate whether its experts have exhibited systematic pessimism (i.e., a “bad-vibes bias”) in recent years. We find no evidence for these claims.
The third section highlights two common misconceptions. First, the distinction between “objective” and “subjective” indicators is overblown: coding seemingly objective indicators typically requires multiple hidden judgments by human raters. Measures of contested concepts, such as democracy, are therefore not so much either “objective” or “subjective” but rather more or less judgment based (i.e., “observer-invariant”). Second, indicators that require fewer judgments are not necessarily less biased than those that rely on substantial human judgment. Whether a particular indicator—“objective” or “subjective”—exhibits bias varies substantially by the mapping between concept and indicator and the data-construction process.
The fourth section evaluates L&M’s objective measures. As we foreshadow in figure 1, there is little evidence that L&M operationalize democracy in a way that maps onto any easy-to-recognize version of the concept. Moreover, various problematic and subjective coding decisions undermine the credibility of their empirical exercise, whether the goal is to broadly measure democracy over time or only to evaluate aspects of democratic backsliding on a measure-by-measure basis.
FOUNDATIONAL BUILDING BLOCKS FOR ASSESSING DEMOCRATIC BACKSLIDING
We first provide an overview of considerations for conceptualizing democracy and backsliding. These considerations are not novel but they delineate a common ground for addressing the more technical measurement issues discussed in subsequent sections.
Conceptualizing Democracy
Scholars conceptualize democracy in various ways (Coppedge et al. Reference Coppedge, Gerring, Altman, Bernhard, Fish, Hicken, Kroenig, Lindberg, McMann, Paxton, Semetko, Skaaning, Staton and Teorell2011): some democracy definitions are minimalist, focusing only on contested elections (e.g., Przeworski et al. Reference Przeworski, Alvarez, Cheibub and Limongi2000), whereas others are maximalist, incorporating several additional attributes (e.g., Beetham Reference Beetham1999). Despite the lack of consensus, most scholars agree that it is desirable to (1) specify the democracy concept being measured; and (2) select indicators and aggregation rules so that the measure reflects the underlying concept (Adcock and Collier Reference Adcock and Collier2001; Goertz Reference Goertz2006; Munck and Verkuilen Reference Munck and Verkuilen2002). Conceptualization precedes measurement, and measurement characteristics should reflect the boundaries and logical structure of the underlying concept.
In their foundational article, Munck and Verkuilen (M&V) (Reference Munck and Verkuilen2002) specify the tasks involved in measuring democracy. These tasks include identifying all relevant attributes of the concept and which indicators tap into each attribute, avoiding issues of redundancy and conflation. M&V also highlight the importance of selecting aggregation rules that reflect the logical structure of the concept and not uncritically using simple default rules (e.g., taking the unweighted average across all indicators). In cases in which some indicators reflect more important aspects of the concept, they should be weighted more heavily. In cases in which indicators reflect attributes that are necessary for high democracy scores, the aggregation rule should be multiplication instead of averaging (see also Goertz Reference Goertz2006).
M&V argue that many democracy measures fail these challenges. For example, Freedom House does not build on a clearly specified democracy concept, it includes several redundant indicators, and it uses simple aggregation rules without justification. However, M&V positively assess the dichotomous Alvarez-Cheibub-Limongi-Przeworski (ACLP) measure (Przeworski et al. Reference Przeworski, Alvarez, Cheibub and Limongi2000), which has a carefully specified underlying concept and is aligned with this conceptualization. However, ACLP captures only a binary and minimalist democracy concept that focuses on contested elections and therefore is not fit for capturing a more multidimensional concept of democracy. While narrow conceptualizations of democracy are helpful in many contexts, researchers often conceptualize democracy more broadly.
Indeed, there are no objective measures that capture all attributes that should be included in more extensive concepts of democracy. This problem with objective indicators—including those of L&M—is particularly acute if we want sufficiently nuanced measures to usefully capture democratic changes in an age when (aspiring) autocrats know how to abuse formal democratic institutions (Bermeo Reference Bermeo2016; Levitsky and Ziblatt Reference Levitsky and Ziblatt2018; Lührmann and Lindberg Reference Lührmann and Lindberg2019).
In contrast, V-Dem’s EDI and other democracy measures tap into clearly specified and more encompassing democracy concepts, and they have aggregation rules that reflect these concepts (Teorell et al. Reference Teorell, Coppedge, Lindberg and Skaaning2019). By necessity, they include not only objective indicators (e.g., share of adult population with suffrage) but also subjective indicators that rely on country-expert coding (e.g., freedom of discussion for women and the autonomy of the election monitoring board). The latter indicators capture aspects of democracy for which relevant and comprehensive objective indicators do not exist.
Conceptualizing Backsliding
The notion that democracy measurement influences reported trends in democracy—including the nature and depth of recent democratic decline globally—is established knowledge among democracy scholars (for a recent analysis, see Treisman Reference Treisman2023). Indeed, Waldner and Lust (Reference Waldner and Lust2018) find that V-Dem measures are actually relatively conservative in identifying backsliding. Knutsen and Skaaning (Reference Knutsen, Skaaning, Coppedge, Edgell, Knutsen and Staffan2022) describe how different V-Dem measures (e.g., freedom of expression and suffrage) have followed different historical and recent global trends. Finally, the V-Dem Institute’s Democracy Reports (e.g., Alizada et al. Reference Alizada, Boese, Lundstedt, Morrison, Natsika, Sato, Tai and Lindberg2022) display variation based on measurement technique: the recent decline is much larger for population-weighted global scores than unweighted cross-country averages.
These examples highlight the fact that there are myriad ways to conceptualize “democratic backsliding” or the many similar terms that are used widely. Backsliding could refer to country-specific trends or phenomena at a regional or global level. At the global level, it could be measured by taking a simple average across countries (as in this study) or by using population-weighted trends.Footnote 3 It could be conceptualized as a short-term phenomenon (occurring within a year) or a long-term process (occurring over multiple years) or even an entire “episode.”Footnote 4 Moreover, the conceptualization of democratic backsliding depends on the conceptualization of democracy—for example, if democracy is unidimensional or multidimensional, or a binary state or a spectrum.
Rather than delving into all of these conceptual decisions, we highlight three points regarding backsliding with implications for its measurement. We delineate the two dominant opposing views on each point as follows, with parenthetical notes about the view’s implication for quantifying recent backsliding:
-
1. Does the conceptualization of democracy—and therefore backsliding—focus on competitive elections (less backsliding) or consider checks on executive power, protections of civil liberties, a critical media, and active civil society (more backsliding)?
-
2. Does the conceptualization of backsliding treat it as a short-term phenomenon (less backsliding) or a longer-term process, occurring, for example, over five or 10 years (more backsliding)?
-
3. Does the conceptualization of backsliding pertain to quite democratic countries (less backsliding), or can backsliding theoretically occur in any country, regardless of its level of democracy (more backsliding)?
Concerning point 1, many scholars agree that recent backsliding has occurred predominantly through processes driven by elected incumbents who gradually concentrate power in their own hands—also known as “executive aggrandizement” (Bermeo Reference Bermeo2016; Levitsky and Ziblatt Reference Levitsky and Ziblatt2018; Lührmann and Lindberg Reference Lührmann and Lindberg2019). This leads to a more subtle degrading of less formalized and more difficult to observe supporting pillars of democracy, including civil liberties, civil society mobilization, freedom of the press, and judicial independence. These features of political regimes typically are not conceptually included in minimalist definitions or operationalizations of democracy. By contrast, more blunt and directly observable violations of elections (e.g., ballot-box stuffing and election violence) do not feature as prominently in many recent backsliding episodes.
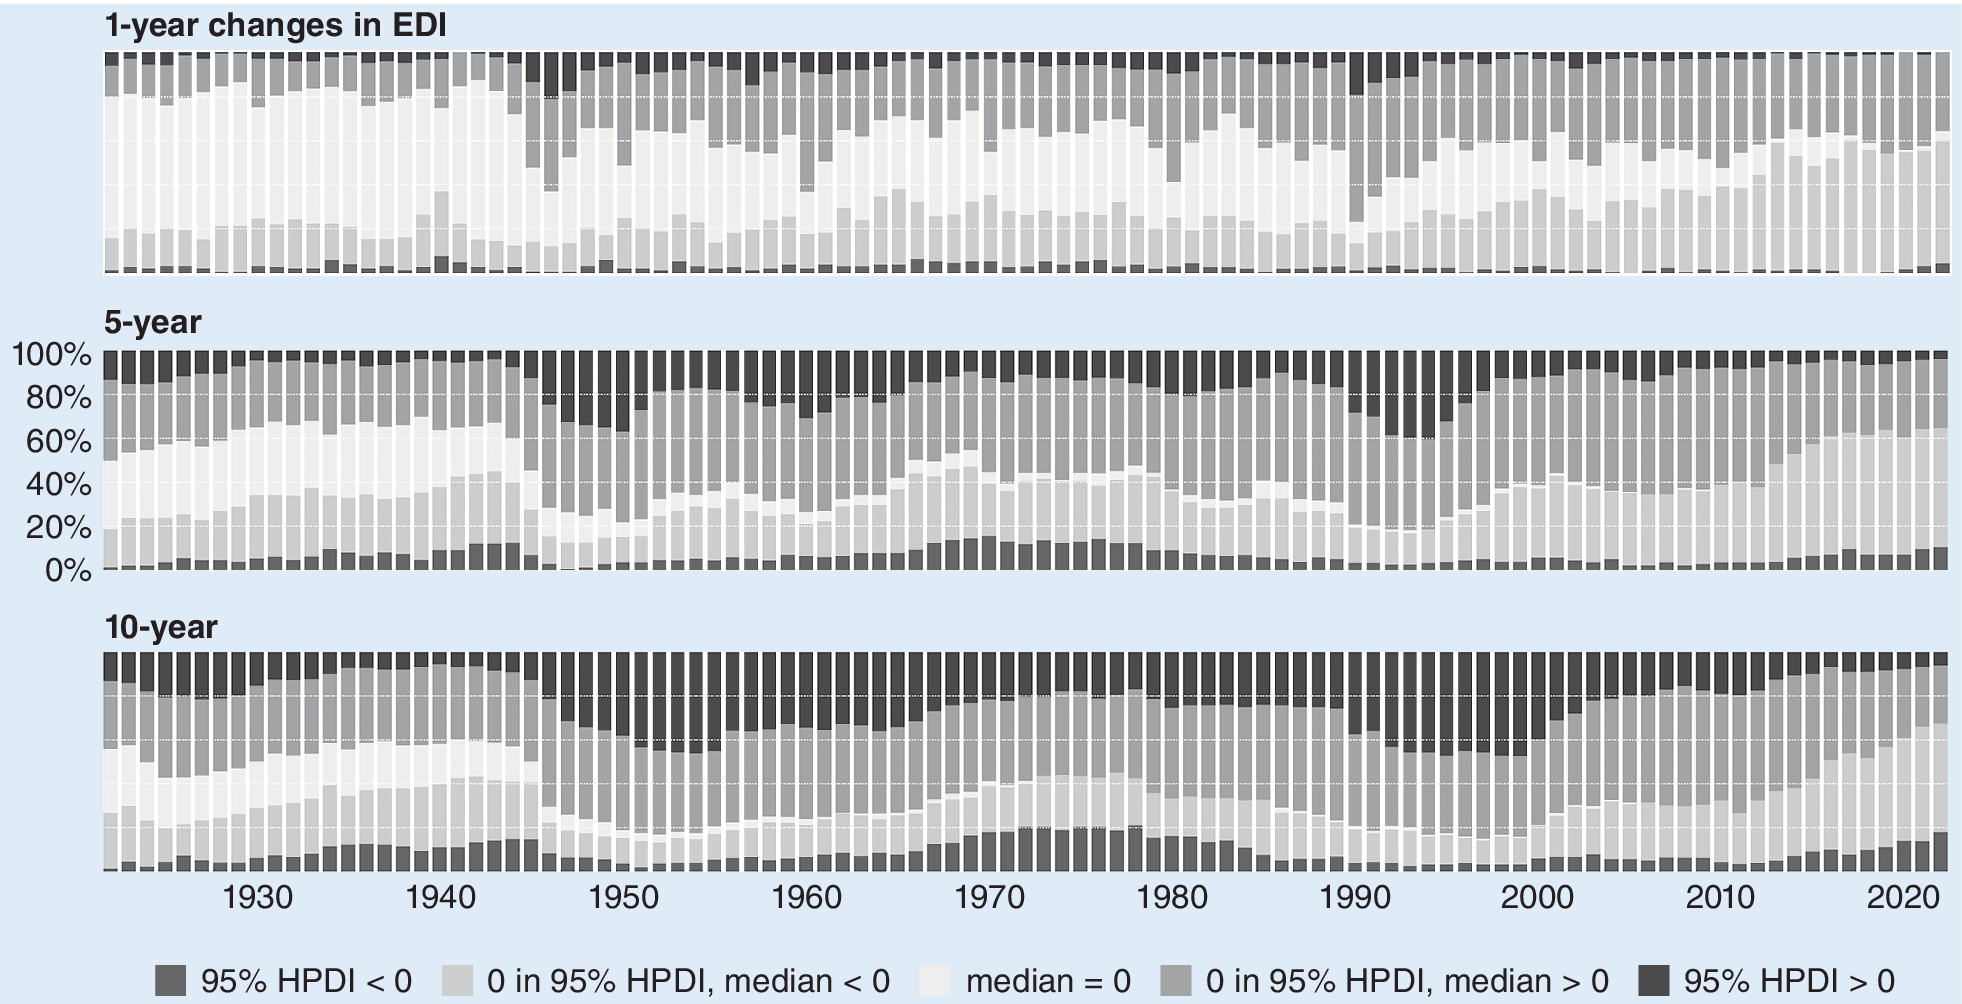
We illustrate point 2 in figure 2, which plots negative and positive changes in V-Dem’s EDI over one-, five-, and 10-year horizons. Although it is difficult to discern any global trend over the short term, more countries show (significant) backsliding over the long run, especially for the 10-year intervals.
Relative Frequencies of 1-, 5-, and 10-Year Changes in EDI by Year
Bars at the top of each cell indicate positive changes; bars at the bottom of each cell indicate negative changes. Darker colors indicate “significant” changes—that is, without 0 in 95% credible intervals.
We illustrate point 3 in figure 3, which shows that relatively few of the significantly backsliding countries were initially in the top EDI quartile of countries. Backsliding occurred more often in countries with intermediate democracy scores.
10-Year Trajectories of Countries with Clearly Discernible Negative (32) and Positive (11) Changes
Clearly discernable changes are those without 0 in 95% Credible Intervals.

BIASES IN V-DEM MEASURES? CLARIFICATIONS AND TESTS
To explain reported global democratic backsliding, L&M propose that, in recent years, experts have been increasingly negatively biased due to pessimism about the state of democracy. This question is fundamental for enterprises such as V-Dem, which rely on experts to code concepts for which there are no objective data. Although we cannot discount entirely the possibility of such bad-vibes bias—for instance, one driven by a pessimistic media environment—we are skeptical that it strongly influences reported global trends in democracy.Footnote 5 This section explains our skepticism, first by clarifying important aspects of the V-Dem methodology and then by presenting empirical tests for expert bias.
V-Dem’s Approach to Limiting Expert Biases
V-Dem’s approach to gathering and aggregating expert-coded data militates against bad-vibes bias in multiple ways (Coppedge et al. Reference Coppedge2023c). First, V-Dem experts do not code broad concepts like “democracy” directly. Instead, they predominantly code more specific concepts such as election violence in a given country-year. This specificity presumably makes these concepts less prone to general pessimism biases. To create meso- and high-level indices, V-Dem algorithmically aggregates these scores upwards.
For example, V-Dem’s EDI is the average of a multiplicative and an additive index, both constructed from five subindices scaled from 0 to 1 (Teorell et al. Reference Teorell, Coppedge, Lindberg and Skaaning2019). Of these five measures, two are objective: the proportion of citizens with suffrage and whether and how officials are elected. The remaining three measures are meso-level indices of democracy-relevant concepts: freedom of association, freedom of expression, and clean elections. Each measure consists of six to nine relevant expert-coded variables, aggregated using Bayesian Factor Analyses (BFAs).Footnote 6 For bad-vibes bias to affect EDI, it must systematically affect not only most V-Dem experts but also these experts’ ratings across multiple indicators related to distinct, low-level concepts.
Second, when coding their specific concepts, V-Dem experts use ordinal scales with set definitions for each item, which serve as meaningful benchmarks to guide their coding. This specificity again ameliorates concerns that a general unease about democracy greatly affects estimates.
Third, the specificity of V-Dem coders’ expertise should lessen the risk of pessimism affecting their ratings. V-Dem experts are individuals—typically, scholars with advanced degrees—with a deep knowledge of the concepts (e.g., judiciary and political parties) and countries (i.e., most are citizens or residents) that they rate. Although experts might contextualize their ratings based on an overall sense of political trends worldwide, their detailed expertise should allow them to determine whether their case is an exception to the trend.
Fourth, V-Dem’s method for aggregating expert data accounts for the possibility that individual experts have idiosyncratic biases. V-Dem uses a Bayesian Ordinal Item-Response Theory Measurement Model (MM) to aggregate expert-coded data (Pemstein et al. Reference Pemstein2023). It corrects for two forms of error that relate to L&M’s argument: variation in expert reliability and scale perception. Concerning expert reliability, the MM assumes that experts who diverge from other experts in directionality (e.g., coding lower scores higher) are less reliable. Accordingly, it adjusts the contribution of these experts downward. If a few experts for a particular country shift their scores downward due to bad-vibes bias, the bad-vibing experts likely will be considered less reliable and contribute less to the estimation process. A country’s score on an indicator therefore is unlikely to experience a large decline unless the majority of its experts experience similar bad vibes.
The MM also assumes that experts vary in scale perception: some experts tend to code higher or lower than other experts or have different thresholds for changes in ordinal levels (Pemstein, Tzelgov, and Wang Reference Pemstein, Tzelgov and Wang2015).The experts who are most likely to change their ratings due to bad vibes about democracy presumably will have more compressed thresholds than more vibe-resistant experts. The effect of the former changing their scores therefore should be relatively small.
Despite its demonstrated ability to recover latent scores (Marquardt and Pemstein Reference Marquardt and Pemstein2018, Reference Marquardt and Pemstein2023), the MM does not directly correct for time-varying bad-vibes bias. That is, if all experts rating a country become stricter for a subset of years that they code in unison, the MM likely would be unable to adjust for this behavior. However, V-Dem accounts for potential universal variation in strictness based on the time period that an expert codes in other ways (Knutsen et al. Reference Knutsen2019; Pemstein et al. Reference Pemstein2023). For example, historical V-Dem experts, who typically code for the period 1789–1920, tend to be somewhat less strict than contemporary experts, which is likely because their frame of reference is different. V-Dem has long deployed technical fixes such as weighted empirical priors to account for these differences. Beginning in 2020, V-Dem also began asking newly recruited experts who code recent years to code selected dates covering a country’s entire time series from 1900 onward. By expanding these experts’ frame of reference, this strategy should facilitate the contextualization of short-term recent trends, thereby reducing the likelihood that general pessimism about democracy affects contemporary coding decisions.
Fifth, V-Dem incorporates expert disagreement into its estimates of country-year indicator values. Greater expert disagreement about a country-year value generally results in broader credible intervals (a Bayesian corollary of confidence intervals) about the point estimate. V-Dem reports this uncertainty alongside point estimates for all expert-coded indicators. Crucially, this uncertainty is propagated as V-Dem data are aggregated upward to meso- and then higher-level indices (e.g., EDI). Greater uncertainty about lower-level indicators thus results in greater uncertainty about overall democracy levels for that specific case.
There Is Little Evidence of Bad-Vibes Bias in V-Dem
Despite these strategies, temporal proximity to events that are being coded still could affect expert strictness: the issue might not be an expert’s frame of reference but instead uncertainty due to unfolding political events. Unfortunately, this is difficult to assess directly.Footnote 7 However, there are more indirect tests that can assess the extent of bias.Footnote 8
First, the data-generating process assumed under the most straightforward version of L&M’s “time-varying bias” argument implies a fairly uniform erosion of measured democracy across countries and across components and indicators of democracy. However, only a minority of countries have registered significant erosion in V-Dem’s EDI.Footnote 9 Across 2012–2022, for example, 32 countries experienced negative change and 11 experienced positive change in EDI; more than 100 countries experienced no significant change (see figures 2 and 3 and Knutsen et al. Reference Knutsen2023 for replication data). Moreover, for countries that do evince a significant democracy decline, there is great variation in trends among individual components and indicators. The indicators on elections (e.g., vote buying and electoral management bodies’ capacity) are least likely to show significant declines, whereas indicators on freedom of expression, censorship, and repression of civil society are among the indicators that most often are declining.
Second, the time-varying pessimistic mood bias that L&M assert should be stronger for more recent coding decisions. Insofar as recent coding by V-Dem experts mainly centers on their country’s situation in recent years, any such increase in bias is difficult to distinguish from a true change in the democracy situation on the ground. However, one feature of V-Dem’s coding allows us to separate these types of changes: country experts can change their previous scores when coding annual updates for V-Dem. If time-varying bias were present, coders would become increasingly harsh judges of democratic trends and give increasingly negative ratings in successive updates. If the bias were growing, as L&M argue, a fraction of coders could come to believe that their own earlier ratings were too positive in light of subsequent trends; few would believe they had been too negative. If bad-vibes bias is more prevalent in recent years, we therefore should observe that (1) many experts update their previous coding; and (2) they consistently do so in a “more pessimistic” direction.
To assess this, we combined coder-level information from V-Dem’s v.9 (2019) and v.13 (2023). Specifically, we analyzed the 23 expert-coded indicators that enter the EDI. Less than 1.4% of experts changed scores for any variable in 2019 or later, and those who did change did not systematically alter their scores in a more pessimistic direction. Figure 4 displays the EDI variables with averages unaffected by revisions. Online appendix A includes additional graphs for those variables that experienced change and equivalent analyses of indicators entering V-Dem’s Liberal Component index. We also present analyses of change from v.5 (2015) to v.13 in online appendix A. All of the analyses show similar results.
Expert-Coded Indicators Entering V-Dem’s EDI Without Any Systematic Change After Year 2000 Due to Coder Revisions (from V-Dem V.9 to V.13)

Third, the most straightforward interpretation of L&M’s formal model (see L&M’s online appendix C1)—and one necessary for testing its implications—is that the coder bias is linear and additive, affecting all units equally. If a common bias affects expert coders across countries, we might expect greater synchronization of changes in V-Dem’s indices. To assess this, we considered all one-year changes for each year on EDI and computed their mean, median, standard deviation (SD), median absolute deviation from the median (MAD), and estimated entropy (EE). These changes for the past century are reported in figure 5. The means and medians are minuscule. The trends in SD, MAD, and EE show that, if anything, one-year changes are now less homogeneous than they were historically.
One-Year Changes in EDI Metrics
The metrics displayed are Mean, Median, Standard Deviation from the Mean, Median Absolute Deviation from the Median, and Estimated Entropy in Bits, with Credible Intervals.

Fourth, it is possible that ideological bias (including bad-vibes bias) manifests in systematic expert disagreement. We interrogated this concern in several ways. First, in their assessment of V-Dem’s corruption indicators, McMann et al. (Reference McMann, Pemstein, Seim, Teorell and Lindberg2022) examine the correlates of V-Dem expert disagreement at the question-country-year observation level and find no evidence of “situational closeness”—that is, that experts are biased in favor of countries that align with them ideologically. Specifically, experts with stronger allegiance to the liberal principle of democracy are not more likely to rate liberal countries as less corrupt, and experts who support the free market are not more likely to rate free-market economies as less corrupt. Second, online appendix B examines patterns in expert disagreement for two V-Dem expert-coded indicators: (1) a low-subjectivity indicator (i.e., election boycotts, v2elboycot); and (2) a (particularly) high-subjectivity indicator (i.e., free and fair elections, v2elfrefair). We find no evidence of systematic expert disagreement for the low-subjectivity indicator, whereas expert disagreement on the high-subjectivity indicator is greatest for countries and years that are more recent, and which have higher freedom of expression, lower levels of democracy, and more experts coding them. Although expert disagreement is a weak signal of bias, our analysis indicates that only highly subjective V-Dem indicators are vulnerable to systematic expert disagreement.Footnote 10 Altogether, we find little to no empirical evidence to support L&M’s proposed time-varying bad-vibes bias in V-Dem’s expert-coded data.
OBJECTIVE VERSUS SUBJECTIVE MEASURES OF DEMOCRACY
L&M epitomize a common approach to measuring democracy: relying on objective measures for operationalization (e.g., Cheibub, Gandhi, and Vreeland Reference Cheibub, Gandhi and Vreeland2010). This approach often is contrasted with the more evaluative approach of V-Dem. This section discusses the blurred line between objective and subjective measures.
The Exaggerated Distinction Between Objective and Subjective Indicators
A sharp distinction between objective and subjective indicators constitutes a false dichotomy: seemingly objective measures often entail considerable elements of subjectivity. Although there may be relative differences in bias among different types of questions and human raters—country experts, ordinary citizens, and research assistants—all raters exert at least some form of judgment (Marquardt et al. Reference Marquardt2017). Therefore, there is no human-coded measure of democracy—or, more specifically, democratic institutions—that is wholly objective. Instead, there are degrees of subjectivity.
A sharp distinction between objective and subjective indicators constitutes a false dichotomy: seemingly objective measures often entail considerable elements of subjectivity. Although there may be relative differences in bias among different types of questions and human raters—country experts, ordinary citizens, and research assistants—all raters exert at least some form of judgment.
“Fact-based” measures from V-Dem illustrate this point. These variables, which complement V-Dem’s expert-coded variables, cover concepts such as the seat or vote share of the largest party in parliament, and they are coded by research assistants. Despite being based on observable facts, these variables require several subjective decisions (e.g., how to code independents, which election round to consider, and how to address diverging sources). These V-Dem variables therefore are accompanied by protocols and routines for deliberation within the broader team for addressing ambiguous cases.
A more general lack of perfect inter-rater reliability in objective indicators (including those that L&M use) further illustrates our point. Consider the National Elections Across Democracy and Autocracy (NELDA) project, which codes phenomena related to elections. The project is transparent about rater disagreement and subjectivity, providing analyses of inter-rater reliability for approximately 20% of their cases (Hyde and Marinov Reference Hyde and Marinov2012, Reference Hyde and Marinov2019). Across these indicators, the proportion of cases in which two coders agree ranges from 58% to 98%, with an average of 83%. Other projects elaborate only on their decisions for presumed difficult cases. For example, the Database of Political Institutions (DPI) project provides information about “ambiguous” cases to justify coding decisions for which other raters plausibly would have come to other conclusions (Cruz, Keefer, and Scartascini Reference Cruz, Keefer and Scartascini2021). In some cases, DPI assigns intermediate values when they are unsure about which ordinal category to use. The pervasiveness of uncertainty and disagreement, even in these gold-standard projects, demonstrates that judgment substantially affects objective data.
As a final illustration of the difficulty of coding even seemingly straightforward objective measures, we consider the most widely used and highly regarded objective democracy measure: the binary, minimalist ACLP (Cheibub, Gandhi, and Vreeland Reference Cheibub, Gandhi and Vreeland2010; Przeworski et al. Reference Przeworski, Alvarez, Cheibub and Limongi2000). ACLP relies on four coding rules pertaining to observable factors: elected legislature; indirectly or directly elected executive; elections are multiparty; and alternation of government after loss in elections. However, Knutsen and Wig (Reference Knutsen and Wig2015) highlight how this measure requires nontrivial judgment calls when applying the alternation rule and especially for determining how long current regime institutions have existed.
Concerns about rater judgment multiply when a project aggregates indicators upward to create indices that measure more complex concepts. It is important to note that many rater judgment calls often lack accompanying information about how decisions were made. Therefore, such measures are not easily reproducible in practice—a common purported benefit of objective measure.
Given these concerns, subjective approaches that use expert evaluations can be more reproducible than their objective counterparts. Although V-Dem uses multiple experts to provide openly subjective assessments of numerous political phenomena and therefore is superficially less reproducible than presumed objective measures, it is transparent about the use of judgment and the uncertainty that this entails. All V-Dem expert scores are publicly available, as are the aggregation methods and criteria. The V-Dem data-production process therefore is replicable, in that anyone could apply the same process with another set of experts. Moreover, reported estimates of uncertainty allow users of the V-Dem data to easily identify contexts in which there is more disagreement between experts’ evaluations, providing a systematic tool for predicting replication variability. Thus, V-Dem follows Schedler’s dictum (Reference Schedler2012, 21) that judgment is a critical “ingredient of political measurement that needs to be acknowledged and rationalized rather than exorcised.”
“Objective” Is Not Unbiased
L&M’s use of “objective” corresponds to what we call “observer-invariance,” which is closely related to the concepts of reliability and replicability—that is, all observers obtain the same result when using the measure to code the same case.Footnote 11 Despite their virtues, observer-invariant measures are not necessarily less biased than so-called subjective measures that explicitly include an evaluative component.
First, for purposes of illustration, we consider this trivial measure: “A country is democratic if and only if it has ‘democratic’ in the country name.” If observer-invariance were the most important criterion for judging democracy measures, this measure would be preferable to most other democracy measures. Yet, despite its reproducibility, it would be a strongly biased measure of democracy because some authoritarian regimes are eager to use their country’s name to signal democratic credentials (e.g., the Democratic People’s Republic of Korea). “Democratic in country name” obviously is not a measure used by scholars who advocate for objective democracy measures, but it clearly illustrates that observer-invariant (i.e., “objective”) measures are not inherently less biased or free of measurement errors.
Biases in objective indicators also can change over time. For instance, one method for detecting election fraud is to consider the distribution of second digits in officially reported results from electoral precincts (for a critique, see Medzihorsky Reference Medzihorsky2017). This method relies on the premise that regime officials who attempt to cheat often select numbers ending on the same digit (e.g., 0). However, after researchers discuss this pattern publicly, authoritarian regime officials may adapt and randomize second digits for fraudulent election results to avoid detection. Consequentially, such digit-based tests become an increasingly poor proxy for detecting electoral fraud.
This point has implications for L&M’s finding that objective measures demonstrate less backsliding. In an age when democracy is a high-legitimacy system that even autocrats attempt to emulate (Miller Reference Miller2015), successful autocratizers are those who avoid blatant and easily documentable actions to undermine democracy (Levitsky and Ziblatt Reference Levitsky and Ziblatt2018). Objective indicators that pertain to such actions (e.g., stuffing ballot boxes to win more than 75% of votes) therefore may be less tightly associated with the broader state of democracy than in previous years. Thus, there may not be a bias only in objective proxy indicators of democracy (e.g., incumbent vote share) but the bias also may have increased over time, contributing to the lack of observed backsliding in objective measures of the type that L&M use.
EVALUATING L&M’S DEMOCRACY INDICATORS AND INDEX
To measure global trends in democracy, L&M use 15 indicators from several sources. They then use 12 of these indicators to create an “Objective Index” of democracy (table 1).Footnote 12 L&M emphasize that their index is not a comprehensive democracy measure. However, it is an explicit codification of the implicit assumption of their discussion of individual indicators: that is, the cumulative effect of analyzing averages for each indicator across time is to measure trends in democracy. As such, the index reflects a conceptualization of democracy that we formalize as follows:
 $$ {\displaystyle \begin{array}{c}\mathrm{Democracy}=\frac{\mathrm{Exec}.\mathrm{Constraints}}{4}+\frac{\mathrm{Competition}}{2}\\ {}\hskip15em \times \left(\frac{\mathrm{General}}{2}+\frac{\mathrm{Exec}.}{2}+\frac{\mathrm{Legis}.}{3}\right)+\frac{\mathrm{Suffrage}}{12}\end{array}} $$
Indicators in L&M’s Index

Note: All variables are rescaled 0–1 for the index.
This conceptualization involves several debatable elements. First, these data largely pertain directly to procedural aspects of elections and electoral outcomes. As previously discussed, although elections are crucial to democracy, a focus on these indicators is severely limited; contemporary backsliding involves more subtle manipulation of democratic institutions. Although including executive constraint data expands the scope of the index, it does so in a nonintuitive way: these indicators were collected with the intent of explaining “patterns of regime durability in dictatorships” (Meng Reference Meng2020, 3), not democracy or democratic backsliding. The contrasting use of executive constraints in the form of term limits for democratic backsliding in Ecuador under Correa and Turkey under Erdoğan is illustrative: the former eliminated term limits to seek a third term, whereas the latter adopted them to centralize authority. (Note also that many high-quality parliamentary democracies do not have term limits, which suggests that they are not universally relevant to democratic-ness.)
Second, the equal weight given to all indicators in the benchmark version of L&M’s index is equivalent to assuming that all variables have the same relationship with the underlying concept (i.e., “democracy”).Footnote 13 This assumption is problematic. For example, whereas scholars may debate the relevance and relative importance of term limits and other executive constraints to democracy, the absence of term limits presumably is not conceptually as important as having 0% suffrage.
In addition to L&M’s limited and idiosyncratic conceptualization of democracy, issues with operationalization and missingness make their data ill suited for assessing trends in democracy, whether as individual indicators or aggregated in an index.
Operationalization Issues with L&M’s Indicators
As figure 6 illustrates by plotting eight of L&M’s 12 index indicators against V-Dem’s EDI, two thirds of the indicators that they use have a problematic scaling to the concept of democracy. First, across these indicators, the category/value with the greatest spread in democracy values is the top category/value. This demonstrates that these indicators have a very low threshold for considering a country as highly democratic. Would-be democratic backsliders thus have much room for deterioration before they receive a lower score.
Relationship Between L&M Data and EDI

Second, the ordered categorical variables that L&M use are not interpretable as interval-level values; the categories within each variable scale differently onto the democracy concept. Figure 7 illustrates this problem conceptually, using the codebook entry for DPI’s legislative index of electoral competitiveness (Cruz, Keefer, and Scartascini Reference Cruz, Keefer and Scartascini2021). The first five categories all relate to highly uncompetitive situations in which opposition parties won no seats; only the top two categories correspond to remotely competitive situations.
DPI Codebook Description of Legislative Index of Electoral Competitiveness

The top four cells in figure 6—L&M’s ordinal indicators—illustrate the empirical implication of this issue. Across all categorical variables, there is limited variation between many ordinal values and levels of democracy and high variation between others. The pattern of variation demonstrates that none of these four variables can be treated as remotely continuous, meaning that they essentially are uninterpretable either as cross-national averages—as in either of L&M’s analyses of individual variables—or as part of their additive index.
L&M’s index contains four indicators in addition to those shown in figure 6: party years in power, incumbent vote, seat shares, and incumbent party loss. Although these indicators are problematic at the country level for tracking levels of democracy (see online appendix D), L&M argue that they provide signals about the electoral competitiveness of incumbents, on average, across countries. Even if we accept this argument, only a third of L&M’s index variables are then both properly operationalized and relevant for the purpose of measuring backsliding—and then only in a very limited way. This presents clear problems for the comprehensiveness of L&M’s analyses and thus for drawing conclusions about global democratic backsliding.
Missingness in the Data
Missingness in the L&M data is extensive. The median country-year observation in their index has two missing indicators; 43% of country-years are missing a quarter or more of the indicators and 11% are missing half or more.
This missingness makes it difficult to use each indicator—even in isolation—to draw meaningful conclusions about global trends in democracy. The left-most panel in figure 8 presents results from regressing V-Dem’s EDI on dummy variables coding missingness in each L&M indicator. Coefficients are mostly negative and statistically significant: less democratic country-years are more likely to be missing. Although this selection issue is concerning, it is even more disconcerting that similar trends appear when regressing one- and five-year changes in EDI on missingness for each L&M indicator (see the right-hand panels in figure 8). Overall, missingness in L&M’s indicators predicts backsliding on EDI, especially for five-year changes. Thus, the measures that L&M rely on are biased against finding backsliding; their descriptive analyses present “world-average” scores for which country-years that exhibit democratic backsliding are systematically missing.Footnote 14
Results of Regressing EDI Levels and Differences on Indicators of Missingness for Each L&M Indicator

The Importance of Face Validity Checks
No amount of abstract discussion regarding measurement principles obviates the relevance of assessing how measures perform in practice, using other pieces of information as points of reference.Footnote 15 We demonstrate this point with two brief case studies.
Figure 9 shows trends since 1980 for China and Turkey using L&M’s index, EDI, and Polity (rescaled 0–1) (Marshall and Gurr Reference Marshall and Gurr2020). China is a relatively stable, one-party autocracy despite recent personalization under Xi Jinping (Shirk Reference Shirk2018). The Chinese Communist Party controls all political offices, which are not subject to competitive elections. Thus, even with the most procedural definitions of democracy, China should have scored very low during the period 1980–2020. By contrast, Turkey is a prominent case in the recent backsliding literature (Andersen Reference Andersen2019; Cleary and Öztürk Reference Cleary and Öztürk2022; Mechkova, Lührmann, and Lindberg Reference Mechkova, Lührmann and Lindberg2017). Throughout the 1980s until the early 2000s, Turkey engaged in a piecemeal reform process that addressed democratic deficits in its 1982 constitution, which had been established by a military junta that ruled from 1980 to 1983. Many reforms also involved changes to ordinary laws to limit military involvement in politics, protect individual freedoms, and ensure the rule of law (Özbudun Reference Özbudun2007). However, since the 2000s, Recep Tayyip Erdoğan has gradually dismantled Turkey’s democracy by repressing the opposition and pushing through changes that expanded the executive’s power (Esen and Gumuscu Reference Esen and Gumuscu2018). These two cases provide variation on what we should expect to see in scores and trends in measures of democracy.
Trends in Democracy Scores for China and Turkey

According to L&M’s objective index, China scored 0.50 during the period 1980–1981 and then achieved a perfect 1.00 from 1982 to 2017, before it “backslid” to 0.75 in the period 2018–2020. These changes are marked solely by the implementation of executive term limits in the 1982 Chinese constitution and their subsequent removal under Xi Jinping in 2018. More important, the L&M index departs drastically from the consistently low rating for China on both the EDI and Polity indices. For example, in 1989 (the same year as the Tiananmen Square Massacre), China scored perfectly on L&M’s measure, whereas EDI was only 0.10 and Polity was 0.15. We might expect differences between the L&M and other indices: L&M note that their index is not intended to be a comprehensive democracy measure. However, the very high scores for China in their index reflects the seriousness of low thresholds for democracy and systematic missingness in their indicators: L&M include only four indicators in their analyses of China, all of which have low thresholds for perfect scores.
The trends for Turkey on the L&M index show much more fluctuation around an average of 0.76. Oddly, Turkey’s highest score (i.e., 0.95) is in 1980, the year that the armed forces staged a military coup and established a junta that ruled by decree under martial law for the next three years. Although it declined to 0.80 in 1981, this score still appears much higher than expected for a military dictatorship, and it is higher than Turkey’s scores from 1987 to 1990, from 1999 to 2001, and since 2007. Hence, the last military junta in Turkey is more democratic than several years typically considered the height of Turkish democracy. Furthermore, there is no easily recognizable pattern to the fluctuation in the post-1980 scores, despite a slight downward trend under Erdoğan. These patterns reflect that L&M’s indicators, at best, constitute very noisy proxies of democracy. (Online appendix D presents analyses of other countries that suggest the same.) By contrast, Polity shows a substantial improvement after the military junta ended in 1983, with subsequent improvements coinciding with reforms until a rapid decline under Erdoğan. EDI is less optimistic about the 1982 constitution and shows a more gradual upward trend throughout the 1980s, 1990s, and 2000s—in line with the piecemeal reform process during this period. Following the Turkish politics literature—and thus providing further validation for the measure—EDI shows a gradual deterioration of democracy under Erdoğan.
CONCLUSION
This article engages with the question of how to best measure recent trends in global democracy. Most scholars employ democracy concepts that are not adequately captured by a few indicators. For instance, contested multiparty elections require not only the presence of elections but also that the elections are free and fair, several political rights are guaranteed, and opposition parties are allowed to form. We therefore need a broad set of measures to adequately assess the state of democracy. Some of these measures must be evaluative in nature; there is no other way to measure all relevant aspects of the democracy concept.
We propose that V-Dem’s indices are suited for this task by describing the V-Dem measurement process and presenting several empirical tests of the time-varying bias proposed by L&M. We do not find any evidence suggesting that bad-vibes biases among V-Dem’s country experts drive the recent global democratic decline. Although conceptual and measurement choices affect the observed extent of backsliding, the balance of evidence clearly indicates that there is recent global democratic backsliding.
We do not find any evidence suggesting that bad-vibes biases among V-Dem’s country experts drive the recent global democratic decline. Although conceptual and measurement choices affect the observed extent of backsliding, the balance of evidence clearly indicates that there is recent global democratic backsliding.
We also emphasize that there is no truly objective (i.e., free of human judgment) measure of democracy. Absent this, we discuss how seemingly objective indicators can display different types of biases and be even more problematic than their subjective counterparts. More specifically, this article discusses and analyzes L&M’s (Reference Little and Meng2023) proposed objective democracy measures. Different issues with these measures make them difficult to use as a valid benchmark for describing global democracy trends or as yardsticks for evaluating very different measures of democracy, including those constructed by V-Dem.
ACKNOWLEDGMENTS
Knutsen’s work on this project received funding from the European Research Council under the European Union’s Horizon 2020 Research and Innovation Program (Grant No. 863486). Lindberg acknowledges financial support from Vetenskapsrådet (Grant No. 2018-016114); the Knut and Alice Wallenberg Foundation (Grant No. 2018.0144); and internal grants from the Vice-Chancellor’s office, the Dean of the College of Social Sciences, and the Department of Political Science at the University of Gothenburg.
DATA AVAILABILITY STATEMENT
Research documentation and data that support the findings of this study are openly available at the PS: Political Science & Politics Harvard Dataverse at DOI:10.7910/DVN/OHXMKG.
Supplementary Material
To view supplementary material for this article, please visit http://doi.org/10.1017/S104909652300077X.
CONFLICTS OF INTEREST
The authors declare that there are no ethical issues or conflicts of interest in this research.


 Open access