Obesity is a major public health issue. Approximately one-quarter of Australian children are overweight or obese and 7 % are obese( Reference Ng, Fleming and Robinson 1 ). A major driver of childhood obesity is when dietary energy intake exceeds energy expenditure. A major contributor to this excessive energy intake among children and adolescents is foods that are poor in dietary quality (e.g. higher in added sugar, saturated fat and/or salt) such as cakes, biscuits and processed meat products( Reference Johnson, Bell and Zarnowiecki 2 ). However, with childhood obesity interventions being largely ineffective in the population( Reference Sim, Lebow and Wang 3 , Reference Wake 4 ), it is crucial that we better understand any bi-directionality of the relationship between children’s body composition and dietary quality.
An alternative, and not mutually exclusive, hypothesis is that obesity drives subsequent diet( Reference Jacquier, Soula and Crauste 5 ). Leptin, an adipocyte hormone, is involved in inhibiting dietary intake( Reference Jacquier, Soula and Crauste 5 , Reference Friedman 6 ). Leptin resistance often occurs as a result of obesity. This means that, compared with non-obese people, obese people cannot as easily respond to leptin signals or regulate dietary intake( Reference Jacquier, Soula and Crauste 5 ), meaning that they may consume more foods.
It is possible that pathways from diet to body composition and from body composition to diet both operate simultaneously. Measures of body composition commonly include BMI and waist:height ratio (WHtR) (waist circumference (cm) divided by height (cm)), which is a proxy for total fat( Reference Santos, Severo and Lopes 7 ). Bi-directionality between diet and body composition is important to consider for several reasons. In studies examining dietary determinants of body composition, reverse causality might occur, that is, body composition influencing diet( Reference Malik, Pan and Willett 8 , Reference Gasser, Mensah and Russell 9 ). Furthermore, it is important to determine the relative contribution of childhood diet to body composition, and how this contribution changes with child age through development, in order to inform the focus of future interventions.
Dietary patterns describe how foods group together in typical diets( Reference Michels and Schulze 10 ). Dietary scores sum the frequency of foods consumed that are considered to have health benefits or detriments( Reference Michels and Schulze 10 ). Previous longitudinal studies have mostly demonstrated null associations between dietary patterns or scores as determinants of BMI or WHtR during childhood and/or adolescence( Reference Okubo, Crozier and Harvey 11 – Reference Durão, Severo and Oliveira 14 ). However, few studies have investigated both (i) whether diet is associated with subsequent measures of body composition (e.g. BMI or WHtR) and (ii) whether measures of body composition (e.g. BMI or WHtR) are associated with subsequent diet in children or adolescents. Within a population-based birth cohort of approximately 3500 Portuguese children( Reference Durão, Severo and Oliveira 14 ), an energy-dense foods pattern at 4 years of age was associated with higher BMI and WHtR at 7 years of age in girls but not in boys. They also found no evidence of adiposity measures at 4 years of age that were predictive of dietary patterns at 7 years of age( Reference Durão, Severo and Oliveira 14 ). In young children, the consumption of energy-dense foods at 2 years of age did not predict BMI z-score at 4 years of age, nor did BMI z-score at 2 years predict energy-dense food consumption at 4 years of age( Reference Durão, Severo and Oliveira 15 ).
Thus, there are significant gaps in what is known about bi-directional relationships between dietary quality and body composition across the full span of childhood. If strong relationships were found using low-burden, short self-reported dietary measures that are feasible for everyday use, then these could perhaps inform clinical or population guidance. This study aimed to investigate (i) how dietary patterns and scores are associated with subsequent BMI and WHtR, and (ii) how BMI and WHtR are associated with subsequent dietary patterns and scores, from ages 2–3 to 10–11 and 4–5 to 14–15 years, in the two population-representative cohorts of the Longitudinal Study of Australian Children (LSAC). Dietary scores were based on the 2013 Australian Dietary Guidelines recommendations for children, which encourage high numbers of daily servings of fruit, vegetables and milk products or alternatives; plenty of water; and a limited intake of fatty foods, sugary foods and sweetened drinks( 16 ). We hypothesised that (i) healthier dietary scores, higher adherence to a healthier diet (including frequent consumption of vegetables and fruit) and lower adherence to an unhealthier diet (including frequent consumption of sweetened drinks and savoury snacks) would predict lower BMI and WHtR in subsequent waves, and that (ii) lower BMI and WHtR would predict healthier dietary scores, higher adherence to a healthier diet and lower adherence to an unhealthier diet in subsequent waves.
Methods
Recruitment and sampling
This paper involved secondary analyses of observational data from LSAC. LSAC commenced in 2004; since then, it has collected data every 2 years from the B cohort (aged 0–1 years at wave 1) and the K cohort (aged 4–5 years at wave 1)( Reference Norton and Monahan 17 , 18 ). This study used data from waves 1–6 of the B and K cohorts of LSAC, collected between 2004 and 2014( Reference Norton and Monahan 17 ).
LSAC consisted of a general population-representative sample( Reference Soloff, Lawrence and Johnstone 19 ). However, the most remote areas of Australia were excluded( Reference Soloff, Lawrence and Johnstone 19 ). LSAC’s sampling frame was the Medicare enrollment database( Reference Soloff, Lawrence and Johnstone 19 ). Medicare is Australia’s universal government-funded healthcare programme into which 98 % of Australian children are enrolled by 12 months( Reference Soloff, Lawrence and Johnstone 19 ). The sample of children included in LSAC was designed to represent Australia’s states/territories and consisted of an urban/rural mix( Reference Soloff, Lawrence and Johnstone 19 ). LSAC used a two-stage clustered sampling design( Reference Soloff, Lawrence and Johnstone 19 ). Briefly, this design involved the random selection of 311/3325 (9·4 %) of Australian postcodes, after stratification by state/territory, capital city v. rest of state and large v. small population size( Reference Soloff, Lawrence and Johnstone 19 ), followed by the random selection of an average of twenty children from each of these postcodes in the smaller states and territories (forty children in the larger states)( Reference Soloff, Lawrence and Johnstone 19 ).
A total of 5107 and 4983 children were recruited into the B and K cohorts, respectively( Reference Soloff, Lawrence and Johnstone 19 ), representing 57·2 and 50·4 % uptake. Approximately 5000 children were recruited for each cohort so that the sample size was large enough so that even after several waves of data collection, detailed statistical analyses could be performed( Reference Soloff, Lawrence and Johnstone 19 ). Online Supplementary Fig. S1 shows the retention and numbers across each of the LSAC waves. The Australian Institute of Family Studies Ethics Committee( 20 ) approved each wave and families provided written informed consent to participate in the study.
Procedures and measures
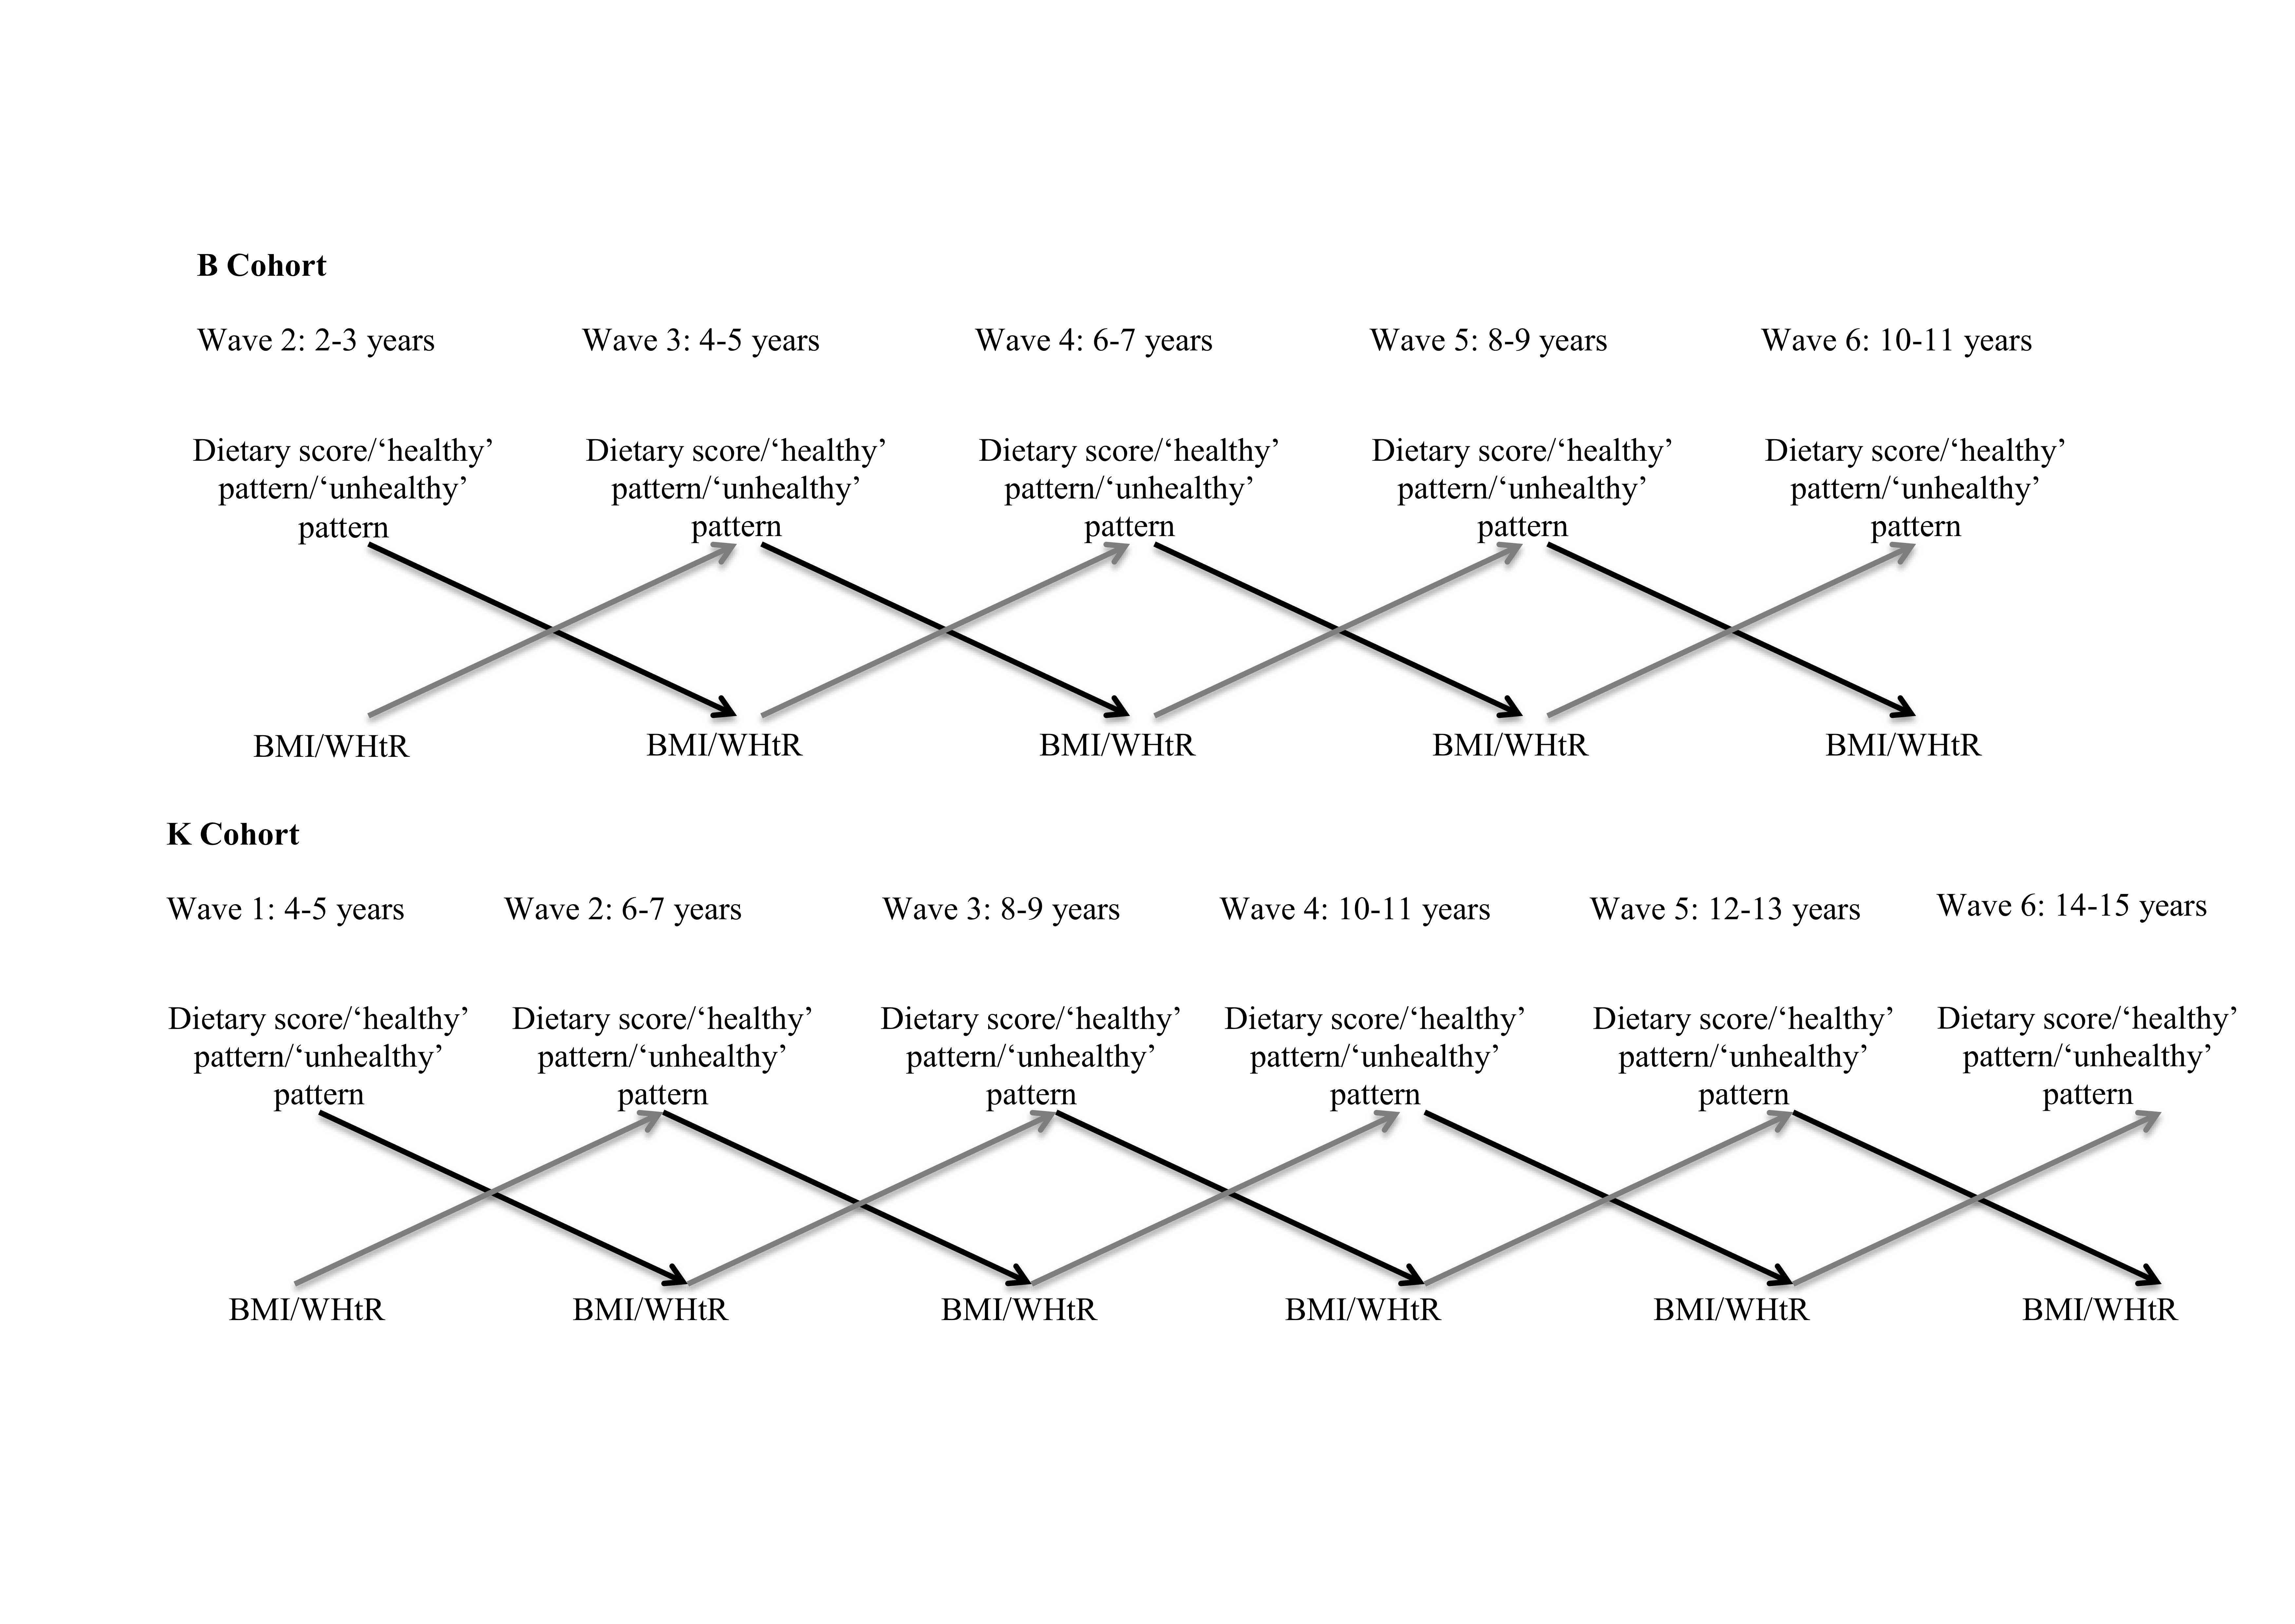
In the LSAC, a variety of instruments, including questionnaires, have been used throughout the study( 21 ). The exact number of instruments differed by wave( 21 ). Relevant to these analyses, data collection methods consisted of audio computer-assisted interviews (for child ages 10 years or older); parent self-complete or leave behind questionnaires for both parents; face-to-face interviews, usually with ‘Parent 1’; and physical measurements of the study child( 21 ). Parent 1 is the parent who knows the study child best, usually the biological mother( 22 ). These analyses used dietary and body composition data collected for children for waves 1–6 (ages 4–5 to 14–15 years) of the K cohort and waves 2–6 (ages 2–3 to 10–11 years) of the B cohort.
Briefly, parents (for children aged 2–9 years) or children (aged 10 years or older) reported the number of times the study child consumed 12–16 individual or grouped food or drink items within the previous 24 h or yesterday (listed in online Supplementary Table S1)( Reference Gasser, Kerr and Mensah 23 ). Our dietary tool was not previously validated.
Dietary scores
We derived a dietary score for each child, at each wave, based mainly on recommended serves for a number of food groups, outlined in the 2013 Australian Dietary Guidelines( 16 ). First, frequency of consumption in the last 24 h was scored as 0, 1 or 2 for each of seven food or drink categories: milk products or alternatives, vegetables, fruits and water (all positively coded), and fatty foods, sweetened drinks and sugary foods (all negatively coded). We summed the scores from each individual category to give an overall score, ranging from 0 to 14, for each child at each wave, with higher scores reflecting a healthier diet. Readers are referred to our previous publication( Reference Gasser, Kerr and Mensah 23 ) for further details on the derivation of the dietary scores.
Dietary patterns
We statistically derived dietary patterns for each wave using exploratory factor analyses( 24 ), using all 12–16 food or drink items (shown in online Supplementary Table S1) to derive the factors or patterns. Readers are referred to our previous publication( Reference Gasser, Kerr and Mensah 23 ) for further details on the derivation of dietary patterns. We obtained ‘healthy’ and ‘unhealthy’ patterns or factors at each wave. The ‘healthy’ pattern was characterised by frequent consumption of vegetables and fruit in all waves, and water in most waves, each with high factor loadings of 0·3 or higher, reflecting these as foods or drinks that are most prominent in the ‘healthy’ factor( Reference Costello and Osborne 25 ). The ‘unhealthy’ pattern was characterised by frequent consumption of sweetened drinks and savoury snacks in all waves, sausages or sausage rolls, hamburgers, hot dogs, meat pies, fruit juice and hot chips in most waves (each with high factor loadings of 0·3 or higher); and a high negative factor loading (below –0·3) for water consumption in six out of eleven waves. Finally, we used the means and standard deviations of each dietary variable to calculate continuous healthy and unhealthy dietary pattern scores for the healthy and unhealthy factors, respectively, for each child, with an approach known as regression scoring. Healthy dietary pattern scores ranged from –3·22 to 2·01 and unhealthy dietary pattern scores ranged from –0·96 to 5·27.
Child BMI z-score
The child’s weight was measured once using Salter Australia glass bathroom scales for wave 1, Salter Australia glass bathroom scales and HoMedics digital BMI bathroom scales for waves 2 and 3, and Tanita body fat scales for waves 4–6( 22 ). Children were measured without shoes in light clothing. The child’s height was measured using an Invicta stadiometer, from Modern Teaching Aids, for waves 1–3, and a laser stadiometer for waves 4–6( 22 ). Study researchers took two height measurements, and if the two measurements differed by at least 0·5 cm, a third measurement( 22 ). The data file included the average of the two closest height measures( 22 ). For waves 2–6 of the B cohort and 1–6 of the K cohort, child BMI was calculated as weight (kg) divided by squared height (m2). BMI was converted into BMI for age z-score (BMI z-score), based on Centers for Disease Control and Prevention growth charts( Reference Kuczmarski, Ogden and Guo 26 ).
Child waist:height ratio
Waist circumference or girth was measured on the skin at the level of the child’s navel, using a non-stretch dressmaker’s tape( 22 ). Waist circumference was measured twice, or three times if the first two measurements differed by at least 0·5 cm( 22 ). The data file included the average of the two closest waist circumference measures( 22 ). For waves 2–6 of the B cohort and 1–6 of the K cohort, child WHtR was calculated as waist circumference (cm) divided by height (cm).
Covariates
Table 1 describes how covariates were measured in this study. Child covariates included indigenous background, language other than English spoken at home, television viewing, pubertal status, physical activity, age and sex, and whether the study child was a singleton or from a multiple birth. Parent covariates included parent 1 BMI, parent 1 age and parent 2 age. Other covariates were birth weight z-score (corrected for gestational age at birth), family/household socio-economic position and neighbourhood disadvantage.
Longitudinal Study of Australian Children (LSAC) covariates and their handling for this study
TV, television; DVD, digital video disc.
Statistical analysis
We performed all statistical analyses using Stata/IC 14.2 (StataCorp LLC) and implementing survey methods, with the cross-sectional sampling weights from wave 1 of the B and K cohorts. In order to allow variables to be easily compared, we standardised dietary scores, ‘healthy’ patterns, ‘unhealthy’ patterns and WHtR to each have a mean of 0 and standard deviation of 1. We investigated associations between each variable (all dietary measures, BMI z-score and WHtR) and the same variable in the subsequent wave, using linear regression analyses.
We performed cross-lagged analyses using the ‘sem’ command in Stata/IC 14.2. For these analyses, we included dietary scores, ‘healthy’ patterns or ‘unhealthy’ patterns as the exposure variable and BMI z-score or WHtR at the subsequent wave as the outcome variable, followed by BMI z-score or WHtR as the exposure variable and dietary scores/patterns at the subsequent wave as the outcome variable (a conceptual diagram of our analyses is provided as online Supplementary Fig. S2). We identified covariates from directed acyclic graphs and previous studies( Reference Okubo, Crozier and Harvey 11 – Reference Appannah, Pot and Huang 13 , Reference Durão, Severo and Oliveira 15 , Reference Gasser, Mensah and Kerr 32 – Reference Golley, Smithers and Mittinty 39 ). The covariates included in cross-lagged analyses were child indigenous status, language other than English spoken at home, television viewing, pubertal status, physical activity, age and sex; birth weight z-score (corrected for gestational age at birth); and family/household socioeconomic position. We accounted for correlations between dietary and body composition variables from subsequent waves, using the ‘cov’ option. In order to ensure that cross-lagged analyses that required a reduced sample (i.e. data from waves 2–6 of the B cohort or waves 1–6 of the K cohort) were consistent with wave-on-wave findings with more complete samples, we additionally conducted wave-on-wave multivariable linear and Tobit regression analyses between dietary and body composition measures. Drawing on prior literature( Reference Meyerkort, Oddy and O’Sullivan 12 , Reference Durão, Severo and Oliveira 15 , Reference Johnson, Mander and Jones 33 , Reference Golley, Smithers and Mittinty 39 ), we also conducted sensitivity analyses, which additionally included parent 1 BMI as a covariate, and further sensitivity analyses, which additionally included parent 1 BMI, parent 1 age, parent 2 age, neighbourhood disadvantage and whether the study child was a singleton or from a multiple birth as covariates. The LSAC dataset is available to researchers (see www.growingupinaustralia.gov.au).
Results
Descriptive characteristics
Table 2 shows the baseline characteristics of the study sample, by cohort. There were approximately equal numbers of girls and boys, and children in both cohorts had mean BMI z-scores and WHtR of 0·5. The mean overall dietary scores were 10·3 and 9·7 out of a possible 14 points for children in the B and K cohorts, respectively, indicating that children in both cohorts generally had reasonably healthy diets at baseline. At age 8–9 years, 86·3 % of the B cohort and 88·9 % of the K cohort children had not yet commenced puberty. In both cohorts, mean BMI z-scores and WHtR did not change much across all of childhood and early adolescence (online Supplementary Table S2). The distribution of dietary variables was also similar at each wave of both cohorts (online Supplementary Table S2). A total of 1972–2882 children had complete data from waves 2–6 of the B cohort or all waves of the K cohort, so were included in cross-lagged analyses. Wave-on-wave multivariable regression analyses included 2642–4100 children.
Baseline characteristicsFootnote * of the sample, by cohort (Mean values and standard deviations; percentages)
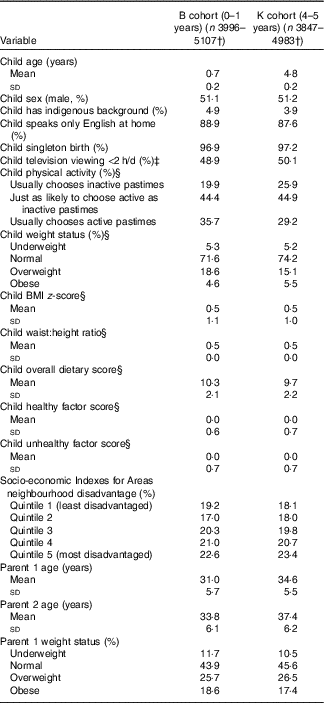
* All estimates are weighted.
† Sample sizes differed for each variable.
‡ Measured at wave 2 (data not collected at wave 1).
§ Measured at wave 2 of the B cohort and wave 1 of the K cohort.
Associations between dietary and body composition measures
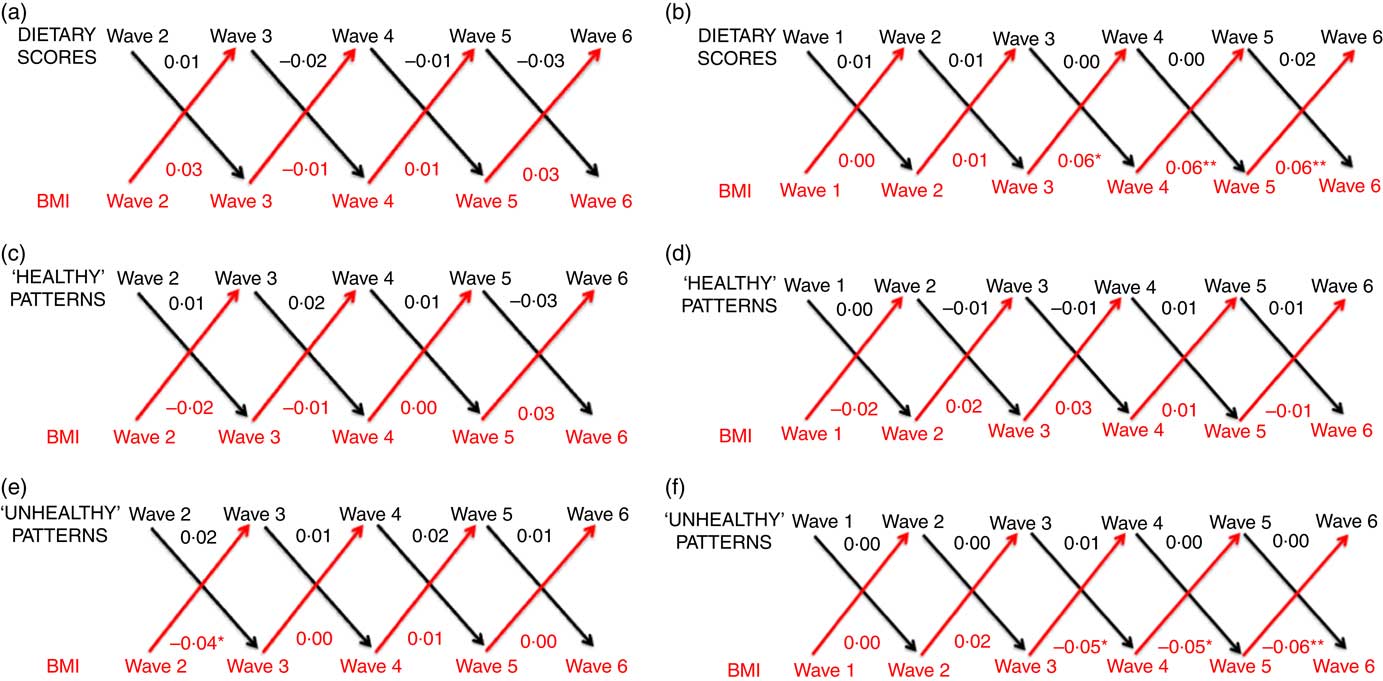
In linear regression analyses, for both cohorts we observed strong associations for each variable (all dietary measures, BMI z-score and WHtR) with the same variable in the subsequent wave (all P<0·001; results not shown). Figs. 1 and 2 show the cross-lagged associations between dietary and body composition measures from multivariable analyses, accounting for correlations between dietary and body composition variables from subsequent waves. Numbers at the top of each panel are coefficients representing the estimated mean increase or decrease in BMI z-score (Fig. 1) or standardised WHtR (Fig. 2) associated with a 1sd increase in each dietary measure. Numbers at the bottom of each panel are coefficients representing the estimated mean increase or decrease in each standardised dietary measure associated with a 1sd increase in BMI (Fig. 1) or WHtR (Fig. 2). Online Supplementary Tables S3–S6 additionally provide 95 % CI and P-values for coefficients.
Cross-lagged associations, derived from structural-equation modelling, between dietary scores and BMI for the B cohort (a), dietary scores and BMI for the K cohort (b), ‘healthy’ patterns and BMI for the B cohort (c), ‘healthy’ patterns and BMI for the K cohort (d), ‘unhealthy’ patterns and BMI for the B cohort (e), and ‘unhealthy’ patterns and BMI for the K cohort (f). Numbers denote coefficients, derived from structural-equation modelling. Dietary scores, ‘healthy’ patterns, ‘unhealthy’ patterns and BMI were each standardised to have a mean of 0 and standard deviation of 1. * P<0·05, ** P<0·01. Analyses adjusted for child indigenous status, language other than English spoken at home, television viewing, pubertal status, physical activity, age and sex; birth weight z-score and socio-economic position. We included covariates that remained relatively stable throughout the duration of the Longitudinal Study of Australian Children (child indigenous status, language other than English spoken at home and sex) from wave 1 of each cohort. For the remaining covariates which each had the potential to change over time, we included the measure from the same time point as the relevant exposure variable. If covariates were unavailable at a particular wave, we took them from the previous wave.
Cross-lagged associations, derived from structural-equation modelling, between dietary scores and waist:height ratio (WHtR) for the B cohort (a), dietary scores and WHtR for the K cohort (b), ‘healthy’ patterns and WHtR for the B cohort (c), ‘healthy’ patterns and WHtR for the K cohort (d), ‘unhealthy’ patterns and WHtR for the B cohort (e), and ‘unhealthy’ patterns and WHtR for the K cohort (f). Numbers denote coefficients, derived from structural-equation modelling. Dietary scores, ‘healthy’ patterns, ‘unhealthy’ patterns and WHtR were each standardised to have a mean of 0 and standard deviation of 1. * P<0·05, ** P<0·01. Analyses adjusted for child indigenous status, language other than English spoken at home, television viewing, pubertal status, physical activity, age and sex; birth weight z-score and socio-economic position. We included covariates that remained relatively stable throughout the duration of the Longitudinal Study of Australian Children (child indigenous status, language other than English spoken at home and sex) from wave 1 of each cohort. For the remaining covariates which each had the potential to change over time, we included the measure from the same time point as the relevant exposure variable. If covariates were unavailable at a particular wave, we took them from the previous wave.
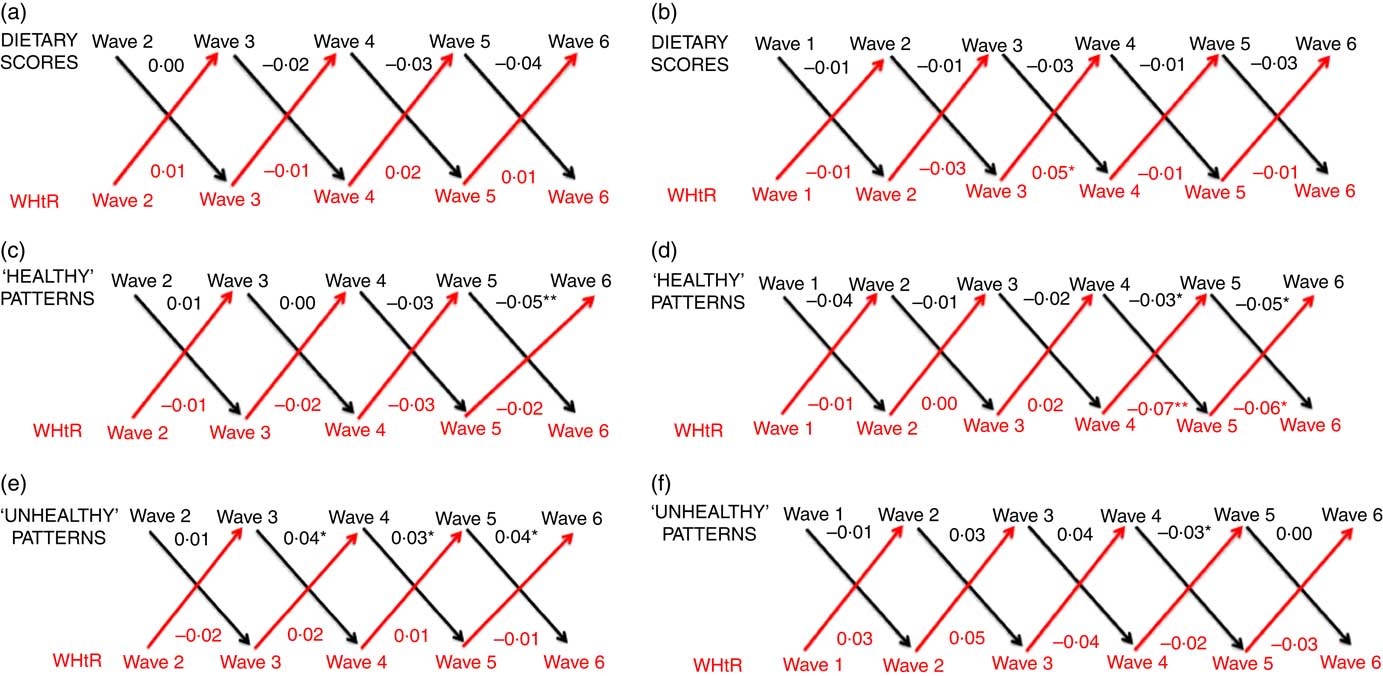
Generally, we observed no evident associations between dietary measures and BMI z-score or WHtR in univariable and multivariable cross-lagged analyses (Figs. 1 and 2; online Supplementary Tables S3–S6; univariable results available upon request). Findings were highly replicable in both cohorts. Dietary scores, continuous ‘healthy’ pattern scores and continuous ‘unhealthy’ pattern scores generally did not predict BMI z-score in the subsequent wave; likewise BMI z-score did not predict any measures of diet in the subsequent wave (Fig. 1; online Supplementary Tables S3 and S4). In multivariable analyses, adjusting for covariates, the few associations we observed were small and tended to be in the reverse direction to those hypothesised, that is, higher BMI z-score was associated with very slightly higher dietary scores (i.e. better adherence to the Australian Dietary Guidelines( 16 )) and lower adherence to an unhealthy diet. For example, a 1sd increase in BMI in wave 5 of the K cohort was associated with an estimated mean improvement in the standardised dietary score measure of 0·06 units (95 % CI 0·02, 0·11, P=0·003) in the subsequent wave (Fig. 1; online Supplementary Table S4). Similarly, a 1sd increase in BMI in wave 5 of the K cohort was associated with an estimated mean decrease (improvement) in the standardised ‘unhealthy’ pattern score of 0·06 units (95 % CI –0·09, –0·02, P=0·002) in the subsequent wave (Fig. 1; online Supplementary Table S4). Associations between dietary measures and BMI z-score remained similar in sensitivity analyses (results not shown). These analyses additionally included parent 1 BMI as a covariate, and then (in further sensitivity analyses) additionally included parent 1 BMI, parent 1 age, parent 2 age, neighbourhood disadvantage and whether the study child was a singleton or from a multiple birth as covariates.
In multivariable cross-lagged analyses, the few associations we observed between diet and WHtR were again small and inconsistent, but this time tended to be in the same direction to those hypothesised, that is, higher WHtR was associated with lower adherence to a healthy diet and generally associated with higher adherence to an unhealthy diet (Fig. 2; online Supplementary Tables S5 and S6). For example, a 1sd increase in WHtR in wave 4 of the K cohort was associated with an estimated mean decrease (worsening) in the standardised ‘healthy’ factor score of 0·07 units (95 % CI –0·12, –0·02; P=0·007) in the subsequent wave. In both sets of sensitivity analyses, associations between dietary measures and WHtR generally remained similar (results not shown). Results for BMI z-score and WHtR remained similar in wave-on-wave multivariable linear and Tobit regression analyses (results not shown).
Discussion
Statement of principal findings
In a unique longitudinal and cross-sequential design, this study investigated the bi-directionality between diet and body composition measures using short dietary tools suitable for population use, in two cohorts and at several waves. We generally found that associations were not evident either between ‘healthy’ patterns, ‘unhealthy’ patterns or dietary scores and BMI z-score or WHtR in cross-lagged analyses. The lack of association was consistent across both cohorts of children and between every set of biennial waves, and was robust to sensitivity analyses.
Strengths and limitations
A strength of this study is that it included consistent measures that were repeatedly collected over multiple waves spanning 10 years, allowing us to observe whether associations change with child age. Child height, weight and waist circumference in children were measured, rather than self-reported. In addition to the commonly-used BMI, the use of WHtR allowed us to determine whether our study findings were similar when considering an alternative measure of body composition. Replication of our findings across two cohorts of children increases confidence and reliability in the results( Reference Sanson, Nicholson and Ungerer 40 ), and allows generalisation across a wider span of childhood than would otherwise have been possible. We use data from LSAC’s national population-representative sample( Reference Soloff, Lawrence and Johnstone 19 ), and employed survey methodology in our analyses to account for the multistage and clustered sampling design, and non-response( 22 ). Finally, rather than an alternative approach of studying individual foods or drinks, we considered two short, low-burden and holistic measures of diet that are well suited to population use and guidelines, specifically dietary scores and patterns. Studying dietary patterns allows us to determine which foods or drinks are eaten together in the diet and is not dependent upon the disease or restricted to recommendations given in dietary guidelines( Reference Michels and Schulze 10 ). Dietary scores are developed based on previous research and may be easier for the public to understand( Reference Michels and Schulze 10 ).
Despite the advantages of this short dietary measure, it also has limitations. Its brevity precludes capture of all dietary elements or all items included in the Australian Dietary Guidelines( 16 ). In assessing frequency of dietary intake and patterns in the previous 24 h, it may not represent a child’s habitual diet and does not capture energetic intake. Moreover, while children’s diets may differ on a daily basis, the LSAC dataset does not indicate whether the previous 24 h recalled was a weekday or a weekend day. In addition, self- or parent-reported dietary intake can be limited by misremembering( Reference Dwyer and Coleman 41 ) and under-reporting( Reference Garaulet, Martínez and Victoria 42 ), with social desirability bias potentially masking true associations between unhealthy diets and body composition measures. Against this, our trajectories of these same dietary scores and patterns have previously demonstrated extremely large associations with both socieoconomic status( Reference Gasser, Mensah and Kerr 32 ) and parental fruit and vegetable consumption( Reference Gasser, Mensah and Clifford 43 ) in these same cohorts. While some participants were missing, results were very similar when we applied survey weights and conducted wave-on-wave regression analyses between dietary and body composition measures. A further limitation is that, although we also considered bi-directional associations between diet and WHtR, we acknowledge that WHtR may be a poorer indicator of central fat( Reference Santos, Severo and Lopes 7 ) than previously thought( Reference Yoo 44 ). Future studies should consider measures more specific to visceral adiposity.
Comparison with prior literature
Our main finding of null associations between dietary scores/patterns and measures of body composition aligns with the previous English and Australian studies in which dietary patterns or quality in early childhood or adolescence were not associated with BMI( Reference Okubo, Crozier and Harvey 11 – Reference Appannah, Pot and Huang 13 ). However, our study goes further in replicating across cohorts, spanning multiple ages and considering the bi-directionality of associations between diet and body composition. Previous studies that have considered the bi-directionality of associations between diet and body composition across shorter periods than our study have likewise predominantly observed null associations( Reference Durão, Severo and Oliveira 14 , Reference Durão, Severo and Oliveira 15 ). In contrast, in a Portuguese study, Durão et al. ( Reference Durão, Severo and Oliveira 14 ) found that an energy-dense foods dietary pattern was associated with higher BMI and higher WHtR in girls but not boys. It is difficult to know whether this differing finding represents the truth (in that their thirty-five-item FFQ was more detailed than ours) or a chance association (as it is unclear why girls but not boys would experience the effects of poor diet).
Meaning of the study for clinicians and policymakers
Our results indicate that dietary scores and patterns derived from brief measures do not substantially drive body composition. This implies that short dietary measures tapping into quality rather than quantity may not help to manage or understand the childhood obesity epidemic. However, they could have other immediate or longer-term benefits for health. The dilemma is that such measures may be close to the limit of what can feasibly be asked clinically and in multifocused population studies that also need precise measurement of a wide range of other exposures and outcomes. Specifically, it is likely that the quantities, rather than frequencies, of consuming different types of food are important for predicting body composition. Similarly, BMI z-score and WHtR might be more predictive of quantity, rather than frequency, of dietary intake.
Unanswered questions and future research
Despite the strengths of our short dietary measure, our study would need to be replicated with more comprehensive and accurate measures before forming recommendations. While these might include existing computerised 24 h dietary recalls or mobile phone apps( Reference Foster, Hawkins and Delve 45 , Reference Bejar, Sharp and García-Perea 46 ), it remains the case that clinical and public health tools are woefully inadequate to capture energy intake accurately. Developing accurate dietary tools that are feasible for clinical and population use must be amongst the highest priority for obesity research. There is a critical need for research and development if we are to make progress in this area. Considerations include the need to capture habitual, rather than 24 h, diet, and to comprehensively measure food quantity, portion size and absolute energetic intake; all of these are currently out of reach for large studies. Moreover, it would also be valuable to assess associations of dietary trajectories with other health outcomes, including metabolic and inflammatory profiles, and whether these associations differ according to weight status (e.g. obese v. overweight v. underweight).
Conclusion
In conclusion, dietary scores and patterns derived from brief measures do not appear to substantially drive body composition; nor does BMI z-score or WHtR appear to influence dietary quality in subsequent waves at any age. This implies that short dietary measures tapping into quality rather than quantity may not help to manage or understand the childhood obesity epidemic. We believe that developing much more accurate dietary tools for children must be an absolute priority to advance research and practice in childhood obesity.
Acknowledgements
This paper uses unit record data from Growing Up in Australia, the LSAC. The study is conducted in partnership between the Department of Social Services (DSS), the Australian Institute of Family Studies (AIFS) and the Australian Bureau of Statistics (ABS). The findings and views reported in this paper are those of the authors and should not be attributed to DSS, AIFS or the ABS. The authors thank all the parents and children who took part in the LSAC. The authors would also like to thank Dr Elasma Milanzi (University of Melbourne) for her advice on structural-equation modelling used in this paper.
The authors of this work were supported by the Australian National Health and Medical Research Council (F. K. M., Career Development Fellowship 1111160), (R. C., Postgraduate Scholarship 1133054), (M. W., Senior Research Fellowship 1046518); an Australian Government Research Training Program Scholarship (C. E. G.); and a Murdoch Children’s Research Institute PhD Top Up Scholarship (C. E. G.). Research at the Murdoch Children’s Research Institute is supported by the Victorian Government’s Operational Infrastructure Support Program. The Australian National Health and Medical Research Council, Australian Government, Murdoch Children’s Research Institute and the Victorian Government had no role in the design, analysis or writing of this article. The LSAC is funded by the Commonwealth Government of Australia.
The author’s contributions are as follows: C. E. G., F. K. M., S. A. C. and M. W. formulated the research questions; C. E. G. designed the research, with input from F. K. M., S. A. C., J. A. K., R. C. and M. W.; C. E. G. conducted the research; C. E. G. analysed the data, with advice and supervision from F. K. M., S. A. C., J. A. K., R. C. and M. W.; and C. E. G. wrote the article, with input from F. K. M., S. A. C., J. A. K., R. C. and M. W. All authors read and approved the final version of the manuscript.
M. W. receives hourly financial reimbursement from the Australian Government for her advisory role on the LSAC. C. E. G., F. K. M., S. A. C., J. A. K. and R. C. declare no potential conflicts of interest.
Supplementary material
For supplementary material/s referred to in this article, please visit https://doi.org/10.1017/S0007114518003173