

Many children and young adolescents in Belgium do not meet the dietary guidelines, so effective interventions to improve their food habits are needed(Reference Huybrechts, Matthys and Vereecken1–Reference Vereecken, De Henauw and Maes4). Parents are the most important factor influencing children's food habits through the foods they make available and accessible, their own dietary behaviour and the interactions that take place during meals(Reference Pearson, Biddle and Gorely5). However, in order for parents to try to change their children's eating patterns, they need to perceive the need to do so. If parents do not recognize that their children have a poor diet, they will not make any efforts to help their children adopt a healthier diet(Reference Kourlaba, Kondaki and Grammatikaki6). A cost-effective way to increase awareness and motivate a large number of people to make healthy dietary changes is computer tailoring. Computer tailoring provides respondents with individualized feedback based on their characteristics (e.g. their behaviour).
Recent reviews(Reference Kroeze, Werkman and Brug7–Reference Enwald and Huotari10) demonstrate that computer tailoring has the potential to impact dietary behaviours to a meaningful extent. In the meta-analysis of Krebs et al.(Reference Krebs, Prochaska and Rossi9), a mean effect size (Hedge's g) of 0·22 (P < 0·001) was found for dietary fat reduction and of 0·16 (P < 0·001) for increasing fruit and vegetable consumption. Tailored instruments have been developed to improve children's(Reference Mangunkusumo, Brug and de Koning11–Reference French, Howell and Haven13), adolescents’(Reference Maes, Cook and Ottovaere14, Reference Haerens, Deforche and Maes15) and adults’ dietary habits(Reference Oenema, Brug and Lechner16, Reference Juan, Gerrior and Hiza17). To our knowledge, no tailored instruments have been developed to improve children's dietary habits by targeting their parents. However, findings in the field of paediatric injury prevention support the efficacy of computer-tailored injury prevention guidance in parents of young children(Reference Nansel, Weaver and Jacobsen18).
The Children's and Adolescents’ Nutrition Assessment and Advice on the Web (CANAA-W) is the first tailored instrument to improve children's and adolescents’ dietary habits, by targeting parents of children, on the one hand, and young adolescents, on the other. The purpose of the current paper is to describe the results of a formative evaluation of the tailored advice among parents of schoolchildren. The formative evaluation in young adolescents will be described elsewhere.
Methods
Study design
Several methods were used to evaluate the tailored feedback, including tool piloting, a feasibility questionnaire and focus groups.
The pilot test
The tool was pilot tested in an iterative dynamic process of continuous feedback and adaptation. Four dietitians, four student dietitians in their final year, four colleagues working in the field of health promotion and fourteen parents (two with secondary education; five with a bachelor's and seven with a master's degree) were asked to complete CANAA-W for 3 d, to read the advice and to give comments. Two parents were observed while reading the advice. Usability tests rely on small samples; usually a small number is sufficient for determining the major usability issues and soliciting the full range of feedback(Reference Dumas and Redish19, Reference Virzi20).
Major changes were: (i) reorganization of the feedback into a summary sheet containing the key messages linked to additional sheets with more detailed feedback and (ii) improvement of the visualization of the links. As no new information was obtained from the last six respondents, we considered the tool ready for a more formal evaluation by a feasibility questionnaire.
The feasibility questionnaire
Parents at one pre-primary school and one primary school (with two campuses) were invited to participate in the study. They were asked to fill in what their child consumed for 3 d. To make it as convenient as possible for them, we did not predefine the days. Parents who did not complete 3 d were sent weekly reminders. After completing the 3 d, the feedback engine was activated and simultaneously parents were sent a link to the evaluation questionnaire. The feasibility questionnaire was based on previous studies(Reference Maes, Cook and Ottovaere14, Reference Vandelanotte and De Bourdeaudhuij21, Reference Haerens, Deforche and Vandelanotte22) and evaluated the attractiveness, clarity (fifteen items) and usefulness (ten items) of the feedback on a 4-point scale. In addition, respondents were provided with space for free comments. Parents who initially agreed to participate but dropped out were asked about their reasons for dropping out.
The feasibility questionnaire was developed in Limesurvey 1·85 (open source software). Percentages are presented for the closed questions of the feasibility questionnaire. The free answers are included in the focus group results. Non-parametric tests were used to compare the appreciation of the different components of the feedback (Friedman tests for comparing three components and Wilcoxon signed ranks tests for comparing two components).
The focus groups
The focus group method(Reference Barbour23) was introduced to collect more in-depth qualitative information on the feasibility and appreciation. All participating parents, including those who dropped out during the study, were invited to participate in the focus group discussions. Two members of the research team facilitated three focus group discussions, following a predefined questioning route, including the following themes: general interest in healthy dietary behaviours, general impression of the website and appreciation of the different components of the feedback (e.g. the food triangle, the nutrient table). The focus group discussions were videotaped and transcribed verbatim. In accordance with the principles of thematic analysis, all transcripts were coded by the research team using NVIVO 9 (2007; QSR International Pty Ltd, Doncaster, Victoria, Australia), a computer-based data management program. The different codes were sorted into potential themes and all the coded data extracts were collated within these themes. The research team discussed their agreements and disagreements to achieve consensus on the selected nodes. Typical quotes were selected to represent the different topics and the different views of the respondents.
Data collection took place in March–April 2011. The study was approved by the Ethical Board of Ghent University Hospital. Written informed consent was obtained from the participating parents.
The instrument
The dietary assessment component
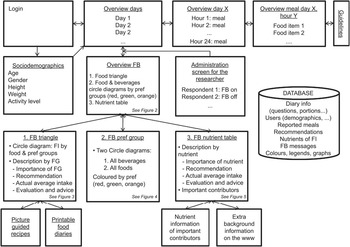
An overview of the structure of CANAA-W is presented in Fig. 1. The first contact with the respondent (the parent) presents a sociodemographic screen including the child's name, gender, age, height, weight and degree of physical activity (low, moderate or heavy). These variables guide the tailored advice. Next, the software presents an overview screen on which a new entry day can be entered, or previously completed 24 h reports can be selected. For the selected day, the respondent is shown an overview of 24 h and is invited to select for each relevant hour the consumed food items from a hierarchical tree structure including twenty-five main food groups and about 800 different food items. A more detailed description of the dietary assessment component and the evaluation of this component can be found elsewhere(Reference Vereecken, Covents and Maes24, Reference Vereecken, Covents and Haynie25). Once the food is entered, the respondent can go to the tailored feedback.
Structure of the software (FB, feedback; FI, food item; pref, preferences; FG, food group)
The tailored feedback
The main goal of this component is to help parents develop more balanced dietary behaviours in their children. Performance objectives to reach this goal are that parents encourage their children to eat healthy, act as positive role models for their children and increase the availability and accessibility of nutrient-dense foods, while decreasing the availability and accessibility of energy-dense, low-nutritious foods (determinants for the children's behaviour). Determinants targeted in the intervention to reach these objectives are mainly increasing parents’ awareness, nutritional knowledge, positive attitudes and skills (determinants of the parental behaviour). The theoretical methods and practical strategies used to modify these determinants are listed in Table 1. For definitions of the methods see Bartholomew et al. (Reference Bartholomew, Parcel and Kok26).
Determinants targeted and methods and strategies used in the intervention
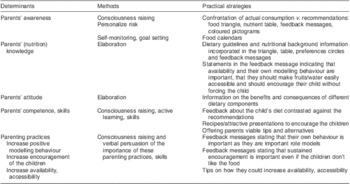
Following the self-determination theory(Reference Ryan and Deci27, Reference Soenens, Vansteenkiste and Niemiec28), people are the least motivated to comply with externally imposed rules or guidelines, but accept guidelines when they understand the reasons for these guidelines (identified regulation). Hence the messages are formulated in a non-controlling language (e.g. ‘Maybe you could try…’). According to this theory, also competence is important, which may be increased by providing parents with feedback on their child's actual consumption contrasted against the dietary guidelines. But also the inclusion of several practical tips, of which parents can choose the most convenient, may endorse self-competence and autonomy. Finally, the personalized messages(Reference Hawkins, Kreuter and Resnicow29), referring repeatedly to characteristics of the child (e.g. including the name of the child), may create feelings of relatedness which may further improve compliance.
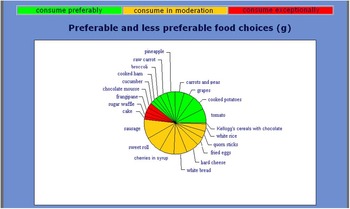
The first feedback screen (Fig. 2) provides the respondent with an overview of the key messages of the advice, visually represented in (i) a personalized food triangle, (ii) two circle diagrams and (iii) a nutrient table. Each of these three components is linked to a second sheet (for the structure see Fig. 1) for respondents who prefer more elaborate textual feedback.
Translated screenshot (the original is in Dutch) of the main feedback screen including an overview of the key messages of the advice visually represented in a personalized food triangle, two circle diagrams with the percentage of foods in the different preference groups and a nutrient table
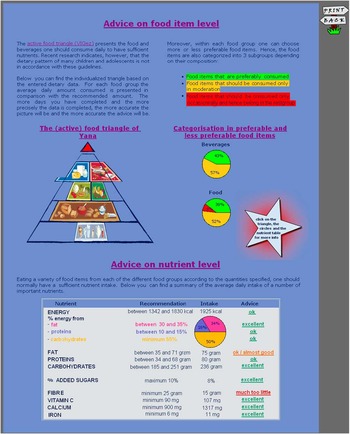
1. To educate the public about a healthy diet, food-based dietary guidelines have been globally promoted as an important part of national food and nutrition policies(Reference Keller and Lang30). In Flanders the food-based dietary guidelines have been visualized by the Active food triangle(31, 32). This model includes seven main food groups, of which two are split into subcategories, and a group called the ‘remaining group’. The main groups are: (1) water, (2a) bread and cereals, (2b) potatoes and grains, (3) fruit, (4) vegetables, (5a) milk and milk products, (5b) cheese, (6) meat, fish, eggs and meat substitutes and (7) spreadable fat and preparation fat. The ‘remaining group’ is separated from the rest of the triangle and represents non-essential food items that should be avoided (e.g. confectionery). For each of the main food groups a range of recommended daily intakes is provided. Each food group of the personalized food triangle is distorted in order to represent the respondent's percentage of over- or under-consumption of the respective food group (Fig. 2). Moving over the different segments of the model, the advised and consumed amounts of each group appear on the screen.
2. Food items within each of the main food groups differ in nutrient and energy density. Therefore, in the Flemish food-based dietary guidelines, a further distinction is made between preferred products at one end (e.g. whole-wheat bread), food items that may be consumed in moderation (e.g. white bread) in the middle and food products that should be included in the diet only exceptionally (and actually belong in the group of non-essential foods or the top of the triangle) at the other end (e.g. cake). The circle diagrams (Fig. 2) visualize the amount of food and beverages (% of g/ml) consumed from each of these categories using the traffic light colours (preferable items presented in green; moderate items in orange; exceptional items in red).
3. In the nutrient table, the recommended and consumed intakes of energy (kcal), fat (g, %), proteins (g, %), carbohydrates (g, %), added sugars (%), fibre (g), vitamin C (mg), calcium (mg) and iron (mg) are presented, as well as a short evaluation of the intake (e.g. excellent, ok, too much, much too much, etc.; Fig. 2).
By clicking on the food groups of the triangle, one goes directly to the feedback for that food group. The feedback of each food group includes a coloured pictogram, a description of the importance of the food group and personal advice, including how much should be consumed according to age-appropriate dietary guidelines(31), how much was consumed, the evaluation of the intake (e.g. this is somewhat more than is good for her, etc.), accompanied where appropriate with tips on how to improve the child's diet (Fig. 3). The text and the coloured pictograms are presented in traffic light colours: green for positive messages, in general within 10 % of the dietary guidelines; orange for warning messages, in general within 25 % of the dietary guidelines; and red for alerting messages, deviating more than 25 % from the dietary guidelines. The coloured pictograms have a thumb up, horizontal or down and a happy, neutral or unhappy face for positive, warning and alerting messages, respectively. The child's dietary pattern (% energy from fat and from added sugar) and weight status are taken into account in formulating the messages. For example, a child with a low intake of milk products, but a high percentage of energy from fat and added sugar will be advised to consume ‘more low-fat, non-sugared milk and milk products’, while a child with a low intake of milk products and a low percentage of energy from fat and added sugar and of normal weight will be advised to consume more ‘milk and milk products’ without further specification. Categorization of the child's weight is based on the self-reported data of the parents and Cole's references(Reference Cole, Bellizzi and Flegal33, Reference Cole, Flegal and Nicholls34). For beverages, additional messages are formulated when the intake of soft drinks is higher than 100 ml/d and for fruit juice when the intake is higher than 200 ml/d and the child is overweight or has an intake of added sugars exceeding 10 % of dietary intake. The cut-off is more severe for soft drinks as it is advised to consume these exceptionally, while fruit juice should be consumed in moderation.
Translated screenshot (the original is in Dutch) of an extract of the detailed feedback for the food triangle including a circle diagram with all consumed foods coloured by food group and preference group, for each food group a short description including a coloured pictogram, a description of the importance of the food group (dark blue text) and the personal advice coloured in the traffic light colours depending on the message
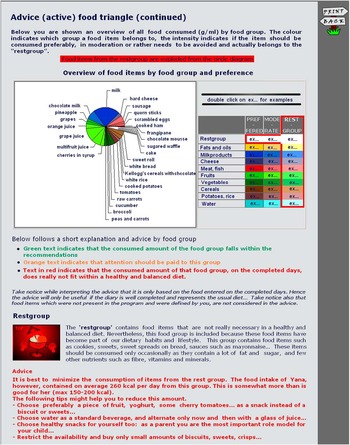
Some messages are further linked to additional sheets with food calendars (a printable form which children can colour; e.g. whenever they have a beverage, for each day of the week, up to ten glasses) and simple recipes or attractive presentations (e.g. a cucumber fish) which may help parents to motivate their children to eat healthier.
Finally, this explanation sheet contains a circle diagram of all the consumed food and beverages, coloured by food group and preference group (Fig. 3). Clicking on the legend, examples for each of the subgroups are provided.
A second additional sheet is linked to the preference groups (circle diagrams) and contains two more elaborate circle diagrams containing respectively all food and beverages coloured in the appropriate traffic light colours (Fig. 4).
Translated screenshot (the original is in Dutch) of an extract of the detailed feedback of the circle diagrams with food items coloured in green (preferred items), orange (moderate items) or red (to be avoided)
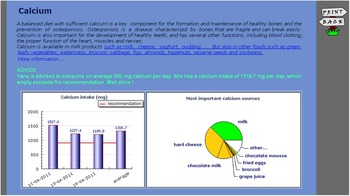
The third additional sheet presents the nutrient information in a parallel structure to the elaborated food group description (Fig. 5). Moreover, for each nutrient, a bar graph represents the child's daily and average consumption in relation to the recommended amounts, whereas a circle graph represents the child's seven most important sources of the nutrient. The dietary guidelines are based on the nutrient recommendations from the Health Council Belgium(35) and the Institute of Medicine of the National Academies(36).
Translated screenshot (the original is in Dutch) of an extract of the detailed feedback to the nutrient table: description of the feedback for calcium, including a general description of the importance of the nutrient with links to important food sources of the nutrient (text in blue), the personal advice in the traffic light colours, a graph representing the respondent's daily and average consumption in relation to the recommend amount and a circle graph representing the respondent's seven most important sources of the nutrient
The software was developed with Apache 1·3·33 (2004; Apache Software Foundation, DE, USA) web server, PHP 4·3·10-22 (open source software) and components (Flash and Macromedia) of Adobe CS5 (2010; Adobe Systems Incorporated, San Jose, CA, USA). The data are stored and linked in a MySQL 4·0·24 database (2005; Sun Microsystems Inc., Santa Clara, CA, USA) containing seven tables: (i) diary information (e.g. questions, portions), (ii) users’ information (e.g. age, gender, height, weight), (iii) reported dietary intake, (iv) age-appropriate recommendations for 2–18-year-olds, (v) nutrient table, (vi) feedback messages and (vii) the colours of the multicolour graph. Nutrient information for the tailored advice is based on the Belgian (NUBEL, 2004) and Dutch (Nevo, 2001) food composition tables. Standard recipes were used to calculate the nutrients and food items of prepared dishes. The advice can be reloaded at any time and each of the sheets can be printed. When the complete feedback is printed it covers about ten pages of which about 40 % is covered by graphs and figures.
Results
Of the 392 parents invited to participate, seventy-two (18 %) completed at least 1 d of CANAA-W of whom fifty-six (14 %) completed 3 or more d. Forty-six parents completed the feedback evaluation form. Seventy-eight per cent of those completing the evaluation form were females, 20 % males and information was lacking for one. Eighty-nine per cent of the parents had a bachelor's or master's degree, four parents had only a secondary school degree and for one parent information was lacking. The age of the children ranged between 2·3 and 12·8 years. The numbers of parents participating in the focus groups were ten (four males), four (two males) and three (only females), of whom fourteen had at least a bachelor's degree.
Of the parents who dropped out after one or two measurements, six responded with one or more reasons. Three indicated lack of time; two indicated insufficient knowledge of their child's food, one had forgotten to further complete the diary and found the application rather slow, and one found the portions not clear enough. Two also explicitly indicated that it had nothing to do with the website itself.
Most parents completing the feasibility questionnaire indicated they read all (47 %) or most (40 %) of the advice, and 13 % indicated they read only the personalized advice (the coloured text). The majority (81 % or more) found the advice comprehensible, interesting, logical, useful, believable, well formulated, correct, personal, relevant, complete, attractive, containing enough and not too much information; they intended to use it and indicated that it would be helpful to improve their child's diet (Fig. 6).
(a) Appreciation ( $$$$, agree;
  $$$$, rather agree;
  $$$$, rather disagree;
  $$$$, disagree) and (b) usefulness (
 $$$$, very useful;
  $$$$, useful;
  $$$$, not useful;
  $$$$, not useful at all) of the advice: results from the feasibility questionnaire (pref, preference group)
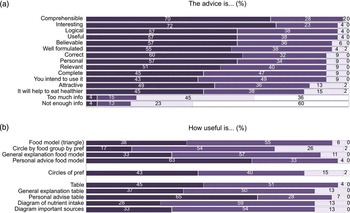
All components were considered as useful by 72 % or more of the respondents (Fig. 6). Friedman tests comparing the usability of the triangle, the preferences circles and the nutrient table indicated no significant difference between the three visual presentations. Comparison of the different aspects (visual presentation, general textual information and personal textual advice) indicated that the personal textual advice of both the triangle (v. food model: P = 0·012; v. general advice: P < 0·001) and the table (v. table: P = 0·05; v. general explanation: P = 0·004) was considered the most useful. The graphs accompanying the explanation of the nutrient table (the average nutrient intake per day v. the most important food sources of the nutrients) were considered equally useful. The circle diagram by food group and preference group was considered as the least useful of all the components. In the focus groups several parents indicated that the latter was too complex and some suggested grouping more items together.
Further analyses of the focus groups revealed three themes: ‘the appreciated confronting mirror’, ‘the useful redundancy of the given information’ and ‘the highly appreciated visualization’.
The appreciated confronting mirror
Parents were aware of the importance of a healthy diet and their position as a role model. They indicated that they tried to eat and serve healthy food as much as possible. The term ‘healthy’ referred mainly to variety and the restriction of unhealthy foods such as sweets, French fries and chocolate bars. Parents greatly appreciated the CANAA-W as an instrument to evaluate whether they were indeed doing well. For some parents, the advice indicated unexpected shortcomings in some food groups or nutrients. These parents therefore described the advice as confronting or some even shocking:
Yes, it was confronting … but actually this is ok, especially because you think to yourself: ‘I'm doing well…’.
This could stimulate them to try to improve their children's diet. To this end, the printable food calendars were also greatly appreciated. Further on, these could help to make the children conscious of their diet and might help in encouraging picky eaters:
The calendars are interesting because you can hang them up and ask your child to colour them in. This way, children can evaluate their own eating and drinking habits.
The useful redundancy of the given information and the highly appreciated visualization
The large amount of nutritional information greatly impressed the participating parents. However, they also admitted that it was a lot to read and many skipped the more general information. Some also indicated that the nutrient table was more for people on a diet or professionals like dietitians or sports people, while others did appreciate the information.
Nevertheless, parents felt that it was not necessary to reduce or delete any information since some background information could refresh their memory, the information could be useful for others and one could easily focus on the most appropriate/personal information. To conclude, in general the large amount of information was considered as useful redundancy:
I think it's a lot to read, but you're free to read whatever you want. Eventually, you get a first impression from your triangle. Some people get enough information from the triangle and others want more details.
In addition, parents greatly appreciated the visual presentation, which strongly facilitated the reading; the use of traffic light colours made selective reading easier and the use of graphics and pictograms even made it possible to become informed ‘without any reading’:
Yes, I find it very useful that you can see in the triangle how good your food habits are. You see it immediately, it is clearer than when it's written, like: ‘your child drinks too much milk’.
Also the illustrated recipes were considered as attractive and encouraging for children. Finally, the few suggestions to improve the website were mainly linked to the visual presentation: to provide separate feedback screens for each food group and nutrient, to make links to additional pages clearer and to add a menu or tab sheets.
Discussion
The present paper describes the formative evaluation of an online tailored nutrition intervention tool (CANAA-W) among parents of children. The results of the quantitative analysis indicate that parents were in general positive about CANAA-W. Even the least positive items were favourably evaluated by more than 80 %. A study by Vandelanotte et al.(Reference Vandelanotte, De Bourdeaudhuij and Brug37) investigating the feasibility and appreciation of a tailored fat intake intervention among adults about their own food intake also reported very positive results. For example, 76 % of the respondents indicated that the fat intake advice was credible and only 15 % of them indicated that the advice was not correct. The percentages in our study were even better. However, comparison is difficult as the previous authors focused only on fat intake and used a 5-point evaluation scale whereas we opted for a 4-point scale to avoid neutral responses. In a study by Haerens et al. among adolescents(Reference Haerens, Deforche and Maes38) using an adapted version of the instrument of Vandelanotte et al.(Reference Vandelanotte, De Bourdeaudhuij and Brug37), the results were less positive. For example, only 34 % found the messages credible and only 38 % found the messages correct. The study by Vandelanotte et al. was, however, conducted in a convenience sample of adults, as in our study, while the study by Haerens et al. was conducted in adolescents in the school context in a class setting; moreover, the level of interest in nutrition might be lower during adolescence.
Each of the components of the feedback was considered useful by the majority of the parents (72 % or more) in our study, with the personal textual advice on the food groups and nutrients scoring as the most useful components (63 % and 65 % indicating that these components were ‘very’ useful). Essentially the same information was presented in the triangle and the nutrient table, but in more schematic form. On the other hand, where appropriate, the textual advice also contained practical tips to improve the child's diet.
The usability of the food triangle, the preferences circles and the nutrient table scored equally highly, although some suggested in the focus groups that the nutrient table was more for professionals. It could be that these components would be scored differently in a more diverse sample, including a larger number of less well-educated parents. In addition, we only questioned the usability; in future studies it might be worthwhile to investigate the actual understanding of each of these components.
The qualitative analyses revealed that parents found the advice confronting and some even shocking. Lack of awareness of personal dietary habits has been identified as a major barrier in motivating people to change to a healthier diet(Reference Brug, Vanassema and Kok39, Reference Lechner, Brug and DeVries40). To this end, the intervention was already successful.
Furthermore, the qualitative analyses revealed that the visualization (traffic light colours, pictograms, food model, diagrams, etc.) was well received by the respondents, while the length of the feedback was rather a drawback. Our intervention focused on multiple dietary behaviours simultaneously and hence extensive feedback was almost inevitable. Nevertheless, only 19 % reported in the questionnaire that the advice contained too much information. Moreover, parents recognized that the traffic light colours helped overcome this obstacle. In the study by Vandelanotte et al.(Reference Vandelanotte, De Bourdeaudhuij and Brug37), only a few indicated that the fat advice was too long, while in the study by Haerens et al.(Reference Haerens, Deforche and Maes38), about half of the adolescents considered the messages (about five or six pages) too long. Maes et al.(Reference Maes, Cook and Ottovaere14) developed a tailored instrument for adolescents targeting fat, fibre, calcium, vitamin C and iron intake. Their feedback was restricted to a short tabular format, including the recommended intake, the respondent's actual intake, a symbol indicating if this was OK or not and, for the ‘not OK’ nutrients, some recommendations on the food level (e.g. for fibre: eat more fruit, vegetables). In their study, the scores were rather high for ‘the advice does not contain enough info’, indicating that a short tabular format, without any further explanation, did not contain the information the respondents were expecting or needed.
Finally some limitations should be noted. First, 3 d of dietary data is limited as a representation of usual dietary intake. However, some parents(Reference Vereecken, Covents and Maes24) indicated that asking parents to complete more days could decrease the feasibility to participate in this type of study for many parents. In addition, the feedback indicates that the more days are completed, the more accurate the advice will be.
Second, some parents may not know everything their child consumed.
Third, the evaluation of the child's dietary intake as ‘excellent’ was based on the dietary guidelines. However, there are no objective criteria to make a further distinction in terms of what would be considered as for example OK, too little or much too little and hence this is based on the interpretation of the developers.
Fourth, congruent with other studies(Reference Stopponi, Alexander and McClure41, Reference Block, Sternfeld and Block42), our response rate was very low. Some parents may not have access to the Internet, although in Belgium-Flanders the Internet penetration in families with children is quite high at 93 % in 2010(43). Also, when a topic is sensitive or a large effort is required, as in the present study, the risk of a low response rate is substantial(Reference Berg, Jonsson and Conner44). Moreover, participants may be even more reluctant to complete computer surveys, for which they have to get acquainted with unfamiliar software.
Fifth, the participants cannot be considered as representative of the general population. From the focus groups, it was clear that in general they considered a healthy diet important. Moreover, congruent with other Internet-based nutrition studies(Reference Oenema, Brug and Lechner16, Reference Papadaki and Scott45, Reference Brouwer, Oenema and Raat46), most participants had a higher education level. Those from lower education levels are more likely not to have Internet access(43). In addition, qualitative research indicates that women of lower social class are less health-conscious(Reference Hupkens, Knibbe and Van Otterloo47, Reference Inglis, Ball and Crawford48). Nevertheless, considering the less healthy eating patterns of children from lower social classes(Reference Vereecken and Maes3, Reference Vereecken, Maes and De Bacquer49), these would probably benefit more from the tailored advice than their counterparts of high social class. Moreover, most participants were females, but this was expected, as mothers are usually the family's food preparers.
Sixth, the messages were not matched to personal behavioural determinants (such as motivation and self-efficacy) as the large number of target behaviours would have resulted in an over-long assessment instrument.
Finally, qualitative research methods are by nature subjective. The characteristics of researchers may shape the interactions with participants and the interpretation of the data; however, using multiple researchers helped us to ensure dependability. In addition, the research team regularly discussed their agreements and disagreements in working to achieve consensus on the interpretation of the data. A strength of the study is the triangulation mixed-method design (i.e. the combination of the quantitative and qualitative analyses), which provided us a more complete formative evaluation.
Conclusions
The study shows that CANAA-W was well received by the respondents: the scores on the feasibility questionnaire were high and the qualitative analyses showed that the confrontation with their child's diet, and attractive visualization of the most relevant feedback linked to more elaborated optional feedback, were well appreciated by parents. A further evaluation with a pre-test–post-test randomized experimental and control group is, however, necessary to investigate whether the intervention is also effective in improving young children's dietary habits. The major challenge will be to convince parents who are less interested in dietary habits and less computer-literate to participate in this type of study.
Acknowledgements
C.V. is postdoctoral researcher funded by the Research Foundation–Flanders. There are no conflicts of interest. The program was developed by M.C. and C.V. Hanne Bossuyt and Evelyne De Ryck collected the data and did preliminary analyses in the frame of their master's theses. C.V. and T.M. did the final analyses and wrote the manuscript. All authors reviewed and approved the final version. The authors would like to thank the children and parents for their participation in the study.


