


Malnutrition and inflammation are very common, and often co-exist in haemodialysis (HD) patients, called malnutrition inflammation complex syndrome or malnutrition inflammation atherosclerosis, leading to poor clinical outcomes and increased mortality(Reference Kalantar-Zadeh1). Particularly, a higher rate of cardiovascular mortality is observed amongst patients with chronic kidney disease, and about 50 % of the total deaths in patients with maintenance HD can be attributed to CVD(Reference Stack and Bloembergen2). Chronic systemic inflammation and protein-energy wasting are regarded as the major mediators of higher risk of CVD among maintenance HD patients(Reference Hung, Kuo and Peng3). In addition to heart diseases, inflammation itself is a risk factor for wasting in renal patients(Reference Ortega, Rodriguez and Gallar4).
It was proposed that the Iranian population does not follow a healthy eating style(Reference Abdi, Atarodi and Mirmiran5). The consumption rate of fruits/vegetables, eggs and dairy products is 25, 20 and 25 % lower than the recommended amounts. Moreover, it was reported that cereal consumption is nearly 40 % lower than in most of the world. In addition, they consume salt and sugar higher than the values suggested for a healthy dietary pattern(Reference Abdi, Atarodi and Mirmiran5–Reference Esteghamati, Noshad and Nazeri7).
Diet plays a pivotal role in immunonutrition, and several particular nutrients affect the inflammatory and immunological parameters(Reference Heyland, Novak and Drover8). Thus, assessment of dietary status is of particular importance for the health promotion and clinical management of the HD population(Reference Kopple9). A new tool based on a broad literature search regarding the role of diet on inflammation is the dietary inflammatory index (DII), which depends on the entire diet and is not limited to micronutrients and macronutrients and also contains the dietary components, including tea and spices(Reference Cavicchia, Steck and Hurley10,Reference Shivappa, Steck and Hurley11) . It shows the inflammatory weights of some dietary components reflecting that the diet can anticipate the C-reactive protein (CRP), TNF-α and IL-6 levels in serum(Reference Tabung, Steck and Zhang12).
As mentioned earlier, the evaluation of nutritional status is crucial to improve the life quality and clinical outcomes in patients with maintenance HD. The nutritional assessment tools commonly used in such patients are BMI, subjective global assessment (SGA), malnutrition inflammation score (MIS) and dietary intake assessment(Reference Kalantar-Zadeh, Kleiner and Dunne13,Reference Kalantar-Zadeh, Kopple and Humphreys14) . In renal patients, insufficient dietary intake and inflammation are factors responsible for malnutrition(Reference Kizil, Tengilimoglu-Metin and Gumus15). There is a significant difference between patients with renal disease and other individuals in terms of diet; however, the potential inflammatory properties of dietary intake in these patients are rarely investigated. Therefore, this cross-sectional study aimed to investigate the association between DII and markers of malnutrition using a sample of Iranian individuals receiving HD.
Methods
Study population and design
The present cross-sectional study was carried out between August 2019 and June 2020 using HD patients from 50 HD centers in Tehran, Iran. Before patients’ enrollment, a written consent form was obtained from all of the participants. The present study was conducted based on the Declaration of Helsinki, and the study protocol was also approved by the Ethics Committee of the National Nutrition and Food Technology Research Institute of Iran (IR.SBMU.NNFTRI.REC.1387·319). Out of the 2302 HD patients, 291 subjects were selected using a systematic sampling technique based on predefined eligibility criteria. Adult HD patients (aged > 18 years) who are at least 6 months on HD prior to enrollment were included to participate in this study. On the other hand, patients with a history of inflammatory diseases, liver disease, chronic or acute pancreatitis, malignancies and/or HIV infection were excluded. All of the participants were haemodialysed for 4 h/session (three times a week) using polysulfone capillary dialysers and bicarbonate dialysate.
Assessment of dietary intakes
An expert dietitian via a face-to-face interview examined the dietary intakes of participants using a 4-d diet diary-assisted recall, including 2 dialysis days and 2 non-dialysis days. A Nutritionist IV software (First Databank, Hearst Corp.) was used to determine the daily intakes of energy, macronutrients and micronutrients of HD patients. This software was modified for Iranian foods.
Dietary inflammatory index I calculation
The energy-adjusted DII (E-DII) score was calculated based on the method introduced by Shivappa et al. using the energy-adjusted amounts of twenty-eight dietary items including energy, protein, fat, carbohydrate, dietary fibre, MUFA, PUFA, trans fatty acids, SFA, cholesterol, n-6 fatty acids, n-3 fatty acids, vitamin D, vitamin C, vitamin E, vitamin A, β-carotene, vitamin B1 (thiamin), vitamin B2 (riboflavin), vitamin B3 (niacin), folic acid, vitamin B6, vitamin B12, Se, Fe, Zn, Mg and caffeine(Reference Shivappa, Steck and Hurley11). The energy-adjusted values of each dietary item were calculated via a residual method(Reference Willett and Stampfer16). In the first step, the Z-score for each dietary parameter was calculated by subtracting the ‘standard global mean’ from the dietary intakes of participants, and then it was divided by the ‘global standard deviation’. Then, the calculated values were transformed to the centred percentile to decrease the skewness of data and subsequently multiplied by the inflammatory effect score of each food item. In the last step, the inflammatory score of each food item was summed to calculate the overall E-DII score for each participant. Higher E-DII values represent a diet with pro-inflammatory properties, while lower values indicate a diet with anti-inflammatory features(Reference Shivappa, Steck and Hurley11).
Assessment of malnutrition
The primary outcome of the current study was to investigate the possible association between E-DII and SGA. To determine the malnutrition status of HD patients, BMI, SGA, DMS and MIS were used. Dry weight was measured via a digital scale (Omron BF511, Omron Corp.) to the nearest 100 g at the end of a dialysis session. Height was assessed using an upstretched tape to the nearest 1 mm. BMI was calculated using weight in kg divided by squared height in m2. SGA is a valid and reliable tool for the assessment of malnutrition in HD patients, which includes medical history (i.e. functional capacity, gastrointestinal symptoms, dietary intake and weight change) and clinical assessment (i.e. physician’s grading of the loss of subcutaneous fat, presence of oedema and muscle wasting) that each variable scored using three discrete severity level(Reference Steiber, Leon and Secker17,Reference Desbrow, Bauer and Blum18) . The DMS consisted of seven variables (i.e. loss of subcutaneous fat, muscle wasting, functional capacity, gastrointestinal symptoms, dietary intake, weight change and comorbidity), and each was scored from 1 (normal) to 5 (very severe)(Reference Harvinder, Swee and Karupaiah19). By the addition of total Fe-binding capacity, serum albumin and BMI to DMS, the MIS was developed with a total score of 0–30(Reference Harvinder, Swee and Karupaiah19).
Assessment of confounders
Dialysis adequacy was estimated, based on the Kt/V index, using post-dialysis weight, dialysis length, ultrafiltration volume and pre-and post-dialysis serum urea concentration(Reference Daugirdas and Van Stone20). Dialysis vintage was defined as the length of time that each subject was on HD and presented as a year. Serum creatinine was assessed using a colorimetric method, serum urea using a photometric method, serum albumin using Bromocresol green approach, serum phosphorous using a photometric method, serum Ca using a colorimetric method and serum potassium using the flame photometric approach. All the biochemical analysis was done using commercial kits of Pars Azmoon (Tehran, Iran). The serum concentration of high-sensitive C-reactive protein (hs-CRP) was determined using ELISA kits (Diagnostics Biochem Canada) with the intra- and inter-assay CV of 4·6 %.
Statistical analysis
Using a suggested formula for sample size calculation of cross-sectional studies from small populations and with α = 0·05 and d = 0·05, a total sample of 292 was calculated(Reference Nayak21). All statistical analysis was carried out via the SPSS software version 26 (IBM Corp.), and P values less than 0·05 were considered statistically significant. Before data analysis, the normal distribution of continuous variables was tested via the Kolmogorov–Smirnov test. Categorical and continuous variables are shown as number (percent) and mean ± standard error (se), respectively. The difference of continuous variables across tertiles of E-DII was assessed using a one-way ANOVA. The distribution of categorical variables across tertiles of E-DII was also examined via the χ 2 test. Pearson correlation test was implemented to assess the correlation between hs-CRP and parameters of malnutrition. To examine the association of E-DII with the selected markers of protein-energy wasting, a multinomial logistic regression analysis was performed, and the OR with the corresponding 95 % CI is presented in three different models. Covariates were selected according to the previous literature and the accepted definition of a covariate(Reference Cardot, Crambes and Sarda22–Reference Crichton, Craven and Mackay24). They were selected based on the fact that these factors are known or suspected to be associated with both the exposure and the outcome or just established or known risk factors for the outcome(Reference Zeraatkar, Cheung and Milio25–Reference Etukudo, Agbedana and Akinyinka28). First, we adjusted for age (continuous) and sex. In the second model, further adjustment was made for dialysis adequacy (continuous), dialysis vintage (continuous), serum creatinine (continuous) and serum urea (continuous). In the final model, further adjustment was done for serum potassium (continuous), serum Ca (continuous) and serum phosphorous (continuous).
Results
Of 291 individuals with HD who were enrolled in the current study, 127 women and 164 men make up our study population with a mean (se) dialysis vintage of 4·27 (0·25) years, dialysis adequacy of 1·23 (0·02) Kt/V, BMI of 24·11 (0·26) kg/m2 and age of 57·73 (0·88) year. Patients with the highest E-DII scores compared with those with the lowest scores were younger (P = 0·030) and had lower serum phosphorous (P = 0·015). However, no other significant differences were observed regarding baseline studied parameters across tertiles of E-DII (Table 1).
Characteristics of study population stratified by tertiles of dietary inflammatory index
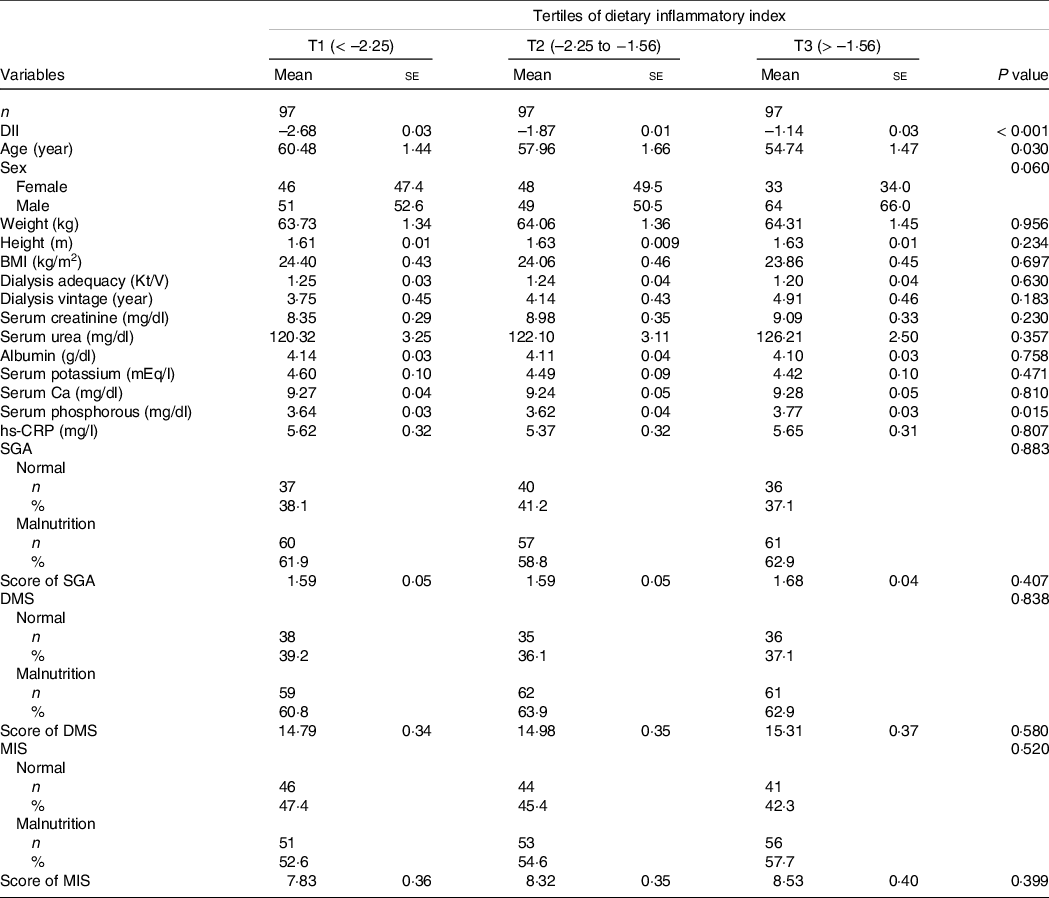
DII, Dietary Inflammatory Index; SGA, Subjective Global Assessment; DMS, Dialysis Malnutrition Score, Malnutrition Inflammation Score.
Data are presented as mean ± standard error or number (% within tertiles of dietary inflammatory index).
P value obtained from ANOVA for continuous variables and Chi-squared test for categorical variables.
Dietary intakes of selected macro-and micronutrients of the study population are presented in Table 2. As can be seen, subjects in the highest tertile of E-DII consumed lower amounts of protein, total fibre, PUFA, Mg, Se, vitamins A, E, C, B1, B2, B3, B6 and folic acid, as well as higher amounts of energy and SFA (all P values < 0·05).
Selected nutrients intake of participants across tertiles of dietary inflammatory index*
(Mean values with their standard errors)
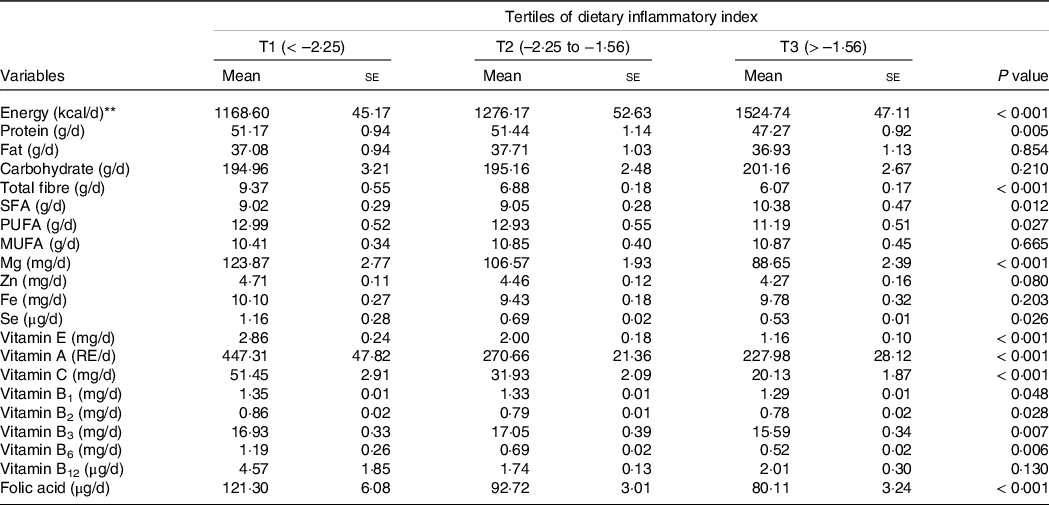
RE, retinol equivalents.
Data are presented as mean ± standard error and obtained from ANOVA.
* All values have been adjusted for total energy intake using a residual method.
** Energy intake was not adjusted
The OR and 95 % CI for parameters of malnutrition across tertiles of the E-DII scores are shown in Table 3. In the crude model, there was no significant association between E-DII and SGA (OR = 1·48; 95 % CI: 0·82, 2·66) for those in the highest tertile of E-DII compared with the lowest tertile. However, E-DII was associated with a higher risk of malnutrition (as evidenced by SGA) for subjects of the third tertile compared with the first tertile (OR = 2·23; 95 % CI: 1·11, 4·49), after controlling for sex, age, dialysis adequacy, serum creatinine, serum urea, serum potassium, serum Ca and serum phosphorous. Before the adjustment for potential confounders, there was no significant association between E-DII and DMS for patients in the top tertile E-DII compared with the bottom tertile (OR = 1·51; 95 % CI: 0·84, 2·71). After controlling for potential confounders, higher E-DII scores were significantly associated with a higher risk of malnutrition (as shown by DMS) in subjects of the highest tertile compared with the lowest tertile (OR = 2·31; 95 % CI: 1·16, 4·60). In the crude model, individuals in the top tertile of E-DII tended to have higher odds of malnutrition (as shown by higher MIS) compared with those in the bottom tertile (OR = 1·69; 95 % CI: 0·95, 2·91). After controlling for sex, age, dialysis adequacy, serum creatinine, serum urea, serum potassium, serum Ca and serum phosphorous, those in the highest tertile of E-DII had higher odds of malnutrition (as shown by higher MIS) compared with the subjects of the lowest tertile (OR = 2·50; 95 % CI: 1·28, 4·88). No significant association was detected between E-DII and BMI either before (OR = 1·78; 95 % CI: 0·83, 3·81) or after adjustment for possible confounders (OR = 1·43; 95 % CI: 0·58, 3·54).
Odds ratio (or) and 95 % confidence interval for parameters of malnutrition across tertiles of the dietary inflammatory index
(Odd ratio and 95 % confidence intervals)
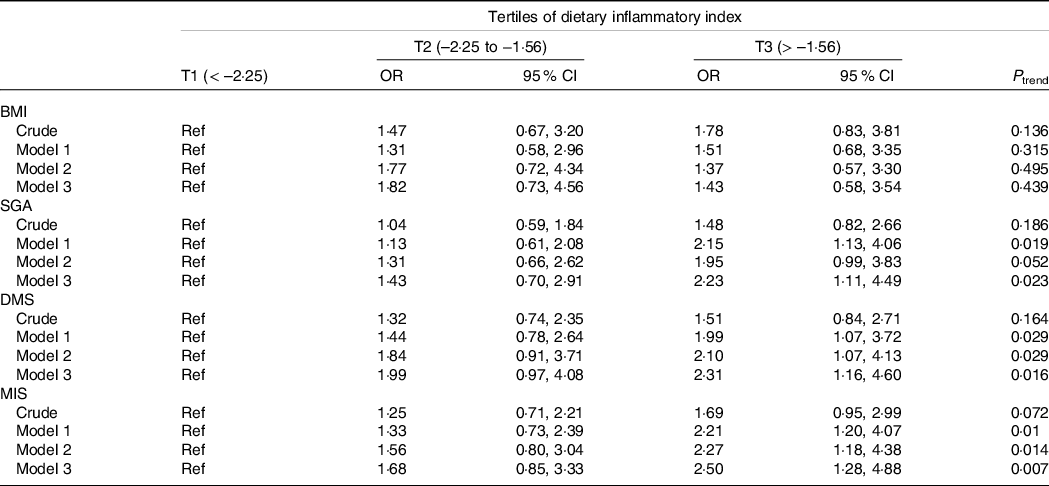
SGA, Subjective Global Assessment; DMS, Dialysis Malnutrition Score; MIS, Malnutrition Inflammation Score.
Data are presented as OR (95 % CI) and obtained from logistic regression.
Crude: Unadjusted.
Model 1: Adjusted for age and sex.
Model 2: Model 1 + dialysis adequacy, serum creatinine and serum urea.
Model 3: Model 2 + serum potassium, Ca and phosphorous.
The results of Pearson’s correlation coefficient test between serum levels of hs-CRP and parameters of malnutrition including BMI, SGA, MIS and DMS are presented in Table 4. The serum hs-CRP was significantly correlated with SGA (r = 0·224), MIS (r = 0·255) and DMS (r = 0·252) that implying a moderate correlation. However, no significant correlation was detected between hs-CRP and BMI.
Pearson correlation between parameters of malnutrition (BMI, SGA, DMS, MIS) and serum levels of hs-CRP

SGA, Subjective Global Assessment; DMS, Dialysis Malnutrition Score; MIS, Malnutrition Inflammation Score.
Data are presented as r (P value).
Discussion
To our knowledge, this is one of the first studies examining the association between the E-DII and malnutrition indicators in maintenance HD patients. The results of the present study demonstrated that E-DII was significantly associated with reliable malnutrition markers including SGA, DMS and MIS in HD patients. Malnutrition is common in HD patients and is linked with higher morbidity and mortality rates(Reference Kalantar-Zadeh1). In this study, the prevalence of malnutrition was 61·2 %, 62·5% and 55·0% according to SGA, DMS and MIS, respectively. Given the association between malnutrition and inflammation, it is, therefore, reasonable to prevent co-existing complications of malnutrition and inflammation known as ‘wasting-inflammation-atherosclerosis’(Reference Kalantar-Zadeh, Kopple and Humphreys14,Reference Kalantar-Zadeh, Ikizler and Block29) . Malnutrition can be examined using different tools, such as anthropometric indicators (e.g. body weight) and biochemical parameters (e.g. serum albumin), which can be affected by non-nutritional factors, such as liver diseases, oedema and inflammation in HD patients(Reference Kaysen, Stevenson and Depner30,Reference Thijssen, Wystrychowski and Usvyat31) . Therefore, they are not sensitive indicators for malnutrition, and it is better to use markers that are more directly related to nutrition in such patients.
Malnutrition is thought to be complex in nature. Anorexia, altered taste sensations, concurrent illness, unpalatable prescribed diets, dialysis procedures, uremia-related endocrine disorders and chronic inflammatory states are the main causes of malnutrition in HD patients(Reference Kopple32). Previous studies have shown that there is a significant association between inflammation and malnutrition in HD patients(Reference Kizil, Tengilimoglu-Metin and Gumus15,Reference Rambod, Bross and Zitterkoph33) . Similarly, in the present study, SGA, DMS and MIS were significantly correlated with hs-CRP levels, confirming the hypothesis on the association between pro-inflammatory diet, inflammation and malnutrition(Reference Rambod, Bross and Zitterkoph33). Also, several studies have shown the impact of diet on inflammation, and various dietary components have been linked to lower or higher degrees of inflammation(Reference Galland34). The DII is a novel technique for evaluating the diet’s inflammatory potential(Reference Cavicchia, Steck and Hurley10) and the potential for the individuals’ guidance to reduce inflammation and other chronic conditions(Reference Shivappa, Steck and Hurley11). Anti-oxidative and anti-inflammatory dietary components, such as vitamin C, vitamin E, carnitine and fish oil, have a critical role in the reduction of inflammation risk(Reference Kalantar-Zadeh, Stenvinkel and Bross35). Pomegranate juice(Reference Shema-Didi, Sela and Ore36) and Flaxseed oil(Reference Lemos, Alencastro and Konrath37) interventions have recently shown reduced inflammatory properties in HD patients, while SFA and high n-6/n-3 ratio are linked to increased inflammation(Reference Raphael and Sordillo38). Similarly, in the present study, SFA and PUFA intakes were significantly higher in the third tertile of E-DII. These results suggest a multidimensional relationship between diet, inflammation and malnutrition.
DII was formulated on the basis of the association between potential inflammatory properties of a diet and six inflammatory biomarkers including CRP, TNF-α, IL-10, IL-1β, IL-6 and IL-4(Reference Shivappa, Steck and Hurley11). In the current study, no association was observed between E-DII and hs-CRP. This finding was consistent with previous reports which proposed that CRP is less sensitive to E-DII compared with other inflammatory biomarkers(Reference Tabung, Steck and Zhang12,Reference Cesari, Penninx and Newman39–Reference Shivappa, Hebert and Marcos41) .
Adequate energy intake is necessary to prevent malnutrition in HD patients, but micro-and macronutrient contributions to energy intake are significant. Many dietary variables including red and processed meat, refined carbohydrates and SFA, which are found highly in a western dietary pattern, can affect inflammation(Reference Kizil, Tengilimoglu-Metin and Gumus15). In this regard, in the present study, patients with a high E-DII score also had poor nutrition, despite consuming more dietary energy. This may be due to consuming more SFA and other unhealthy fats in the third tertile of E-DII. Accordingly, we can suggest that increasing energy intake alone is insufficient to guarantee appropriate nutrition. Therefore, it is important to consider the contributions of micro-and macronutrients to energy intake to fight malnutrition in HD patients(Reference Kizil, Tengilimoglu-Metin and Gumus15). Also, in the present study, lower dietary intakes of micronutrients were observed in fibre, Mg, vitamin A, vitamin E, vitamin C and some assessed vitamin B complex in subjects in the third tertile of E-DII. The relationship between E-DII and malnutrition indicated that the lower the intake of these micronutrients, the worse inflammation and malnutrition would be.
Inflammation is also complex and multifactorial. The repeated contact of blood mononuclear cells with dialyser membranes and dialysis tubes, carbonyl and oxidative stress, contaminated dialysis solution and subclinical or clinical infection of the vascular access port are some factors contributing to inflammation in HD patients(Reference Lemos, Alencastro and Konrath37). However, according to the results of the present study, adherence to a pro-inflammatory diet, especially a diet rich in saturated fats and malnutrition can be considered one of the most common causes of inflammation in HD patients.
BMI is a typical anthropometric indicator of malnutrition in HD patients, and it is thought to be a predictor of poor prognosis and high mortality(Reference Salahudeen42). However, in the present study, BMI failed to detect the individuals’ inflammatory status. Similar to our findings, it was reported that BMI was not associated with the intensity of inflammation in HD patients(Reference Beberashvili, Sinuani and Azar43). This is because BMI does not account for central adipose tissue related to inflammation(Reference Ruperto, Sánchez-Muniz and Barril44).
Although we found the association between E-DII and malnutrition in HD patients, in the interpretation of the results of this study, some limitations should be considered. First, due to the cross-sectional design of this study, we could not infer a causal relationship. Second, dietary data were collected according to a 4-d dietary recall, indicating that the individuals’ actual dietary intakes might have been underestimated. Third, we calculated E-DII based on twenty-eight dietary items, and data related to seventeen items were not available in this study, which can affect the results. Fourth, despite the adjustment for several known confounders, some residual confounding cannot be excluded in our findings, and finally, since the study was only conducted on HD patients, caution should be taken to generalise our results to patients with other types of treatment. Fifth, we used logistic regression to assess the association between E-DII and malnutrition in HD patients. Since the prevalence of malnutrition is high among this population, one may argue that this point can overestimate the effect size. Moreover, owing to the nature of the variables, it was not possible to do Poisson regression analysis instead to fix this issue. Therefore, this point should be considered while interpreting the findings.
Conclusion
Given the effects of malnutrition and some micronutrient deficiencies on an increased risk of CVD, immune abnormalities and catabolic states in HD patients(Reference Guo, Chen and Yeh45), it is therefore important to look at the nutritional status with indicators assessing the overall diet. This study showed that E-DII was significantly associated with reliable malnutrition markers including SGA, DMS and MIS in HD patients. However, further longitudinal studies are warranted to infer a cause-and-effect relationship between DII and malnutrition.
Acknowledgements
The authors would like to thank all patients who kindly contributed to the study.
This study was funded by Shahid Beheshti University of Medical Sciences, Tehran, Iran.
Conception and design: A. As’. and H. T. Acquisition of data: A. As’. and H. T. Analysis and interpretation of data: A. A. Drafting the manuscript: A. A., S. G-H. and A. As’. Revising it for intellectual content: A, A., S. G-H., A. As’. and H. T.
The study protocol was approved by the Ethics Committee of the National Nutrition and Food Technology Research Institute of Iran (IR.SBMU.NNFTRI.REC.1387·319).


