

Fe deficiency anaemia during infancy is the most common nutrient deficiency worldwide(1). Infants and young children are particularly at risk of Fe deficiency due to high demand for Fe during the period of rapid growth and due to a diet with low available Fe(1). Healthy term infants are born with Fe reserves that usually ensure an adequate supply during the first 4–6 months of life when breastfed(Reference Aggett, Barclay and Whitley2). After 6 months of age, however, the dietary requirements for Fe increase markedly. For this reason, Fe deficiency most commonly develops during late infancy (6–12 months) and during the second year of life(Reference Aggett, Barclay and Whitley2). Fe deficiency that progresses into Fe deficiency anaemia may be associated with delayed mental and motor development(Reference Booth and Aukett3) and it is uncertain whether such consequences are reversible(Reference Aggett, Agostoni and Axelsson4).
Complementary feeding diets in industrialised countries include a broad range of foods containing Fe. Fish, meat and chicken in these diets are especially good sources of Fe due to the high content of haem-Fe, which is easily absorbed and promotes the absorption of non-haem from other foods(Reference Cook and Monsen5, Reference Hallberg, Bjorn-Rasmussen and Howard6). In contrast, several components in the diet, like phytic acid and Ca, may reduce the amount of bioavailable Fe(Reference Hallberg, Brune and Rossander7, Reference Hallberg, Rossander-Hulthen and Brune8). Previous studies(Reference Engelmann, Sandstrom and Michaelsen9, Reference Michaelsen, Milman and Samuelson10) on Fe intake in Danish infants showed that Fe status in 8–9-month-old infants was positively associated with fish and meat intake, whereas a negative association was found for intake of cow's milk and bread.
Contrary to most countries, Denmark recommends that infants are given Fe supplements (8 mg Fe/d) from the age of 6–12 months if they do not receive at least 400 ml Fe-fortified formula and/or follow-on formula per d(11). Fe supplements, most commonly in the form of Fe drops, are easily distributed, have long shelf-life and are less expensive than fortifying foods with Fe. However, the risks and benefits of Fe supplementation are likely to vary between populations. Whereas there is sound evidence for the efficacy of Fe supplementation for Fe-deficient infants and young children in developing countries(Reference Iannotti, Tielsch and Black12), several studies have found significant adverse effects in infants with normal Fe status(Reference Dewey, Domellof and Cohen13–Reference Sachdev, Gera and Nestel16). In both affluent(Reference Dewey, Domellof and Cohen13, Reference Sachdev, Gera and Nestel16) and developing countries(Reference Idjradinata, Watkins and Pollitt14, Reference Majumdar, Paul and Talib15), several studies have suggested that Fe supplementation for 4–5 months was significantly associated with decreased growth of infants with normal Fe status.
The benefits and potential negative effects of complying with the Danish Fe supplementation recommendation on the Fe status of Danish infants have not been thoroughly examined. In the present study, we therefore tested the hypothesis that Fe status among 9-month-old infants following the Danish Fe supplementation recommendation is associated with more favourable levels of Fe status indicators, compared to those not following the recommendation.
Materials and methods
The data for this study were obtained from infants seen at the first examination of an ongoing prospective cohort – the SKOT (Småbørns Kost Og Trivsel; Complementary and young child feeding) cohort. The overall aim of the SKOT cohort was to describe how complementary feeding of infants influences growth, development and risk factors for later disease. The infants were examined at age 9 months ± 2 weeks.
A random sample of 9-month-old infants living in Copenhagen and Frederiksberg was established through the National Danish Civil Registry. The sample included infants born from April 2007 to May 2008. An invitation was posted to 2211 families 4–7 weeks before the infants turned 9 months. The inclusion criteria were: singleton infants born ≥ 37 weeks of gestation and without diseases that could affect growth or food intake. Written consent to their participation was obtained from all parents. Parents were interviewed on diet, growth and health of the infant and were provided with instructions on food recording. Records were taken of the age of the infant at which full and partial breast-feeding had stopped and on the frequency of feeding for infants still being breastfed. Less than once a day was coded as zero. Full breast-feeding was defined as only receiving breast milk, water and vitamins. This study was conducted according to the guidelines laid down in the Declaration of Helsinki. All procedures involving subjects were approved by the Committees on Biomedical Research Ethics for the Capital Region of Denmark (H-KF-2007-0003).
Anthropometric measurements
Nude weight to the nearest 1 g was measured in all infants using a digital paediatric scale (Saratorius IP 65; Bie & Berntsen AS). Recumbent length was recorded to the nearest 0·5 cm using a digital measuring board. All measurements were performed by four well-trained observers.
Anthropometric measurements were entered into the software program WHO Anthro 2005(17).
Diet recording
The diet was recorded for seven consecutive days using a validated method consisting of precoded booklets accompanied by a booklet with twelve food photograph series(Reference Gondolf, Tetens and Hills18). A detailed description of the method is given elsewhere(Reference Gondolf, Tetens and Hills18).
Intake of energy, nutrients and food items recorded in the precoded food record was calculated for each individual using the software system GIES (general intake estimation system) (version 1.000d, developed at National Food Institute, Technical University of Denmark) and the Danish Food Composition Databank (version 7; Søborg; www.Foodcomp.dk). The intake model in GIES operates with three separate data layers: the recorded food intake, recipes and food composition data.
Infants meeting the Fe supplementation recommendation were defined as either having received Fe drops five or more days a week from 6 months of age or having received at least 400 ml Fe-fortified formula and/or follow-on formula per d.
Base diet was defined as all foods and drinks except for human milk, formula and follow-on formula.
Blood samples
A 5 ml venous blood sample was drawn by trained laboratory technicians from the forearm in test-tubes containing lithium-heparin. Local anaesthesia of the skin was given using a eutectic mixture of local anaesthetics (EMLA) patch (AstraZeneca AB) if the parents wished. Hb was measured immediately after sampling using a Sysmex KX-21 haematology machine (Sysmex Corporation) with intra- and interassay variation of 0·7 and 0·6 %, respectively. Ferritin was analysed by chemiluminescent immunometric assay using an Immulite 1000 analyser (DPC, Diagnostic Products Corporation) with intra- and interassay variation of 2·7 and 5·0 %, respectively. Serum transferrin receptor concentration (TfR) was analysed by immunenzymometric assay (Orion Diagnostica A/S) using an ABX Pentra 400 machine (Horiba ABX) with intra- and interassay variation of 1·3 and 2·6 %, respectively. C-reactive protein concentration was measured by immunoturbidimetric assay (ABX Pentra CRP CP, Horiba ABX) on ABX Pentra 400 machine (Horiba ABX) with intra- and interassay variation of 3·6 and 3·4 %, respectively.
In the present study, cut-off values for Fe deficiency anaemia of Hb < 100 g/l (6·2 mmol/l) and of serum ferritin < 12 μg/l were considered appropriate for this age-group(Reference Domellof, Dewey and Lonnerdal19). Fe deficiency was defined as cases with ferritin < 12 μg/l. The cut-off value for serum ferritin of < 12 μg/l was based on WHO criteria(1, 20). Infants having TfR>3·3 mg/l were classified as having increased TfR levels(Reference Suominen, Virtanen and Lehtonen-Veromaa21).
Since serum ferritin is a phase reactant, infants having C-reactive protein>10 mg/l were excluded from data analysis.
Statistical analyses
Data are presented as means, with standard deviations and percentiles. Group comparisons were performed using Student's t test, Mann–Whitney U test, general linear modelling or χ2 test. Statistical analyses of predictors for ferritin levels were performed following logarithmic transformation because of the skewed distribution. The logarithmic values of the ferritin levels were used as the dependent variable in multiple linear regression analysis of factors influencing the Fe stores. The independent values were: growth rate (g/d since birth), birth weight, sex, compliance with the Fe supplementation recommendation, length of exclusive breast-feeding, duration of any breast-feeding, mother's education, receiving Fe drops >5 d a week, total Fe in the diet, and intake of cow's milk, formula and follow-on formula, meat and fish, bread, potatoes, fruit and vegetables. Backwards elimination was used in the multiple linear regression analysis. Variables with a P level < 0·05 were retained in the final model.
The estimated regression coefficients (β) represent the slope, the effect on the dependent variable for one unit increase in the independent variable. Since serum ferritin was logarithmically transformed, we transformed the coefficients to ratio estimates (10β), indicating a multiplicative increase in the dependent variable corresponding to one unit increase in the independent variable. The method is described in detail elsewhere(Reference Andersen, Molgaard and Skovgaard22).
General linear modelling was used to compare Hb and Fe status indicators for groups that met the Fe supplementation recommendation and groups that did not. Adjustments were made for sex, intake of cow's milk, birth weight and growth rate (measured as the weight difference between 9-month examination and birth). Serum ferritin was logarithmically transformed because of the skewed distribution. Data were analysed with the software program SAS (version 9.1 for Windows, SAS Institute, Inc.). P ≤ 0·05 was considered as significant.
Given the study sample size and assuming a standard deviation of ferritin values of 24 μg/l(Reference Domellof, Lind and Lonnerdal23), the statistical power of the study to detect a difference of 12 μg/l was 80 %. For Hb, assuming a standard deviation of 8 g/l(Reference Domellof, Lind and Lonnerdal23), the power of the study to detect a difference of 4 g/l was 80 %.
Results
The study examined 312 participating infants and obtained blood samples from 278 infants. In thirty-four cases, it was not possible to obtain a blood sample either due to unsuccessful sampling or owing to lack of parental consent. Infants were excluded as follows: fourteen due to having C-reactive protein>10 mg/l; two because of too many missing diet recording days (>2 d); one due to an improbably high record of intake of energy and fat; and one due to the diagnosis of chronic illness affecting metabolism. Thus, 260 infants were included in the analysis. Of these, 127 infants had received Fe drops from the age of 6 months >5 d a week, sixty-four infants received more than 400 ml Fe-fortified formula and/or follow-on formula per d and sixty-nine infants did not meet the Fe supplementation recommendation set for this age group. From this latter group, thirty-three infants had received Fe drops sporadically. When the characteristics of infants meeting the Fe supplementation recommendation were compared with those not meeting the recommendation, no significant differences were found for age, weight, birth weight, BMI z-score, length, growth rate (g/d since birth) and proportion of infants being partly breastfed. However, the proportion of girls was significantly larger in the group meeting the Fe supplementation recommendation compared to those not meeting the recommendation (P = 0·034; Table 1).
Characteristics of 9-month-old infants (Mean values and standard deviations)
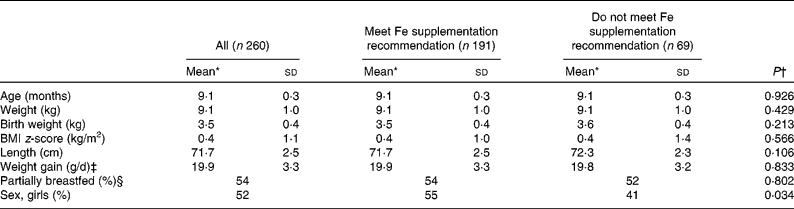
* Mean for continuous variables and percentages for categorical variables.
† Comparing supplementation groups.
‡ Measured as the weight difference between 9-month examination and birth.
§ Receiving breast milk once or more per d.
Predictors for Hb and ferritin levels
The influence of different variables on Hb levels was examined using multiple regression analysis. Hb levels were negatively associated with length of exclusive breast-feeding (P < 0·001) and intake of cow's milk (P = 0·013) (Table 2). Intake of meat and fish was not significant (P = 0·366 and P = 0·869, respectively).
Estimates from multiple linear regression analysis of factors associated with change in serum ferritin and Hb for 9-month-old infants (Regression coefficients (β) and standard deviations)
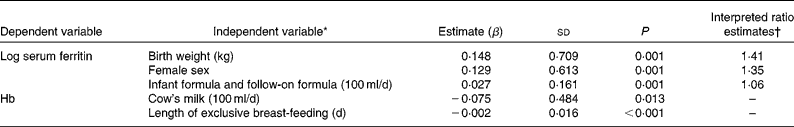
* Only variables reaching statistical significance are given in the table. The independent variables in the multiple regression analysis were: growth rate, birth weight, sex, meeting the Fe supplementation recommendation, length of exclusive breast-feeding, duration of any breast-feeding, mother's education, receiving Fe drops>5 d a week, total Fe in the diet and intake of cow's milk, formula and follow-on formula, meat and fish, bread, potatoes, fruit and vegetables.
† Since serum ferritin was logarithmically transformed, the estimated β was transformed to ratio estimates (10β), indicating a multiplicative increase in serum ferritin corresponding to one unit increase in the independent variable.
Log ferritin was positively associated with birth weight (P < 0·001), female sex (P < 0·001) and intake of Fe-fortified formula and follow-on formula (P = 0·001) (Table 2). Intake of meat and fish was not significant (P = 0·541 and P = 0·627, respectively).
Hb and iron status indicators
Hb and Fe status indicators are shown in Table 3. Serum ferritin was significantly higher, and TfR significantly lower, among infants meeting the Fe supplementation recommendation compared to those not meeting the recommendation (P < 0·0001 and P = 0·003, respectively). No significant difference for the two groups was found for Hb. Girls had significantly higher mean ferritin and lower mean TfR than boys; mean ferritin of 41·5 (sd 29·9) and 33·0 (sd 22·7) μg/l (P = 0·009) and mean TfR of 2·3 (sd 0·4) and 2·5 (sd 0·7) mg/l (P = 0·004) for girls v. boys, respectively (data not shown).
Hb and iron status indicators for 9-month-old infants according to meeting the iron supplementation recommendation(Number of participants, mean values and standard deviations; median values and 5th percentile (P5) and 95th percentile (P95))
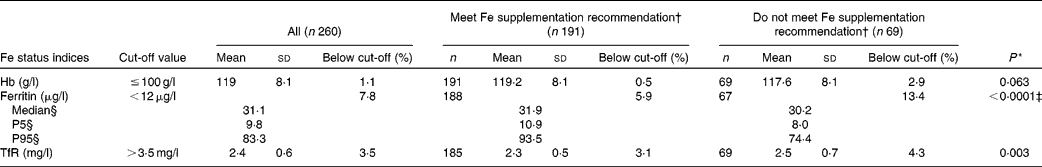
TfR, transferrin receptor.
* Comparing supplementation groups by general linear models adjusted for sex, cow's milk intake, birth weight and growth (measured as the weight difference between 9-month examination and birth).
† Receiving at least 400 ml Fe-fortified formula and/or follow-on formula per d or receiving Fe supplements (8 mg Fe/d).
‡ Calculated for the logarithmically transformed values of serum ferritin.
§ Due to skewed distribution.
Iron deficiency
Overall, twenty infants (7·8 %) had ferritin levels < 12 μg/l (Table 3). The proportion of infants with anaemia according to Hb cut-off levels of 100, 105 and 110 g/l, was 1·1, 3·8 and 13·5 %, respectively. The combination of low ferritin levels and anaemia (Hb ≤ 100 g/l), indicating Fe deficiency anaemia, was present in one infant (0·7 %) who had received Fe supplementation according to the recommendation. This infant did not have increased TfR levels. With regard to the proportion of infants below the cut-off for Hb ( ≤ 100 g/l), ferritin ( < 12 g/l) and TfR (>3·5 mg/l), no significant differences were found between the supplementation groups (P = 0·117, P = 0·111 and P = 0·687, respectively).
Iron intake
Infants meeting the Fe supplementation recommendation had a significantly higher intake of formula and follow-on formula (P = 0·001) and a lower intake of meat (P = 0·038) than infants not following the recommendation (Table 4). No significant differences were found for Fe intake from base diet between the infants meeting the Fe supplementation recommendation compared to infants not meeting the Fe supplementation recommendation (Table 4). Comparing the contributions from different food groups to Fe intake, the only significant difference was for meat and fish; infants meeting the Fe supplementation recommendation received significantly lower Fe contribution than infants not following the recommendation (P = 0·030; Table 4). The median Fe intake from total diet was 5·3 mg/d for all infants; infants being partially breastfed had a median Fe intake of 3·7 mg Fe/d and infants completely weaned had an intake of 7·2 mg Fe/d. The Fe content of breast milk was not analysed.
Iron intake from selected food groups and total iron intake from base diet and contribution of different food groups to iron intake for 9-month-old infants (Percentages of food groups, median values, 5th percentile (P5) and 95th percentile (P95))

* Comparing supplementation groups.
† All foods and drinks except for human milk, formula and follow-on formula.
Discussion
The present observational study confirms the hypothesis that Fe status among infants following the Fe supplementation recommendation was significantly associated with increased serum ferritin and decreased levels of TfR indicating more favourable Fe status, compared to infants not following the recommendation. In contrast, no significant differences were found in Hb levels.
A study investigating the effects of Fe-fortified foods (including Fe-fortified formula) and medicinal Fe drops on Fe status in infants concluded that the mode of oral administration affects whether Fe will be incorporated into Hb or deposited into stores(Reference Domellof, Lind and Lonnerdal23). Infants at 9 months who had received Fe drops in addition to habitual diet had significantly increased serum ferritin levels but no change in Hb compared to a control group. By contrast, infants with a high intake of Fe-fortified foods (including Fe-fortified formula) and no intake of Fe drops had significantly higher Hb and no effect on serum ferritin compared to the control group(Reference Domellof, Lind and Lonnerdal23). The authors speculate that a single dose of Fe drops leads to a sharp peak in serum Fe, whereas Fe-fortified foods typically are consumed in smaller portions throughout the day, leading to smaller peaks. A sharp peak in serum Fe may stimulate a peptide, hepcidin, which might divert Fe from the Fe drops into stores, whereas Fe given as fortified foods can be used for Hb synthesis(Reference Domellof, Lind and Lonnerdal23). This could explain why we detected a significant increase in serum ferritin while no significant difference was found for Hb between the two supplementation groups. However, the difference in Hb was borderline in terms of statistical significance. This may be explained by some of the infants in the group meeting the recommendation solely receiving Fe-fortified formula and/or follow-on formula in amounts large enough to meet the Fe supplementation recommendation (>400 ml/d). This theory is supported by results of an earlier study examining the effect of increased meat intake on Fe status indicators in 8-month-old infants. After a 2-month intervention period, infants eating a high-meat diet had significantly increased Hb levels compared to infants eating a low-meat diet, while no effect was observed for serum ferritin(Reference Engelmann, Sandstrom and Michaelsen9). Another study of Fe absorption in 9-month-old breastfed infants demonstrated a significant positive effect on serum ferritin after Fe supplementation (Fe drops) compared to infants not receiving Fe supplements, while Hb levels were not significantly affected(Reference Domellof, Lonnerdal and Abrams24). In the present study, a larger sample size might possibly have revealed a significant difference in Hb levels.
The positive association between birth weight and serum ferritin is in line with other studies(Reference Male, Persson and Freeman25–Reference Sherriff, Emond and Hawkins27) and may reflect the fact that infants born with high birth weight have larger Fe stores. In this study, there was no association between serum ferritin and growth rate, as has been shown in several other studies(Reference Michaelsen, Milman and Samuelson10, Reference Sherriff, Emond and Hawkins27–Reference Thorsdottir, Gunnarsson and Atladottir29). This may be explained by the Fe demand during lean tissue growth.
The present study found a significant negative association between cow's milk intake and Hb levels, but there was no significant association between cow's milk intake and serum ferritin levels. A negative association between cow's milk consumption and Fe status indicators has been reported elsewhere(Reference Michaelsen, Milman and Samuelson10, Reference Thorsdottir, Gunnarsson and Atladottir29, Reference Freeman, Mulder and van't Hof30). A negative association has also been reported(Reference Male, Persson and Freeman25) between duration of cow's milk feeding during the first year and Fe status. These associations have led many countries including the USA and the UK to delay introduction of cow's milk until the age of 12 months(31, 32). In Denmark, contrary to most countries, the official recommendations allow gradual introduction of cow's milk from the age of 9 months(33). The mean intake of cow's milk in this study was very small, amounting to less than 50 g/d (Table 4). Thorsdottir et al. (Reference Thorsdottir, Gunnarsson and Atladottir29) have shown that the effect of cow's milk consumption on serum ferritin was not detected until consumption reached 500 g/d(Reference Thorsdottir, Gunnarsson and Atladottir29). This might explain why no association between cow's milk consumption and serum ferritin was found.
A positive association between meat and fish and Hb or serum ferritin has been found in several studies(Reference Michaelsen, Milman and Samuelson10, Reference Thorsdottir, Gunnarsson and Atladottir29). This can be explained by the high content of bioavailable haem-Fe and other factors in meat that promote non-haem-Fe absorption(Reference Hallberg, Bjorn-Rasmussen and Howard6). This study found no such association although median intakes of meat and fish were similar to the Copenhagen Cohort Study which did reveal such an association(Reference Michaelsen, Milman and Samuelson10).
No association was found between Fe status indicators and total Fe intake. This lack of association has also previously been described(Reference Thorsdottir, Gunnarsson and Atladottir29). This has been explained by the fact that Fe absorption increases in states of Fe depletion and depends on dietary components enhancing or inhibiting Fe absorption(Reference Gibson34).
Intake of formula and follow-on formula has a strong positive effect on serum ferritin in the present study. Currently, all formula and follow-on formula are Fe-fortified in Denmark; so this association was not unexpected. However, this is contradictory to an earlier Danish cohort study which showed no association between serum ferritin and intakes of formula although median intakes were similar to those in the present study(Reference Michaelsen, Milman and Samuelson10). This may be explained by the fact that fewer formulas were fortified with Fe at the time (1988) when data were collected for the earlier study.
In line with results of the studies by Sherriff et al. (Reference Sherriff, Emond and Hawkins27) and Male et al. (Reference Male, Persson and Freeman25), we demonstrated a positive association between female sex and serum ferritin. In addition, girls were shown in the present study to have a better Fe status, higher ferritin levels and lower TfR level compared to boys. Similar sex differences were found in other studies(Reference Thorsdottir, Gunnarsson and Atladottir29, Reference Domellof, Lonnerdal and Dewey35, Reference Hay, Sandstad and Whitelaw36). These may partly be explained by a faster growth rate among boys and hence a larger requirement for Fe(Reference Haschke and van't Hof37). However, growth difference alone cannot explain the sex difference, and genetic differences have been suggested as another explanation(Reference Domellof, Lonnerdal and Dewey35).
Length of exclusive breast-feeding was negatively associated with Hb. The amount of Fe in breast milk is low though well absorbed and may explain this association(Reference Siimes, Vuori and Kuitunen38). Several studies in both affluent and developing countries have found Fe status to be negatively affected when breast milk was the only milk or the predominant milk given for at least 9 months(Reference Mills39, Reference Pizarro, Yip and Dallman40).
In the present study, we found that 8 % of 9-month-old infants had Fe deficiency and < 1 % (one infant) had Fe deficiency anaemia defined as ferritin levels < 12 μg/l in combination with Hb ≤ 100 g/l. An earlier Danish study that used slightly higher criteria of Hb (Hb ≤ 105 g/l) and the same level for serum ferritin as in the present study found no cases of Fe deficiency or Fe deficiency anaemia in infants at the same age(Reference Michaelsen, Milman and Samuelson10). However, mean values of serum ferritin and Hb were similar to the present study, indicating a larger variation in serum ferritin and Hb values in our data. The prevalence of Fe deficiency in the present study was slightly lower than in a Norwegian study of 12-month-old infants (serum ferritin < 12 μ/l)(Reference Hay, Sandstad and Whitelaw36). However, both a Swedish and an Icelandic study found much higher proportions of Fe deficiency among 12-month-old infants(Reference Persson, Lundstrom and Lonnerdal26, Reference Thorsdottir, Gunnarsson and Atladottir29). The Swedish study found 26 % of the infants to be Fe deficient, while 41 % of the Icelandic infants had serum ferritin < 12 μg/l(Reference Persson, Lundstrom and Lonnerdal26, Reference Thorsdottir, Gunnarsson and Atladottir29). However, when a higher cut-off for Hb (Hb < 110 g and serum ferritin < 12 μ/l) was used, Fe deficiency anaemia was present in 3–5 % of the infants(Reference Persson, Lundstrom and Lonnerdal26, Reference Thorsdottir, Gunnarsson and Atladottir29, Reference Hay, Sandstad and Whitelaw36). For comparison, using these criteria, 1 % of the infants in the present study had Fe deficiency anaemia. This indicates a slightly lower prevalence of Fe deficiency anaemia in the Danish infants, but this could be explained by the younger age in this study (9 months v. 12 months).
For Hb, using a cut-off value of 100 g/l, 1 % of the infants were found to have anaemia. The cut-off value established by the WHO is 110 g/l up until 5 years of age(1). However, this cut-off value has been questioned in several studies(Reference Emond, Hawkins and Pennock28, Reference Domellof, Cohen and Dewey41) and the ESPGHAN Committee on Nutrition concluded that this value was too high(Reference Aggett, Agostoni and Axelsson4). Other cut-off values of 97, 105 or 107 g/l have been suggested(Reference Michaelsen, Milman and Samuelson10, Reference Emond, Hawkins and Pennock28, Reference Yip, Johnson and Dallman42).
TfR is a more recent addition to the Fe status indicators. The concentration of TfR reflects the intensity of erythropoiesis and the demand for Fe. The concentration rises in Fe deficiency anaemia and is a marker of the severity of Fe insufficiency when the Fe stores are empty and there are no other known causes of abnormal erythropoiesis(43). Comparison of this indicator between studies is difficult because different commercial assays can give different results and no cut-off value has been established for infants and young children(Reference Suominen, Punnonen and Rajamaki44). When TfR>3·3 mg/l was used as a cut-off(Reference Suominen, Virtanen and Lehtonen-Veromaa21), 3·5 % of the infants in the present study had elevated TfR. TfR is less affected by inflammation than serum ferritin(Reference Beguin45), and therefore this indicator could be a valuable tool in populations with high prevalence of infections.
There were some limitations in the present study. First, the use of post hoc allocation of infants to either of the two groups rather than randomised intervention groups. Second, our observations in Danish term, healthy, predominately Fe-replete infants at 9 months of age cannot be generalised to all infants because Fe absorption and utilisation may be dependent on infant age, growth and initial Fe status. Third, compliance over a longer time period with the Danish Fe supplementation recommendation would have effects on both serum ferritin and Hb.
Data from the present study showed that the prevalence of Fe deficiency was low compared to other Nordic countries, and almost no cases of anaemia or Fe deficiency anaemia were present, according to the criteria used. However, this could in part be explained by lower infant age in the present study. No significant difference was found in the proportion of Fe deficiency for the infants meeting the Fe supplementation recommendation compared to those not meeting the recommendation. Though Fe supplementation recommendation was significantly associated with higher serum ferritin levels and lower TfR levels compared to infants not following the recommendation, the clinical significance of this difference could be questioned. The differences found between the supplementation groups were 1·7 μg/l for ferritin and 0·2 mg/l for TfR. This is a statistically significant difference, but a difference with minor, if any, biological or clinical importance at the relatively high Fe levels found in both groups. Increased Fe stores are an advantage in coping with the risk of developing Fe deficiency anaemia in the second year of life. Fe drops are thus a beneficial surplus supply. On the other hand, it could be argued that Fe fortification of infant products along with a further delay in the introduction of cow's milk (at 12 months of age) satisfies Fe needs in infancy, thus rendering the Fe drops superfluous. The potential negative effects of Fe drops for infants with sufficient Fe stores must be examined further before firm conclusions can be drawn. Even though this study demonstrated no association between meat and fish intake and Fe status indicators, an increased intake from these food groups is likely to contribute to an even better Fe status.
In summary, the present study confirmed the hypothesis that Fe status of infants following the Danish Fe supplementation recommendation was significantly associated with increased serum ferritin and decreased levels of TfR indicating more favourable Fe status, compared to infants not following the recommendation.
Acknowledgements
The authors express their sincere appreciation to the families and infants who participated in the present study and gratefully acknowledge the team that collected the data, especially Anja Lykke Madsen, PhD student. Tue Christensen, scientist at DTU – FOOD is also acknowledged for help with the nutritional calculations. This work was supported by grants from the Danish Directorate for Food, Fisheries and Agri-Business. K. F. M. designed the trial and was involved in the data collection. U. H. G. conducted the data analysis. Data interpretation was done by U. H. G., E. T. and I. T. U. H. G. was responsible for drafting the manuscript. All authors critically reviewed the manuscript. The authors declare that there are no conflicts of interest.


