

Despite decades of public health efforts, fruit and vegetable (F&V) intake remains suboptimal in both developed and developing countries, regardless of the metric used for assessment( Reference Krebs-Smith, Reedy and Bosire 1 – Reference Del Gobbo, Khatibzadeh and Imamura 3 ).
In the USA, F&V intake is characterized predominantly using self-reported data from the What We Eat In America (WWEIA) survey, the dietary assessment component of the National Health and Nutrition Examination Survey (NHANES)( 4 ); or by using the Loss-Adjusted Food Availability (LAFA) data series, which consists of supply and disappearance estimates (food balance sheets) that are adjusted for food losses( 5 ). These dietary data collection programmes each utilize a distinct methodology that can be suitable for different purposes. For example, WWEIA is well suited for nutrient intake analysis( Reference Fulgoni, Keast and Auestad 6 , Reference O’Neil, Keast and Fulgoni 7 ), and LAFA is well suited for tracking the adequacy of the national food supply( Reference Krebs-Smith, Reedy and Bosire 1 , Reference Buzby, Wells and Vocke 8 – Reference Miller, Reedy and Kirkpatrick 10 ). Yet, these programmes are also often used for the same purpose: monitoring F&V consumption at the national level( Reference Krebs-Smith, Reedy and Bosire 1 , Reference Buzby, Wells and Vocke 8 , Reference Demydas 11 – Reference Bentley 14 ).
Importantly, there are few quantitative comparisons of F&V intake estimates from WWEIA and LAFA, which limits interpretation of individual studies and makes it difficult to compare across studies( Reference Roark and Niederhauser 15 ). It is crucial to understand the extent to which different dietary assessment programmes produce different estimates of food intake because many countries must rely only on food balance sheet data to make public health decisions. Globally, Del Gobbo et al.( Reference Del Gobbo, Khatibzadeh and Imamura 3 ) found that food balance sheets from the FAO overestimate F&V intake by 74–78 % compared with individual-level data (compiled from self-report and other methods). Pomerleau et al.( Reference Pomerleau, Lock and McKee 16 ) compared F&V intake data from FAO food balance sheets with self-report and found that food balance sheets overestimated F&V intake by 5–270 % depending on the country. FAO food balance sheets are not adjusted for food losses that occur throughout the food system, whereas, in the USA, balance sheet data (from LAFA) are adjusted for these losses and may be more closely aligned with self-reported intake data; yet food loss estimates undergo regular revision and cannot be considered perfect( 5 ).
A decade ago, Hoelzer et al.( Reference Hoelzer, Pouillot and Egan 17 ) examined F&V consumption in the USA by comparing the 2006 LAFA and pooled 1999–2006 WWEIA data sets, and concluded that they yielded similar results for F&V. However, they examined only fresh F&V, whereas canned, frozen and dried forms are also important contributors to the food supply( Reference Comerford 18 ). To date, no studies have compared contemporary trends in F&V consumption between WWEIA and LAFA.
The present study expands and updates the limited literature to examine the comparability of F&V intake data in the USA using data from WWEIA 2001–2014 and LAFA 2001–2014. This was achieved by examining trends in daily per capita intake of total F&V; and by comparing pooled differences in individual F&V by processing form (fresh, frozen, canned, dried and juice).
Methods
Dietary assessment data
WWEIA is a continuous survey that collects food and nutrition data from a nationally representative sample of approximately 5000 individuals annually( 4 ). Participants complete a 24 h recall (24HR) administered by a trained interviewer( Reference Moshfegh, Rhodes and Baer 19 ) and a subset of the study population completes a subsequent 24HR by telephone. Data are published in two-year cycles. WWEIA is administered by the US Department of Agriculture’s Agricultural Research Service, and NHANES is a programme of the US Department of Health and Human Services, Centers for Disease Control and Prevention. Data on fruit, vegetable and legume consumption were retrieved from WWEIA 2001–02, 2003–04, 2005–06, 2007–08, 2009–10, 2011–12 and 2013–14 (n 57 888). Only day 1 intake was used because this represents per capita intake( 20 ). The Food Patterns Equivalents Database (FPED)( 21 ), which is based on data from WWEIA, was used to estimate intake of total F&V. Intake of individual F&V from composite dishes, such as soup with vegetables, was estimated using the Food and Nutrient Database for Dietary Studies (FNDDS)( 22 ). Units of mass were converted to cup-equivalents using the Food Patterns Ingredients Database (FPID)( 23 ), which provides the mass-to-volume conversions for foods included in FNDDS.
In contrast to WWEIA, which measures individual self-reported food consumption, LAFA provides estimates of the annual per capita availability of food, adjusted for losses that occur throughout the food system. These data are best interpreted as proxies for food intake. These data are computed based on the difference between supply (production, imports and end-of-year stocks) and disappearance (exports), and the residual is divided by the US population and adjusted for food losses that occur throughout the food system. LAFA is maintained by the US Department of Agriculture’s Economic Research Service, which collects data from a variety of government agencies as well as non-government sources, and remaining data gaps are addressed by statistical imputation( 24 ).
Data compilation
Data on per capita intake were collected for each processing form (fresh, frozen, canned, dried and juice) of each individual F&V that were included in both WWEIA and LAFA from 2001 to 2014, resulting in sixty-nine individual F&V and 109 F&V processing forms (e.g. fresh apples and frozen apples represent different processing forms of the same F&V; for brevity, hereafter we refer these 109 F&V processing forms as simply ‘F&V’). Because WWEIA provides F&V intake data in two-year waves, annual intake data from LAFA were averaged for each corresponding two-year period to allow for appropriate comparison. Individual F&V were categorized as either a fruit or a vegetable based on the MyPlate classification scheme (legumes were categorized as vegetables)( 25 ) and further categorized by processing form based on how they were reported. Fries and potato chips were classified as other potatoes because ambiguous descriptions in WWEIA for some potato-based dishes prevented accurate discernment of processing form. Although fries and potato chips are nutritionally distinct from many other F&V in their relatively high energy content( Reference Storey and Anderson 26 ), they were categorized as a vegetable for several reasons: they represent the majority of potato consumption, potatoes are among the most commonly consumed vegetables( Reference Nicklas, Liu and Islam 27 ), fries and chips contribute meaningful amounts of key micronutrients to the diets of adults and children( Reference Storey and Anderson 26 , Reference Freedman and Keast 28 , Reference Freedman and Keast 29 ), and excluding fries and chips from this analysis would require excluding other important potato processing forms (due to the lack of data resolution in WWEIA needed for adequate disaggregation of processing forms).
Analysis
F&V intake data were compared between WWEIA and LAFA in two ways: (i) comparing trends in intake of total fruits, total vegetables and total F&V: and (ii) comparing differences in pooled intake of each individual F&V. Linear regression models were used to test for trends and statistical significance was established at P≤0·05. To compare pooled intake for individual F&V, mean intake estimates from LAFA were subtracted from WWEIA. Data management, statistical analyses and complex weighting of WWEIA data were performed using the statistical software package Stata version 14.
Results
Total fruit and vegetable intake trends
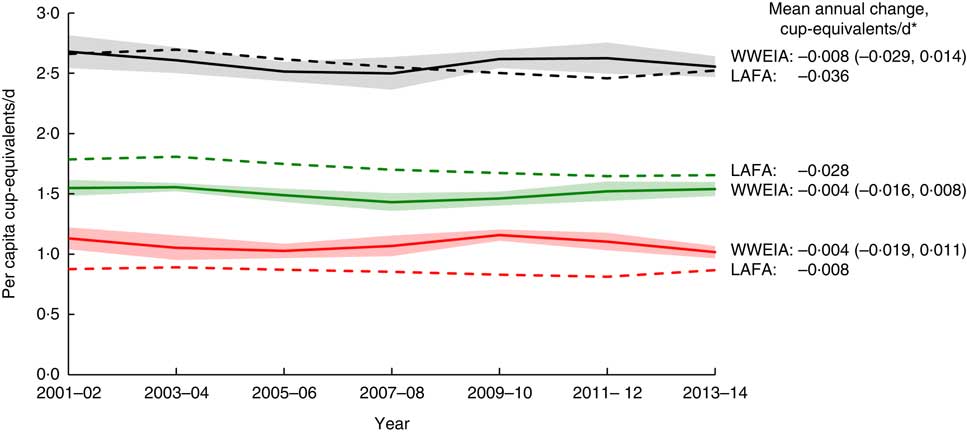
No trends were observed in daily per capita intake of total F&V from 2001 to 2014 using data from WWEIA and LAFA (Fig. 1): the mean annual change was −0·008 (95 % CI −0·029, 0·014) cup-equivalents/d using WWEIA and −0·036 cup-equivalents/d using LAFA. Similarly, no trends were observed in daily per capita intake of total fruits: we observed a mean annual change of −0·004 (95 % CI −0·019, 0·011) cup-equivalents/d using WWEIA and −0·008 cup-equivalents/d using LAFA. For total vegetable intake, the mean annual change was –0·004 (95 % CI −0·016, 0·008) cup-equivalents/d using WWEIA and −0·028 cup-equivalents/d using LAFA. Average (2001–2014) daily per capita intake of total F&V was 2·58 (95 % CI 2·54, 2·63) cup-equivalents/d using WWEIA and 2·57 cup-equivalents/d using LAFA; total fruit intake was 1·08 (95 % CI 1·05, 1·11) cup-equivalents/d using WWEIA and 0·86 cup-equivalents/d using LAFA; and total vegetable intake was 1·51 (95 % CI 1·48, 1·53) cup-equivalents/d using WWEIA and 1·72 cup-equivalents/d using LAFA (data not shown).
Trends in per capita intake of fruits(![]() ), vegetables(
), vegetables(![]() ) and total fruits and vegetables(
) and total fruits and vegetables(![]() )from What We Eat in America (WWEIA) and Loss-Adjusted Food Availability data series (LAFA), 2001–2014. Solid lines represent WWEIA, dashed lines represent LAFA. Shaded bands represent 95 % CI for WWEIA; LAFA does not provide data at the individual level so interindividual variation cannot be estimated. *Values in parentheses represent 95 % CI for WWEIA; LAFA does not provide data at the individual level so interindividual variation cannot be estimated
)from What We Eat in America (WWEIA) and Loss-Adjusted Food Availability data series (LAFA), 2001–2014. Solid lines represent WWEIA, dashed lines represent LAFA. Shaded bands represent 95 % CI for WWEIA; LAFA does not provide data at the individual level so interindividual variation cannot be estimated. *Values in parentheses represent 95 % CI for WWEIA; LAFA does not provide data at the individual level so interindividual variation cannot be estimated
Intake of individual fruits and vegetables
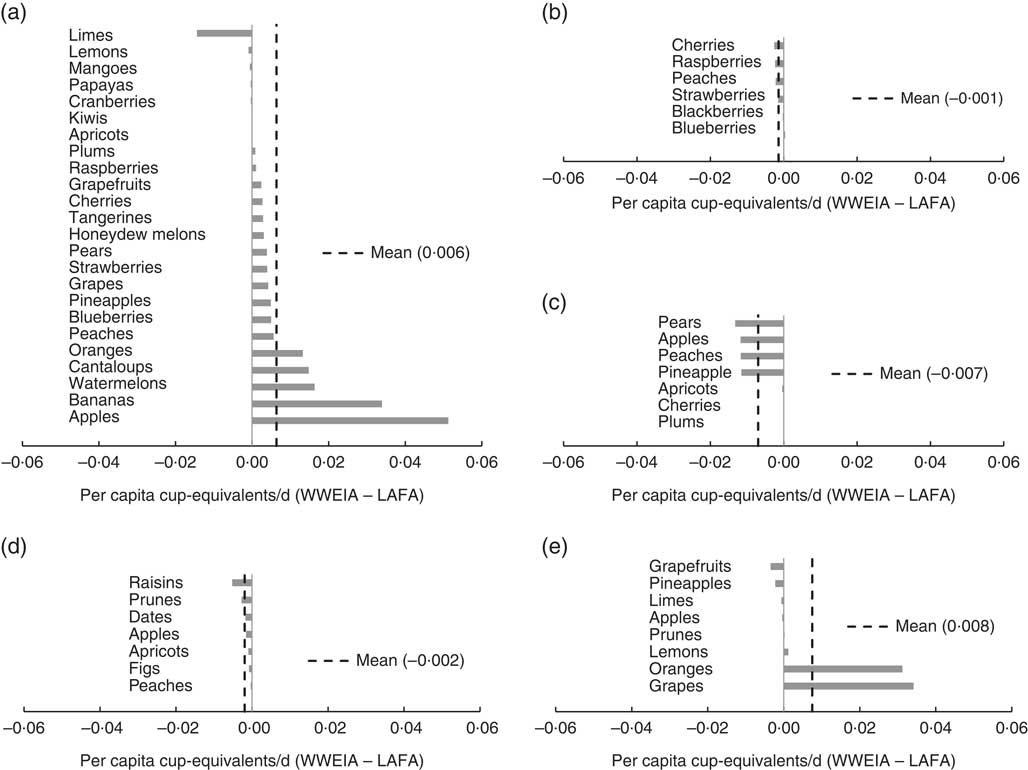
Mean, pooled fresh fruit intake from 2001 to 2014 was 0·006 cup-equivalents/d higher in WWEIA compared with LAFA, with the greatest differences for apples (0·051 cup-equivalents/d) and bananas (0·034 cup-equivalents/d; Fig. 2(a)). Mean intake of frozen fruit was 0·001 cup-equivalents/d lower in WWEIA than LAFA (Fig. 2(b)). For canned fruit, mean intake was 0·007 cup-equivalents/d lower in WWEIA compared with LAFA, with relatively larger differences for pears (0·013 cup-equivalents/d), apples (0·012 cup-equivalents/d), peaches (0·012 cup-equivalents/d) and pineapples (0·012 cup-equivalents/d), and smaller differences for apricots, cherries and plums (<0·001 cup-equivalents/d each; Fig. 2(c)). Mean intake of dried fruit was 0·002 cup-equivalents/d lower in WWEIA than LAFA (Fig. 2(d)). Mean juice intake was 0·008 cup-equivalents/d higher in WWEIA compared with LAFA, and the largest differences were observed for grape juice (0·034 cup-equivalents/d) and orange juice (0·031 cup-equivalents/d; Fig. 2(e)). Absolute amounts are presented in the online supplementary material, Supplemental Table 1.
Difference in daily per capita cup-equivalents of fruits between What We Eat in America (WWEIA) and Loss-Adjusted Food Availability data series (LAFA), 2001–2014, by processing form: (a) fresh; (b) frozen; (c) canned; (d) dried; and (e) juice
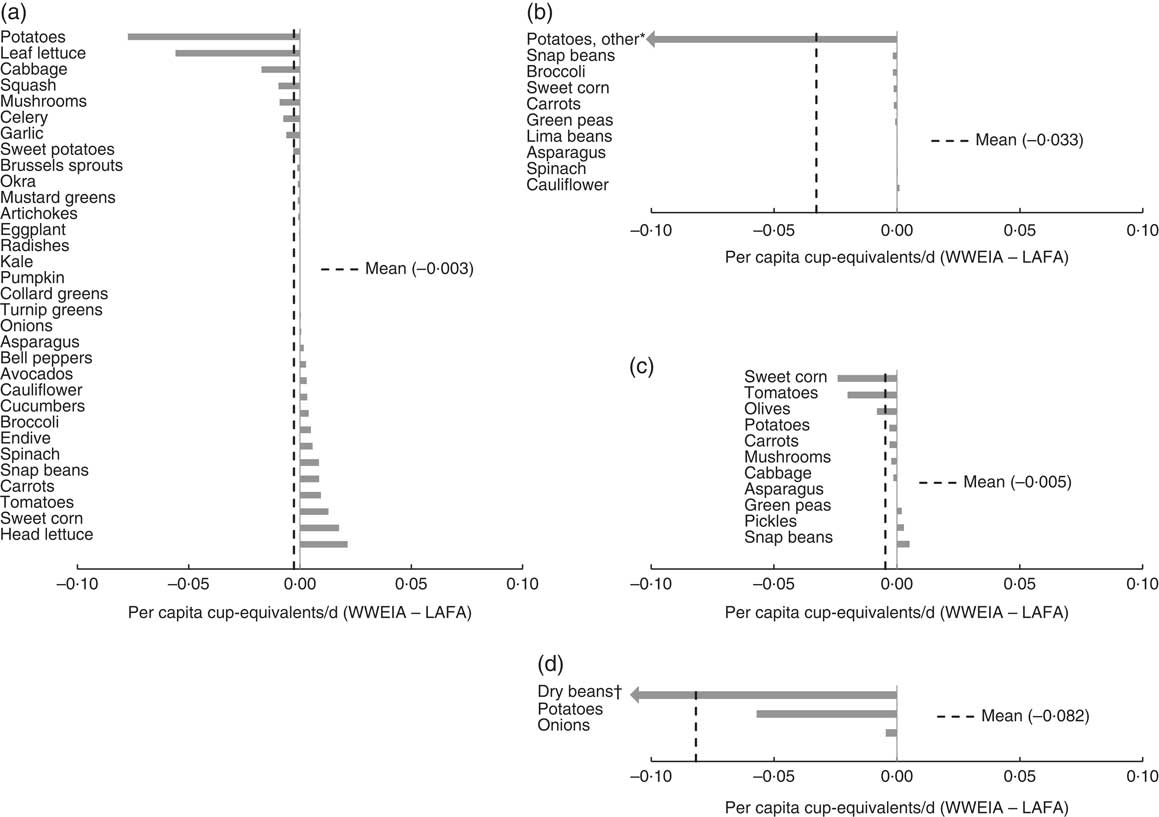
Mean fresh vegetable intake was 0·003 cup-equivalents/d lower in WWEIA compared with LAFA, with potatoes (0·077 cup-equivalents/d) and leaf lettuce (0·056 cup-equivalents/d) representing the greatest differences (Fig. 3(a)). Mean frozen vegetable intake was 0·033 cup-equivalents/d lower in WWEIA compared with LAFA, which was largely attributable to other potatoes (0·289 cup-equivalents/d; Fig. 3(b)). For canned vegetables, mean intake was 0·005 cup-equivalents/d lower in WWEIA than LAFA, with sweet corn (0·024 cup-equivalents/d) and tomatoes (0·020 cup equivalents/d) representing the largest differences (Fig. 3(c)). Mean dried vegetable intake was 0·082 cup-equivalents/d lower in WWEIA than LAFA, with dry beans (0·107 cup-equivalents/d) and potatoes (0·057 cup-equivalents/d) representing the largest differences (Fig. 3(d)). Absolute amounts are presented in the online supplementary material, Supplemental Table 2.
Difference in daily per capita cup-equivalents of vegetables between What We Eat in America (WWEIA) and the Loss-Adjusted Food Availability data series (LAFA), 2001–2014, by processing form: (a) fresh; (b) frozen; (C) canned; and (d) dried. *0·289 cup-equivalents/d; includes French fries and potato chips. †0·107 cup-equivalents/d
Discussion
The present study provides, for the first time, a comparison of US per capita F&V intake data between WWEIA and LAFA over a contemporary 14-year period. Importantly, these data programmes provided the same empirical conclusion: no trends were evident in the intake of total fruit, total vegetables and total F&V. Similarly, Rehm et al.( Reference Rehm, Peñalvo and Afshin 30 ) compared intakes of total fruits and total vegetables between WWEIA 1999–2000 and 2011–12, and reported no difference between these time periods. Likewise, Cassagrande et al.( Reference Casagrande, Wang and Anderson 31 ) found no trend in the percentage of Americans meeting F&V recommendations from 1988 to 2002 using WWEIA. Others( Reference Bentley 14 ) have demonstrated a 10 % increase in fruit availability and a 17 % increase in vegetable availability between 1970 and 2014 using LAFA. We reanalysed these data and observed an annual per capita increase of 0·01 cup-equivalents F&V/d from 1970 to 2014 (15 % increase). These data show increased F&V intake from 1970 to 1990 (14 %), a plateau from 1991 to 2005 (1·5 %) and decreased intake from 2006 to 2014 (−3·5 %).
Our findings are concordant with Hoelzer et al.( Reference Hoelzer, Pouillot and Egan 17 ), who compared estimates of fresh F&V intake between WWEIA 1999–2006 and LAFA 2006, and observed a difference of approximately 0–3 g/d. Ahuja et al.( Reference Ahuja, Juan and Egan 32 ) observed lower nutrient intake estimates using WWEIA 2007–08 compared with the Food Availability data series 2006, but estimates from the Food Availability data series were not adjusted for food losses and were not particular to F&V, so these results are not comparable to the results presented here. The discordant results for other potato intake in the present study are the notable exception, and there are several possible reasons for this discrepancy. Although LAFA represents the best possible estimates of food loss at the national level, these estimates are not perfect and are updated continuously, and it is possible that losses for other potatoes are underestimated and therefore intake is overestimated. Thus, accurate estimation of food loss can be just as important as accurate estimation of supply and disappearance. It is also likely that some dishes in WWEIA do contain other potatoes, but it is not possible to identify them using FNDDS; this would result in underestimating other potato intake using WWEIA. Social desirability bias in surveys, like WWEIA( 33 ), can also not be ruled out as a possible explanation for the lower intake of other potatoes in WWEIA compared with LAFA. Most frozen potatoes are processed into fries( 34 ), which are often associated with unhealthy dietary habits such as fast-food consumption, and some survey participants may not report their actual intake to impress the survey administrators( Reference Roark and Niederhauser 15 , Reference Woodside, Young and McKinley 35 ). In post hoc analyses (data not shown) we observed that excluding other potatoes resulted in improved congruence in total vegetable intake between WWEIA (1·49 cup-equivalents/d) and LAFA (1·41 cup-equivalents/d).
While both data sets seem very similar, we posit that WWEIA is best suited for monitoring F&V intake at the national level because it allows for the amount of most individual F&V (as well as F&V groups) to be discerned from composite foods with multiple ingredients, which allows for a complete accounting of F&V intake from all sources in the diet. WWEIA is also structured for sub-population analysis (due to demographic variables) and covariate control (due to variables related to demographics, health behaviours and many other factors), which can be used to estimate consumption patterns for specific population groups while adjusting for the effects of other variables. The survey design of WWEIA allows for the estimation of interindividual variability, which is needed for statistical agreement tests. LAFA does not collect data on all the individual F&V included in WWEIA, does not collect data on all processing forms of each F&V, and does not allow for sub-population analysis and covariate control. However, LAFA retains advantages for other research protocols by providing the only nationally representative estimates of food losses at various points in the food system, which makes it useful for examining the adequacy of the food supply at the agricultural, retail and consumer levels. Further research should examine differences between WWEIA and LAFA regarding other food groups such as dairy, meat, oils and sweeteners.
Acknowledgements
Acknowledgements: The authors thank Dr Kate Clancy for her helpful comments. Financial support: This work was funded in part by the US Department of Agriculture, Agricultural Research Service (grant number USDA 3062-51000-51-00D). Conflict of interest: None. Authorship: Z.C. conceived and designed the study, and performed statistical analyses. All authors contributed to the interpretation of study results and the writing of the manuscript, and read and approved the final version. Ethics of human subject participation: Not applicable.
Supplementary material
To view supplementary material for this article, please visit https://doi.org/10.1017/S1368980017002385


