





1. Introduction
Shear Alfvén waves (SAWs) are low-frequency, incompressible, magnetohydrodynamic (MHD) oscillations associated with field-line bending (Chen & Zonca Reference Chen and Zonca1995). Given typical values of the phase velocity $v_A = B/\sqrt {\mu _0 \rho }$
; where
$v_A = B/\sqrt {\mu _0 \rho }$
; where $B$
is the magnetic field strength,
$B$
is the magnetic field strength, $\rho$
is the density, and
$\rho$
is the density, and $\mu_0$
is the permeability of free space; SAWs have the potential for resonant interactions with energetic particle (EP) populations in fusion plasmas (Chen & Zonca Reference Chen and Zonca1995). In an inhomogeneous plasma, a so-called continuous spectrum of frequencies exists, consisting of radially singular solutions in the SAW eigenvalue equation. Wave packets excited in the continuum are often strongly damped due to phase mixing; therefore, the most easily excited modes reside in the continuum frequency gaps. For this reason, the calculation of the SAW continuum is often the first step in predicting the discrete frequency spectrum and stability of EP-driven Alfvén eigenmodes (AEs). These gaps exist because counter-propagating SAW waves are coupled through the poloidal and toroidal variation of the magnetic geometry, analogous to the existence of electron band gaps due to periodic modulations of the potential (Heidbrink Reference Heidbrink2008).
$\mu_0$
is the permeability of free space; SAWs have the potential for resonant interactions with energetic particle (EP) populations in fusion plasmas (Chen & Zonca Reference Chen and Zonca1995). In an inhomogeneous plasma, a so-called continuous spectrum of frequencies exists, consisting of radially singular solutions in the SAW eigenvalue equation. Wave packets excited in the continuum are often strongly damped due to phase mixing; therefore, the most easily excited modes reside in the continuum frequency gaps. For this reason, the calculation of the SAW continuum is often the first step in predicting the discrete frequency spectrum and stability of EP-driven Alfvén eigenmodes (AEs). These gaps exist because counter-propagating SAW waves are coupled through the poloidal and toroidal variation of the magnetic geometry, analogous to the existence of electron band gaps due to periodic modulations of the potential (Heidbrink Reference Heidbrink2008).
In axisymmetric geometry, the toroidal Alfvén eigenmode (TAE) and the ellipticity-induced Alfvén eigenmode (EAE) exist because of $m = 1$
and
$m = 1$
and $m =2$
dependences of the magnetic geometry, respectively, where
$m =2$
dependences of the magnetic geometry, respectively, where $m$
is the poloidal mode number. These modes are widely observed in both tokamak and stellarator experiments (Van Zeeland et al. Reference Van Zeeland, Kramer, Austin, Boivin, Heidbrink, Makowski, McKee, Nazikian, Solomon and Wang2006; Toi et al. Reference Toi, Ogawa, Isobe, Osakabe, Spong and Todo2011; Gorelenkov, Pinches & Toi Reference Gorelenkov, Pinches and Toi2014). In three-dimensional (3-D) systems, additional gaps arise due to the dependence of the geometry on the toroidal angle, giving rise to the helical Alfvén eigenmode (HAE) – corresponding to
$m$
is the poloidal mode number. These modes are widely observed in both tokamak and stellarator experiments (Van Zeeland et al. Reference Van Zeeland, Kramer, Austin, Boivin, Heidbrink, Makowski, McKee, Nazikian, Solomon and Wang2006; Toi et al. Reference Toi, Ogawa, Isobe, Osakabe, Spong and Todo2011; Gorelenkov, Pinches & Toi Reference Gorelenkov, Pinches and Toi2014). In three-dimensional (3-D) systems, additional gaps arise due to the dependence of the geometry on the toroidal angle, giving rise to the helical Alfvén eigenmode (HAE) – corresponding to $m \ne 0$
and
$m \ne 0$
and $n \ne 0$
– and the mirror Alfvén eigenmode (MAE) – corresponding to
$n \ne 0$
– and the mirror Alfvén eigenmode (MAE) – corresponding to $n \ne 0$
and
$n \ne 0$
and $m = 0$
(Kolesnichenko et al. Reference Kolesnichenko, Lutsenko, Wobig, Yakovenko and Fesenyuk2001; Spong, Sanchez & Weller Reference Spong, Sanchez and Weller2003), where
$m = 0$
(Kolesnichenko et al. Reference Kolesnichenko, Lutsenko, Wobig, Yakovenko and Fesenyuk2001; Spong, Sanchez & Weller Reference Spong, Sanchez and Weller2003), where $n$
is the toroidal mode number.
$n$
is the toroidal mode number.
Stellarators can be designed to be quasisymmetric, with a Noether symmetry of the guiding center Lagrangian implying excellent neoclassical confinement (Boozer Reference Boozer1983; Nührenberg & Zille Reference Nührenberg and Zille1988; Landreman & Paul Reference Landreman and Paul2022). However, the flux-surface shaping does not inherit the same symmetry as the field strength. Therefore, even if the level of quasisymmetry is very precise, the gap structure of a quasisymmetric stellarator can differ substantially from that of a tokamak. Furthermore, 3-D geometry yields distinct features of continuum eigenfunctions, leading to modes that can become localized within the magnetic surface (Yakovenko et al. Reference Yakovenko, Weller, Werner, Zegenhagen, Fesenyuk and Kolesnichenko2007) or the formation of gaps that overlap and interact with one another (Kolesnichenko et al. Reference Kolesnichenko, Könies, Lutsenko and Yakovenko2011).
Energetic particles have historically been challenging to confine in stellarator configurations due to the possibility of unconfined orbits and resonances exposed at low collisionality (Kolesnichenko et al. Reference Grieger1992; Redi et al. Reference Redi, Mynick, Suewattana, White and Zarnstorff1999). These difficulties must be overcome to develop a stellarator reactor concept, as excessive alpha losses before thermalization can impact power balance and impart damage to plasma-facing components. When 3-D fields are introduced, such as in a stellarator or rippled tokamak, the collisionless guiding center orbits are no longer automatically well confined. This leads to increased collisionless losses – due to ripple trapping, collisionless diffusion and drift-convective orbits (Beidler et al. Reference Beidler, Kolesnichenko, Marchenko, Sidorenko and Wobig2001b ; Mynick Reference Mynick2006; Paul et al. Reference Paul, Bhattacharjee, Landreman, Alex, Velasco and Nies2022) – and weakly collisional transport is generally enhanced. If a stellarator magnetic field is sufficiently close to quasisymmetry, the conservation of the corresponding canonical momentum (Rodriguez, Helander & Bhattacharjee Reference Rodriguez, Helander and Bhattacharjee2020) provides guiding center confinement if the orbit width is sufficiently small. Recent optimization studies have revealed stellarator configurations with precise levels of quasisymmetry, yielding confinement of alpha particle trajectories of similar levels to that in tokamaks (Landreman, Buller & Drevlak Reference Landreman, Buller and Drevlak2022; Landreman & Paul Reference Landreman and Paul2022; Nies et al. Reference Nies, Paul, Panici, Hudson and Bhattacharjee2024). With the possibility that guiding center orbits can be confined, there is, however, the potential for enhanced alpha losses due to interactions with SAWs. While interaction between EPs and other MHD modes, e.g. kink and sawtooth, is possible, Alfvénic activity is considered the major limitation to alpha confinement in burning toroidal plasma (Gorelenkov et al. Reference Gorelenkov, Pinches and Toi2014).
While the SAW continuum has been calculated numerically for several quasisymmetric equilibria (Spong et al. Reference Spong, Sanchez and Weller2003; Fesenyuk et al. Reference Fesenyuk, Kolesnichenko, Lutsenko, White and Yakovenko2004; Varela et al. Reference Varela, Shimizu, Spong, Garcia and Ghai2021), the goal of this work is to study the underlying features of the shear Alfvén continuum in quasisymmetric configurations. With an improved understanding of the continuum, we hope to better assess the potential impact of AE instabilities in quasisymmetric devices and account for AE stability in the stellarator design process.
In § 2 we outline the SAW model in 3-D magnetic fields. A near-axis model magnetic field (Garren & Boozer Reference Garren and Boozer1991; Landreman, Sengupta & Plunk Reference Landreman, Sengupta and Plunk2019), discussed in § 3, is applied to elucidate the impact of quasisymmetry on the flux-surface shaping, and therefore the continuum structure. Given the common physics basis between the shear Alfvén continuum and the formation of band gaps, degenerate perturbation theory is used to solve the continuum equation in § 4. We highlight key features of stellarator continuum solutions, such as higher-order crossings and the possibility of co-propagating modes which appear to cross spectral gaps. Numerical examples are shown in § 5 to validate the theory. In § 6, we discuss the impact of the SAW gap location on the passing EP resonance condition. Finally, in § 7 we demonstrate an optimization strategy to manipulate the SAW continuum to avoid passing EP resonances.
2. Shear Alfvén continuum in 3-D geometry
An equation describing SAWs is obtained under the assumption of $\beta \ll 1$
and the reduced MHD ordering
$\beta \ll 1$
and the reduced MHD ordering $\epsilon = k_{\|}/k_{\perp } \sim 1/(k_{\perp } a) \ll 1$
(Salat & Tataronis Reference Salat and Tataronis2001a
; Fesenyuk et al. Reference Fesenyuk, Kolesnichenko, Wobig and Yakovenko2002). Here,
$\epsilon = k_{\|}/k_{\perp } \sim 1/(k_{\perp } a) \ll 1$
(Salat & Tataronis Reference Salat and Tataronis2001a
; Fesenyuk et al. Reference Fesenyuk, Kolesnichenko, Wobig and Yakovenko2002). Here, $k_{\|} \sim \boldsymbol{\nabla} _{\|} = \hat {\boldsymbol{b}} \boldsymbol{\cdot} \boldsymbol{\nabla}$
and
$k_{\|} \sim \boldsymbol{\nabla} _{\|} = \hat {\boldsymbol{b}} \boldsymbol{\cdot} \boldsymbol{\nabla}$
and $k_{\perp } \sim \boldsymbol{\nabla} _{\perp } = \boldsymbol{\nabla} - \hat {\boldsymbol{b}} \boldsymbol{\nabla} _{\|}$
represent typical wavenumbers of perturbed quantities parallel and perpendicular to the equilibrium magnetic field, and
$k_{\perp } \sim \boldsymbol{\nabla} _{\perp } = \boldsymbol{\nabla} - \hat {\boldsymbol{b}} \boldsymbol{\nabla} _{\|}$
represent typical wavenumbers of perturbed quantities parallel and perpendicular to the equilibrium magnetic field, and $\beta = p/(B^2/2\mu _0)$
is the ratio of the thermal pressure to the magnetic pressure. The linearized quasineutrality condition yields a partial differential equation (PDE) for the perturbed electrostatic potential
$\beta = p/(B^2/2\mu _0)$
is the ratio of the thermal pressure to the magnetic pressure. The linearized quasineutrality condition yields a partial differential equation (PDE) for the perturbed electrostatic potential $\varPhi$
 \begin{align} B \boldsymbol{\nabla} _{\|} \left (\frac { \boldsymbol{\nabla} _{\perp }^2 \left (\boldsymbol{\nabla} _{\|} \varPhi \right )}{B} \right ) + \frac {\omega ^2}{v_A^2} \boldsymbol{\nabla} _{\perp }^2 \varPhi = 0, \end{align}
where $v_A^2 = B^2/(\mu _0 \rho )$
is the Alfvén velocity,
$v_A^2 = B^2/(\mu _0 \rho )$
is the Alfvén velocity, $\rho$
is the mass density and
$\rho$
is the mass density and $\omega$
is the frequency. Note that we have neglected the coupling to sound waves, which has been shown to modify low-frequency gaps in stellarators (Könies & Eremin, Reference Könies and Eremin2010). This is justified, since we will focus on high-frequency gaps for the following analysis.
$\omega$
is the frequency. Note that we have neglected the coupling to sound waves, which has been shown to modify low-frequency gaps in stellarators (Könies & Eremin, Reference Könies and Eremin2010). This is justified, since we will focus on high-frequency gaps for the following analysis.
The shear Alfvén equation has a continuous spectrum, corresponding to a set of frequencies for which the corresponding eigenfunctions are radially singular. The continuum solutions correspond to a localization of the eigenfunction on a corresponding singular surface. The shear Alfvén continuum equation is obtained from the terms in (2.1) with the highest-order radial derivative (Salat & Tataronis Reference Salat and Tataronis2001b )
 \begin{align} B \boldsymbol{\nabla} _{\|} \left (\frac {|\boldsymbol{\nabla} \psi |^2}{B} \boldsymbol{\nabla} _{\|} \varPhi \right ) + \frac {\omega ^2|\boldsymbol{\nabla} \psi |^2}{v_A^2} \varPhi = 0. \end{align}
Solutions to (2.2) can be interpreted as solutions to (2.1) with delta-function-like radial variation. To analyze the formation of continuum gaps, we write the continuum equation in Boozer coordinates (Boozer Reference Boozer1981) $(\psi ,\theta ,\zeta )$
, where
$(\psi ,\theta ,\zeta )$
, where $2\pi \psi$
is the toroidal flux and
$2\pi \psi$
is the toroidal flux and $\theta$
and
$\theta$
and $\zeta$
are the poloidal and toroidal angle, respectively, and adopt appropriate normalizations
$\zeta$
are the poloidal and toroidal angle, respectively, and adopt appropriate normalizations
 \begin{align} \left (\frac {\partial }{\partial \zeta } + \iota \frac {\partial }{\partial \theta } \right ) \left [\frac {|\boldsymbol{\nabla} \psi |^2}{\langle |\boldsymbol{\nabla} \psi |^2 \rangle } \left (\frac {\partial }{\partial \zeta } + \iota \frac {\partial }{\partial \theta } \right ) \varPhi \right ] + \frac {\omega ^2}{\omega _A^2}\frac {|\boldsymbol{\nabla} \psi |^2/B^4}{\langle |\boldsymbol{\nabla} \psi |^2 \rangle /\langle B^4\rangle } \varPhi = 0. \end{align}
We have defined the effective Alfvén frequency as $\omega _A = \langle B\rangle ^2/(G+\iota I)\sqrt {\mu _0 \rho })$
, where
$\omega _A = \langle B\rangle ^2/(G+\iota I)\sqrt {\mu _0 \rho })$
, where $\langle \ldots \rangle = (4\pi ^2)^{-1}\int _0^{2\pi } \int _0^{2\pi } \textrm{d}\zeta \textrm{d} \theta \ldots$
indicates an angle average of a geometric quantity. Here,
$\langle \ldots \rangle = (4\pi ^2)^{-1}\int _0^{2\pi } \int _0^{2\pi } \textrm{d}\zeta \textrm{d} \theta \ldots$
indicates an angle average of a geometric quantity. Here, $G$
and
$G$
and $I$
are the toroidal and poloidal covariant components of the magnetic field, defined through
$I$
are the toroidal and poloidal covariant components of the magnetic field, defined through
 \begin{align} \boldsymbol{B} = G(\psi ) \boldsymbol{\nabla} \zeta + I(\psi ) \boldsymbol{\nabla} \theta + K(\psi ,\theta ,\zeta )\boldsymbol{\nabla} \psi . \end{align}
The perturbed potential can be expressed as a Fourier series in Boozer angles
 \begin{align} \varPhi = \sum _{m,n} \varPhi _{m,n} e^{i(m\theta - n \zeta + \omega t)}. \end{align}
As seen in (2.3), the equilibrium quantities appearing in the continuum equation, $|\boldsymbol{\nabla} \psi |^2$
and
$|\boldsymbol{\nabla} \psi |^2$
and $|\boldsymbol{\nabla} \psi |^2/B^4$
, provide coupling between mode numbers of the potential. In a 2-D magnetic field, the toroidal harmonics
$|\boldsymbol{\nabla} \psi |^2/B^4$
, provide coupling between mode numbers of the potential. In a 2-D magnetic field, the toroidal harmonics $n$
are decoupled. Similarly, in a 3-D field with field-period symmetry (all equilibrium quantities only depend on the toroidal angle through
$n$
are decoupled. Similarly, in a 3-D field with field-period symmetry (all equilibrium quantities only depend on the toroidal angle through $N_P\zeta$
where
$N_P\zeta$
where $N_P$
is the number of field periods), toroidal coupling is isolated to mode families, the sets of mode numbers
$N_P$
is the number of field periods), toroidal coupling is isolated to mode families, the sets of mode numbers $n$
separated by integer multiples of
$n$
separated by integer multiples of $N_P$
. We will focus on the solutions of (2.3) in a quasisymmetric (QS) field, for which the magnetic field strength only varies on a magnetic surface through the angle
$N_P$
. We will focus on the solutions of (2.3) in a quasisymmetric (QS) field, for which the magnetic field strength only varies on a magnetic surface through the angle $\chi = \theta - N \zeta$
, where
$\chi = \theta - N \zeta$
, where $N$
is the symmetry helicity (
$N$
is the symmetry helicity ( $N = 0$
for quasiaxisymmetry (QA) and
$N = 0$
for quasiaxisymmetry (QA) and $N = \pm N_P$
for quasihelical symmetry (QH)). We note that, even if the magnetic field strength is QS, implying that
$N = \pm N_P$
for quasihelical symmetry (QH)). We note that, even if the magnetic field strength is QS, implying that $B(\psi ,\chi )$
, the other geometric quantities, such as
$B(\psi ,\chi )$
, the other geometric quantities, such as $|\boldsymbol{\nabla} \psi |^2$
, do not necessarily respect the same symmetry. Thus the continuous spectrum in QS stellarators will generally differ dramatically from that of axisymmetric devices. This will be shown explicitly in the following section, using a near-axis model field.
$|\boldsymbol{\nabla} \psi |^2$
, do not necessarily respect the same symmetry. Thus the continuous spectrum in QS stellarators will generally differ dramatically from that of axisymmetric devices. This will be shown explicitly in the following section, using a near-axis model field.
3. Near-axis quasisymmetry model
Further analysis of the continuum equation (2.3) requires a model for the geometric factors appearing, namely $|\boldsymbol{\nabla} \psi |^2$
and
$|\boldsymbol{\nabla} \psi |^2$
and $B$
. We will adopt the near-axis QS magnetic field description (Garren & Boozer Reference Garren and Boozer1991; Landreman et al. Reference Landreman, Sengupta and Plunk2019), an asymptotic expansion in the distance from the magnetic axis
$B$
. We will adopt the near-axis QS magnetic field description (Garren & Boozer Reference Garren and Boozer1991; Landreman et al. Reference Landreman, Sengupta and Plunk2019), an asymptotic expansion in the distance from the magnetic axis $r = \sqrt {2\psi /B_0}$
, where
$r = \sqrt {2\psi /B_0}$
, where $B_0$
is the field strength on the magnetic axis. Although such a description is limited to some region near the axis (not necessarily small), it has been shown to capture the nature of such fields, and is thus highly insightful (Landreman Reference Landreman2019, Reference Landreman2022; Rodríguez et al. Reference Rodríguez, Sengupta and Bhattacharjee2023a
). Furthermore, since the birth rate of alpha particles will be peaked in the core, this model is appropriate for QS reactors. In such a model, the magnetic field strength, covariant components of the magnetic field and rotational transform read
$B_0$
is the field strength on the magnetic axis. Although such a description is limited to some region near the axis (not necessarily small), it has been shown to capture the nature of such fields, and is thus highly insightful (Landreman Reference Landreman2019, Reference Landreman2022; Rodríguez et al. Reference Rodríguez, Sengupta and Bhattacharjee2023a
). Furthermore, since the birth rate of alpha particles will be peaked in the core, this model is appropriate for QS reactors. In such a model, the magnetic field strength, covariant components of the magnetic field and rotational transform read
 \begin{align} \left \{ \begin{array}{c} B = B_0(1 - r \overline {\eta } \cos (\chi ) ) + \mathcal{O}(r^2) ,\\[3pt] G = G_0 + \mathcal{O}(r^2), \\[3pt] I = r^2I_2 + \mathcal{O}(r^4) ,\\[3pt] \iota = \iota _0 + \mathcal{O}(r^2) ,\end{array} \right . \end{align}
where $\overline {\eta }$
,
$\overline {\eta }$
, $G_0$
and
$G_0$
and $\iota _0$
are constants that define the magnetic field in Boozer coordinates through the above expressions. Furthermore, the geometric factor appearing in the continuum equation (2.3) reads (Jorge & Landreman Reference Jorge and Landreman2020)
$\iota _0$
are constants that define the magnetic field in Boozer coordinates through the above expressions. Furthermore, the geometric factor appearing in the continuum equation (2.3) reads (Jorge & Landreman Reference Jorge and Landreman2020)
 \begin{align} |\boldsymbol{\nabla} \psi |^2 = r^2 \Psi _2 + r^3 \Psi _3 + \mathcal{O}(r^4), \end{align}
with
 \begin{align} \Psi _2 &= \frac {B_0^2}{2\overline {\kappa }^2} [1+\overline {\kappa }^4(1+\sigma ^2) + \cos (2\chi ) (-1 + \overline {\kappa }^4(1 - \sigma ^2) ) + \sin (2\chi )(-2 \sigma \overline {\kappa }^4) ] ,\end{align}
and $\Psi _3$
provided in Appendix C. Here,
$\Psi _3$
provided in Appendix C. Here, $\overline {\kappa }(\zeta ) = \kappa (\zeta )/\overline {\eta }$
is the normalized magnetic axis curvature and
$\overline {\kappa }(\zeta ) = \kappa (\zeta )/\overline {\eta }$
is the normalized magnetic axis curvature and $\sigma (\zeta )$
satisfies the ordinary differential equation (ODE)
$\sigma (\zeta )$
satisfies the ordinary differential equation (ODE)
 \begin{align} 0 &= \sigma ' + (\iota _0-N) \left (\frac {1}{\overline {\kappa }^4} + 1 + \sigma ^2 \right ) + 2 \left (\tau - \frac {I_2}{B_0}\right ) \frac {G_0}{B_0 \overline {\kappa }^2}, \end{align}
where $\tau (\zeta )$
is the magnetic axis torsion and the prime denotes
$\tau (\zeta )$
is the magnetic axis torsion and the prime denotes $d/d\zeta$
. The function
$d/d\zeta$
. The function $\sigma (\zeta )$
controls the flux-surface ellipticity and rotation, as will be described in more detail below.
$\sigma (\zeta )$
controls the flux-surface ellipticity and rotation, as will be described in more detail below.
In summary, with the parameters $\overline {\eta }$
,
$\overline {\eta }$
, $B_0$
,
$B_0$
, $G_0$
and
$G_0$
and $I_2$
prescribed along with the shape of the magnetic axis (which determines
$I_2$
prescribed along with the shape of the magnetic axis (which determines $N$
(Rodríguez et al. Reference Rodríguez, Sengupta and Bhattacharjee2023)), the ODE (3.4) with appropriate boundary conditions (Landreman & Sengupta Reference Landreman and Sengupta2018) determines the function
$N$
(Rodríguez et al. Reference Rodríguez, Sengupta and Bhattacharjee2023)), the ODE (3.4) with appropriate boundary conditions (Landreman & Sengupta Reference Landreman and Sengupta2018) determines the function $\sigma (\zeta )$
as well as the on-axis rotational transform
$\sigma (\zeta )$
as well as the on-axis rotational transform $\iota$
. With these quantities, all geometric information needed for solving the near-axis continuum equation is available. Under the near-axis assumptions, the continuum equation to lowest order in
$\iota$
. With these quantities, all geometric information needed for solving the near-axis continuum equation is available. Under the near-axis assumptions, the continuum equation to lowest order in $r$
reads
$r$
reads
 \begin{align} \frac {1}{\Psi _2}\left (\frac {\partial }{\partial \zeta } + \iota _0 \frac {\partial }{\partial \theta } \right ) \left [\Psi _2 \left (\frac {\partial }{\partial \zeta } + \iota _0 \frac {\partial }{\partial \theta } \right ) \varPhi \right ] + \overline {\omega }^2 \varPhi = 0. \end{align}
Here, we define the effective Alfvén frequency as $\omega _A = B_0^2/(G_0\sqrt {\mu _0 \rho })$
and the normalized frequency
$\omega _A = B_0^2/(G_0\sqrt {\mu _0 \rho })$
and the normalized frequency $\overline {\omega } = \omega /\omega _A$
. (Note that the geometric factor
$\overline {\omega } = \omega /\omega _A$
. (Note that the geometric factor $G_0/B_0$
defines an effective major radius through
$G_0/B_0$
defines an effective major radius through $R_0^{-1} = |\boldsymbol{\nabla} \zeta | = B_0/G_0$
, using the lowest-order covariant expression for the magnetic field.) We employ a perturbative approach to solving (3.5) for the small parameter
$R_0^{-1} = |\boldsymbol{\nabla} \zeta | = B_0/G_0$
, using the lowest-order covariant expression for the magnetic field.) We employ a perturbative approach to solving (3.5) for the small parameter $\epsilon$
quantifying the geometric coupling
$\epsilon$
quantifying the geometric coupling
 \begin{align} \epsilon = \frac {\Psi _2}{\langle \Psi _2\rangle } -1, \end{align}
such that the continuum equation reads
 \begin{align} \frac {1}{(1 + \epsilon )}\left (\frac {\partial }{\partial \zeta } + \iota _0 \frac {\partial }{\partial \theta } \right ) \left [(1 + \epsilon ) \left (\frac {\partial }{\partial \zeta } + \iota _0 \frac {\partial }{\partial \theta } \right ) \varPhi \right ] + \overline {\omega }^2 \varPhi = 0. \end{align}
Representing $\varPhi$
as a Fourier series (2.5), (3.7) implies that coupling between mode numbers
$\varPhi$
as a Fourier series (2.5), (3.7) implies that coupling between mode numbers $(m,n)$
of the potential will be provided by the variation of
$(m,n)$
of the potential will be provided by the variation of $\epsilon$
on a magnetic surface. We express
$\epsilon$
on a magnetic surface. We express $\epsilon$
as a Fourier series in the Boozer angles
$\epsilon$
as a Fourier series in the Boozer angles
 \begin{align} \epsilon = \sum _{\delta m,\delta n} \epsilon _{\delta m,\delta n} e^{i(\delta m \theta - \delta n N_P\zeta )} = \sum _{\delta \overline {m},\delta n} \epsilon _{\delta \overline {m},\delta n} e^{i(\delta \overline {m} \chi - \delta n N_P\zeta )}, \end{align}
where $\delta m=\delta n=0$
terms are excluded according to the definition (3.6) and we have assumed field-period symmetry. Here, we use the notation
$\delta m=\delta n=0$
terms are excluded according to the definition (3.6) and we have assumed field-period symmetry. Here, we use the notation $\delta m$
and
$\delta m$
and $\delta n$
to distinguish the equilibrium mode numbers from the mode numbers of the perturbed potential defined by (2.3). Furthermore, this notation emphasizes that the equilibrium geometry will provide coupling between potential mode numbers
$\delta n$
to distinguish the equilibrium mode numbers from the mode numbers of the perturbed potential defined by (2.3). Furthermore, this notation emphasizes that the equilibrium geometry will provide coupling between potential mode numbers $(m,n)$
and
$(m,n)$
and $(m+\delta m,n+\delta n)$
. Since
$(m+\delta m,n+\delta n)$
. Since $\theta$
only enters through the angle
$\theta$
only enters through the angle $\chi$
in (3.3), it will sometimes be convenient to represent
$\chi$
in (3.3), it will sometimes be convenient to represent $\epsilon$
as a Fourier series in
$\epsilon$
as a Fourier series in $(\chi ,\zeta )$
as indicated in the above expression. When expressing
$(\chi ,\zeta )$
as indicated in the above expression. When expressing $\epsilon$
as a Fourier series with respect to
$\epsilon$
as a Fourier series with respect to $\chi$
, the distinction
$\chi$
, the distinction $\delta \overline {m}$
will be made apparent. We see from the near-axis expression (3.6) that, to leading order, only amplitudes
$\delta \overline {m}$
will be made apparent. We see from the near-axis expression (3.6) that, to leading order, only amplitudes $\epsilon _{\delta m,\delta n}$
with
$\epsilon _{\delta m,\delta n}$
with $\delta m = \pm 2$
or
$\delta m = \pm 2$
or $\delta m = 0$
will be non-zero.
$\delta m = 0$
will be non-zero.
3.1. Rotating ellipse interpretation
To gain further insight into the impact of shaping on the spectral content of $\epsilon$
, we can relate averages of
$\epsilon$
, we can relate averages of $\Psi _2$
to properties of the near-axis surfaces, which form ellipses in the plane perpendicular to the axis. Denoting the semi-major axis by
$\Psi _2$
to properties of the near-axis surfaces, which form ellipses in the plane perpendicular to the axis. Denoting the semi-major axis by $a$
and the semi-minor axis as
$a$
and the semi-minor axis as $b$
, the quantity
$b$
, the quantity $p = a^2 + b^2 = (1 + \overline {\kappa }^4(1 + \sigma ^2))/\overline {\kappa }^2$
controls the elongation
$p = a^2 + b^2 = (1 + \overline {\kappa }^4(1 + \sigma ^2))/\overline {\kappa }^2$
controls the elongation $\mathcal{E} = a/b$
through the expression
$\mathcal{E} = a/b$
through the expression
 \begin{align} \mathcal{E} = \frac {p + \sqrt {p^2 - 4}}{2}. \end{align}
Defining a coordinate system oriented with the ellipse axes, $x = a \cos \vartheta$
and
$x = a \cos \vartheta$
and $y = b \sin \vartheta$
for an ellipse parametrization angle
$y = b \sin \vartheta$
for an ellipse parametrization angle $\vartheta$
, the quantity
$\vartheta$
, the quantity $\Psi _2$
takes a particularly simple form
$\Psi _2$
takes a particularly simple form
 \begin{align} \Psi _2 = B_0^2\frac {p - \sqrt {p^2 - 4} \cos (2\vartheta )}{2}. \end{align}
We note that the flux surfaces become compressed around $\vartheta = \pi /2$
,
$\vartheta = \pi /2$
, $3\pi /2$
, corresponding to the semi-minor axis of the ellipse. Overall, the in-surface variation of the flux-surface compression increases with increasing elongation.
$3\pi /2$
, corresponding to the semi-minor axis of the ellipse. Overall, the in-surface variation of the flux-surface compression increases with increasing elongation.
To more precisely evaluate the harmonic content of $\Psi _2$
, we must express the ellipse parametrization angle
$\Psi _2$
, we must express the ellipse parametrization angle $\vartheta$
in terms of Boozer angles. It is the typical case with optimized QS stellarators for their elliptical flux surfaces to make one half-rotation with respect to the normal vector in one field period. While a solid theoretical justification for this feature is lacking (and would merit further exploration), there exists strong evidence for the persistence of this feature, as can be checked by analyzing standard QS designs like those in this paper, or more thoroughly, looking through the large database of near-axis configurations of Landreman (Reference Landreman2022).Footnote
1
The direction of ellipse rotation (positive being counter-clockwise) will match the sign of
$\vartheta$
in terms of Boozer angles. It is the typical case with optimized QS stellarators for their elliptical flux surfaces to make one half-rotation with respect to the normal vector in one field period. While a solid theoretical justification for this feature is lacking (and would merit further exploration), there exists strong evidence for the persistence of this feature, as can be checked by analyzing standard QS designs like those in this paper, or more thoroughly, looking through the large database of near-axis configurations of Landreman (Reference Landreman2022).Footnote
1
The direction of ellipse rotation (positive being counter-clockwise) will match the sign of $(\iota _0-N)$
, being oppositely oriented for QA and QH configurations. (This can, for example, be seen from the Mercier formula, (67) in Jorge, Sengupta & Landreman Reference Jorge, Sengupta and Landreman2020a
). For QH configurations, the normal vector makes one net rotation in the poloidal plane per field period, which counteracts the direction of ellipse rotation. On the other hand, for QA configurations, the normal vector does not make any net rotations. Therefore, for both QA and QH configurations, the elliptical surfaces make one half-rotation in the poloidal plane per field period. Given this half-rotation of the ellipse with respect to the normal vector per field period, isocurves of constant
$(\iota _0-N)$
, being oppositely oriented for QA and QH configurations. (This can, for example, be seen from the Mercier formula, (67) in Jorge, Sengupta & Landreman Reference Jorge, Sengupta and Landreman2020a
). For QH configurations, the normal vector makes one net rotation in the poloidal plane per field period, which counteracts the direction of ellipse rotation. On the other hand, for QA configurations, the normal vector does not make any net rotations. Therefore, for both QA and QH configurations, the elliptical surfaces make one half-rotation in the poloidal plane per field period. Given this half-rotation of the ellipse with respect to the normal vector per field period, isocurves of constant $\vartheta$
will be helical when expressed in Boozer angles. We will assume that the sign of the toroidal angle is chosen so that the ellipse rotates in the positive direction in the poloidal plane, such that when expressed in terms of Boozer coordinates,
$\vartheta$
will be helical when expressed in Boozer angles. We will assume that the sign of the toroidal angle is chosen so that the ellipse rotates in the positive direction in the poloidal plane, such that when expressed in terms of Boozer coordinates, $\theta - N_P \zeta$
.
$\theta - N_P \zeta$
.
Given (3.10), we therefore expect a strong helical $\delta m = 2$
,
$\delta m = 2$
, $\delta n=1$
component of
$\delta n=1$
component of $\epsilon$
, driven by rotating ellipticity. Additional toroidal coupling will be introduced due to the variation of the ellipticity parameter
$\epsilon$
, driven by rotating ellipticity. Additional toroidal coupling will be introduced due to the variation of the ellipticity parameter $p$
and rotation of the ellipse parametrization angle with respect to the Boozer angles,
$p$
and rotation of the ellipse parametrization angle with respect to the Boozer angles, $\omega$
(which depends on
$\omega$
(which depends on $p$
and
$p$
and $\overline {\kappa }$
). This could not only contribute to
$\overline {\kappa }$
). This could not only contribute to $(\delta m,\delta n) = (2,1)$
, but also lead to the appearance of further couplings. These features are discussed further in Appendix A.
$(\delta m,\delta n) = (2,1)$
, but also lead to the appearance of further couplings. These features are discussed further in Appendix A.
3.2. Boozer coordinate interpretation
The spectral content of $\epsilon$
can now be explicitly evaluated through averages of (3.3), and can be expressed in terms of
$\epsilon$
can now be explicitly evaluated through averages of (3.3), and can be expressed in terms of $\zeta$
averages,
$\zeta$
averages, $\langle \ldots \rangle _{\zeta } = (2\pi )^{-1}\int \textrm{d}\zeta \ldots ,$
of the geometric parameters
$\langle \ldots \rangle _{\zeta } = (2\pi )^{-1}\int \textrm{d}\zeta \ldots ,$
of the geometric parameters $p$
,
$p$
, $\overline {\kappa }$
and
$\overline {\kappa }$
and $\gamma$
 \begin{align} {\renewcommand {\arraystretch }{1.5} \left \{ \begin{array}{l} \displaystyle\epsilon _{\delta \overline {m}=0,n} = \frac {\left \langle p \cos (n N_P \zeta ) \right \rangle _{\zeta }}{\left \langle p \right \rangle _{\zeta }}, \\[10pt]\displaystyle \epsilon _{\delta \overline {m}=2,0} = \frac {\langle \overline {\kappa }^2\rangle _{\zeta }}{\langle p \rangle _{\zeta }} - \frac {1}{2} ,\\[10pt]\displaystyle \epsilon _{\delta \overline {m}=2,n} = \frac {\langle (2 \overline {\kappa }^2 - p) \cos (nN_P\zeta ) - 2\tan (2\gamma )(2-p\overline {\kappa }^2) \sin (nN_P\zeta )\rangle _{\zeta }}{2\langle p \rangle _{\zeta }}. \end{array} \right . } \end{align}
Here, we have used the assumption of stellarator symmetry to deduce that $\Psi _2$
is even in
$\Psi _2$
is even in $(m \chi - n N_P \zeta )$
. As will be discussed in § 4, each of these spectral components of
$(m \chi - n N_P \zeta )$
. As will be discussed in § 4, each of these spectral components of $\epsilon$
will drive a corresponding gap in the shear Alfvén continuum, which we will label by the mode numbers
$\epsilon$
will drive a corresponding gap in the shear Alfvén continuum, which we will label by the mode numbers $(\delta m,\delta n)$
. We will assume the standard language to describe these gaps: the TAE corresponds with
$(\delta m,\delta n)$
. We will assume the standard language to describe these gaps: the TAE corresponds with $\delta m = 1$
,
$\delta m = 1$
, $\delta n = 0$
, the EAE gap corresponds with
$\delta n = 0$
, the EAE gap corresponds with $\delta m = 2$
,
$\delta m = 2$
, $\delta n = 0$
, the HAE gaps corresponds with
$\delta n = 0$
, the HAE gaps corresponds with $\delta m \ne 0$
and
$\delta m \ne 0$
and $\delta n \ne 0$
and the MAE gaps corresponds with
$\delta n \ne 0$
and the MAE gaps corresponds with $\delta m=0$
,
$\delta m=0$
, $\delta n \ne 0$
.
$\delta n \ne 0$
.
We can now interpret the geometric origins of these spectral components and their corresponding gaps:
-
(i) According to the discussion around (3.10), the $\epsilon _{\delta m=2,\delta n=1}$
spectral component is typically substantial in stellarators, driven by the rotating ellipse geometry, assuming that the sign of the toroidal angle is chosen to coincide with the direction of ellipse rotation. This component increases with increasing elongation through the parameter
$p$
. Thus rotating ellipticity drives the HAE (2,1) gap observed in many stellarators (Kolesnichenko et al. 2001, 2011).
$\epsilon _{\delta m=2,\delta n=1}$
spectral component is typically substantial in stellarators, driven by the rotating ellipse geometry, assuming that the sign of the toroidal angle is chosen to coincide with the direction of ellipse rotation. This component increases with increasing elongation through the parameter
$p$
. Thus rotating ellipticity drives the HAE (2,1) gap observed in many stellarators (Kolesnichenko et al. 2001, 2011). -
(ii) The mirror component,
$\epsilon _{\delta \overline {m}=0,n}$
, is produced by the toroidal variation of the elongation through the parameter
$p$
. Therefore, the toroidal variation of the elongation gives rise to the MAE gap. -
(iii) The parameter
$\epsilon _{\delta \overline {m}=2,0}$
, which drives the elliptical component (
$\delta m = 2$
,
$\delta n = 0$
) of
$\epsilon$
in QA configurations and the helical (
$\delta m = 2$
,
$\delta n =2$
) component in QH configurations, can be enhanced in the limit of either small or large
$\langle 2\overline {\kappa }^2 \rangle _{\zeta }/\langle p \rangle _{\zeta }$
in comparison with 1. In the limit of small and large
$\overline {\kappa }$
, the dominant balance ordering
$\sigma \sim \overline {\kappa }^{-2}$
from (3.4) (Rodríguez et al. Reference Rodríguez, Sengupta and Bhattacharjee2023) can be used to obtain
$p \rightarrow 2/\overline {\kappa }^2$
and
$\overline {\kappa }^2$
, respectively. Thus both limits of small or large
$\langle 2\overline {\kappa }^2 \rangle _{\zeta }/\langle p \rangle _{\zeta }$
correspond to enhanced elongation. Therefore, elongation drives the EAE gap in QA configurations and the HAE (2,2) gap in QH configurations. -
(iv) The parameter
$\epsilon _{\delta \overline {m}=2,n}$
, which drives the helical component (
$\delta m = 2$
,
$\delta n = n$
) in QA configurations and the helical (
$\delta m = 2$
,
$\delta n = n + 2$
) and elliptical components (for
$n = -2$
) in QH configurations, is produced by the toroidal variation of the curvature, elongation and rotation angle. Thus the toroidal variation of the curvature and elongation drive other HAEs in QA and QH configurations and the EAE in QH configurations.


In figure 1, the spectral contents of the coupling parameters appearing in the continuum equation (2.3), $|\boldsymbol{\nabla} \psi |^2$
and
$|\boldsymbol{\nabla} \psi |^2$
and $|\boldsymbol{\nabla} \psi |^2/B^4$
, are shown for two QH and two QA configurations (Anderson et al. Reference Anderson, Almagri, Anderson, Matthews, Talmadge and Shohet1995; Zarnstorff et al. Reference Zarnstorff2001; Landreman & Paul Reference Landreman and Paul2022). Each equilibrium is fit to the near-axis representation (Landreman Reference Landreman2019), and the corresponding expression for
$|\boldsymbol{\nabla} \psi |^2/B^4$
, are shown for two QH and two QA configurations (Anderson et al. Reference Anderson, Almagri, Anderson, Matthews, Talmadge and Shohet1995; Zarnstorff et al. Reference Zarnstorff2001; Landreman & Paul Reference Landreman and Paul2022). Each equilibrium is fit to the near-axis representation (Landreman Reference Landreman2019), and the corresponding expression for $|\boldsymbol{\nabla} \psi |^2$
(3.3) is Fourier transformed, as shown in the first row. In the second and third rows, the Fourier transform is performed on the
$|\boldsymbol{\nabla} \psi |^2$
(3.3) is Fourier transformed, as shown in the first row. In the second and third rows, the Fourier transform is performed on the $s = \psi /\psi _0 = 0$
and 0.5 surfaces of the equilibrium, where
$s = \psi /\psi _0 = 0$
and 0.5 surfaces of the equilibrium, where $\psi _0$
is the toroidal flux on the boundary. The spectral content of
$\psi _0$
is the toroidal flux on the boundary. The spectral content of $|\boldsymbol{\nabla} \psi |^2/B^4$
on the
$|\boldsymbol{\nabla} \psi |^2/B^4$
on the $s = 0.5$
surface is shown on the bottom row. For ease of interpretation, the sign of the toroidal angle is chosen such that the direction of ellipse rotation coincides for all equilibria. Note that the spectral content of
$s = 0.5$
surface is shown on the bottom row. For ease of interpretation, the sign of the toroidal angle is chosen such that the direction of ellipse rotation coincides for all equilibria. Note that the spectral content of $|\boldsymbol{\nabla} \psi |^2/B^4$
is equivalent to that of
$|\boldsymbol{\nabla} \psi |^2/B^4$
is equivalent to that of $|\boldsymbol{\nabla} \psi |^2$
in the lowest-order near-axis expansion, so near-axis results are only shown for
$|\boldsymbol{\nabla} \psi |^2$
in the lowest-order near-axis expansion, so near-axis results are only shown for $|\boldsymbol{\nabla} \psi |^2$
. We see that the near-axis expression provides quantitative agreement with the equilibrium on axis, and qualitative agreement away from the axis. For all equilibria, the Fourier transform reveals that the dominant spectral component is the
$|\boldsymbol{\nabla} \psi |^2$
. We see that the near-axis expression provides quantitative agreement with the equilibrium on axis, and qualitative agreement away from the axis. For all equilibria, the Fourier transform reveals that the dominant spectral component is the $\delta m = 2$
,
$\delta m = 2$
, $\delta n = 1$
amplitude, as predicted by the rotating ellipse geometry. Only for the QA equilibria do the elliptical and mirror components become comparable in magnitude, as these configurations have considerable toroidal variation of the elongation and curvature, see table 1. The mirror and elliptical components are slightly larger in the precise QA equilibrium than in the Garabedian equilibrium due to its enhanced elongation magnitude and variation. Away from the axis, the toroidal (
$\delta n = 1$
amplitude, as predicted by the rotating ellipse geometry. Only for the QA equilibria do the elliptical and mirror components become comparable in magnitude, as these configurations have considerable toroidal variation of the elongation and curvature, see table 1. The mirror and elliptical components are slightly larger in the precise QA equilibrium than in the Garabedian equilibrium due to its enhanced elongation magnitude and variation. Away from the axis, the toroidal ( $\delta m = 1$
) and triangularity-induced (
$\delta m = 1$
) and triangularity-induced ( $\delta m = 3$
) components are driven, which are not captured by the lowest-order near-axis theory.
$\delta m = 3$
) components are driven, which are not captured by the lowest-order near-axis theory.
Configuration characteristics are shown for the equilibria in figure 1 at $s = 0$
, including the symmetry helicity
$s = 0$
, including the symmetry helicity $N$
, mean and variance (
$N$
, mean and variance ( $(\max (\mathcal{E})-\min (\mathcal{E}))/\text{mean}(\mathcal{E}$
) of elongation, mean and variation of
$(\max (\mathcal{E})-\min (\mathcal{E}))/\text{mean}(\mathcal{E}$
) of elongation, mean and variation of $\overline {\kappa }$
and the magnitudes of the dominant Fourier harmonics of
$\overline {\kappa }$
and the magnitudes of the dominant Fourier harmonics of $\epsilon _{\delta m,\delta n}$
.
$\epsilon _{\delta m,\delta n}$
.

To summarize, we note that the spectral content of $|\boldsymbol{\nabla} \psi |^2$
is generally distinct from that of
$|\boldsymbol{\nabla} \psi |^2$
is generally distinct from that of $B$
. As discussed in previous work (Kolesnichenko et al. 2001, 2011), due to the rotating ellipticity inherent to stellarator configurations near the magnetic axis, a strong helical
$B$
. As discussed in previous work (Kolesnichenko et al. 2001, 2011), due to the rotating ellipticity inherent to stellarator configurations near the magnetic axis, a strong helical $\delta m = 2$
,
$\delta m = 2$
, $\delta n = \pm 1$
component is driven, with a sign corresponding to the direction of ellipse rotation. Due to coupling through the toroidal variation of the curvature and elongation, additional mirror, helical and elliptical components arise. This effect appears to be stronger in the QA configurations studied. While further study is required to determine if this trend holds over a wider database of configurations, a plausible explanation can be obtained from the fact that the normal vector of QH configurations must make
$\delta n = \pm 1$
component is driven, with a sign corresponding to the direction of ellipse rotation. Due to coupling through the toroidal variation of the curvature and elongation, additional mirror, helical and elliptical components arise. This effect appears to be stronger in the QA configurations studied. While further study is required to determine if this trend holds over a wider database of configurations, a plausible explanation can be obtained from the fact that the normal vector of QH configurations must make $N$
rotations; thus the axis rotation naturally generates significant rotational transform. However, for QA configurations, more substantial elongation and shaping are required to generate substantial rotational transform.
$N$
rotations; thus the axis rotation naturally generates significant rotational transform. However, for QA configurations, more substantial elongation and shaping are required to generate substantial rotational transform.
The Fourier transforms of the normalized coupling parameters, $|\boldsymbol{\nabla} \psi |^2/\langle |\boldsymbol{\nabla} \psi |^2 \rangle$
and
$|\boldsymbol{\nabla} \psi |^2/\langle |\boldsymbol{\nabla} \psi |^2 \rangle$
and $|\boldsymbol{\nabla} \psi |^2/B^4/\langle |\boldsymbol{\nabla} \psi |^2/B^4\rangle$
, are shown for two QH configurations, (a) and (b), and two QA configurations, (c) and (d). The near-axis expression
$|\boldsymbol{\nabla} \psi |^2/B^4/\langle |\boldsymbol{\nabla} \psi |^2/B^4\rangle$
, are shown for two QH configurations, (a) and (b), and two QA configurations, (c) and (d). The near-axis expression $\Psi _2$
, defined through (3.2), (first row) shows good quantitative comparison with the on-axis equilibrium values (second row) and good qualitative comparison with the mid-flux value from the equilibrium (bottom row).
$\Psi _2$
, defined through (3.2), (first row) shows good quantitative comparison with the on-axis equilibrium values (second row) and good qualitative comparison with the mid-flux value from the equilibrium (bottom row).

4. Perturbative solution to the continuum equation
Given the common physics basis for the formation of spectral gaps in the shear Alfvén continuum in a torus and the band gaps in the electron energy spectrum in a periodic lattice (Heidbrink Reference Heidbrink2008), it is natural to apply quantum mechanical techniques to analytically study the continuum structure in a near-axis QS field. Here, we use degenerate perturbation theory, treating the coupling parameter $\epsilon$
as a small perturbation, to identify the frequency splitting. Similar techniques have been applied to study the shear Alfvén continuum of a large-aspect-ratio tokamak (Kieras & Tataronis Reference Kieras and Tataronis1982; Riyopoulos & Mahajan Reference Riyopoulos and Mahajan1986). This analysis will provide expressions for the spectral gaps in near-axis QS configurations, similar to previous studies of the continuum of model Helias configurations (Kolesnichenko et al. Reference Kolesnichenko, Lutsenko, Wobig, Yakovenko and Fesenyuk2001). The formalism will also enable extensions beyond previous work, such as quantification of secondary gaps due to the interaction of multiple harmonics of
$\epsilon$
as a small perturbation, to identify the frequency splitting. Similar techniques have been applied to study the shear Alfvén continuum of a large-aspect-ratio tokamak (Kieras & Tataronis Reference Kieras and Tataronis1982; Riyopoulos & Mahajan Reference Riyopoulos and Mahajan1986). This analysis will provide expressions for the spectral gaps in near-axis QS configurations, similar to previous studies of the continuum of model Helias configurations (Kolesnichenko et al. Reference Kolesnichenko, Lutsenko, Wobig, Yakovenko and Fesenyuk2001). The formalism will also enable extensions beyond previous work, such as quantification of secondary gaps due to the interaction of multiple harmonics of $\epsilon$
and higher-order crossings, which have been observed in previous numerical studies (Kolesnichenko et al. Reference Kolesnichenko, Lutsenko, Wobig, Yakovenko and Fesenyuk2001; Spong et al. Reference Spong, Sanchez and Weller2003; Yakovenko et al. Reference Yakovenko, Weller, Werner, Zegenhagen, Fesenyuk and Kolesnichenko2007).
$\epsilon$
and higher-order crossings, which have been observed in previous numerical studies (Kolesnichenko et al. Reference Kolesnichenko, Lutsenko, Wobig, Yakovenko and Fesenyuk2001; Spong et al. Reference Spong, Sanchez and Weller2003; Yakovenko et al. Reference Yakovenko, Weller, Werner, Zegenhagen, Fesenyuk and Kolesnichenko2007).
4.1. Near-axis perturbation theory
Given the continuum equation under the near-axis quasisymmetry model (3.7), we now seek expressions for the continuum gap locations and width. Under the assumption that the coupling is small, $|\epsilon | \ll 1$
, perturbation theory can be used to evaluate the eigenvalue shift associated with the coupling. To simplify the notation, we define the eigenvalue
$|\epsilon | \ll 1$
, perturbation theory can be used to evaluate the eigenvalue shift associated with the coupling. To simplify the notation, we define the eigenvalue $\lambda _j = \overline {\omega }_j^2$
. To lowest order in the coupling (denoted by superscript
$\lambda _j = \overline {\omega }_j^2$
. To lowest order in the coupling (denoted by superscript $(0)$
), the continuum equation reads
$(0)$
), the continuum equation reads
 \begin{align} \left (\frac {\partial }{\partial \zeta } + \iota _0 \frac {\partial }{\partial \theta } \right ) \left [ \left (\frac {\partial }{\partial \zeta } + \iota _0 \frac {\partial }{\partial \theta } \right ) \varPhi ^{(0)}_j\right ] + \lambda _j^{(0)} \varPhi _j^{(0)} = 0. \end{align}
The eigenfunctions are $\varPhi ^{(0)}_j = e^{i (m_j \theta - n_j \zeta + \omega t)}$
with eigenvalues
$\varPhi ^{(0)}_j = e^{i (m_j \theta - n_j \zeta + \omega t)}$
with eigenvalues
 \begin{align} \lambda _j^{(0)} = (\iota _0 m_j - n_j)^2. \end{align}
We continue to the linear order in the coupling parameter $\epsilon$
 \begin{align} \left (\frac {\partial }{\partial \zeta } + \iota _0 \frac {\partial }{\partial \theta } \right )^2 \varPhi ^{(1)} + \left [\left (\frac {\partial }{\partial \zeta } + \iota _0 \frac {\partial }{\partial \theta } \right ) \epsilon \right ]\left [\left (\frac {\partial }{\partial \zeta } + \iota _0 \frac {\partial }{\partial \theta } \right ) \varPhi ^{(0)} \right ]\nonumber \\ + \lambda ^{\!(0)} \varPhi ^{(1)} + \lambda ^{(1)} \varPhi ^{(0)} = 0. \end{align}
We first consider non-degenerate perturbation theory, which assumes that all unperturbed frequencies are unique, before approaching the degenerate case. Non-degeneracy precludes the possibility of continuum frequency crossings, e.g. points where
 \begin{align} \iota _0 m_j - n_j = \pm (\iota _0 m_k - n_k ) ,\end{align}
for some $(m_j,n_j) \ne (m_k, n_k)$
. In this case, we assume (4.3) with
$(m_j,n_j) \ne (m_k, n_k)$
. In this case, we assume (4.3) with $\varPhi ^{(0)} = \varPhi _j^{(0)}$
and
$\varPhi ^{(0)} = \varPhi _j^{(0)}$
and $\lambda ^{\!(0)} = \lambda ^{\!(0)}_j$
. By integrating against
$\lambda ^{\!(0)} = \lambda ^{\!(0)}_j$
. By integrating against $(\varPhi ^{(0)}_j )^*$
(star indicating the complex conjugate), noting that the operator
$(\varPhi ^{(0)}_j )^*$
(star indicating the complex conjugate), noting that the operator $(\partial /\partial \zeta + \iota _0 \partial /\partial \theta )^2$
is self-adjoint, the constraint
$(\partial /\partial \zeta + \iota _0 \partial /\partial \theta )^2$
is self-adjoint, the constraint $\lambda _j^{(1)} = 0$
is obtained. Therefore, no shift to the continuum frequency is obtained in the absence of degeneracy, i.e. continuum crossings.
$\lambda _j^{(1)} = 0$
is obtained. Therefore, no shift to the continuum frequency is obtained in the absence of degeneracy, i.e. continuum crossings.
We next consider the case of two degenerate frequencies,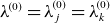 $\lambda ^{\!(0)} = \lambda ^{\!(0)}_j = \lambda ^{\!(0)}_k$
, or equivalently (4.4). We define the mode number separations as
$\lambda ^{\!(0)} = \lambda ^{\!(0)}_j = \lambda ^{\!(0)}_k$
, or equivalently (4.4). We define the mode number separations as $\Delta m = m_j - m_k$
and
$\Delta m = m_j - m_k$
and $\Delta n = n_j - n_k$
. The two states are said to be co-propagating if they satisfy (4.4) with a positive sign, indicating the same sign of the parallel wavenumber
$\Delta n = n_j - n_k$
. The two states are said to be co-propagating if they satisfy (4.4) with a positive sign, indicating the same sign of the parallel wavenumber $k_{\|}$
for both eigenfunctions. Otherwise, they are said to be counter-propagating. Here, we adopt the notation
$k_{\|}$
for both eigenfunctions. Otherwise, they are said to be counter-propagating. Here, we adopt the notation $\overline {\omega }^{(0)}= \sqrt {\lambda ^{\!(0)}}$
, with
$\overline {\omega }^{(0)}= \sqrt {\lambda ^{\!(0)}}$
, with $\overline {\omega }_j^{(0)} = \iota _0 m_j - n_j$
. As will be shown below, only the counter-propagation case enables a frequency shift. In the counter-propagation case, the condition (4.4) implies
$\overline {\omega }_j^{(0)} = \iota _0 m_j - n_j$
. As will be shown below, only the counter-propagation case enables a frequency shift. In the counter-propagation case, the condition (4.4) implies
 \begin{align} \rvert \overline {\omega }^{(0)} \rvert = \left \rvert \frac {\iota _0 \Delta m - \Delta n}{2} \right \rvert , \end{align}
while in the co-propagation case, it implies $ \iota _0 = \Delta n/\Delta m$
. Therefore, the co-propagation case is only possible when multiple toroidal harmonics are considered,
$ \iota _0 = \Delta n/\Delta m$
. Therefore, the co-propagation case is only possible when multiple toroidal harmonics are considered, $\Delta n \ne 0$
, as in the case of 3-D configurations such as stellarators.
$\Delta n \ne 0$
, as in the case of 3-D configurations such as stellarators.
In the case of two-way degeneracy of either sign, the unperturbed eigenfunction is a linear combination of two unperturbed states
 \begin{align} \varPhi ^{(0)} = \alpha _j\varPhi ^{(0)}_j + \alpha _k \varPhi ^{(0)}_k, \end{align}
for unknown amplitudes $\alpha _j$
and
$\alpha _j$
and $\alpha _k$
with
$\alpha _k$
with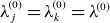 $\lambda ^{\!(0)}_j = \lambda ^{\!(0)}_k = \lambda ^{\!(0)}$
. The perturbed continuum equation (4.3) is then integrated against
$\lambda ^{\!(0)}_j = \lambda ^{\!(0)}_k = \lambda ^{\!(0)}$
. The perturbed continuum equation (4.3) is then integrated against $(\varPhi ^{(0)}_j )^*$
and
$(\varPhi ^{(0)}_j )^*$
and $(\varPhi ^{(0)}_k)^*$
to yield a set of coupled equations for the amplitudes
$(\varPhi ^{(0)}_k)^*$
to yield a set of coupled equations for the amplitudes $\alpha _j$
and
$\alpha _j$
and $\alpha _k$
 \begin{align} \left [ \begin{array}{c@{\quad}c} \lambda ^{(1)} & \epsilon _{\Delta m,\Delta n} \overline {\omega }^{(0)}_j \left (\iota _0 \Delta m - \Delta n\right ) \\[5pt] \epsilon _{\Delta m,\Delta n}^* \overline {\omega }^{(0)}_j \left (\iota _0 \Delta m - \Delta n\right ) & \lambda ^{(1)} \end{array} \right ]\left [ \begin{array}{c}\alpha _j \\ \alpha _k \end{array}\right ] = \left [\begin{array}{c} 0 \\ 0 \end{array}\right ]. \end{align}
Setting the determinant of the above matrix to zero provides the frequency shift,
 \begin{align} (\lambda ^{(1)} )^2 =|\epsilon _{\Delta m, \Delta n/N_P}|^2 (\iota _0 \Delta m - \Delta n )^2 \lambda ^{\!(0)}, \end{align}
noting that $(\overline {\omega }_j^{(0)} )^2 = \lambda ^{\!(0)}$
. Here, we have assumed
$(\overline {\omega }_j^{(0)} )^2 = \lambda ^{\!(0)}$
. Here, we have assumed $N_P$
-symmetry, with the convention that the toroidal mode number of
$N_P$
-symmetry, with the convention that the toroidal mode number of $\epsilon$
is multiplied by
$\epsilon$
is multiplied by $N_P$
in the definition (3.8). In the case of co-propagation, there is evidently no frequency shift, and the two modes will continue to cross each other unless a higher-order degeneracy is present, as described in § 4.2. For the counter-propagating case, the frequency shift is evaluated from the displacement of the positive and negative solutions,
$N_P$
in the definition (3.8). In the case of co-propagation, there is evidently no frequency shift, and the two modes will continue to cross each other unless a higher-order degeneracy is present, as described in § 4.2. For the counter-propagating case, the frequency shift is evaluated from the displacement of the positive and negative solutions, $\Delta \overline {\omega } = \sqrt {\lambda ^{\!(0)} + \lambda ^{(1)}_+} - \sqrt {\lambda ^{\!(0)} + \lambda ^{(1)}_-}$
, approximated as
$\Delta \overline {\omega } = \sqrt {\lambda ^{\!(0)} + \lambda ^{(1)}_+} - \sqrt {\lambda ^{\!(0)} + \lambda ^{(1)}_-}$
, approximated as
 \begin{align} \Delta \overline {\omega } = 2\overline {\omega }^{(0)} |\epsilon _{\Delta m,\Delta n/N_P}|. \end{align}
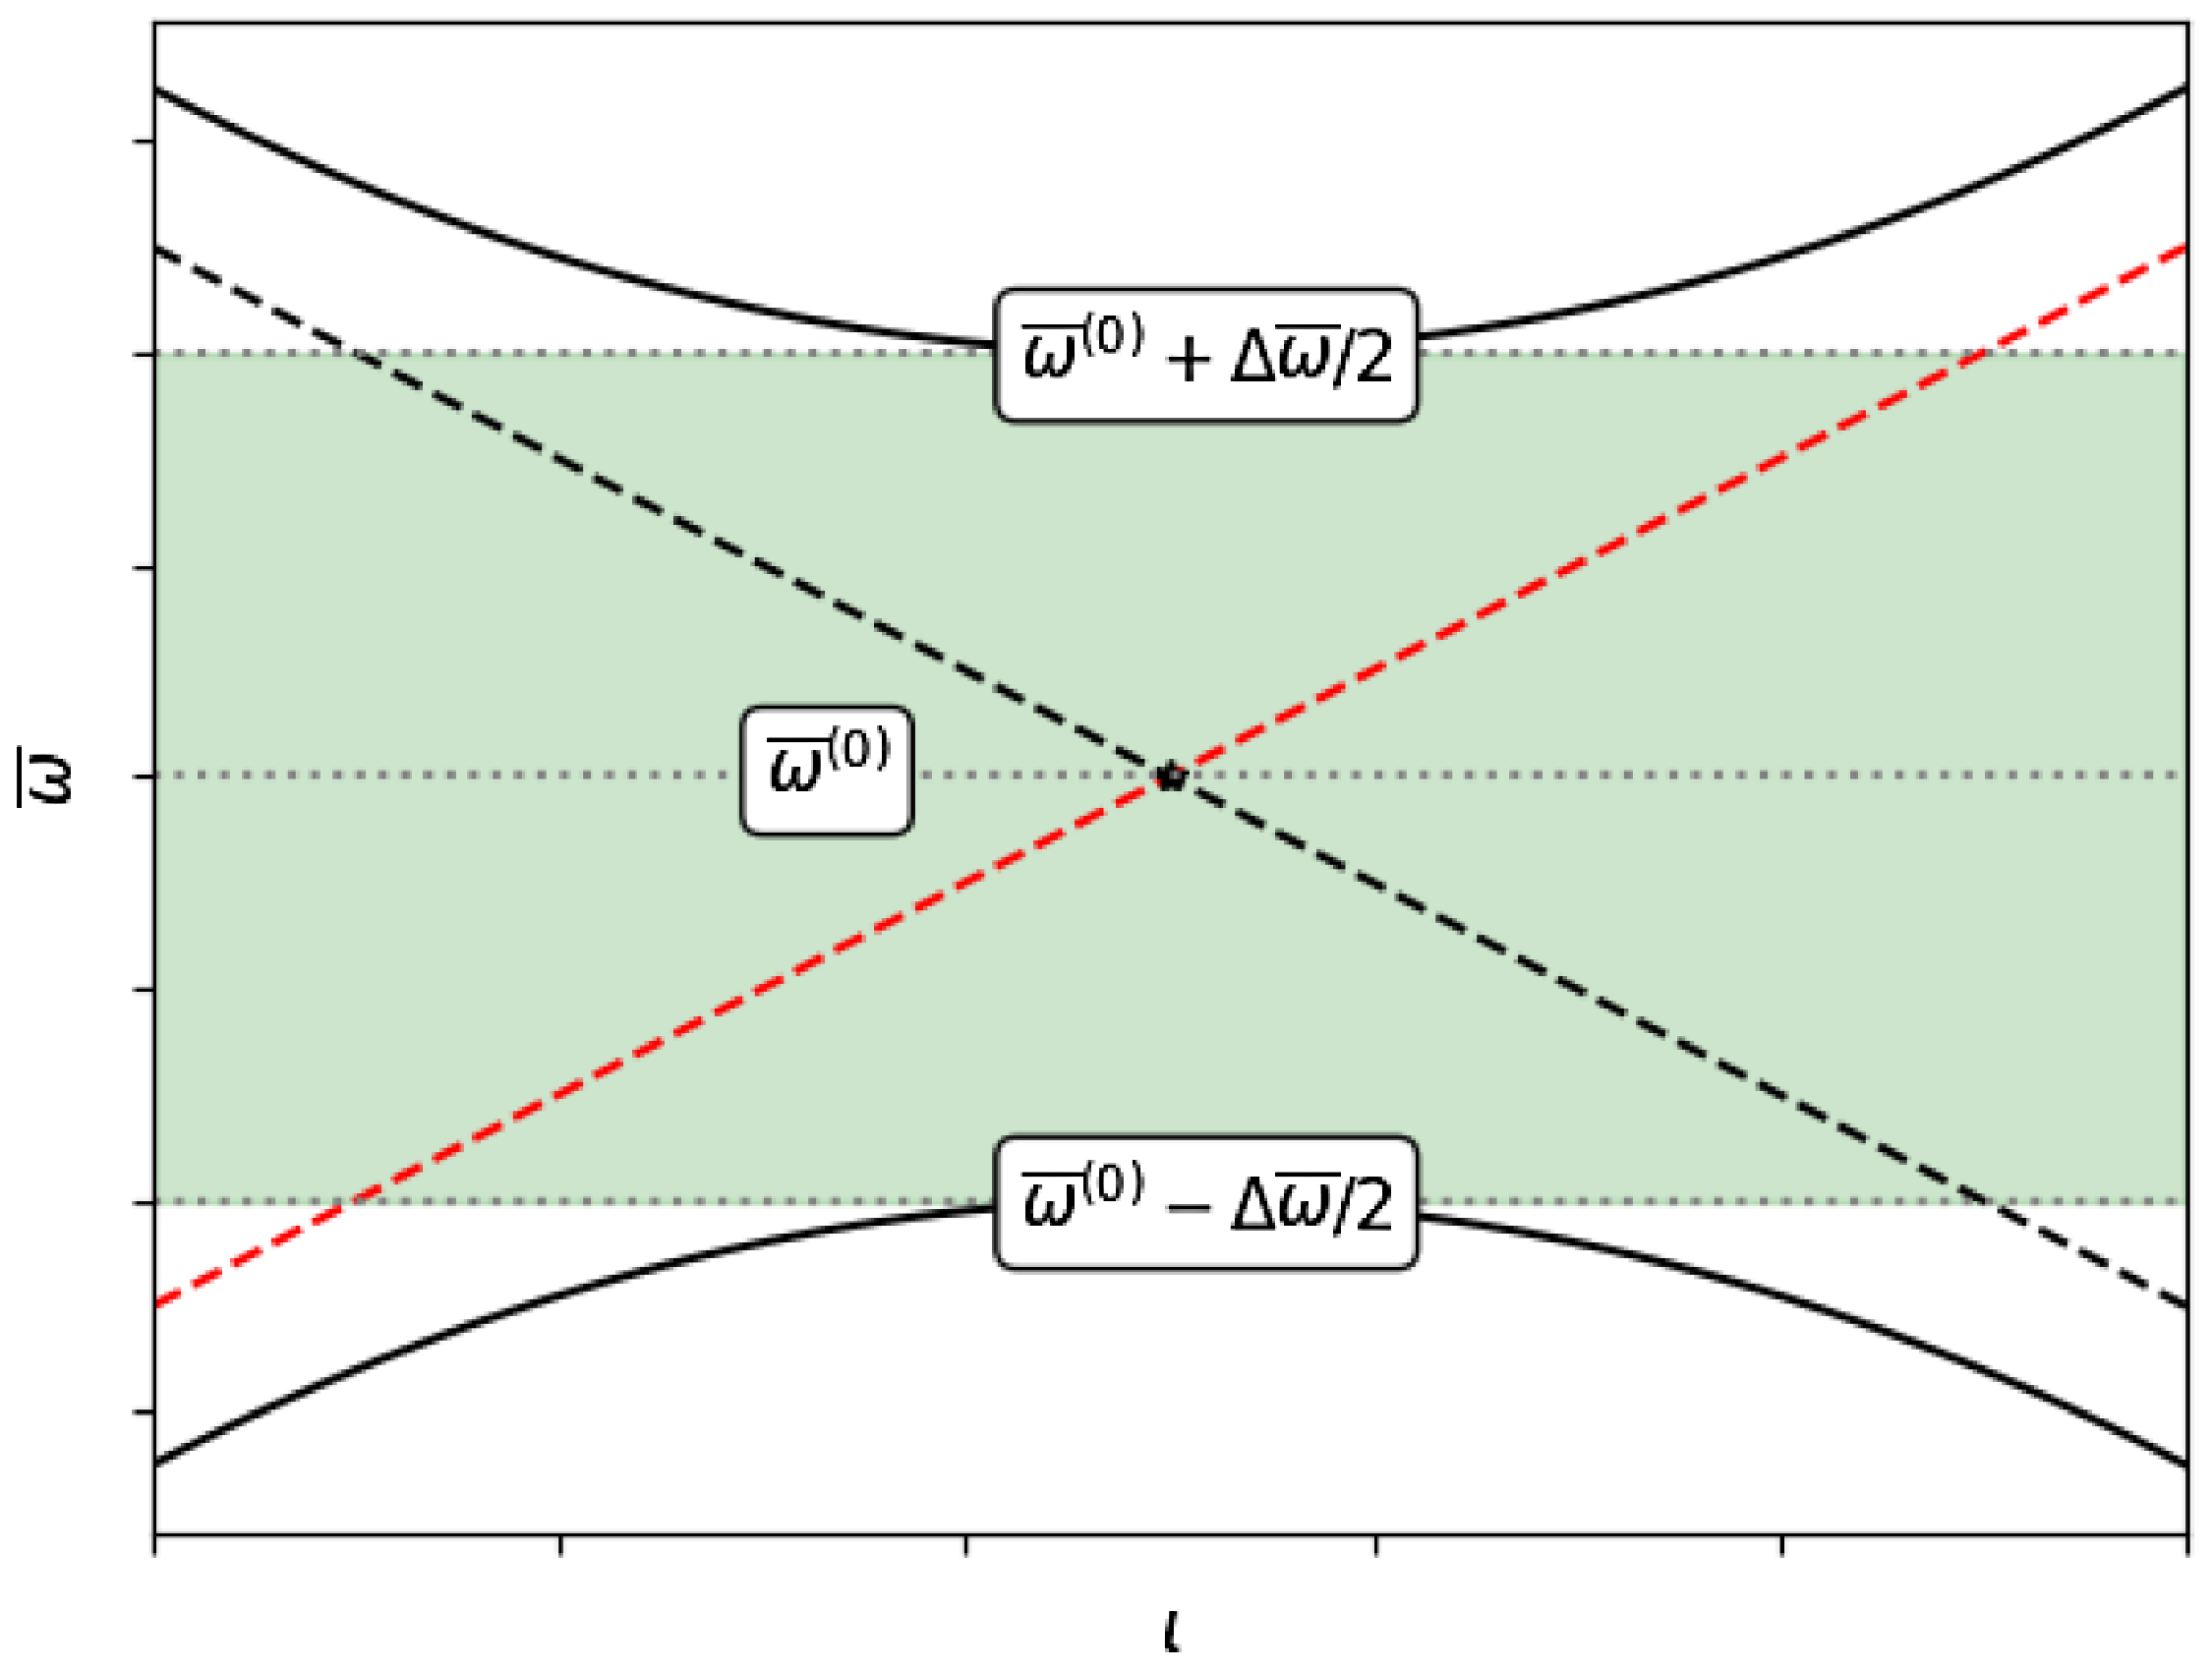
Therefore, while in the absence of coupling, the frequencies would cross at the point indicated by (4.5), the crossing is avoided in the presence of coupling. The phenomena of avoided crossings is often referred to as a spectral gap associated with mode numbers $\Delta m$
and
$\Delta m$
and $\Delta n/N_P$
. See figure 2 for a schematic diagram. We will refer to such locations as the (
$\Delta n/N_P$
. See figure 2 for a schematic diagram. We will refer to such locations as the ( $\Delta m,\Delta n/N_P$
) gap. As described in § 4.4, the avoided crossings persist away from the axis, with the central gap frequency
$\Delta m,\Delta n/N_P$
) gap. As described in § 4.4, the avoided crossings persist away from the axis, with the central gap frequency $\overline {\omega }^{(0)}$
being a continuous function of
$\overline {\omega }^{(0)}$
being a continuous function of $\iota$
.
$\iota$
.
A schematic diagram of a spectral gap formed due to a counter-propagating pair (dashed lines) that cross at $\overline {\omega }^{(0)}$
. Here, red indicates
$\overline {\omega }^{(0)}$
. Here, red indicates $\overline {\omega }^{(0)}\gt 0$
and black indicates
$\overline {\omega }^{(0)}\gt 0$
and black indicates $\overline {\omega }^{(0)}\lt 0$
. In the presence of the coupling parameter
$\overline {\omega }^{(0)}\lt 0$
. In the presence of the coupling parameter $\epsilon$
, a gap forms of width
$\epsilon$
, a gap forms of width $\Delta \overline {\omega }$
, given by (4.16).
$\Delta \overline {\omega }$
, given by (4.16).
In an axisymmetric system, all toroidal mode numbers are decoupled, since the geometric factor $\epsilon$
is independent of
$\epsilon$
is independent of $\zeta$
. Thus one can analyze the continuum independently for each toroidal mode number
$\zeta$
. Thus one can analyze the continuum independently for each toroidal mode number $n$
, and
$n$
, and $\Delta n = 0$
for all crossings. In this way, all crossings are avoided if coupling is present, since co-propagation is not possible. However, in a 3-D system, not all crossings are avoided due to co-propagation described above and gap crossings, as described in § 4.3. This additional complexity generally obscures spectral gaps in 3-D systems, although one may still gain basic intuition from this perturbative analysis.
$\Delta n = 0$
for all crossings. In this way, all crossings are avoided if coupling is present, since co-propagation is not possible. However, in a 3-D system, not all crossings are avoided due to co-propagation described above and gap crossings, as described in § 4.3. This additional complexity generally obscures spectral gaps in 3-D systems, although one may still gain basic intuition from this perturbative analysis.
The following sections will further extend this theory. Section 4.2 will consider the case when the degeneracy is not lifted at the linear order, but at quadratic order. Section 4.3 will consider the case of higher-order crossings, which are permitted in 3-D systems. Finally, § 4.4 will extend the perturbation analysis away from the magnetic axis.
4.2. Higher-order degeneracy
We now consider the case when the degeneracy is not lifted at first order in $\epsilon$
, implying
$\epsilon$
, implying $\epsilon _{\Delta m,\Delta n/N_P} = \lambda ^{(1)} = 0$
. Even in the absence of a frequency shift at first order, there may still be a shift to the eigenfunction,
$\epsilon _{\Delta m,\Delta n/N_P} = \lambda ^{(1)} = 0$
. Even in the absence of a frequency shift at first order, there may still be a shift to the eigenfunction, $\varPhi ^{(1)}$
, which enters at
$\varPhi ^{(1)}$
, which enters at $\mathcal{O}(\epsilon ^2)$
. Since the lowest-order eigenfunctions are a complete basis, the correction to the eigenfunction can be expressed as
$\mathcal{O}(\epsilon ^2)$
. Since the lowest-order eigenfunctions are a complete basis, the correction to the eigenfunction can be expressed as
 \begin{align} \varPhi ^{(1)} = \sum _{i\ne {j,k}} \mu _i \varPhi _i^{(0)}, \end{align}
where we are free to assume that $\varPhi ^{(1)}$
has no projection onto the degenerate subspace,
$\varPhi ^{(1)}$
has no projection onto the degenerate subspace, $\varPhi _j^{(0)}$
and
$\varPhi _j^{(0)}$
and $\varPhi _k^{(0)}$
. The coefficients
$\varPhi _k^{(0)}$
. The coefficients $\mu _i$
are determined by integrating (4.3) against
$\mu _i$
are determined by integrating (4.3) against $(\varPhi ^{(0)}_i)^*$
 \begin{align} \mu _i = \frac {\Delta _{ij}\epsilon _{ij}\alpha _j\overline {\omega }_j + \Delta _{ik}\epsilon _{ik}\alpha _k\overline {\omega }_k}{\lambda ^{\!(0)}-\lambda _i^{(0)}}, \end{align}
where $\Delta _{ij} = \iota _0 \Delta m_{ij} - \Delta n_{ij}$
and
$\Delta _{ij} = \iota _0 \Delta m_{ij} - \Delta n_{ij}$
and $\epsilon _{ij} = \epsilon _{\Delta m_{ij}, \Delta n_{ij}/N_P}$
. We now continue to second order in
$\epsilon _{ij} = \epsilon _{\Delta m_{ij}, \Delta n_{ij}/N_P}$
. We now continue to second order in $\epsilon$
 \begin{align} \left (\frac {\partial }{\partial \zeta } + \iota _0 \frac {\partial }{\partial \theta } \right )^2 \varPhi ^{(2)} + \left [\left (\frac {\partial }{\partial \zeta } + \iota _0 \frac {\partial }{\partial \theta } \right ) \epsilon \right ]\left [\left (\frac {\partial }{\partial \zeta } + \iota _0 \frac {\partial }{\partial \theta } \right ) \varPhi ^{(1)} \right ] \nonumber \\ - \epsilon \left [\left (\frac {\partial }{\partial \zeta } + \iota _0 \frac {\partial }{\partial \theta } \right ) \epsilon \right ]\left [\left (\frac {\partial }{\partial \zeta } + \iota _0 \frac {\partial }{\partial \theta } \right ) \varPhi ^{(0)} \right ] \nonumber \\ + \lambda ^{\!(0)} \varPhi ^{(2)} + \lambda ^{(2)} \varPhi ^{(0)} = 0. \end{align}
Integrating against $\left (\varPhi _j^{(0)}\right )^*$
and
$\left (\varPhi _j^{(0)}\right )^*$
and $(\varPhi _k^{(0)} )^*$
, using (4.10) and (4.11) again results in a set of coupled equations for
$(\varPhi _k^{(0)} )^*$
, using (4.10) and (4.11) again results in a set of coupled equations for $\alpha _j$
and
$\alpha _j$
and $\alpha _k$
. The zero-determinant condition, assuming counter-propagation, then reads
$\alpha _k$
. The zero-determinant condition, assuming counter-propagation, then reads
 \begin{align} \left (\frac {\lambda ^{(2)}}{\lambda ^{\!(0)}} + F\right )^2 - |E|^2 = 0, \end{align}
with
 \begin{align} E &= \sum _{\delta m,\delta n}\epsilon _{\delta m,\delta n} \epsilon _{\Delta m-\delta m,\Delta n/N_P-\delta n}, \end{align}
 \begin{align} F &= \sum _{\delta m,\delta n} |\epsilon _{\delta m,\delta n}|^2 \frac {\Delta ({\delta m,\delta n})}{\Delta ({\delta m,\delta n}) + 2 \overline {\omega }^{(0)}_j}, \end{align}
where $\Delta ({\delta m,\delta n}) = \iota _0 \delta m-\delta n$
. The gap width due to two-harmonic coupling then reads
$\Delta ({\delta m,\delta n}) = \iota _0 \delta m-\delta n$
. The gap width due to two-harmonic coupling then reads
 \begin{align} \Delta \overline {\omega } = \overline {\omega }^{(0)}|E| . \end{align}
In addition to the frequency splitting, the gap central frequency is modified to $\overline {\omega }_j^{(0)}\sqrt {1-F}$
. See Appendix B for details.
$\overline {\omega }_j^{(0)}\sqrt {1-F}$
. See Appendix B for details.
Because the frequency shift is second order in the coupling parameters, such gaps will typically be narrower. This behavior has been observed in numerical continuum calculations, sometimes referred to as secondary or higher-order gaps (Kolesnichenko et al. Reference Kolesnichenko, Lutsenko, Wobig, Yakovenko and Fesenyuk2001). As an example, according to near-axis theory, $\epsilon$
can only provide harmonics with
$\epsilon$
can only provide harmonics with $\delta m = 2$
or 0. However, a gap with
$\delta m = 2$
or 0. However, a gap with $\Delta m = 4$
can nonetheless arise due to higher-order degeneracy, as will be demonstrated numerically in § 5. More generally,
$\Delta m = 4$
can nonetheless arise due to higher-order degeneracy, as will be demonstrated numerically in § 5. More generally, $n$
-order degeneracies may also arise, whose width scales with
$n$
-order degeneracies may also arise, whose width scales with $\epsilon ^n$
.
$\epsilon ^n$
.
4.3. Higher-order crossings
While spectral gaps remain well separated in 2-D configurations, they may generally cross when $\Delta n \ne 0$
. The phenomena of gap crossing results in higher-order crossing of unperturbed frequencies, which can reduce the gap width and modify the gap structure. We first remark on the interpretation of such higher-order crossings before embarking on the analysis.
$\Delta n \ne 0$
. The phenomena of gap crossing results in higher-order crossing of unperturbed frequencies, which can reduce the gap width and modify the gap structure. We first remark on the interpretation of such higher-order crossings before embarking on the analysis.
If multiple pairs of modes are counter-propagating, this implies the intersection of spectral gaps with different mode numbers, $(\Delta m_1,\Delta n_1)$
and
$(\Delta m_1,\Delta n_1)$
and $(\Delta m_2,\Delta n_2)$
. Since the frequency center of the gap is given by (4.5), the crossing of these spectral gaps implies
$(\Delta m_2,\Delta n_2)$
. Since the frequency center of the gap is given by (4.5), the crossing of these spectral gaps implies
 \begin{align} \iota _0 = \frac {\Delta n_1 - \Delta n_2}{\Delta m_1 - \Delta m_2}. \end{align}
Thus, the gap crossing necessarily occurs on a rational surface. If one gap crossing exists, satisfying the above condition, then there are an infinite number of gap crossings at the same location since the numerator and denominator can be scaled by the same factor. For example, gaps labeled by mode numbers ( $\Delta m_1$
,
$\Delta m_1$
, $\Delta n_1$
) and (
$\Delta n_1$
) and ( $\Delta m_3$
,
$\Delta m_3$
, $\Delta n_3$
) with
$\Delta n_3$
) with $\Delta n_3 = k\Delta n_2 - (k-1)\Delta n_1$
and
$\Delta n_3 = k\Delta n_2 - (k-1)\Delta n_1$
and $\Delta m_3 = k \Delta m_2 - (k-1) \Delta m_1$
will cross at the same location for any integer
$\Delta m_3 = k \Delta m_2 - (k-1) \Delta m_1$
will cross at the same location for any integer $k$
. Thus gap crossing implies many-way crossings at the intersection point. As we will see in § 5.3, with increasing numerical resolution, the number of crossings increases. As illustrative cases, we discuss three-way and four-way crossings below.
$k$
. Thus gap crossing implies many-way crossings at the intersection point. As we will see in § 5.3, with increasing numerical resolution, the number of crossings increases. As illustrative cases, we discuss three-way and four-way crossings below.
As discussed in (Yakovenko et al. Reference Yakovenko, Weller, Werner, Zegenhagen, Fesenyuk and Kolesnichenko2007), at the gap crossing point, the continuum equation (4.12) then becomes decoupled across field lines since only parallel derivatives appear. When the two gaps cross, the parallel wavenumber associated with the two corresponding coupling parameters, $\epsilon _{\Delta m_1,\Delta n_1/N_P}$
and
$\epsilon _{\Delta m_1,\Delta n_1/N_P}$
and $\epsilon _{\Delta m_2, \Delta n_2/N_P}$
, then coincide, since
$\epsilon _{\Delta m_2, \Delta n_2/N_P}$
, then coincide, since $\iota _0 \Delta m_1 - \Delta n_1 = \pm (\iota _0 \Delta m_2 - \Delta n_2)$
. In this way,
$\iota _0 \Delta m_1 - \Delta n_1 = \pm (\iota _0 \Delta m_2 - \Delta n_2)$
. In this way, $\epsilon _{\Delta m_1,\Delta n_1/N_P}$
and
$\epsilon _{\Delta m_1,\Delta n_1/N_P}$
and $\epsilon _{\Delta m_2, \Delta n_2/N_P}$
can enable coupling between both pairs of counter-propagating modes. The variation across field lines of the coupling can act to reduce the gap width, with the resulting width being approximately the difference in the widths of the crossing gaps. This behavior will be demonstrated in § 5.3.
$\epsilon _{\Delta m_2, \Delta n_2/N_P}$
can enable coupling between both pairs of counter-propagating modes. The variation across field lines of the coupling can act to reduce the gap width, with the resulting width being approximately the difference in the widths of the crossing gaps. This behavior will be demonstrated in § 5.3.
Now we consider the situation of multiple of pairs of modes co-propagating with each other, implying that
 \begin{align} \iota _0 = \frac {\Delta n_1}{\Delta m_1} = \frac {\Delta n_2}{\Delta m_2}. \end{align}
Again, this condition can only be satisfied on a rational surface, and co-propagation can only occur for helical gaps ( $\Delta m_1$
,
$\Delta m_1$
, $\Delta n_1$
,
$\Delta n_1$
, $\Delta m_2$
,
$\Delta m_2$
, $\Delta n_2$
are all non-zero), Evidently, the two pairs of modes must have a common factor. Thus this behavior occurs due to intersection with a higher harmonic of a helical gap (e.g. (
$\Delta n_2$
are all non-zero), Evidently, the two pairs of modes must have a common factor. Thus this behavior occurs due to intersection with a higher harmonic of a helical gap (e.g. ( $\Delta m$
,
$\Delta m$
, $\Delta n$
) = (2,1) and (4,2)). As with the counter-propagating case, an infinite number of gap crossings is possible by rescaling the numerator and denominator by the same integer.
$\Delta n$
) = (2,1) and (4,2)). As with the counter-propagating case, an infinite number of gap crossings is possible by rescaling the numerator and denominator by the same integer.
We now analyze the case of higher-order crossings at linear order. Since the behavior will differ for odd- and even-numbered crossings, we will discuss the examples of three-way and four-way crossings.
As an illustrative case, we first consider three degenerate frequencies, $\varPhi ^{(0)} = \alpha _i \varPhi _i^{(0)} + \alpha _j \varPhi _j^{(0)} + \alpha _k \varPhi _k^{(0)}$
. We define the mode number separations as
$\varPhi ^{(0)} = \alpha _i \varPhi _i^{(0)} + \alpha _j \varPhi _j^{(0)} + \alpha _k \varPhi _k^{(0)}$
. We define the mode number separations as $\Delta m_{i,j} = m_i - m_j$
and
$\Delta m_{i,j} = m_i - m_j$
and $\Delta n_{i,j} = n_i-n_j$
. Following a similar argument to § 4.1, the linear system determining the frequency shift is
$\Delta n_{i,j} = n_i-n_j$
. Following a similar argument to § 4.1, the linear system determining the frequency shift is
 \begin{align} \left [ \begin{array}{c@{\quad}c@{\quad}c} \lambda ^{(1)} & -\epsilon _{ij} \Delta _{ij} \overline {\omega }^{(0)}_j & -\epsilon _{ik} \Delta _{ik}\overline {\omega }^{(0)}_k \\[3pt] \epsilon _{ij}^* \Delta _{ij} \overline {\omega }^{(0)}_i & \lambda ^{(1)} & - \epsilon _{jk}\Delta _{jk}\overline {\omega }^{(0)}_k \\[3pt] \epsilon _{ik}^*\Delta _{ik}\overline {\omega }^{(0)}_i & \epsilon _{jk}^*\Delta _{jk}\overline {\omega }^{(0)}_j & \lambda ^{(1)} \end{array}\right ] \left [ \begin{array}{c} \alpha _i \\[3pt] \alpha _j \\[3pt] \alpha _k \end{array} \right ] = \left [ \begin{array}{c} 0 \\[3pt] 0 \\[3pt] 0 \end{array} \right ], \end{align}
where $\Delta _{ij} = \iota _0 \Delta m_{ij} - \Delta n_{ij}$
and
$\Delta _{ij} = \iota _0 \Delta m_{ij} - \Delta n_{ij}$
and $\epsilon _{ij} = \epsilon _{\Delta m_{ij}, \Delta n_{ij}/N_P}$
. Without loss of generality, we can assume that either all three unperturbed eigenfunctions are co-propagating,
$\epsilon _{ij} = \epsilon _{\Delta m_{ij}, \Delta n_{ij}/N_P}$
. Without loss of generality, we can assume that either all three unperturbed eigenfunctions are co-propagating, $\overline {\omega }^{(0)}_i = \overline {\omega }^{(0)}_j = \overline {\omega }^{(0)}_k$
, or two are co-propagating and the third is counter-propagating
$\overline {\omega }^{(0)}_i = \overline {\omega }^{(0)}_j = \overline {\omega }^{(0)}_k$
, or two are co-propagating and the third is counter-propagating $\overline {\omega }^{(0)}_i = -\overline {\omega }^{(0)}_j = \overline {\omega }^{(0)}_k$
. In the purely co-propagation case, the zero-determinant condition then reads
$\overline {\omega }^{(0)}_i = -\overline {\omega }^{(0)}_j = \overline {\omega }^{(0)}_k$
. In the purely co-propagation case, the zero-determinant condition then reads
 \begin{align} (\lambda ^{(1)} )^3 = 0, \end{align}
while in the case with counter-propagation
 \begin{align} \lambda ^{(1)} [(\lambda ^{(1)})^2 - 4 (\lambda ^{\!(0)} )^2 (|\epsilon _{jk}|^2 + |\epsilon _{ij}|^2 ) ] = 0. \end{align}
In either case, there remains at least one solution with no frequency shift, $\lambda ^{(1)} = 0$
. In the case with counter-propagation, there remains two solutions with a shifted frequency depending on the two harmonics of
$\lambda ^{(1)} = 0$
. In the case with counter-propagation, there remains two solutions with a shifted frequency depending on the two harmonics of $\epsilon$
which couple a pair of counter-propagating modes
$\epsilon$
which couple a pair of counter-propagating modes
 \begin{align} \Delta \overline {\omega } = 2\overline {\omega }^{(0)} \sqrt {|\epsilon _{jk}|^2 + |\epsilon _{ij}|^2}. \end{align}
However, at least one continuum eigenfunction will not be shifted in frequency and will appear to ‘cross the gap.’ A similar structure persists for higher-order crossings of an odd number. Since co-propagation cannot be avoided for odd crossings, not all crossings will be avoided.
To consider higher-order crossings of an even number, we now consider the case of a four-way degeneracy, $\varPhi ^{(0)} = \alpha _i \varPhi _i^{(0)} + \alpha _j \varPhi _j^{(0)} + \alpha _k \varPhi _k^{(0)} + \alpha _l \varPhi _l^{(0)}$
. Without loss of generality, we can consider three possibilities: all modes are co-propagating (
$\varPhi ^{(0)} = \alpha _i \varPhi _i^{(0)} + \alpha _j \varPhi _j^{(0)} + \alpha _k \varPhi _k^{(0)} + \alpha _l \varPhi _l^{(0)}$
. Without loss of generality, we can consider three possibilities: all modes are co-propagating ( $\overline {\omega }^{(0)}_i = \overline {\omega }^{(0)}_j = \overline {\omega }^{(0)}_k = \overline {\omega }^{(0)}_l$
), three are co-propagating and one is counter-propagating with the others (
$\overline {\omega }^{(0)}_i = \overline {\omega }^{(0)}_j = \overline {\omega }^{(0)}_k = \overline {\omega }^{(0)}_l$
), three are co-propagating and one is counter-propagating with the others ( $\overline {\omega }^{(0)}_i = -\overline {\omega }^{(0)}_j = -\overline {\omega }^{(0)}_k = -\overline {\omega }^{(0)}_l$
) and two pairs are counter-propagating (
$\overline {\omega }^{(0)}_i = -\overline {\omega }^{(0)}_j = -\overline {\omega }^{(0)}_k = -\overline {\omega }^{(0)}_l$
) and two pairs are counter-propagating ( $\overline {\omega }^{(0)}_i = -\overline {\omega }^{(0)}_j = \overline {\omega }^{(0)}_k = - \overline {\omega }^{(0)}_l$
). In the first case, the zero-determinant condition reads
$\overline {\omega }^{(0)}_i = -\overline {\omega }^{(0)}_j = \overline {\omega }^{(0)}_k = - \overline {\omega }^{(0)}_l$
). In the first case, the zero-determinant condition reads $(\lambda ^{(1)} )^4 = 0$
, and again, no frequency shift results. In the case of three co-propagating modes, the frequency shifts satisfy
$(\lambda ^{(1)} )^4 = 0$
, and again, no frequency shift results. In the case of three co-propagating modes, the frequency shifts satisfy
 \begin{align} (\lambda ^{(1)} )^2 [(\lambda ^{(1)} )^2 - 4 (\lambda ^{\!(0)})^2 (|\epsilon _{ij}|^2 + |\epsilon _{ik}|^2 + |\epsilon _{il}|^2 )] = 0. \end{align}
Here, two of the frequencies are shifted according to harmonics of $\epsilon$
which couple two counter-propagating modes, analogous to (4.22)
$\epsilon$
which couple two counter-propagating modes, analogous to (4.22)
 \begin{align} \Delta \overline {\omega } = 2\overline {\omega }^{(0)}\sqrt {|\epsilon _{ij}|^2 + |\epsilon _{ik}|^2 + |\epsilon _{il}|^2}, \end{align}
while the other two frequencies are not shifted by the perturbation. Finally, we consider the case of two pairs of counter-propagating modes
 \begin{multline} (\lambda ^{(1)} )^2 = 4 (\lambda ^{\!(0)} )^2 \big (\left [|\epsilon _{ij}|^2 + |\epsilon _{il}|^2 + |\epsilon _{jk}|^2 + |\epsilon _{kl}|^2\right ] \nonumber \\ \pm \sqrt {\left (|\epsilon _{ij}|^2 + |\epsilon _{il}|^2 + |\epsilon _{jk}|^2 + |\epsilon _{kl}|^2\right )^2 - 4|\epsilon _{il} \epsilon _{jk}^* - \epsilon _{ij} \epsilon _{kl}|^2}\big ),\tag{4.25} \end{multline}
and all solutions enable frequency shift by harmonics of $\epsilon$
that couple counter-propagating modes. Note that there are now two solutions for the gap width, and each counter-propagating pair is shifted by a distinct width
$\epsilon$
that couple counter-propagating modes. Note that there are now two solutions for the gap width, and each counter-propagating pair is shifted by a distinct width
 \begin{multline} \left (\Delta \overline {\omega }\right )_{\pm } = 2 \overline {\omega }^{(0)} \big (\left [|\epsilon _{ij}|^2 + |\epsilon _{il}|^2 + |\epsilon _{jk}|^2 + |\epsilon _{kl}|^2\right ] \nonumber \\ \pm \sqrt {\left (|\epsilon _{ij}|^2 + |\epsilon _{il}|^2 + |\epsilon _{jk}|^2 + |\epsilon _{kl}|^2\right )^2 - 4|\epsilon _{il} \epsilon _{jk}^* - \epsilon _{ij} \epsilon _{kl}|^2}\big )^{1/2}.\tag{4.26} \end{multline}
The effective gap width will be the smaller of these two solutions, since this is the region in which continuum damping can be avoided. In the limit that only $\epsilon _{ij}$
and
$\epsilon _{ij}$
and $\epsilon _{kl}$
are non-zero, enabling coupling between these two counter-propagating pairs, the gap width solutions reduce to
$\epsilon _{kl}$
are non-zero, enabling coupling between these two counter-propagating pairs, the gap width solutions reduce to $\Delta \overline {\omega } = 2 \overline {\omega }^{(0)}|\epsilon _{ij}|$
,
$\Delta \overline {\omega } = 2 \overline {\omega }^{(0)}|\epsilon _{ij}|$
, $2 \overline {\omega }^{(0)}|\epsilon _{kl}|$
, as is consistent with (4.16). See figure 3 for a schematic diagram.
$2 \overline {\omega }^{(0)}|\epsilon _{kl}|$
, as is consistent with (4.16). See figure 3 for a schematic diagram.
Schematic diagrams of higher-order crossings. Here, red indicates $\overline {\omega }^{(0)}\gt 0$
and black indicates
$\overline {\omega }^{(0)}\gt 0$
and black indicates $\overline {\omega }^{(0)}\lt 0$
. In (a), there is a three-way crossing at
$\overline {\omega }^{(0)}\lt 0$
. In (a), there is a three-way crossing at $\overline {\omega }^{(0)}$
. The counter-propagating pair (dashed lines) is shifted by the perturbation, forming the gap indicated by the green shaded region. The solid red line is unshifted by the perturbation and appears to cross the gap. In (b), there is a four-way crossing at
$\overline {\omega }^{(0)}$
. The counter-propagating pair (dashed lines) is shifted by the perturbation, forming the gap indicated by the green shaded region. The solid red line is unshifted by the perturbation and appears to cross the gap. In (b), there is a four-way crossing at $\overline {\omega }^{(0)}$
. The two counter-propagating pairs are both shifted by the perturbation, forming gaps of different widths, indicated by the shaded regions. The effective gap, where continuum damping is minimized, is the region of overlap between the two gaps.
$\overline {\omega }^{(0)}$
. The two counter-propagating pairs are both shifted by the perturbation, forming gaps of different widths, indicated by the shaded regions. The effective gap, where continuum damping is minimized, is the region of overlap between the two gaps.

To summarize, higher-order crossings are allowed in 3-D configurations due to coupling between modes with $\Delta m \ne 0$
and
$\Delta m \ne 0$
and $\Delta n \ne 0$
. If all of the degenerate eigenfunctions are co-propagating, then no frequency shift is present. If some modes are counter-propagating, then there will exist a frequency shift related to the harmonics of
$\Delta n \ne 0$
. If all of the degenerate eigenfunctions are co-propagating, then no frequency shift is present. If some modes are counter-propagating, then there will exist a frequency shift related to the harmonics of $\epsilon$
which couple the counter-propagating modes. For an odd-numbered crossing, at least one degenerate mode frequency will not be shifted, while for an even-numbered crossing, it is possible for all frequencies to be shifted by the perturbation if every eigenfunction is in a counter-propagating pair. This behavior will be shown in numerical continuum solutions in § 5.3.
$\epsilon$
which couple the counter-propagating modes. For an odd-numbered crossing, at least one degenerate mode frequency will not be shifted, while for an even-numbered crossing, it is possible for all frequencies to be shifted by the perturbation if every eigenfunction is in a counter-propagating pair. This behavior will be shown in numerical continuum solutions in § 5.3.
4.4. Behavior away from magnetic axis
In this section, we relax the near-axis assumption to evaluate behavior away from the axis. From (2.3), two coupling parameters now arise in the continuum equation
 \begin{align} \left (\frac {\partial }{\partial \zeta } + \iota \frac {\partial }{\partial \theta } \right ) \left [(1 + \epsilon _1) \left (\frac {\partial }{\partial \zeta } + \iota \frac {\partial }{\partial \theta } \right ) \varPhi \right ] + \overline {\omega }^2 (1 + \epsilon _2) \varPhi = 0, \end{align}
with
 \begin{align} \left \{ \begin{array}{l} \epsilon _1 = \dfrac {|\boldsymbol{\nabla} \psi |^2}{\langle |\boldsymbol{\nabla} \psi |^2\rangle } -1 ,\\[12pt] \epsilon _2 = \dfrac {|\boldsymbol{\nabla} \psi |^2/B^4}{\langle |\boldsymbol{\nabla} \psi |^2/B^4 \rangle } - 1 ,\end{array} \right . \end{align}
and $\overline {\omega } = \omega /\omega _A$
, defined by
$\overline {\omega } = \omega /\omega _A$
, defined by $\omega _A = \langle B\rangle ^2/(G+\iota I)\sqrt {\mu _0 \rho })$
. A similar perturbative analysis can be performed as described in § 4.1, where now the two coupling parameters are assumed to be small,
$\omega _A = \langle B\rangle ^2/(G+\iota I)\sqrt {\mu _0 \rho })$
. A similar perturbative analysis can be performed as described in § 4.1, where now the two coupling parameters are assumed to be small, $|\epsilon _1| \ll 1$
and
$|\epsilon _1| \ll 1$
and $|\epsilon _2| \ll 1$
. The unperturbed frequencies are then given by
$|\epsilon _2| \ll 1$
. The unperturbed frequencies are then given by
 \begin{align} \left \rvert \overline {\omega }^{(0)} \right \rvert = \left \rvert \frac {\iota \Delta m - \Delta n}{2} \right \rvert . \end{align}
Again, at linear order, a frequency shift only arises in the degenerate counter-propagating case, given by
 \begin{align} \Delta \overline {\omega } = \overline {\omega }^{(0)} \sqrt {|\epsilon _1^{\Delta m,\Delta n/N_P}|^2 + |\epsilon _2^{\Delta m,\Delta n/N_P}|^2}, \end{align}
where $\epsilon _{1,2}^{\Delta m,\Delta n/N_P}$
are defined analogously to (3.8). In this way, the region of avoided crossings persists away from the axis, with the central gap frequency depending on the rotational transform through (4.29).
$\epsilon _{1,2}^{\Delta m,\Delta n/N_P}$
are defined analogously to (3.8). In this way, the region of avoided crossings persists away from the axis, with the central gap frequency depending on the rotational transform through (4.29).
The coupling parameters can now be estimated by proceeding to next order in the near-axis expansion
 \begin{align} \renewcommand *{\arraystretch } \left \{ \begin{array}{l} |\boldsymbol{\nabla} \psi |^2/r^2 = \Psi _2 + \Psi _3 r + \mathcal{O}(r^2), \\ |\boldsymbol{\nabla} \psi |^2/(r^2 B^4) = \Psi _2 (1 - 4 r \overline {\eta } \cos (\chi )) + r \Psi _3 +\mathcal{O}(r^2) .\end{array} \right . \end{align}
According to the discussion in Appendix C, the geometric parameter $\Psi _3$
is driven by higher-order shaping components, such as triangularity and the Shafranov shift. With the
$\Psi _3$
is driven by higher-order shaping components, such as triangularity and the Shafranov shift. With the $\cos (\theta )$
and
$\cos (\theta )$
and $\cos (3\theta )$
dependence of
$\cos (3\theta )$
dependence of $\Psi _3$
, the TAE (
$\Psi _3$
, the TAE ( $\Delta m =1$
) and non-circular-triangularity-induced Alfvén eigenmode (NAE) (
$\Delta m =1$
) and non-circular-triangularity-induced Alfvén eigenmode (NAE) ( $\Delta m = 3$
) (Kramer et al. Reference Kramer, Saigusa, Ozeki, Kusama, Kimura, Oikawa, Tobita, Fu and Cheng1998) gaps are driven. These same gaps are also driven through the beating of the
$\Delta m = 3$
) (Kramer et al. Reference Kramer, Saigusa, Ozeki, Kusama, Kimura, Oikawa, Tobita, Fu and Cheng1998) gaps are driven. These same gaps are also driven through the beating of the $\cos (2\chi )$
dependence of
$\cos (2\chi )$
dependence of $\Psi _2$
and the
$\Psi _2$
and the $\cos (\chi )$
in the above expression. Through numerical examples in § 7, we will see the formation of the TAE and NAE in continuum solutions away from the magnetic axis.
$\cos (\chi )$
in the above expression. Through numerical examples in § 7, we will see the formation of the TAE and NAE in continuum solutions away from the magnetic axis.
4.5. Summary
To summarize, through perturbative analysis under the assumption of smallness of the coupling parameter in the continuum equation, frequency shifts of counter-propagating continuum modes are computed. This enables the identification of the location (4.5) and width (4.16) of spectral gaps and their relation to the near-axis QS geometry described in § 3. Even if counter-propagation enables the formation of a continuum gap, co-propagation remains a possibility for helical gaps, for which $\Delta m \ne 0$
and
$\Delta m \ne 0$
and $\Delta n \ne 0$
. This may result in continuum modes which appear to ‘cross the gap.’ The theory has been extended to evaluate cases for which the degeneracy is not lifted at first order in
$\Delta n \ne 0$
. This may result in continuum modes which appear to ‘cross the gap.’ The theory has been extended to evaluate cases for which the degeneracy is not lifted at first order in $\epsilon$
, resulting in the phenomena of gaps formed due to coupling of different harmonics of
$\epsilon$
, resulting in the phenomena of gaps formed due to coupling of different harmonics of $\epsilon$
. We also assess higher-order frequency crossings that may exist in 3-D configurations. In the case of an odd-numbered crossing, there remains at least one frequency that is unshifted and may appear to cross through the gap. We find that several coupling parameters may contribute to the frequency width in the case of such higher-order crossings. Finally, we extend the theory away from the magnetic axis to account for higher-order contributions of the flux-surface shaping and field strength variation.
$\epsilon$
. We also assess higher-order frequency crossings that may exist in 3-D configurations. In the case of an odd-numbered crossing, there remains at least one frequency that is unshifted and may appear to cross through the gap. We find that several coupling parameters may contribute to the frequency width in the case of such higher-order crossings. Finally, we extend the theory away from the magnetic axis to account for higher-order contributions of the flux-surface shaping and field strength variation.
5. Numerical continuum calculations
We now validate the predictions based on perturbation theory in § 4.1 through numerical solutions of (3.7) for near-axis configurations of interest. The continuum equation is solved using a Fourier Galerkin method, similar to the STELLGAP code (Spong et al. Reference Spong, Sanchez and Weller2003). The expression for the coupling parameter (3.6) is evaluated using pyQSC (Landreman Reference Landreman2024) for near-axis configurations fitted to known equilibria. Since it is not possible to discern gap locations by computing the continuum at a single radial point (since an avoided crossing is likely not to occur at that radial grid point), we evaluate the continuum for a uniform grid corresponding to the range of $\iota$
of interest. The range of
$\iota$
of interest. The range of $\iota$
is chosen to be large enough that a sufficient number of crossings and avoided crossings can be visualized. Given the low magnetic shear of typical optimized stellarators, the range of
$\iota$
is chosen to be large enough that a sufficient number of crossings and avoided crossings can be visualized. Given the low magnetic shear of typical optimized stellarators, the range of $\iota$
will be relatively small for the following calculations. The geometric parameter
$\iota$
will be relatively small for the following calculations. The geometric parameter $\epsilon$
is computed from the same leading-order coupling,
$\epsilon$
is computed from the same leading-order coupling, $\Psi _2$
, for the range of
$\Psi _2$
, for the range of $\iota$
. Note that, for all of the following calculations, the normalized frequency,
$\iota$
. Note that, for all of the following calculations, the normalized frequency, $\overline {\omega } = \omega /\omega _A$
, is shown, a quantity that is independent of the choice of density profile.
$\overline {\omega } = \omega /\omega _A$
, is shown, a quantity that is independent of the choice of density profile.
5.1. Fourier mode number choice
For numerical efficiency, we choose our set of Fourier basis functions in order to provide sufficient resolution of the low-frequency behavior of interest (Nührenberg Reference Nührenberg1999; Spong et al. Reference Spong, Sanchez and Weller2003). Since (4.2) provides an approximate relation between the mode numbers and frequency of a continuum eigenfunction, the set of poloidal and toroidal mode numbers $m$
and
$m$
and $n$
included in the spectrum can be chosen strategically. In order to resolve the frequency range
$n$
included in the spectrum can be chosen strategically. In order to resolve the frequency range $\overline {\omega }_0 \in [-|\overline {\omega }_0|_{\max },+|\overline {\omega }_0|_{\max }]$
, for a given range of
$\overline {\omega }_0 \in [-|\overline {\omega }_0|_{\max },+|\overline {\omega }_0|_{\max }]$
, for a given range of $m$
, the set of
$m$
, the set of $n$
between
$n$
between $-|\overline {\omega }_0|_{\max } + \iota _{\min }m$
and
$-|\overline {\omega }_0|_{\max } + \iota _{\min }m$
and $|\overline {\omega }_0|_{\max } + \iota _{\max }m$
is included, where
$|\overline {\omega }_0|_{\max } + \iota _{\max }m$
is included, where $\iota _{\min }$
and
$\iota _{\min }$
and $\iota _{\max }$
are the minimum and maximum values of the rotational transform to be studied. All toroidal mode numbers
$\iota _{\max }$
are the minimum and maximum values of the rotational transform to be studied. All toroidal mode numbers $n$
are chosen to belong to the same mode family: a set of toroidal mode numbers that differ by integer multiples of
$n$
are chosen to belong to the same mode family: a set of toroidal mode numbers that differ by integer multiples of $N_P$
. (For example, the
$N_P$
. (For example, the $n = 0$
mode family contains the toroidal mode numbers
$n = 0$
mode family contains the toroidal mode numbers $0, \pm N_P, \pm 2 N_P$
, etc.) The resolution parameter
$0, \pm N_P, \pm 2 N_P$
, etc.) The resolution parameter $|\overline {\omega }_0|_{\max }$
is adjusted to ensure the frequency range of interest is resolved. With this choice of Fourier modes, one can more efficiently resolve the eigenmode structure than by using the same range of
$|\overline {\omega }_0|_{\max }$
is adjusted to ensure the frequency range of interest is resolved. With this choice of Fourier modes, one can more efficiently resolve the eigenmode structure than by using the same range of $n$
for all
$n$
for all $m$
. Furthermore, by reducing the range of frequencies resolved, the condition number of the discretized problem is reduced.
$m$
. Furthermore, by reducing the range of frequencies resolved, the condition number of the discretized problem is reduced.
On the other hand, the choice of $m_{\max }$
could impact the behavior of the continuum within the frequency range of interest. While the qualitative features of the continuum should remain with increasing
$m_{\max }$
could impact the behavior of the continuum within the frequency range of interest. While the qualitative features of the continuum should remain with increasing $m_{\max }$
, true convergence cannot be expected. When adding
$m_{\max }$
, true convergence cannot be expected. When adding $m$
modes, additional eigenfunctions are expected to be present in the low-frequency region, enabling additional crossings and avoided crossings. While avoided crossings of the same type are expected to persist within the same gap region, there may arise continuum-crossing modes due to an odd-numbered crossing, as described in § 4.3. Thus, when adjusting this parameter, we do not expect the precise structure of the continuum to remain unchanged. However, the qualitative features, such as the characteristic width between avoided crossings, should be retained with increasing resolution. Further discussion of numerical aspects of solving the continuum equation will be provided in a follow-up paper.
$m$
modes, additional eigenfunctions are expected to be present in the low-frequency region, enabling additional crossings and avoided crossings. While avoided crossings of the same type are expected to persist within the same gap region, there may arise continuum-crossing modes due to an odd-numbered crossing, as described in § 4.3. Thus, when adjusting this parameter, we do not expect the precise structure of the continuum to remain unchanged. However, the qualitative features, such as the characteristic width between avoided crossings, should be retained with increasing resolution. Further discussion of numerical aspects of solving the continuum equation will be provided in a follow-up paper.
5.2. Gap width validation
We now validate the gap width presented in § 4.1 using a near-axis QH configuration fit to the Wistell-A equilibrium (Bader et al. Reference Bader2020). The continuum equation (3.7) is solved using the near-axis geometry, but with the full range of $\iota$
in the equilibria in order to more clearly visualize the continuum structure. The modes, visualized in figure 4 as blue dots, are selected using
$\iota$
in the equilibria in order to more clearly visualize the continuum structure. The modes, visualized in figure 4 as blue dots, are selected using $|\overline {\omega }_0|_{\max } = 2 N_P$
,
$|\overline {\omega }_0|_{\max } = 2 N_P$
, $m_{\max } = 30$
and 40, and mode family 0. When
$m_{\max } = 30$
and 40, and mode family 0. When $m_{\max } = 30$
, only modes within the yellow shaded box are included, while all visualized modes are included when
$m_{\max } = 30$
, only modes within the yellow shaded box are included, while all visualized modes are included when $m_{\max } = 40$
.
$m_{\max } = 40$
.
The continuum is computed for a near-axis Wistell-A configuration (Bader et al. Reference Bader2020) using the Fourier spectral basis with mode numbers indicated in the figure, using the mode choice scheme with $m_{\max } = 40$
. The yellow shaded region corresponds with the set of modes include in the calculations labeled
$m_{\max } = 40$
. The yellow shaded region corresponds with the set of modes include in the calculations labeled $m_{\max } = 30$
in figure 5.
$m_{\max } = 30$
in figure 5.

The computed continuum eigenmode frequencies are shown in figure 5. Here, the color scale indicates the dominant poloidal mode number of the corresponding eigenfunction while the shaded colored regions indicate the theoretically predicted gaps. Since the theory was developed in the small $\epsilon$
limit, the continuum is shown with
$\epsilon$
limit, the continuum is shown with $\epsilon$
scaled by constant factors of 0.25 and 0.5 in addition to the unscaled value. There is good agreement between the continuum gaps and predicted gaps, especially for smaller
$\epsilon$
scaled by constant factors of 0.25 and 0.5 in addition to the unscaled value. There is good agreement between the continuum gaps and predicted gaps, especially for smaller $\epsilon$
. Note that the HAE (4,2) gap arises due to coupling between the
$\epsilon$
. Note that the HAE (4,2) gap arises due to coupling between the $\delta m = 2, \delta n = 1$
harmonics of
$\delta m = 2, \delta n = 1$
harmonics of $\epsilon$
according to § 4.2, since the near-axis spectral content of
$\epsilon$
according to § 4.2, since the near-axis spectral content of $\epsilon$
does not contain
$\epsilon$
does not contain $\delta m = 4$
harmonics. As
$\delta m = 4$
harmonics. As $\epsilon$
is increased, the EAE and HAE (2,1) gaps begin to cross each other, and the EAE gap is displaced away from its predicted position. This is indicative of gap repulsion discussed in the literature (Kolesnichenko et al. Reference Kolesnichenko, Lutsenko, Wobig, Yakovenko and Fesenyuk2001). While continuum gaps are apparent, we note the presence of eigenmodes which cross the gaps. For example, there is an eigenmode with dominant Fourier mode numbers
$\epsilon$
is increased, the EAE and HAE (2,1) gaps begin to cross each other, and the EAE gap is displaced away from its predicted position. This is indicative of gap repulsion discussed in the literature (Kolesnichenko et al. Reference Kolesnichenko, Lutsenko, Wobig, Yakovenko and Fesenyuk2001). While continuum gaps are apparent, we note the presence of eigenmodes which cross the gaps. For example, there is an eigenmode with dominant Fourier mode numbers $n = 32$
,
$n = 32$
, $m = 20$
mode that crosses the HAE (2,1) gap near
$m = 20$
mode that crosses the HAE (2,1) gap near $\iota = 1.135$
. When the resolution is increased to
$\iota = 1.135$
. When the resolution is increased to $m_{\max } = 40$
, this eigenmode couples with an eigenmode dominated by
$m_{\max } = 40$
, this eigenmode couples with an eigenmode dominated by $n = 36$
,
$n = 36$
, $m = 31$
to avoid crossing. However, in its place an
$m = 31$
to avoid crossing. However, in its place an $n = 44$
,
$n = 44$
, $m = 40$
eigenmode crosses the gap. This behavior highlights that such continuum-crossing modes are an artifact of resolution choice and should not inhibit the identification of spectral gaps.
$m = 40$
eigenmode crosses the gap. This behavior highlights that such continuum-crossing modes are an artifact of resolution choice and should not inhibit the identification of spectral gaps.
The continuum is computed for a near-axis Wistell-A configuration (Bader et al. Reference Bader2020) using the Fourier spectral basis with mode numbers indicated in figure 4. In each of the continuum figures, the color scale indicates the dominant poloidal mode number of the eigenfunction while the colored shaded regions indicate the predicted spectral gaps.

5.3. Validation of higher-order crossings
In order to evaluate higher-order crossings, we compute the continuum for a near-axis configuration with parameters obtained from the Nührenberg and Zille QH configuration (Nührenberg & Zille Reference Nührenberg and Zille1988). The mode choice parameters $m_{\max } = 30$
and 40,
$m_{\max } = 30$
and 40, $|\overline {\omega }_0|_{\max } = 2 N_P$
, and mode family 0 are used. The continuum solution without coupling (
$|\overline {\omega }_0|_{\max } = 2 N_P$
, and mode family 0 are used. The continuum solution without coupling ( $\epsilon = 0$
, physically corresponding to the cylindrical limit) is shown in figures 6(a) and 6(b). Here, the color scale indicates the direction of propagation: red indicates
$\epsilon = 0$
, physically corresponding to the cylindrical limit) is shown in figures 6(a) and 6(b). Here, the color scale indicates the direction of propagation: red indicates $\overline {\omega }\gt 0$
while black indicates
$\overline {\omega }\gt 0$
while black indicates $\overline {\omega }\lt 0$
. A high-order crossing is evident at
$\overline {\omega }\lt 0$
. A high-order crossing is evident at $\iota = 1.5$
and
$\iota = 1.5$
and $\overline {\omega } = 1.5$
. This is the location for the intersection of the EAE and HAE (2,1) gaps. The continuum solutions for unscaled
$\overline {\omega } = 1.5$
. This is the location for the intersection of the EAE and HAE (2,1) gaps. The continuum solutions for unscaled $\epsilon$
are shown in figures 6(c) and 6(d), with predicted gap locations indicated by the colored shaded regions. Due to the interaction between the two gaps, the EAE gap is repelled away from the HAE gap, and the width of the HAE (2,1) gap is reduced at the gap intersection point. Note that as the resolution parameter
$\epsilon$
are shown in figures 6(c) and 6(d), with predicted gap locations indicated by the colored shaded regions. Due to the interaction between the two gaps, the EAE gap is repelled away from the HAE gap, and the width of the HAE (2,1) gap is reduced at the gap intersection point. Note that as the resolution parameter $m_{\max }$
is increased from 30 to 40, the crossing changes from odd numbered (15-way) to even numbered (20-way). As expected based on the discussion in § 4.3, in the odd-numbered crossing case, there remains one continuum-crossing eigenmode, while the remaining eigenmodes couple in counter-propagating pairs to avoid crossing the gap. In the even-numbered crossing case, all eigenmodes couple in counter-propagating pairs, and no continuum-crossing mode remains at this location. In this case, the counter-propagating pairs form nested gaps of different widths as anticipated. However, another continuum-crossing eigenmode arises around
$m_{\max }$
is increased from 30 to 40, the crossing changes from odd numbered (15-way) to even numbered (20-way). As expected based on the discussion in § 4.3, in the odd-numbered crossing case, there remains one continuum-crossing eigenmode, while the remaining eigenmodes couple in counter-propagating pairs to avoid crossing the gap. In the even-numbered crossing case, all eigenmodes couple in counter-propagating pairs, and no continuum-crossing mode remains at this location. In this case, the counter-propagating pairs form nested gaps of different widths as anticipated. However, another continuum-crossing eigenmode arises around $\iota = 1.43$
due to the behavior discussed in the previous section in relation to figure 5. Again, the presence of a continuum-crossing mode can be considered an artifact of the choice of Fourier mode numbers and should not inhibit the identification of a gap.
$\iota = 1.43$
due to the behavior discussed in the previous section in relation to figure 5. Again, the presence of a continuum-crossing mode can be considered an artifact of the choice of Fourier mode numbers and should not inhibit the identification of a gap.
The continuum is computed for a near-axis Nührenberg–Zille configuration (Nührenberg & Zille Reference Nührenberg and Zille1988). In each of the continuum figures, the color scale indicates the direction of eigenmode propagation: red indicates $\overline {\omega }\gt 0$
and black indicates
$\overline {\omega }\gt 0$
and black indicates $\overline {\omega }\lt 0$
. The colored shaded regions indicate the predicted spectral gaps.
$\overline {\omega }\lt 0$
. The colored shaded regions indicate the predicted spectral gaps.

5.4. Analysis of selected configurations
We now numerically compute the shear Alfvén continuum for the four near-axis configurations presented in § 3, shown in figure 7. The mode choice parameters $m_{\max } = 60$
,
$m_{\max } = 60$
, $|\overline {\omega }_0|_{\max } = 2 N_P$
and mode family 0 are used. For the HSX and Garabedian equilibria, the continuum is computed for the full range of rotational transforms. In the case of the precise QA and precise QH equilibria, the range of
$|\overline {\omega }_0|_{\max } = 2 N_P$
and mode family 0 are used. For the HSX and Garabedian equilibria, the continuum is computed for the full range of rotational transforms. In the case of the precise QA and precise QH equilibria, the range of $\iota$
is extended beyond the values in the equilibria in order to more clearly visualize the gap structure, given their low shear.
$\iota$
is extended beyond the values in the equilibria in order to more clearly visualize the gap structure, given their low shear.
Although the four configurations have similar magnitudes of the $\epsilon _{2,1}$
component (see table 1), we note that the width of the corresponding HAE (2,1) gap is significantly larger in the QH configurations. This can be explained by the scaling of the gap width (4.16) with the central frequency (4.5), which is increased for QH configurations in comparison with QA configurations given their larger rotational transform and number of field periods. In both configurations, higher harmonics of the HAE (2,1) are also excited (e.g. HAE (4,2) and HAE (6,3)) due to the higher-order degeneracy effect discussed in § 4.2, given the large magnitude of
$\epsilon _{2,1}$
component (see table 1), we note that the width of the corresponding HAE (2,1) gap is significantly larger in the QH configurations. This can be explained by the scaling of the gap width (4.16) with the central frequency (4.5), which is increased for QH configurations in comparison with QA configurations given their larger rotational transform and number of field periods. In both configurations, higher harmonics of the HAE (2,1) are also excited (e.g. HAE (4,2) and HAE (6,3)) due to the higher-order degeneracy effect discussed in § 4.2, given the large magnitude of $\epsilon _{2, 1}$
. This effect is more prominent in the QH configurations, given the larger central frequency of these gaps.
$\epsilon _{2, 1}$
. This effect is more prominent in the QH configurations, given the larger central frequency of these gaps.
The elliptical $\epsilon _{2,0}$
and mirror
$\epsilon _{2,0}$
and mirror $\epsilon _{0,1}$
spectral components are more substantial in the QA configurations than the QH configurations, given their toroidal variation of the elongation and curvature. However, the EAE and MAE gaps are visible in all configurations due to scaling of the gap width with the central frequency. The EAE central gap frequency is magnified in the larger
$\epsilon _{0,1}$
spectral components are more substantial in the QA configurations than the QH configurations, given their toroidal variation of the elongation and curvature. However, the EAE and MAE gaps are visible in all configurations due to scaling of the gap width with the central frequency. The EAE central gap frequency is magnified in the larger $\iota$
QH configurations. Similarly, the central frequency of the MAE gap is magnified in the QH configurations given their larger values of
$\iota$
QH configurations. Similarly, the central frequency of the MAE gap is magnified in the QH configurations given their larger values of $N_P$
. The implications of these general trends for resonance with EPs will be discussed in § 6. In a follow-up paper, we will extend this comparison to the SAW continuum computed from optimized stellarator equilibria rather than a near-axis model.
$N_P$
. The implications of these general trends for resonance with EPs will be discussed in § 6. In a follow-up paper, we will extend this comparison to the SAW continuum computed from optimized stellarator equilibria rather than a near-axis model.
The continuum is evaluated for the four near-axis configurations discussed in § 3. Here, the color scale indicates the dominant poloidal mode number of the eigenfunction. The dominant spectral gaps are labeled based on visual inspection of the frequency interactions.

6. Resonance condition for a gap Alfvén eigenmode
Given the formation of continuum gaps, there is potential for global Alfvén eigenmodes described by (2.1) to be driven unstable by resonant interaction with EPs. Such AE gap modes are typically dominated by the continuum mode numbers which couple to produce the gap (Cheng & Chance Reference Cheng and Chance1986; Betti & Freidberg Reference Betti and Freidberg1991). We now evaluate the passing alpha particle resonance condition to assess the potential for instability of gap modes in QS devices. To avoid strong alpha transport, one might desire to suppress continuum gaps which could resonate with alphas from birth to thermalization. Since this would be quite geometrically restrictive, and since prompt losses are the most harmful, we first focus on the resonance condition at the birth energy.
The resonance condition for passing particles in the presence of a SAW with mode numbers $m$
and
$m$
and $n$
and frequency
$n$
and frequency $\omega$
reads (Paul, Mynick & Bhattacharjee Reference Paul, Mynick and Bhattacharjee2023)
$\omega$
reads (Paul, Mynick & Bhattacharjee Reference Paul, Mynick and Bhattacharjee2023)
 \begin{align} (m + l)\omega _{\theta } - (n + lN)\omega _{\zeta } + \omega = 0, \end{align}
where $l$
is a parameter that denotes sideband coupling through the drifts. Typically the resonance is strongest for
$l$
is a parameter that denotes sideband coupling through the drifts. Typically the resonance is strongest for $l = 0$
or
$l = 0$
or $\pm 1$
. Here,
$\pm 1$
. Here, $\omega _{\theta }$
and
$\omega _{\theta }$
and $\omega _{\zeta }$
are the averaged precession frequencies in the
$\omega _{\zeta }$
are the averaged precession frequencies in the $\theta$
and
$\theta$
and $\zeta$
directions. For simplicity, we consider the case of co- or counter-passing particles, for which
$\zeta$
directions. For simplicity, we consider the case of co- or counter-passing particles, for which $\omega _{\theta }/\omega _{\zeta } \approx \pm \iota$
. Assuming that the dominant modes numbers of the gap AE will correspond with the mode numbers of the degenerate continuum eigenfunctions, the counter-propagation condition (4.4) is used to obtain
$\omega _{\theta }/\omega _{\zeta } \approx \pm \iota$
. Assuming that the dominant modes numbers of the gap AE will correspond with the mode numbers of the degenerate continuum eigenfunctions, the counter-propagation condition (4.4) is used to obtain $\iota m - n = \pm (\iota \Delta m - \Delta n)/2$
. The AE frequency is also approximated by the central gap frequency,
$\iota m - n = \pm (\iota \Delta m - \Delta n)/2$
. The AE frequency is also approximated by the central gap frequency, $\omega \approx \pm \omega _A (\iota \Delta m - \Delta n)/2$
to obtain the resonance condition for co-passing particles
$\omega \approx \pm \omega _A (\iota \Delta m - \Delta n)/2$
to obtain the resonance condition for co-passing particles
 \begin{align} \left \rvert \frac {\omega _A}{\omega _{\zeta }} \right \rvert = \left \rvert 1 \pm \frac {2l(\iota - N)}{\iota \Delta m - \Delta n}\right \rvert , \end{align}
and counter-passing particles
 \begin{align} \left \rvert \frac {\omega _A}{\omega _{\zeta }} \right \rvert = \left \rvert 1 \pm \frac {4n + 2l(\iota + N)}{\iota \Delta m - \Delta n} \right \rvert . \end{align}
Taking parameters of the ARIES-CS (Najmabadi et al. Reference Najmabadi2008) QA reactor study ( $B = 5.86$
T,
$B = 5.86$
T, $n_i = 4.8 \times 10^{20}$
m
$n_i = 4.8 \times 10^{20}$
m $^{-3}$
) or the HSR418 Helias study (Beidler et al. Reference Beidler2001a
) (
$^{-3}$
) or the HSR418 Helias study (Beidler et al. Reference Beidler2001a
) ( $B = 5$
T,
$B = 5$
T, $n_i = 2.6 \times 10^{20}$
m
$n_i = 2.6 \times 10^{20}$
m $^{-3}$
), the Alfvén velocity is expected to be approximately
$^{-3}$
), the Alfvén velocity is expected to be approximately $v_A \approx 3 \times 10^6$
m s−1 in a stellarator reactor, compared with the alpha birth velocity of
$v_A \approx 3 \times 10^6$
m s−1 in a stellarator reactor, compared with the alpha birth velocity of $1.3 \times 10^7$
m s−1. Since
$1.3 \times 10^7$
m s−1. Since $\omega _A/\omega _{\zeta }$
will likely be smaller than 1, the resonance condition will be easiest to satisfy for
$\omega _A/\omega _{\zeta }$
will likely be smaller than 1, the resonance condition will be easiest to satisfy for $|l| = 1$
co-passing particles. (It is more challenging to satisfy the counter-passing condition, given the large mode numbers expected at fusion pilot plant (FPP),
$|l| = 1$
co-passing particles. (It is more challenging to satisfy the counter-passing condition, given the large mode numbers expected at fusion pilot plant (FPP), $n \sim 30$
(Gorelenkov et al. Reference Gorelenkov, Pinches and Toi2014).) The condition
$n \sim 30$
(Gorelenkov et al. Reference Gorelenkov, Pinches and Toi2014).) The condition $\omega _A/\omega _{\zeta } \lt 1$
with
$\omega _A/\omega _{\zeta } \lt 1$
with $|l| = 1$
implies
$|l| = 1$
implies
 \begin{align} |\iota - N| \lt |\iota \Delta m - \Delta n|. \end{align}
We now assess the potential for satisfying this condition in QS devices. First, we consider the case of QA configurations, for which $N = 0$
and typically
$N = 0$
and typically $\iota \lesssim 0.5$
(Landreman Reference Landreman2019). It is plausible to satisfy the resonance condition for HAE modes with
$\iota \lesssim 0.5$
(Landreman Reference Landreman2019). It is plausible to satisfy the resonance condition for HAE modes with $\Delta m \ge 1$
and
$\Delta m \ge 1$
and $\Delta n \ge N_P$
, MAE modes with
$\Delta n \ge N_P$
, MAE modes with $\Delta n \ge N_P$
and EAE modes with
$\Delta n \ge N_P$
and EAE modes with $\Delta m = 2$
and
$\Delta m = 2$
and $\Delta n =0$
. The TAE modes with
$\Delta n =0$
. The TAE modes with $\Delta m = 1$
and
$\Delta m = 1$
and $\Delta n = 0$
are less likely to satisfy the resonance condition. Overall, the passing resonance is challenging to avoid in QA configurations.
$\Delta n = 0$
are less likely to satisfy the resonance condition. Overall, the passing resonance is challenging to avoid in QA configurations.
Next, we consider the case of QH configurations, for which $N \approx 4-5$
and
$N \approx 4-5$
and $\iota \approx 1-1.5$
(Landreman Reference Landreman2019). Satisfying the resonance condition would requires a gap mode with
$\iota \approx 1-1.5$
(Landreman Reference Landreman2019). Satisfying the resonance condition would requires a gap mode with $\Delta m \ge 3$
and
$\Delta m \ge 3$
and $\Delta n = 0$
, an MAE mode with
$\Delta n = 0$
, an MAE mode with $\Delta n \ge N_P$
or some HAE modes with
$\Delta n \ge N_P$
or some HAE modes with $\Delta m \gt 0$
,
$\Delta m \gt 0$
, $\Delta n \gt 2 N_P$
. However, it is challenging to satisfy this resonance condition for EAE or the
$\Delta n \gt 2 N_P$
. However, it is challenging to satisfy this resonance condition for EAE or the $(2,1)$
HAE mode.
$(2,1)$
HAE mode.
In summary, there are several avenues to avoiding passing resonances. First, high-density operation reduces $\omega _A$
, making the passing resonance condition more challenging to achieve. Furthermore, it appears more challenging to satisfy the gap resonance condition in QH configurations, since resonance with modes residing in the wide EAE or HAE (2,1) gaps are weaker. Finally, as discussed in the next section, the flux-surface geometry can be manipulated to avoid strong resonances associated with high-frequency gaps. We remark that as the gaps are moved to lower frequency, there may be modification to the shear Alfvén continuum due to the sound wave coupling, since
$\omega _A$
, making the passing resonance condition more challenging to achieve. Furthermore, it appears more challenging to satisfy the gap resonance condition in QH configurations, since resonance with modes residing in the wide EAE or HAE (2,1) gaps are weaker. Finally, as discussed in the next section, the flux-surface geometry can be manipulated to avoid strong resonances associated with high-frequency gaps. We remark that as the gaps are moved to lower frequency, there may be modification to the shear Alfvén continuum due to the sound wave coupling, since $v_A/c_s \approx 0.3$
, where
$v_A/c_s \approx 0.3$
, where $c_s$
is the sound speed, using the above mentioned reactor parameters with
$c_s$
is the sound speed, using the above mentioned reactor parameters with $T= 10$
keV. Furthermore, there may be resonances with alphas as they slow down, but such induced transport will be less deleterious.
$T= 10$
keV. Furthermore, there may be resonances with alphas as they slow down, but such induced transport will be less deleterious.
7. A pathway toward continuum optimization
Given the immense freedom in the stellarator design space, we now discuss a potential design criterion to reduce resonance with gap AE modes. Because of the close connection between AE gaps and flux-surface geometry, this is a promising pathway toward optimization of stellarators for improved AE stability. While it is likely impossible to eliminate all spectral gaps, since this would require $|\boldsymbol{\nabla} \psi |^2$
to be a constant function on magnetic surfaces, the spectral gaps can be strategically manipulated to avoid strong resonances that would drive prompt losses near the birth energy. Since the passing resonance condition with
$|\boldsymbol{\nabla} \psi |^2$
to be a constant function on magnetic surfaces, the spectral gaps can be strategically manipulated to avoid strong resonances that would drive prompt losses near the birth energy. Since the passing resonance condition with $\omega _A/\omega _{\zeta } \lt 1$
requires sufficiently large values of the normalized frequency at the center of the gap,
$\omega _A/\omega _{\zeta } \lt 1$
requires sufficiently large values of the normalized frequency at the center of the gap, $\omega /\omega _A \approx (\iota \Delta m - \Delta n)/2$
, one can attempt to close the gaps associated with high-frequency modes. A further motivation to promote low-frequency continuum gaps arises because the gap width is proportional to the gap frequency, as can be seen in (4.5).
$\omega /\omega _A \approx (\iota \Delta m - \Delta n)/2$
, one can attempt to close the gaps associated with high-frequency modes. A further motivation to promote low-frequency continuum gaps arises because the gap width is proportional to the gap frequency, as can be seen in (4.5).
We perform fixed-boundary optimization of the vacuum QH Wistell-A equilibrium (Bader et al. Reference Bader2020) with the following objective function depending on the plasma boundary $S_P$
:
$S_P$
:
 \begin{align} f(S_P) = \left (A(S_P)-A^*\right )^2 + f_{QS}(S_P) + f_{\iota }(S_P) + f_{\text{cont}}(S_P). \end{align}
Here, $A(S_P)$
is the aspect ratio and
$A(S_P)$
is the aspect ratio and $A^* = 6.7$
is the target aspect ratio (same as the initial equilibrium). The function
$A^* = 6.7$
is the target aspect ratio (same as the initial equilibrium). The function $f_{\textit{QS}}$
is the quasisymmetry error (Landreman & Paul Reference Landreman and Paul2022; Rodriguez, Paul & Bhattacharjee Reference Rodriguez, Paul and Bhattacharjee2022)
$f_{\textit{QS}}$
is the quasisymmetry error (Landreman & Paul Reference Landreman and Paul2022; Rodriguez, Paul & Bhattacharjee Reference Rodriguez, Paul and Bhattacharjee2022)
 \begin{align} f_{QS} = \sum _s \left \langle \left (\frac {1}{B^3} \left [(N-\iota ) \boldsymbol{B} \times \boldsymbol{\nabla} B \boldsymbol{\cdot} \boldsymbol{\nabla} \psi - (G + NI) \boldsymbol{B}\boldsymbol{\cdot} \boldsymbol{\nabla} B\right ] \right )^2 \right \rangle , \end{align}
where $N = 4$
is the quasisymmetry helicity. The function
$N = 4$
is the quasisymmetry helicity. The function $f_{\iota }$
prevents the rotational transform from getting too close to the
$f_{\iota }$
prevents the rotational transform from getting too close to the $\iota = 1$
resonance (Landreman et al. Reference Landreman, Buller and Drevlak2022)
$\iota = 1$
resonance (Landreman et al. Reference Landreman, Buller and Drevlak2022)
 \begin{align} f_{\iota } = \sum _s |\min (|\iota |-1.03,0)|^2. \end{align}
The function $f_{\text{cont}}$
prevents the formation of high-frequency gaps that can satisfy the resonance condition (6.4)
$f_{\text{cont}}$
prevents the formation of high-frequency gaps that can satisfy the resonance condition (6.4)
 \begin{align} f_{\text{cont}} = \sum _s \sum _{|\iota \delta m - N_P\delta n| \gt |\iota - 4|} |\epsilon _1^{\delta m,\delta n}|^2 \left (\iota \delta m - N_P \delta n \right )^2. \end{align}
The gap width (4.16) associated with mode numbers ( $\delta m$
,
$\delta m$
, $\delta n$
) is proportional to
$\delta n$
) is proportional to $\overline {\omega }^{(0)}|\epsilon _1^{\delta m,\delta n}|^2$
, where the central gap frequency is
$\overline {\omega }^{(0)}|\epsilon _1^{\delta m,\delta n}|^2$
, where the central gap frequency is $\overline {\omega }^{(0)} = |\iota \delta m - N_P\delta n|/2$
. Thus the objective function quantifies the squared gap width for each (
$\overline {\omega }^{(0)} = |\iota \delta m - N_P\delta n|/2$
. Thus the objective function quantifies the squared gap width for each ( $\delta m$
,
$\delta m$
, $\delta n$
) that could satisfy the resonance condition.
$\delta n$
) that could satisfy the resonance condition.
At each function evaluation, a fixed-boundary VMEC is computed with the prescribed plasma boundary (Hirshman & Whitson Reference Hirshman and Whitson1983). A Boozer transformation is performed with booz_xform (Sanchez et al. Reference Sanchez, Hirshman, Ware, Berry and Spong2000), and a Fourier transform of $\epsilon _1$
(4.28) is computed analogously to (3.8). The optimized configuration obtained with SIMSOPT (Landreman et al. Reference Landreman, Medasani, Wechsung, Giuliani, Jorge and Zhu2021) is compared with the Wistell-A configuration in figure 8. We note that the level of quasisymmetry error is roughly maintained, while the shear in the rotational transform is significantly reduced. The spectral content of
$\epsilon _1$
(4.28) is computed analogously to (3.8). The optimized configuration obtained with SIMSOPT (Landreman et al. Reference Landreman, Medasani, Wechsung, Giuliani, Jorge and Zhu2021) is compared with the Wistell-A configuration in figure 8. We note that the level of quasisymmetry error is roughly maintained, while the shear in the rotational transform is significantly reduced. The spectral content of $|\boldsymbol{\nabla} \psi |^2$
indicates significant contributions of large mode number components to the gap width, due to the scaling with the frequency factor,
$|\boldsymbol{\nabla} \psi |^2$
indicates significant contributions of large mode number components to the gap width, due to the scaling with the frequency factor, $|\iota \delta m - N_P \delta n|$
. In the Wistell-A configuration, significant mirror and elliptical modes are present in addition to many helical modes. In the optimized configuration, the spectral content is markedly reduced, primarily represented by helical (3,2), (2,1) and (1,1) components. The boundary shape becomes visually more elliptical.
$|\iota \delta m - N_P \delta n|$
. In the Wistell-A configuration, significant mirror and elliptical modes are present in addition to many helical modes. In the optimized configuration, the spectral content is markedly reduced, primarily represented by helical (3,2), (2,1) and (1,1) components. The boundary shape becomes visually more elliptical.
The rotational transform profiles (a), quasisymmetry error (b), boundary shapes (c) and (d) and spectral content of $|\boldsymbol{\nabla} \psi |^2$
(e) and (f) are compared for the Wistell-A and continuum optimized configurations.
$|\boldsymbol{\nabla} \psi |^2$
(e) and (f) are compared for the Wistell-A and continuum optimized configurations.

The continuum of the Wistell-A and optimized configurations are computed with STELLGAP (Spong et al. Reference Spong, Sanchez and Weller2003), as shown in figure 9. The configurations are scaled to ARIES-CS volume and field strength (Najmabadi et al. Reference Najmabadi2008), with density profiles roughly consistent with ARIES-CS (Bader et al. Reference Bader2020). Given the density profile shear, the eigenmode frequencies are normalized by the Alfvén frequency on the magnetic axis, $\omega _A^0$
. We see a significant reduction in the high-frequency gap widths, especially the HAE (3,2). Here, the objective function is penalizing gaps above
$\omega _A^0$
. We see a significant reduction in the high-frequency gap widths, especially the HAE (3,2). Here, the objective function is penalizing gaps above $\omega /\omega _A^0 = |\iota - N|/2 \approx 1.5$
. A few higher-frequency gaps remain, such as the HAE (4,2) and (2,2), which are formed due to the nonlinear interaction of the (1,1) and (2,1) harmonics of
$\omega /\omega _A^0 = |\iota - N|/2 \approx 1.5$
. A few higher-frequency gaps remain, such as the HAE (4,2) and (2,2), which are formed due to the nonlinear interaction of the (1,1) and (2,1) harmonics of $|\boldsymbol{\nabla} \psi |^2$
not accounted for by our optimization metric. Future work will further refine this optimization strategy to account for non-perturbative impact of the geometry on gap formation, such as through direction calculation of the shear Alfvén continuum with spectral density methods (Weiße et al. Reference Weiße, Wellein, Alvermann and Fehske2006).
$|\boldsymbol{\nabla} \psi |^2$
not accounted for by our optimization metric. Future work will further refine this optimization strategy to account for non-perturbative impact of the geometry on gap formation, such as through direction calculation of the shear Alfvén continuum with spectral density methods (Weiße et al. Reference Weiße, Wellein, Alvermann and Fehske2006).
The shear Alfvén continuum is computed for the Wistell-A (left) and continuum optimized configuration (right) showing a significant reduction in high-frequency gap widths (above $\omega /\omega _A^0 = |\iota - N|/2$
, indicated by horizontal dashed line).
$\omega /\omega _A^0 = |\iota - N|/2$
, indicated by horizontal dashed line).

8. Conclusions
The structure of the shear Alfvén continuum is driven by the flux-surface compression factor $|\boldsymbol{\nabla} \psi |^2$
and can play a critical role in the determination of stability to EP-driven modes. We have analyzed the impact of QS geometry on the continuum. A near-axis model is used to determine the dominant spectral components of
$|\boldsymbol{\nabla} \psi |^2$
and can play a critical role in the determination of stability to EP-driven modes. We have analyzed the impact of QS geometry on the continuum. A near-axis model is used to determine the dominant spectral components of $|\boldsymbol{\nabla} \psi |^2$
. The rotating elliptical flux-surface shapes near the axis provide a helical
$|\boldsymbol{\nabla} \psi |^2$
. The rotating elliptical flux-surface shapes near the axis provide a helical $m = 2$
,
$m = 2$
, $n = N_P$
structure, which is associated with a HAE gap. The toroidal variation of the ellipticity and axis curvature is shown to give rise to MAE gaps, while elongation is shown to drive EAE gaps in QA configurations and
$n = N_P$
structure, which is associated with a HAE gap. The toroidal variation of the ellipticity and axis curvature is shown to give rise to MAE gaps, while elongation is shown to drive EAE gaps in QA configurations and $m =2$
,
$m =2$
, $n = 2 N_P$
gaps in QH configurations. These observations are shown to be consistent with a set of numerically optimized QS configurations. Through perturbative analysis, we highlight features of continuum solutions in QS geometry, such as the presence of co-propagating continuum modes and high-order crossings. Both of these features are unique to 3-D systems and lead to continuum modes which appear to cross the spectral gaps. In a follow-up paper, we will analyze the continuum of several optimized QS configurations and compare with the predictions from this theory.
$n = 2 N_P$
gaps in QH configurations. These observations are shown to be consistent with a set of numerically optimized QS configurations. Through perturbative analysis, we highlight features of continuum solutions in QS geometry, such as the presence of co-propagating continuum modes and high-order crossings. Both of these features are unique to 3-D systems and lead to continuum modes which appear to cross the spectral gaps. In a follow-up paper, we will analyze the continuum of several optimized QS configurations and compare with the predictions from this theory.
Because of the connection between continuum gaps and flux-surface shaping, we describe one strategy to manipulate the geometry to favorably modify the gap structure for EP stability of QS stellarator reactors. Namely, by promoting wide gaps at low frequency at which passing resonant interactions are less likely to occur, higher-frequency gaps will be narrowed. This will, in turn, increase continuum damping of AEs which can strongly resonate with alpha particles near the birth energy in stellarator reactors. We demonstrate our optimization technique, producing a QH configuration with reduced high-frequency gap widths. In this case, the remaining low-frequency HAE gap did not increase substantially in width. Thus, overall, we anticipate enhanced continuum damping in the optimized configuration. Further analysis of this configuration is necessary to demonstrate an impact on the growth rates of gap AEs. Future work will refine this criterion to also account for trapped particle resonances and other passing resonances that may arise as alphas slow down. We furthermore remark that the simplified metric presented assumes an analytic model for gap width. This assumption could be relaxed by directly computing the continuum within the optimization loop, using the spectral density (Weiße et al. Reference Weiße, Wellein, Alvermann and Fehske2006) as an optimization target. Beyond stellarator design, 3-D tokamak control coils could be optimized to favorably modify the continuum structure for control of EP instabilities (Garcia-Munoz et al. Reference Garcia-Munoz2019).
There may be other applications for modification of the in-surface variation of $|\boldsymbol{\nabla} \psi |^2$
. For example, modulation of this quantity can provide flow-shear stabilization (Spong et al. Reference Spong, Harris, Ware, Hirshman and Berry2007), modify the drive for microinstabilities (Roberg-Clark, Xanthopoulos & Plunk Reference Roberg-Clark, Xanthopoulos and Plunk2024) and affect the zonal flow residual (Rodriguez & Plunk Reference Rodriguez and Plunk2024; Zhu, Lin & Bhattacharjee Reference Zhu, Lin and Bhattacharjee2025).
$|\boldsymbol{\nabla} \psi |^2$
. For example, modulation of this quantity can provide flow-shear stabilization (Spong et al. Reference Spong, Harris, Ware, Hirshman and Berry2007), modify the drive for microinstabilities (Roberg-Clark, Xanthopoulos & Plunk Reference Roberg-Clark, Xanthopoulos and Plunk2024) and affect the zonal flow residual (Rodriguez & Plunk Reference Rodriguez and Plunk2024; Zhu, Lin & Bhattacharjee Reference Zhu, Lin and Bhattacharjee2025).
Acknowledgements
The authors would like to acknowledge discussions with D. Spong and A. Könies.
Editor Per Helander thanks the referees for their advice in evaluating this article.
Funding
We acknowledge funding through the U.S. Department of Energy, under contracts DE-SC0024630, DE-SC0024548 and DE-AC02-09CH11466. We also acknowledge funding through the Simons Foundation collaboration ‘Hidden Symmetries and Fusion Energy,’ Grant No. 601958. This research used resources of the National Energy Research Scientific Computing Center (NERSC), a Department of Energy Office of Science User Facility using NERSC award ERCAP0031926. E.R. was supported by a grant by Alexander-von-Humboldt-Stiftung, Bonn, Germany, through a postdoctoral research fellowship. R.J. was supported by the National Science Foundation under Grant No. 2409066.
Declaration of interests
The authors report no conflict of interest.
Appendix A. Near-axis ellipse properties
The position vector in the near-axis quasisymmetry model reads (Landreman & Sengupta Reference Landreman and Sengupta2018)
 \begin{align} \boldsymbol{r}(r,\chi ,\zeta ) = \boldsymbol{r}_0(\zeta ) + \frac {r}{\overline {\kappa }} \big[\cos \chi \hat {\boldsymbol{n}} + \overline {\kappa }^2 \left (\sin \chi + \sigma \cos \chi \right )\hat {\boldsymbol{b}} \big]. \end{align}
We define the coordinates $X = \cos \chi /\overline {\kappa }$
and
$X = \cos \chi /\overline {\kappa }$
and $Y = \overline {\kappa }(\sin \chi + \sigma \cos \chi )$
which span the perpendicular plane and the coordinates
$Y = \overline {\kappa }(\sin \chi + \sigma \cos \chi )$
which span the perpendicular plane and the coordinates $u$
and
$u$
and $v$
that span the semi-major and minor axes of the elliptical flux surfaces. The angle
$v$
that span the semi-major and minor axes of the elliptical flux surfaces. The angle $\vartheta$
parameterizes the ellipse such that
$\vartheta$
parameterizes the ellipse such that $u = a \cos \vartheta$
and
$u = a \cos \vartheta$
and $v = b \sin \vartheta$
, where
$v = b \sin \vartheta$
, where $a$
is the semi-major axis and
$a$
is the semi-major axis and $b$
is the semi-minor axis. Following Rodríguez (Reference Rodríguez2023), a quadratic equation for
$b$
is the semi-minor axis. Following Rodríguez (Reference Rodríguez2023), a quadratic equation for $X$
and
$X$
and $Y$
can obtained from the condition
$Y$
can obtained from the condition $\cos ^2 \chi + \sin ^2 \chi = 1$
 \begin{align} X^2 \overline {\kappa }^2 (1 + \sigma ^2) + \frac {Y}{\overline {\kappa }^2} - 2 \sigma XY = 1. \end{align}
This is in the form of a general ellipse, which can be solved for the semi-major and semi-minor axes as
 \begin{align} a^2,b^2 &= \frac {p \pm \sqrt {p^2-4}}{2}, \end{align}
where $p = (\overline {\kappa }^4(1+\sigma ^2) + 1)/\overline {\kappa }^2$
. The elongation
$p = (\overline {\kappa }^4(1+\sigma ^2) + 1)/\overline {\kappa }^2$
. The elongation $\mathcal{E}$
is the ratio of the axes, as shown in (3.9). The general form of the ellipse (A.2) also provides the rotation angle
$\mathcal{E}$
is the ratio of the axes, as shown in (3.9). The general form of the ellipse (A.2) also provides the rotation angle $\gamma$
between the ellipse major axis and the normal vector, as shown in (A.7).
$\gamma$
between the ellipse major axis and the normal vector, as shown in (A.7).
The position vector can now be written in the ellipse coordinate system $(r,\vartheta ,\zeta )$
as
$(r,\vartheta ,\zeta )$
as
 \begin{align} \boldsymbol{r}(r,\vartheta ,\zeta ) = \boldsymbol{r}_0(\zeta ) + r \left [a(\zeta ) \cos (\vartheta ) \hat {\boldsymbol{x}}(\zeta ) + b(\zeta ) \sin (\vartheta ) \hat {\boldsymbol{y}}(\zeta )\right ]. \end{align}
The quantity $\boldsymbol{\nabla} \psi = \left (\partial \boldsymbol{r}/\partial \vartheta \times \partial \boldsymbol{r}/\partial \zeta \right )/\left (\partial \boldsymbol{r}/\partial \psi \times \partial \boldsymbol{r}/\partial \vartheta \boldsymbol{\cdot} \partial \boldsymbol{r}/\partial \zeta \right )$
can then be evaluated from derivatives of the position vector, resulting in the expression (3.10).
$\boldsymbol{\nabla} \psi = \left (\partial \boldsymbol{r}/\partial \vartheta \times \partial \boldsymbol{r}/\partial \zeta \right )/\left (\partial \boldsymbol{r}/\partial \psi \times \partial \boldsymbol{r}/\partial \vartheta \boldsymbol{\cdot} \partial \boldsymbol{r}/\partial \zeta \right )$
can then be evaluated from derivatives of the position vector, resulting in the expression (3.10).
The rotation between the normal vector and the $\chi$
contours is also determined from (A.1). Following Landreman & Sengupta (Reference Landreman and Sengupta2018), we can consider, for example, the rotation between
$\chi$
contours is also determined from (A.1). Following Landreman & Sengupta (Reference Landreman and Sengupta2018), we can consider, for example, the rotation between $\hat {\boldsymbol{n}}$
and the
$\hat {\boldsymbol{n}}$
and the $\chi = 0$
contour. The vector pointing from the magnetic axis to the position at
$\chi = 0$
contour. The vector pointing from the magnetic axis to the position at $(r,\chi =0,\zeta )$
is
$(r,\chi =0,\zeta )$
is
 \begin{align} \frac {\partial \boldsymbol{r}(r, \chi =0, \zeta )}{\partial r} = \frac {1}{\overline {\kappa }(\zeta )} [\hat {\boldsymbol{n}}(\zeta ) + \overline {\kappa }(\zeta )^2\sigma (\zeta ) \hat {\boldsymbol{b}}(\zeta ) ]. \end{align}
The angle $\delta (\zeta )$
between
$\delta (\zeta )$
between $\partial \boldsymbol{r}/\partial r \rvert _{\chi = 0}$
and
$\partial \boldsymbol{r}/\partial r \rvert _{\chi = 0}$
and $\hat {\boldsymbol{n}}$
then satisfies
$\hat {\boldsymbol{n}}$
then satisfies
 \begin{align} \cos (\delta ) = \frac {1}{\overline {\kappa }\sqrt {p-\overline {\kappa }^2}}. \end{align}
Furthermore, quasisymmetry constrains the angle between the ellipse semi-major axis and the normal vector, $\gamma (\zeta )$
(Rodríguez Reference Rodríguez2023)
$\gamma (\zeta )$
(Rodríguez Reference Rodríguez2023)
 \begin{align} \tan (2 \gamma ) = \frac {2\sqrt {p \overline {\kappa }^2 - 1 - \overline {\kappa }^4}}{2 - p \overline {\kappa }^2}. \end{align}
We conclude that the rotation between the ellipse parameterization angle $\vartheta$
and the Boozer angles arises due to
$\vartheta$
and the Boozer angles arises due to $\delta$
and
$\delta$
and $\gamma$
(which depend on
$\gamma$
(which depend on $p$
and
$p$
and $\overline {\kappa }$
).
$\overline {\kappa }$
).
Appendix B. Second-order degenerate perturbation theory
This appendix reviews details of the second-order degenerate perturbation theory presented in § 4.2. We integrate the second-order equation (4.12), repeated here for convenience
 \begin{align} \left (\frac {\partial }{\partial \zeta } + \iota _0 \frac {\partial }{\partial \theta } \right )^2 \varPhi ^{(2)} + \left [\left (\frac {\partial }{\partial \zeta } + \iota _0\frac {\partial }{\partial \theta } \right ) \epsilon \right ]\left [\left (\frac {\partial }{\partial \zeta } + \iota _0 \frac {\partial }{\partial \theta } \right ) \varPhi ^{(1)} \right ] \nonumber \\[5pt] - \epsilon \left [\left (\frac {\partial }{\partial \zeta } + \iota _0 \frac {\partial }{\partial \theta } \right ) \epsilon \right ]\left [\left (\frac {\partial }{\partial \zeta } + \iota _0 \frac {\partial }{\partial \theta } \right ) \varPhi ^{(0)} \right ] \nonumber \\ + \lambda ^{\!(0)} \varPhi ^{(2)} + \lambda ^{(2)} \varPhi ^{(0)} = 0, \end{align}
against $(\varPhi _j^{(0)})^*$
and
$(\varPhi _j^{(0)})^*$
and $(\varPhi _k^{(0)} )^*$
. In doing so, integrating against the first term will cancel with the integral against the fourth term. Integration of the second term against
$(\varPhi _k^{(0)} )^*$
. In doing so, integrating against the first term will cancel with the integral against the fourth term. Integration of the second term against $ (\varPhi _j^{(0)} )^*$
can be expressed in the following form:
$ (\varPhi _j^{(0)} )^*$
can be expressed in the following form:
 \begin{align} \frac {1}{4\pi ^2}\!\int _0^{2\pi }\! \textrm{d}\theta\! \int _0^{2\pi } \textrm{d} \zeta \, \big(\varPhi _j^{(0)}\big)^*\left [\left (\frac {\partial }{\partial \zeta } + \iota _0 \frac {\partial }{\partial \theta } \right ) \epsilon \right ]\left [\left (\frac {\partial }{\partial \zeta } + \iota _0 \frac {\partial }{\partial \theta } \right )\! \varPhi ^{(1)} \right ] = A_{jj} \alpha _j + A_{jk} \alpha _k, \end{align}
with
 \begin{align} A_{jj} &= \sum _i\Delta _{ij}^2|\epsilon _{ij}|^2 \frac {\overline {\omega }_i^{(0)}\overline {\omega }_j^{(0)}}{\lambda ^{\!(0)}-\lambda _i^{(0)}}, \nonumber \\ A_{jk} &= \sum _i \epsilon _{ij}^*\epsilon _{ik}\frac {\overline {\omega }_i^{(0)} \lambda ^{\!(0)}}{\lambda ^{\!(0)}-\lambda _i^{(0)}}, \end{align}
with $\Delta _{ij} = \overline {\omega }_i^{(0)}-\overline {\omega }_j^{(0)}$
,
$\Delta _{ij} = \overline {\omega }_i^{(0)}-\overline {\omega }_j^{(0)}$
, $\epsilon _{ij} = \epsilon _{m_i-m_j,n_i-n_j}$
and
$\epsilon _{ij} = \epsilon _{m_i-m_j,n_i-n_j}$
and $\lambda _i^{(0)} = (\overline {\omega }_i^{(0)} )^2$
.
$\lambda _i^{(0)} = (\overline {\omega }_i^{(0)} )^2$
.
We now simplify using the assumption of counter-propagation. We define the index variables $\delta m = m_i-m_j$
and
$\delta m = m_i-m_j$
and $\delta n = (n_i-n_j)/N_P$
such that
$\delta n = (n_i-n_j)/N_P$
such that $\epsilon _{\delta m,\delta n}=\epsilon _{ij}$
. We also define the notation
$\epsilon _{\delta m,\delta n}=\epsilon _{ij}$
. We also define the notation $\Delta ({\delta m,\delta n}) = \Delta _{ij} = \iota _0 \delta m-N_P\delta n$
, resulting in the expressions
$\Delta ({\delta m,\delta n}) = \Delta _{ij} = \iota _0 \delta m-N_P\delta n$
, resulting in the expressions
 \begin{align} A_{jj} &= \lambda ^{\!(0)} \sum _{\delta m,\delta n} |\epsilon _{\delta m,\delta n}|^2 \frac {\Delta ({\delta m,\delta n})}{\Delta ({\delta m,\delta n}) + 2 \overline {\omega }^{(0)}_j}, \end{align}
 \begin{align} A_{jk} &= \overline {\omega }_j^{(0)}\sum _{\delta m,\delta n} \epsilon _{\delta m,\delta n} \epsilon _{\Delta m-\delta m,\frac {\Delta n}{N_P}-\delta n} \left (\overline {\omega }^{(0)}_j - \Delta ({\delta m,\delta n})\right ). \end{align}
The parameter $A_{jk}$
can be shown to vanish by manipulating the following sum using Parseval’s theorem and integration by parts:
$A_{jk}$
can be shown to vanish by manipulating the following sum using Parseval’s theorem and integration by parts:
 \begin{align} \sum _{\delta m,\delta n}\!\epsilon _{\delta m,\delta n} \epsilon _{\Delta m-\delta m,\frac {\Delta n}{N_P}-\delta n}\Delta ({\delta m,\delta n}) &= \frac {1}{2i} \frac {1}{4\pi ^2}\!\int _0^{2\pi }\int _0^{2\pi } \textrm{d}\theta \textrm{d} \zeta \, e^{-i(\Delta m \theta -\Delta n\zeta )} \left (\frac {\partial }{\partial \zeta } + \iota _0 \frac {\partial }{\partial \theta } \right ) |\epsilon |^2 \nonumber \\ &= \overline {\omega }_j^{(0)} \frac {1}{4\pi ^2}\int _0^{2\pi }\int _0^{2\pi } \, |\epsilon |^2 e^{-i(\Delta m \theta -\Delta n\zeta )} \nonumber \\ &= \overline {\omega }_j^{(0)} \sum _{\delta m,\delta n}\epsilon _{\delta m,\delta n} \epsilon _{\Delta m-\delta m,\frac {\Delta n}{N_P}-\delta n}. \end{align}
Here, $A_{kk}$
and
$A_{kk}$
and $A_{kj}$
are similarly defined by integrating against
$A_{kj}$
are similarly defined by integrating against $(\varPhi _k^{(0)})^*$
, obtaining
$(\varPhi _k^{(0)})^*$
, obtaining $A_{kk} = A_{jj}$
and
$A_{kk} = A_{jj}$
and $A_{kj} = A_{jk} = 0$
.
$A_{kj} = A_{jk} = 0$
.
The integral of $ (\varPhi _j^{(0)} )^*$
against the third term can be written in the form
$ (\varPhi _j^{(0)} )^*$
against the third term can be written in the form
 \begin{align} -\frac {1}{4\pi ^2}\int _0^{2\pi } \textrm{d}\theta \int _0^{2\pi } \textrm{d} \zeta \, \left (\varPhi _j^{(0)}\right )^* \epsilon \left [\left (\frac {\partial }{\partial \zeta } + \iota _0 \frac {\partial }{\partial \theta } \right ) \epsilon \right ]\left [\left (\frac {\partial }{\partial \zeta } + \iota _0 \frac {\partial }{\partial \theta } \right ) \varPhi ^{(0)} \right ] = B_{jk} \alpha _k, \end{align}
with
 \begin{align} B_{jk} = -\lambda ^{\!(0)} \sum _{\delta m,\delta n} \epsilon _{\delta m,\delta n} \epsilon _{\Delta m-\delta m,\Delta n/N_P-\delta n}. \end{align}
Here, $B_{kj}$
is defined similarly by integrating against
$B_{kj}$
is defined similarly by integrating against $(\varPhi _k^{(0)})^*$
, yielding
$(\varPhi _k^{(0)})^*$
, yielding $B_{kj}=B_{jk}^*$
. The zero-determinant condition then reads
$B_{kj}=B_{jk}^*$
. The zero-determinant condition then reads
 \begin{align} \left (\lambda ^{(2)} + A_{jj}\right )^2 - |B_{jk}|^2 = 0. \end{align}
Evidently, both the central frequency and gap width are modified at this order, with expressions given by $\sqrt {\lambda ^{\!(0)}-A_{jj}}$
and
$\sqrt {\lambda ^{\!(0)}-A_{jj}}$
and
 \begin{align} \Delta \overline {\omega } = \frac {|B_{jk}|}{\overline {\omega }^{(0)}}, \end{align}
respectively.
Appendix C. Third-order near-axis geometric factor
$|\boldsymbol{\nabla} \psi |^2$

In this appendix, we derive the expression for the third-order $\Psi _3$
geometric factor of
$\Psi _3$
geometric factor of $|\boldsymbol{\nabla} \psi |^2$
from (3.2). Due to the additional geometric effects such as Shafranov shift and triangularity, at this order, the near-axis expansion yields a total of nine new functions of
$|\boldsymbol{\nabla} \psi |^2$
from (3.2). Due to the additional geometric effects such as Shafranov shift and triangularity, at this order, the near-axis expansion yields a total of nine new functions of $\zeta$
, namely
$\zeta$
, namely $X_{20}, X_{2c}, X_{2s}, Y_{20}, Y_{2c}, Y_{2s}, Z_{20}, Z_{2c}$
and
$X_{20}, X_{2c}, X_{2s}, Y_{20}, Y_{2c}, Y_{2s}, Z_{20}, Z_{2c}$
and $Z_{2s}$
. Their corresponding equations can be found in Landreman & Sengupta (Reference Landreman and Sengupta2019). Also, three new input scalars (
$Z_{2s}$
. Their corresponding equations can be found in Landreman & Sengupta (Reference Landreman and Sengupta2019). Also, three new input scalars ( $p_2, B_{2c}, B_{2s}$
) appear, where
$p_2, B_{2c}, B_{2s}$
) appear, where $p_2$
describes the pressure gradient and
$p_2$
describes the pressure gradient and $B_{2c}$
,
$B_{2c}$
, $B_{2s}$
describe the magnetic field strength
$B_{2s}$
describe the magnetic field strength $B$
at second order. The parameter
$B$
at second order. The parameter $B_{20}$
is then determined from the provided inputs. While
$B_{20}$
is then determined from the provided inputs. While $B_{20}$
is a constant scalar in perfect QS, it is more generally a function of
$B_{20}$
is a constant scalar in perfect QS, it is more generally a function of $\zeta$
.
$\zeta$
.
We use the dual relations to write the geometric factor as
 \begin{equation} \boldsymbol{\nabla} r = \frac {1}{\sqrt {g}}\frac {\partial \boldsymbol{r}}{\partial \chi }\times \frac {\partial \boldsymbol{r}}{\partial \zeta }, \end{equation}
where $\sqrt {g} = \left (\partial \boldsymbol{r}/\partial r \times \partial \boldsymbol{r}/\partial \chi \right )\boldsymbol{\cdot} \partial \boldsymbol{r}/\partial \zeta$
is the Jacobian,
$\sqrt {g} = \left (\partial \boldsymbol{r}/\partial r \times \partial \boldsymbol{r}/\partial \chi \right )\boldsymbol{\cdot} \partial \boldsymbol{r}/\partial \zeta$
is the Jacobian, $\boldsymbol{r}$
is the position vector described using the near-axis decomposition
$\boldsymbol{r}$
is the position vector described using the near-axis decomposition $\boldsymbol r = \boldsymbol r_0 + X \hat {\boldsymbol{n}} + Y \hat {\boldsymbol{b}} + Z \hat {\boldsymbol{t}}$
, and
$\boldsymbol r = \boldsymbol r_0 + X \hat {\boldsymbol{n}} + Y \hat {\boldsymbol{b}} + Z \hat {\boldsymbol{t}}$
, and $(\hat {\boldsymbol{n}}, \hat {\boldsymbol{b}}, \hat {\boldsymbol{t}})$
is the Frenet–Serret frame (Jorge et al. Reference Jorge, Sengupta and Landreman2020b
).
$(\hat {\boldsymbol{n}}, \hat {\boldsymbol{b}}, \hat {\boldsymbol{t}})$
is the Frenet–Serret frame (Jorge et al. Reference Jorge, Sengupta and Landreman2020b
).
This leads to the following expression for the third-order geometric factor:
 \begin{equation} \Psi _3 = \Psi _{31c} \cos \chi + \Psi _{31s} \sin \chi + \Psi _{33c} \cos 3 \chi + \Psi _{33s} \sin 3 \chi , \end{equation}
where
 \begin{align} \Psi _{31c} & = \frac {B_{0}^2}{\overline {\kappa }^3} \Big (-Y_{22s}+ \overline {\kappa }^2 (-X_{20}+X_{22c}+\sigma X_{22s})\nonumber \\ &\quad\quad\quad\quad- \overline {\kappa }^4 \left (\left (\sigma ^2+1\right ) Y_{22s}-2 \sigma Y_{20}\right )\nonumber \\ &\quad+\overline {\kappa }^6 \left (-3 \left (\sigma ^2+1\right ) X_{20}+\left (\sigma ^2-3\right ) X_{22c}+\sigma \left (\sigma ^2+5\right ) X_{22s}\right )\Big ),\\[-8pt]\nonumber \end{align}
 \begin{align} \Psi _{31s} & = \frac {B_{0}^2}{\overline {\kappa }^3} \Big (3 (Y_{22c}-Y_{20})-\overline {\kappa }^2 (3 \sigma (X_{22c}-X_{20})+X_{22s})\nonumber \\ &\quad\quad\quad\quad-\overline {\kappa }^4 \left (Y_{20}+3 \sigma ^2 (Y_{20}-Y_{22c})+Y_{22c}-4 \sigma Y_{22s}\right ) \nonumber \\ &\quad+\overline {\kappa }^6 \left (\sigma \left (3 X_{20}+3 \sigma ^2 (X_{20}-X_{22c})+X_{22c}\right )-\left (5 \sigma ^2+1\right ) X_{22s}\right )\Big ),\\[-8pt]\nonumber \end{align}
 \begin{align} \Psi _{33c} & = \frac {B_{0}^2}{\overline {\kappa }^3} \Big (Y_{22s} + \overline {\kappa }^2 (X_{20}-X_{22c}-\sigma X_{22s})\nonumber \\ &\quad\quad\quad\quad+\overline {\kappa }^4 \left (\left (\sigma ^2+1\right ) Y_{22s}-2 \sigma Y_{20}\right ) \nonumber \\ &\quad+\overline {\kappa }^6 \left (\left (3 \sigma (\varPhi )^2-1\right ) X_{20}-\left (\sigma ^2+1\right ) (X_{22c}+\sigma X_{22s})\right )\Big ), \end{align}
 \begin{align} \Psi _{33s} & = \frac {B_{0}^2 }{\overline {\kappa }^3}\Big ((Y_{20}-Y_{22c}) -\overline {\kappa }^2 (\sigma (X_{20}-X_{22c})+X_{22s})\nonumber \\ &\quad\quad\quad\quad+ \overline {\kappa }^4 \left (\left (\sigma ^2-1\right ) Y_{20}-\left (\sigma ^2+1\right ) Y_{22c}\right ) \nonumber \\ &\quad-\overline {\kappa }^6 \left (\sigma ^3 (X_{20}-X_{22c})-\sigma (3 X_{20}+X_{22c})+\left (\sigma ^2+1\right ) X_{22s}\right )\Big ). \end{align}

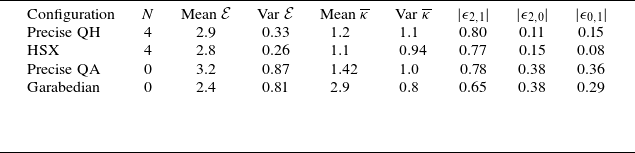


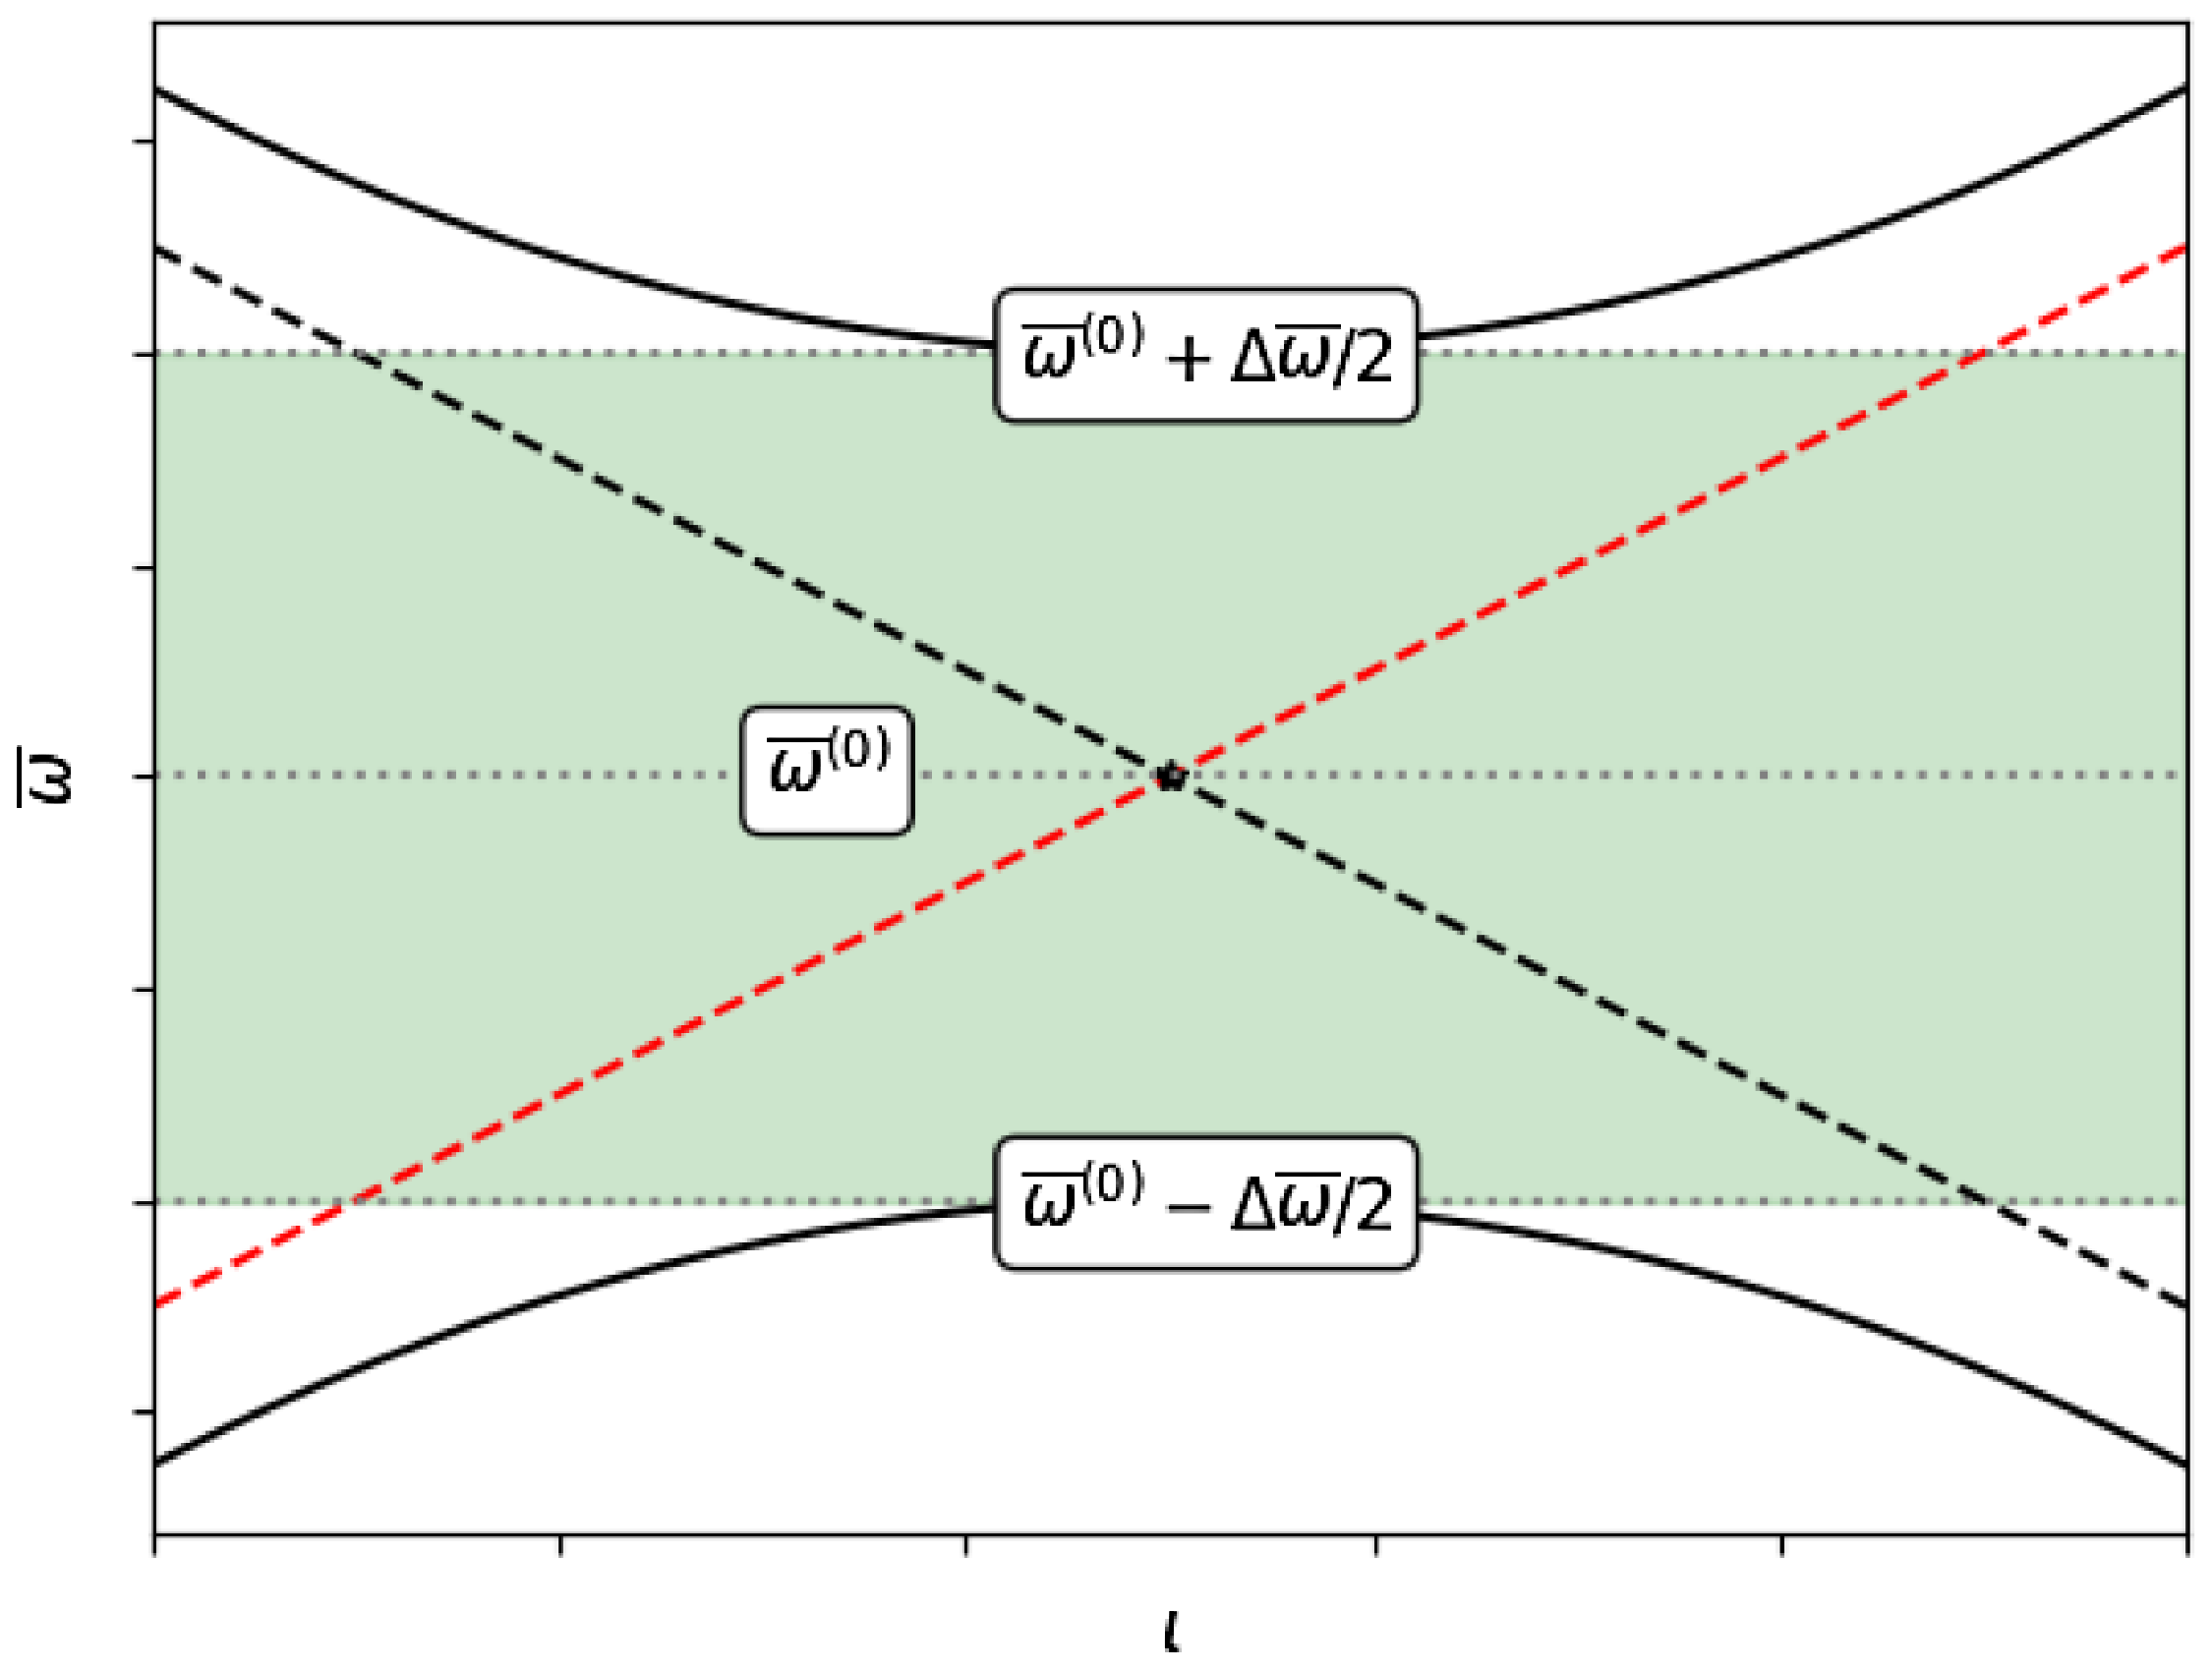


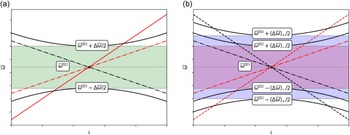


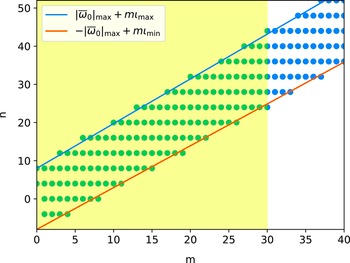


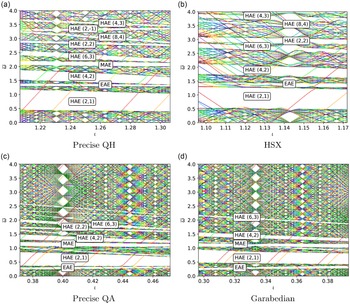


 Open access

