

1. Introduction
Air pollution is one of the primary environmental and public health challenges facing governments. In 2013 alone, an estimated 5.5 million lives were lost due to exposure to outdoor and indoor air pollution and welfare losses reached more than US$5 trillion worldwide (World Bank and Institute for Health Metrics and Evaluation, 2016). The problem is especially acute in low- and middle-income countries, where 90 per cent of the population is exposed to high levels of ambient air pollution (World Bank and Institute for Health Metrics and Evaluation, 2016). Given the substantial human and economic costs, why don't governments in the developing world implement more and stricter policies and regulations to reduce air pollution?
Although citizens recognize that air pollution is a problem, they may not trust that the government has the capacity and the commitment to implement effective, long-term solutions (Scartascini and Tommasi, Reference Scartascini and Tommasi2010, Reference Scartascini and Tommasi2014; Franco Chuaire et al., Reference Franco Chuaire, Scartascini and Tommasi2017).Footnote 1 The characteristics of many environmental public policies provide an opportunity for governments to act opportunistically. Many environmental policies are characterized by short-term costs and long-term commitments and the effectiveness of environmental policies are often difficult for citizens to observe since natural processes (e.g., thermal inversions) outside the government's control also effect outcomes. In low-trust environments, citizens may not be willing to support policies that require short-term costs and long-term commitments (Keefer et al., Reference Keefer, Scartascini and Vlaicu2018, Reference Keefer, Scartascini and Vlaicu2020). Therefore, one reason that governments in developing countries do not pursue and implement policies that lead to better air quality may be that they lack the trust to garner citizen support for effective policies.
We analyze the relationship between trust and demand for public policies related to air pollution using survey data from Mexico City (CDMX), where air quality has historically been a notorious problem. The United Nations described Mexico City's air as the most polluted on the planet in 1992.Footnote 2 Since then, CDMX's air pollution has improved, but it is still above international targets and ranked 30th worst among capital cities of the world (IQAir, 2018). Citizens are aware of the issue; in our survey data, nearly 95 per cent of participants report that air quality is “a problem” or “a very big problem” in Mexico City.Footnote 3
Similar to many other low- and middle- income countries, Mexico's citizens have relatively low trust in the government, especially in politicians. According to an OECD survey of 42 countries, Mexico falls near the median in terms of trust in government.Footnote 4 Citizens can proxy for opportunistic or untrustworthy behavior by the ability of governments to deliver on promises and whether politicians engage in corruption. Mexico ranks poorly on both metrics. Mexico's governance capabilities are below those of other OECD countries.Footnote 5 According to the Transparency International Corruptions Perception Index available from the World Bank, Mexico ranked in the bottom 30 per cent of countries in 2018.Footnote 6 According to the World Economic Forum Global Competitive Index available from the World Bank, in 2017 Mexico ranked 127th out of 137 countries in terms of beliefs in politicians’ ethical standards.Footnote 7 Despite this low ranking, Mexico is near the median for Latin America and the Caribbean. In terms of trust in government and corruption perceptions, Mexico City falls near national averages. Sixty per cent of citizens in Mexico City have no trust in government, compared to the national average of 54 per cent.Footnote 8 Similarly, 90 per cent of citizens of Mexico City believe there is corruption in government, compared to 87 per cent of Mexicans nationally.Footnote 9
In this context of high air pollution and low trust, we study whether trust affects citizens’ willingness to pay taxes to improve air quality, views on whether pollution fees should be retained by the government or distributed to citizens, and preferences on whether the revenue should be used to fund the provision of environmental public or private goods. We use novel data collected from in-person household surveys between June and August 2019 and construct absolute and relative (benchmarking the trust scale to the individual's reported trust in their family) measures of trust.
Overall, we find that about 3 out of 4 participants would be willing to pay an additional tax in order to alleviate air pollution problems, and this willingness is higher for those who trust the President (by about 3 to 5 percentage points for a 1-unit increase on a 4-point trust scale) and non-political actors such as NGOs. Participants have a preference for allocating the potential fees paid by polluting firms to citizens rather than the government. However, those who trust political figures, such as political parties or the Mayor of Mexico City, are more willing to let the government retain more of the revenue (by 2 to 5 percentage points for a 1-unit increase on a 4-point trust scale). Finally, we find that participants are more likely to report that they prefer allocating the revenue received by the government to providing public goods rather than providing private goods to individuals. Trust in government is not correlated with preferences for public goods, but trust in NGOs (positively) and neighbors (negatively) is.
In addition to absolute and relative measures of trust, we also look at correlations between policy preferences and perceptions of the quality of public services. Perceived quality of public services captures one dimension of trust in government (competence) that may suffer less measurement bias. We find that people's assessment of street quality in their neighborhood is correlated with higher willingness to pay an additional tax for an improvement in air quality and that higher quality of water service is correlated with a preference for greater government retention of revenue from fees collected from polluting firms. We do not find any significant correlation between perceived public goods quality and the use of the revenue for private or public goods.
Our results complement recent literature demonstrating that environmental policy preferences are influenced by trust in institutions, authorities and other citizens, such as family, friends and neighbors (Hammar and Jagers, Reference Hammar and Jagers2006; Konisky et al., Reference Konisky, Milyo and Richardson2008; Jagers et al., Reference Jagers, Löfgren and Stripple2010; Fairbrother, Reference Fairbrother2016; Kulin and Johansson Sevä, Reference Kulin and Johansson Sevä2020). Specifically, trust is correlated with citizens’ willingness to support taxes to curb pollution and climate change (Hammar and Jagers, Reference Hammar and Jagers2006; Birol and Das, Reference Birol and Das2012; Harring, Reference Harring2013; Harring and Jagers, Reference Harring and Jagers2013; Fairbrother, Reference Fairbrother2016; Xu and Li, Reference Xu and Li2016; Kulin and Johansson Sevä, Reference Kulin and Johansson Sevä2020) and trust plays a role in determining the set of policies that individuals are willing to support (Zannakis et al., Reference Zannakis, Wallin and Johansson2015; Harring, Reference Harring2018; Lafuente et al., Reference Lafuente, Paneque and Vargas2018). Similarly, government quality plays an important role in determining individuals’ willingness to pay environmental taxes (Davidovic et al., Reference Davidovic, Harring and Jagers2020).Footnote 10
Our study is most similar in spirit to Keefer et al. (Reference Keefer, Scartascini and Vlaicu2018, Reference Keefer, Scartascini and Vlaicu2020), although they focus on the education and policing sectors. Education and policing differ from ambient air quality in that there are clear private alternatives to publicly provided goods. Therefore, Keefer et al. (Reference Keefer, Scartascini and Vlaicu2018, Reference Keefer, Scartascini and Vlaicu2020) capture a preference for the size of government in those sectors by asking participants their preference on public or private provision. In contrast, our study captures willingness to pay an additional tax for an improvement in ambient air quality that could not be easily privately provided. Additionally, unlike Keefer et al. (Reference Keefer, Scartascini and Vlaicu2018, Reference Keefer, Scartascini and Vlaicu2020), in which there is an implied or explicitly stated temporal misalignment of the costs and benefits, we study hypothetical short-term policies in which we specify that the costs and benefits of the policy (tax and a sufficient improvement in air quality to reduce the number of contingencias) occur in the same time period.Footnote 11 This precludes confounding by time preferences. Further, in contrast to Keefer et al. (Reference Keefer, Scartascini and Vlaicu2018, Reference Keefer, Scartascini and Vlaicu2020), our survey questions specify the amount of the tax increase and the benefits of the policy in terms of improvements in air quality to fix ideas.
Our results provide evidence that contributes to the literature on the role of trust in environmental public policy in several dimensions. First, we study willingness to pay an additional tax approximately equal to a day's minimum wage to achieve a specific improvement in the local air quality. In contrast, most of the literature has focused on a hypothetical tax, which may or may not be borne by the individual, to mitigate an environmental problem with uncertain local costs. Because the costs and benefits of the tax are concrete and salient, we can evaluate the roles of trust and public good provision on willingness to pay for environmental improvements with fewer confounding factors.
Second, we provide evidence in an understudied context and two understudied areas of the literature. We provide some of the first evidence on the role of trust in environmental policy preferences in Latin America where trust in government is low and air pollution is high. This context is distinct from the high-trust, low-pollution contexts in which most studies were conducted.Footnote 12 We study a larger set of policy outcomes and additional measures of trust. In addition to studying willingness to pay an additional tax for environmental improvements, we also study preferences for government control of revenue for improving environmental quality and preferences on public vs. private environmental goods. In addition to reported levels of trust in government, we study the correlation between the perceived quality of public goods provision and environmental policy preferences. The perceived public service provision may provide a more objective measure of trust in government competence, which reduces measurement error.
Third, due to methodological improvements, our survey was particularly well-designed for capturing policy preferences (Gingerich and Scartascini, Reference Gingerich and Scartascini2018). We measured preferences for the distribution of revenue to the government or citizens and for spending on public goods or private goods using a procedure that replicated real-life budget trade-offs. Instead of asking about their priority, participants distributed hypothetical resources (10 units) among the several alternatives as a real-life representation of the choices being made across options.
2. Hypotheses and Methodology
Effective environmental public policy is crucial to sustainable and equitable economic growth. If trust in government plays a significant role in environmental public policy preferences, this is one additional channel through which trust may impact economic growth.
Trust is likely to play a particularly large role in environmental public policy, as these policies tend to require long-term investments and commitments on the part of the government and deliver benefits that are difficult for citizens to measure. For example, air quality depends on emissions, which can be influenced by policies and regulations, but also on weather and thermal inversions. Therefore, there are opportunities for politicians to act opportunistically. Furthermore, many environmental public policies deliver improvements in public goods, which citizens may not trust the government to provide.Footnote 13 Using a probabilistic voting model, Keefer et al. (Reference Keefer, Scartascini and Vlaicu2020) show that voters prefer government spending with certain and immediate benefits when they have low trust in electoral promises and, in equilibrium, candidates promising larger allocations to transfers and short-term public goods are more likely to win elections in settings with low trust and high impatience.
We consider the role of trust in three key aspects of citizens’ support for environmental public policy: willingness to pay taxes to finance new policies, preference for the share of revenue that the government controls, and the use of government revenue to finance public vs. private goods. Together, these three outcomes provide a fairly comprehensive view of citizens’ support for environment public policies.
Trust may be difficult for citizens to quantify on a 4-point scale, but citizens are likely to have a clear evaluation of the quality of basic public goods that they use daily. Therefore, the perceived quality of public goods such as roads and piped water captures one dimension of trust in government, specifically competence, which may suffer less measurement bias.
Consequently, we focus on the following six specific hypotheses that correlate trust and environmental public policy.
1. Trust in government is positively correlated with support for taxes to improve air quality.
2. Trust in government is positively correlated with support for government retention of revenue from air pollution fees.
3. Trust in government is positively correlated with support for environmental public goods spending.
4. The perceived quality of local public goods and services is positively correlated with support for taxes to improve air quality.
5. The perceived quality of local public goods and services is positively correlated with support for government retention of revenue from air pollution fees.
6. The perceived quality of local public goods and services is positively correlated with support for environmental public goods spending.
To evaluate if these hypotheses hold in our novel data from Mexico City, we estimate a linear OLS regression including Basic Geostatistical Area (i.e., neighborhood) fixed effects and basic socio-demographic characteristics and policy preferences/environmental beliefs as control variables with robust standard errors.

where Yi is the outcome of interest for individual i. We consider three outcomes of interest: an indicator variable representing support for a 100-peso pollution tax, how much of the revenue from air pollution fees should be retained by the government and distributed to citizens (measured as the share of resources retained by the government and as the difference in units allocated to government control and to citizen control), and how much of the revenue from air pollution fees should be dedicated to financing environmental public goods and environmental private goods (measured as the share of resources allocated to public goods spending and as the difference in units allocated to public goods and to private goods). T contains trust variables (either absolute or relative) or perceived public services quality. X is a set of socio-demographic control variables including gender, age, education, household size, and an indicator variable indicating the presence of children in the household.Footnote 14 E contains additional variables representing perceptions of the government's environmental program capabilities and beliefs about the importance of environmental policies as control variables. Specifically, E includes variables that capture perception of the effectiveness of CDMX's air pollution control program, perception of the government of CDMX's pollution control capacities, and the importance that politicians should place on environmental quality to receive the majority of votes. BGA is a vector of fixed effects for the Basic Geostatistical Area to absorb the neighborhood-level quality of public services provision, political leaning and income.
In addition to results of regressions with individual trust variables, we show the results of regressions including the full set of trust variables to account for the omitted variable bias in the first specification since the trust variables are highly correlated.Footnote 15
The first, second and third hypotheses imply that those who trust the government both in absolute and relative terms (the distance between trust in family and friends and trust in government) are more likely to support additional taxes to avoid air pollution environmental emergencies, prefer the government to retain more revenue from air pollution fees, and prefer to allocate more revenue to environmental public goods spending rather than environmental private goods spending.
Similarly, the fourth, fifth and sixth hypotheses imply that those who perceive the quality of local government public goods and services to be higher are more likely to support additional taxes to avoid air pollution environmental emergencies, prefer the government to retain more revenue from air pollution fees, and prefer to allocate more revenue to environmental public goods spending rather than environmental private goods spending.
3. Data
The survey data used in this article were collected through in-person household surveys in Mexico City during the period June–August 2019 as part of a larger randomized controlled trial. The sample consists of 1,869 individuals. Sampling of households was restricted by education level and previous inclusion in other survey rounds and to ensure the safety of the field teams. Specifically, the sample included Basic Geostatistical Areas (BGAs) with an education level below the median and a homicide rate below the 70th percentile.Footnote 16
Field work proceeded as follows. Each day, each field team conducted surveys in one BGA.Footnote 17 The day before surveying an area, households were given advance notice of the survey. In each sampled BGA, the field team distributed 500 invitations on both sides of the street starting at the northwestern most block of the selected BGA and moving toward the southeastern most block of the selected BGA until the 500-household quota had been reached.Footnote 18 Surveyors followed the same pattern the following day when attempting to interview households.
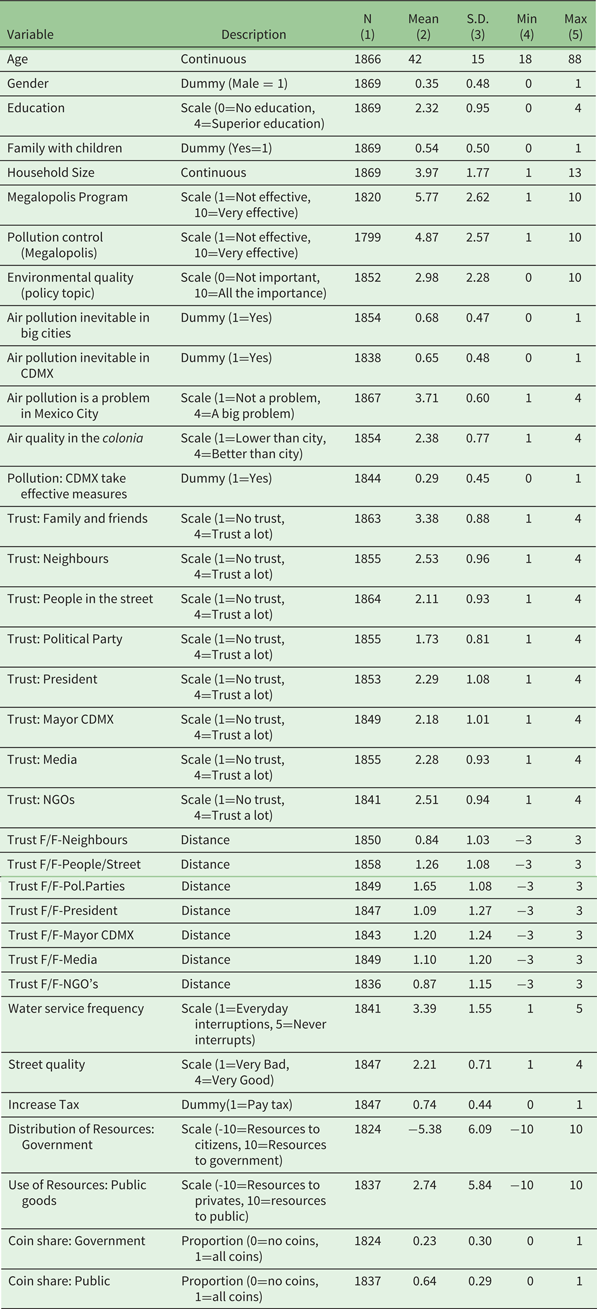
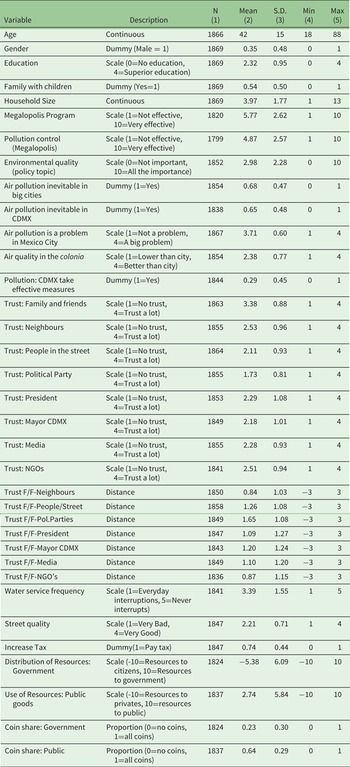
Table 1 describes the observable characteristics of the sample used in the analysis. Thirty-five per cent of the sample is male, the average age is 42 years old, the average level of education is secondary education, 54 per cent of households have children, and on average households contain 4 members. Individuals in our sample believe that air pollution is a serious concern in Mexico City. Sixty-eight per cent of the individuals surveyed consider air pollution to be inevitable in any large city and 65 per cent consider air pollution to be inevitable in Mexico City. Twenty-nine per cent of the individuals surveyed think that Mexico City's government takes effective measures to control air pollution. On average, participants rated the effectiveness of the Megalopolis Program a 6 (on a scale where 1 is ineffective and 10 is fully effective), and the effectiveness of the control carried out to measure compliance by companies a 5. Relative to other issues, participants do not think political candidates should put too much weight on environmental policy in order to win elections (average rating of 3 out of 10).
Summary Statistics (full sample).
3.1. Trust variables
Table 1 also provides descriptive statistics of participants’ trust in different groups and institutions. Trust was reported on a 4-point scale that ranged from no trust (a value of 1) to a lot of trust (a value of 4). On average, participants report the greatest trust in family and friends (mean of 3.38), followed by trust in neighbors (mean of 2.53), trust in non-governmental organizations (NGOs) (mean of 2.51), and trust in the media (mean of 2.28). On the other end of the trust spectrum are political parties and government authorities. Individuals reported slightly higher trust in the President (mean of 2.29) than in the Mayor of CDMX (mean of 2.18). Trust in the President and the Mayor likely depends on the political affiliation of the participant.Footnote 19 Political parties have a mean trust level of 1.73. Because the survey asked about political parties in general, as opposed to a specific political party, this illustrates people's low levels of trust in political organizations.
In addition to the absolute measures of trust, we also construct relative trust measures using trust in family and friends as a benchmark.Footnote 20 Reported levels of trust may differ across individuals not only because of differences in trust but also because of differences in perceptions of the reporting scale. The relative measures of trust are constructed as the difference between the trust level reported for family and friends and the trust level reported for that party. In this way, the relative measures of trust remove differences in the perception of the trust scale by benchmarking trust in each party to the individual's trust in their family and friends. For relative measures of trust, a lower value indicates higher trust because it indicates that the individual trusts that party almost as much as they trust their family and friends. Eighty-one per cent of participants reported that they have the (weakly) highest level of trust in family and friends.
The survey also included two questions to evaluate participants’ perceptions of the quality of public goods and services, to proxy for the quality or competence of government. Water service frequency captures the number of interruptions an individual experiences. On average, participants reported that their water service is interrupted at least once a week (on this scale 1 represents interruptions every day and 5 represents never experiencing interruptions to water service). Street quality in their colonia is viewed as ”poor” on average (measured on a 4-point scale where 1 represents very poor quality and 4 very good quality). Online appendix 10 displays the relevant sections of the questionnaire.
3.2. Dependent variables
The survey collected data on environmental policy preferences using three different questions that follow the framework developed in Keefer et al. (Reference Keefer, Scartascini and Vlaicu2018, Reference Keefer, Scartascini and Vlaicu2020).Footnote 21 Table 1 displays summary statistics for the outcome variables and online appendix 10 displays the relevant sections of the questionnaire.Footnote 22
Our first outcome variable is an indicator variable that captures whether a participant supports an increase in their taxes to improve air quality. Specifically, the survey asked whether the participant would support a 100-peso tax if the government were to commit to a plan that reduces air pollution enough to avoid all environmental emergencies. Seventy-four per cent agreed with the statement (figure A1 in the online appendix).
Our second outcome captures participants’ preference for how revenue collected from fees paid by polluting firms should be distributed (online appendix figures A2 and A3). Participants reported their preference for the allocation of the revenue by distributing 10 units across four different options: the government of the city where the polluting factory is located (mean of 12 per cent), the national government (mean of 11 per cent), the citizens located near the polluting factory (mean of 42 per cent), or the citizens of the city where the factory is located (mean of 35 per cent). Using the responses to this question, we created two versions of the dependent variable ”distribution of resources.” The first adds the number of units allocated to the local and national governments and divides this sum by 10. The range of this variable is 0 (all revenue distributed to citizens) to 1 (all revenue retained by the government) and can be interpreted as the percentage of the revenue that the participant prefers the government to control. The average share allocated to governments was 0.23, or 23 per cent, demonstrating that participants prefer that citizens control a greater share of the revenue from pollution fees than local or national governments. The second is the absolute difference in units allocated to the government vs. citizens. The sum of the units distributed to citizens is subtracted from the sum of the units distributed to local and national governments. This variable ranges from -10 to 10. On this scale, a value of 10 indicates that a participant assigned all the revenue to government control, a value of 0 indicates that the participant allocated an equal number of units to government control and citizen control, and a value of -10 indicates that a participant assigned all the revenue to citizen control. The average of this variable is -5.38, which indicates that, on average, participants distributed 5.38 more units (out of 10 units) to citizen control than to government control.Footnote 23
Our third outcome captures participants’ preferences on public goods and private goods (online appendix figures A4 and A5). Participants were asked what share of the revenue should be spent on environmental public goods and environmental private goods if the local government were to retain the revenue from pollution fees. Participants reported their preference by distributing 10 units across four options: government implementation of new measures and restrictions on pollution sources (mean of 30 per cent), reduction of air pollution in public buildings, for example through air filters (mean of 17 per cent), provision of masks and filters to households (mean of 33 per cent), and subsidies to households for the purchase of energy-efficient appliances (mean of 19 per cent). Similar to the second outcome, we construct two versions of this outcome variable. The first captures the share of resources that the participant prefers to be used for public goods, and the second captures the absolute difference in units allocated to public vs private goods. The first variable ranges from 0 to 1, with an average allocation of 64 per cent to public goods. The second ranges from -10 to 10 with an average of 2.74, indicating that on average participants allocated 2.74 more units to public environmental goods than to private environmental goods.Footnote 24
4. Results
4.1. Trust
Table 2 shows that we find evidence in support of hypotheses 1 and 2 but do not find evidence in support of hypothesis 3. Panel A shows that higher trust in the President, the Mayor, and political parties is associated with higher willingness to support a tax increase to improve air quality (hypothesis 1). In particular, in the specification including the full set of trust variables, a one-level increase in trust in the President is associated with an increase in the likelihood of supporting the additional tax of 3 percentage points (column (4)). Consequently, the probability that an individual responds that she is willing to pay the tax is about 21 per cent higher if she answered that she trusts the President a lot than if she answered that she does not trust the President at all. These results are in line with others in the literature. Jagers et al. (Reference Jagers, Löfgren and Stripple2010) find that trust in politicians is linked to support for a carbon tax, Hammar and Jagers (Reference Hammar and Jagers2006) find a positive correlation between support for increases in gasoline taxes and trust, and Harring and Jagers (Reference Harring and Jagers2013) find that political trust and interpersonal trust have significant effects on people's attitudes toward an increase in taxes on carbon dioxide. A similar relationship is found between trust in NGOs and support for an additional tax to improve air quality. One reason may be that those who trust NGOs believe that NGOs play a role in ensuring government accountability.
Absolute Trust and Policy Preferences.
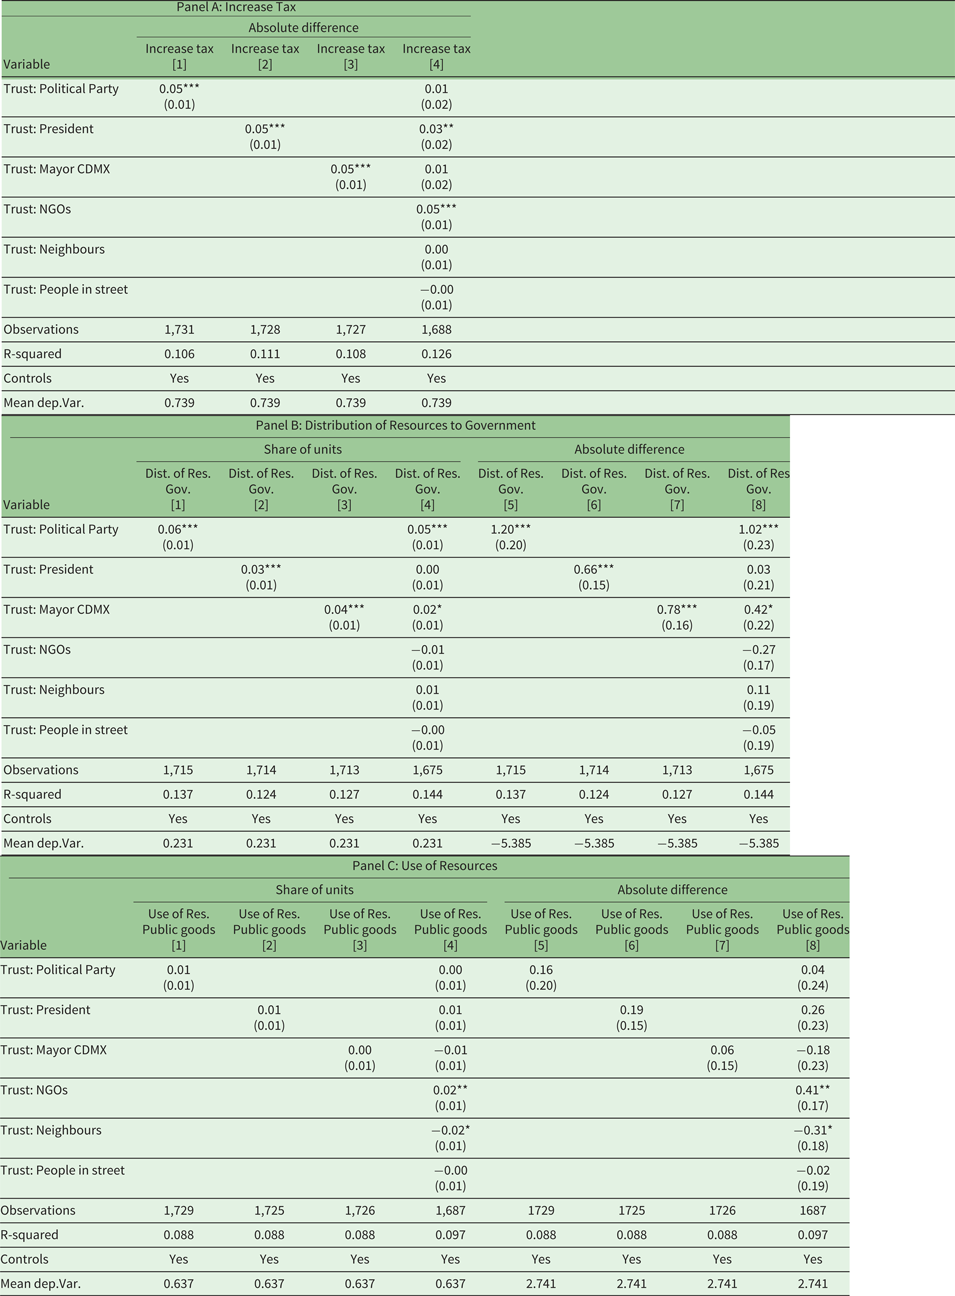
Notes: Each panel shows regression results for a different dependent variable. Each column shows the regression coefficient and robust standard error in parenthesis corresponding to an OLS regression.
*** p<0.01, ** p<0.05, * p<0.1
Demographic controls: age, gender, education, children dummy, number of household members, and BGA F.E.
Policy controls: Megalopolis program, Pollution control (Megalopolis) and Environmental quality (policy topic)
Trust control: Family and friends
Trust is measured in absolute terms (increasing levels trust with higher numbers)
Panel B of table 2 shows that higher trust in the President, the Mayor and political parties is also correlated with a greater preference for government (national and local) retention of the revenue from fees paid by polluting firms (hypothesis 2). In particular, in the specification including the full set of trust variables a one-level increase in trust in political parties and the Mayor results in a 5 percentage point and a 2 percentage point increase in the share of the revenue that a participant prefers the government to retain (column (4)). This implies that an individual who trust political parties a lot is willing to provide an approximately 110 per cent greater share of resources to government control than an individual who does not trust them at all. The same results can be seen in columns (5)-(8), which show the results using the absolute difference in the number of units assigned to government and citizen control as the outcome variable.
Panel C of table 2 shows that we do not find a statistically significant relationship between trust in the government and the preferred use of revenue from pollution fees to finance environmental public goods spending or environmental private goods spending (hypothesis 3). Part of the reason for this null result may be that the survey question asked individuals about the use of the revenue by the local government, and most participants were not willing to allocate a substantial share of the revenue to the local government (mean of 11 per cent in online appendix figure A3). However, we do find a correlation between the preferred use of revenue and trust in NGOs and in neighbors.
4.2. Perceived Public Goods Quality
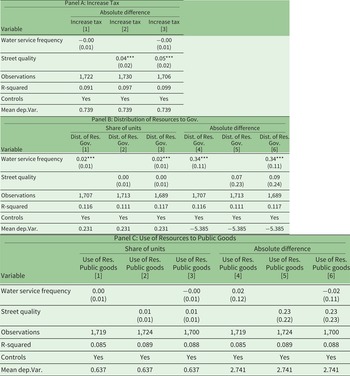
Consistent with our results using trust variables, Table 3 shows that we find evidence consistent with hypotheses 4 and 5, but do not find evidence consistent with hypothesis 6. Panel A shows that perceived street quality is associated with a higher likelihood of supporting a specific tax to avoid air pollution contingencies (hypothesis 4). This finding complements similar results in the literature. For example, Xu and Li (Reference Xu and Li2016) and Davidovic et al. (Reference Davidovic, Harring and Jagers2020) find that quality of government plays an important role in an individual's willingness to pay for environmental taxes.
Public Service Quality and Policy Preferences
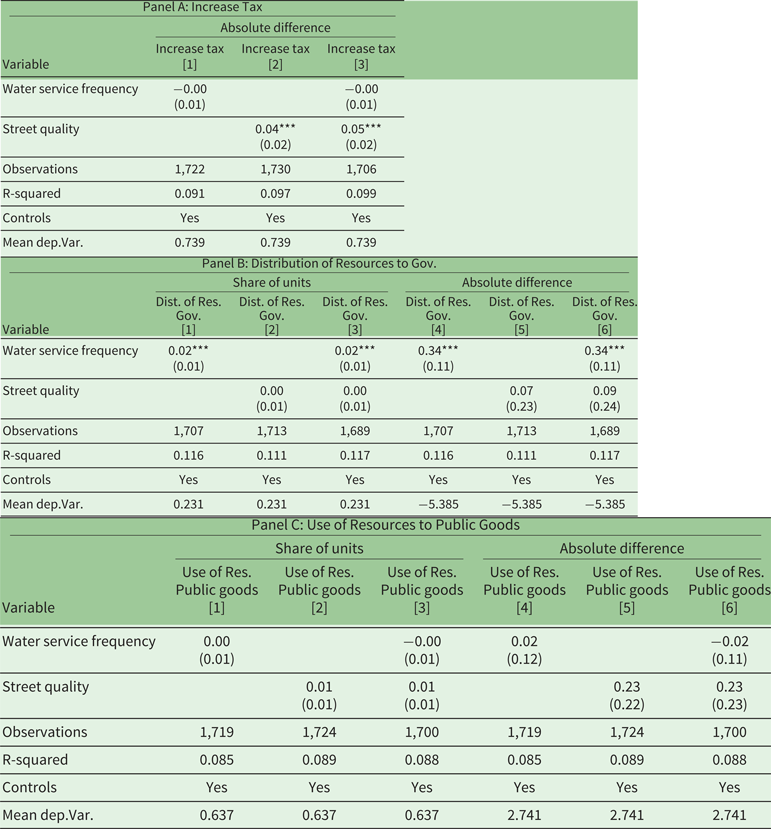
Notes: Each panel shows regression results for a different dependent variable.
Each column shows the regression coefficient and robust standard error in parenthesis corresponding to an OLS regression.
*** p<0.01, ** p<0.05, * p<0.1
Demographic controls: age, gender, education, children dummy, number of household members, and BGA F.E.
Policy controls: Megalopolis program, Pollution control (Megalopolis) and Environmental quality (policy topic)
Water service frequency: 1 (every day interruptions) to 5 (Never)
Street quality: 1 (Very bad) to 4 (Very good)
Panel B of table 3 shows that higher levels of reliability of water service provision (fewer interruptions in water service) are positively associated with support for government retention of revenue from air pollution fines (hypothesis 5). This finding complements evidence in the literature that associates government capacity with a preference for government spending on environmental issues (Kulin and Johansson Sevä, Reference Kulin and Johansson Sevä2019).
Panel C of table 3 shows that we do not find a significant relationship between trust in government and the preference for spending on environmental public goods or environmental private goods (hypothesis 6).
4.3. Robustness
We show the robustness of our main results in four ways. First, we replicate table 2 using relative measures of trust. Relative measures of trust remove differences in participants’ perceptions of the trust scale used to record their trust levels. Given the construction of the two sets of trust variables, we expect the coefficients in online appendix table A4 to be the opposite sign of those in table 2. Table A4 shows that the correlations between trust and policy preferences are robust to using relative trust measures.
Second, we show that our main results are robust to restricting the sample to participants who reported their highest level of trust in friends and family. This excludes 19 per cent of our sample, whose highest reported trust level is for a party other than friends and family. Since we assume that most individuals have the most trust in their friends and family, it is possible that participants who do not report their highest trust level for friends and family misunderstood the exercise. Online appendix table A5 shows that summary statistics for this sample are very similar to those of the full sample presented in table 1. Online appendix tables A7 and A8 show that the results using absolute trust and relative trust are consistent with the results for the full sample presented in table 2. Online appendix table A9 shows that the correlations between the perceived quality of public goods and policy preferences presented in table 3 are robust to using the trimmed sample.
Third, we show that our main results are robust to the inclusion of household income as an additional control. We do not include income as a control in our main specification because nearly half of our participants declined to report their household income. However, income could be correlated with reported trust levels, causing omitted variable bias. In the sample of participants who report their household income, online appendix tables A10 and A11 demonstrate that our main results are robust to including household income as an additional control.
Fourth, we use alternative estimation strategies. Our first outcome of interest, willingness to pay an additional tax, is binary so we show the robustness of our results to estimating a probit model. Our second and third outcome variables represent the share of revenue retained by the government and the share of revenue that participants prefers to finance public goods, are proportional, ranging from 0 to 1, so we show the robustness of our main results to estimating a fractional logit model. Online appendix tables A12 and A13 show that our results are largely unchanged.
5. Conclusion
Trust levels in the Latin American region are lower than in other regions of the world and have been falling for the last two decades (Scartascini and Valle Luna, Reference Scartascini and Valle Luna2020a). This development holds significant implications, as trust facilitates transactions between individuals, firms and governments, and it also affects the relationship between citizens and the state (Keefer et al., Reference Keefer, Scartascini and Vlaicu2018). If citizens have low trust in government, they will not be willing to support public policies that have intertemporally unbalanced costs and benefits, require high levels of competence to implement, have an effectiveness that is difficult to observe, and give governments greater discretion over how to allocate resources. Unfortunately, these characteristics are common to many public policies to improve air quality, and environmental public policies in general.
Using a novel database from a survey of about 2,000 citizens of Mexico City, we find correlational evidence supporting several of the hypotheses considered in this paper. Higher trust in government is correlated with higher reported willingness to pay an additional tax to reduce air pollution and with higher reported support for government retention of the additional revenue it collects from polluting firms. We do not find that higher trust in government is correlated with greater reported support for the provision of environmental public goods rather than environmental private goods by the local government. Relatively low preference for local government retention of the revenue may obscure preferences on public and private goods. We find similar results when using participants’ evaluations of public good provision (street quality or water service frequency) as a measure of government competence. Those who receive (or perceive) better services tend to report greater support for an additional tax to improve air quality and more support for government control of revenue collected from polluting firms. Again, using perceived public goods quality as a measure of government competence, we find no relationship between trust in government and the reported preference for spending on environmental public or private goods.
While we provide new, specific evidence to the literature, there is still plenty to improve upon. For example, more granular measures of trust that separate competence from benevolence and honesty from predictability would provide more precise information about the dimensions of trust that matter most for environmental policy support. More importantly, causal evidence on the linkages between trust and policy demand, obtained, for instance, by allocating information about government qualities randomly across groups, would be a substantial improvement.
Although the results are based on correlations from a survey of about 2,000 individuals in Mexico City, they provide further evidence that trust in governments and institutions plays an important role in citizens’ support for environmental and air quality policies. Fortunately, many steps that governments can take to increase their citizens’ trust are simply good policies. For example, providing high quality public services and local investment (Scartascini and Valle Luna, Reference Scartascini and Valle Luna2020b; Carrillo et al., Reference Carrillo, Castro and Scartascini2021), implementing effective responses to crises and disasters (Frost et al., Reference Frost, Kim, Scartascini, Zamora and Zechmeister2020), and increasing the transparency of their actions (Alessandro et al., Reference Alessandro, Cardinale, Scartascini, Streb and Torrealday2021) all provide direct benefits to citizens, while also leading to greater trust by citizens. In the long run, there is a virtuous circle connecting policies that generate greater trust with demand for better policies. Understanding the role of trust in the demand for air quality and climate change policies is particularly important since these are some of the largest collective actions problems of our generation.
Competing interests
The authors declare none.
Supplementary material
The supplementary material for this article can be found at https://doi.org/10.1017/S1355770X2100036X.
Acknowledgements
This project received IRB approval from Harvard University Committee on the Use of Human Subjects as Protocol: IRB17-0091. The data collection was funded by a grant from the Inter-American Development Bank. We are grateful to Sara Restrepo Tamayo for excellent research assistance and to IPA Mexico, especially Cosma Gabaglio, for coordinating and implementing field work.



 Open access

