





Fruit and vegetable consumption is robustly associated with a reduced risk of chronic diseases and lower all-cause mortality(Reference Aune, Giovannucci and Boffetta1–Reference Van duyn and Pivonka3). Evidence supporting these associations has accumulated over decades, a legacy reflected in the global adoption of dietary recommendations promoting daily fruit and vegetable intake. The WHO recommends that adults eat 400 g of fruits and vegetables daily(4). In the UK, this is expressed as ‘5-a-day’ – five 80 g portions of fruits and vegetables. However, current estimates suggest that only 17 % of UK adults meet this target(5,6) , with average intakes of 3·3–3·7 portions/d, despite widespread awareness of the 5-a-day recommendation(Reference Rooney, McKinley and Appleton7,8) . Although there is a wealth of evidence identifying the barriers to meeting fruit and vegetable intake guidelines, public health initiatives and interventions to change such dietary behaviours have so far failed to reverse low levels of consumption. Frequently reported barriers include cost, availability, spoilage, palatability and a lack of preparation time and skills(Reference de Mestral, Stringhini and Marques-Vidal9,Reference Mc Morrow, Ludbrook and Macdiarmid10) . Fruit juice may help address some of these barriers, as it requires minimal preparation, is cost-effective, widely available and highly palatable, and products made from concentrate can be stored for several months at room temperature(Reference Clemens, Drewnowski and Ferruzzi11). EU and UK regulations state that products labelled as ‘fruit juice’ may not contain added sugars, preservatives, flavours or colours and that nothing should be removed from the juice – we retain this definition throughout the present paper. Although there is no official definition of fruit smoothies, here, we define them as a blend of whole fruits and fruit juice.
Including a daily portion of fruit juice in dietary guidelines could help improve adherence to 5-a-day guidelines. However, its role within a healthy diet is contentious, with significant international variation in intake recommendations. The WHO consider fruit juice a source of free sugars and recommends reducing intake of free sugars (regardless of source) to less than 10 % of daily energy intake(4). In 2017, France revised its guidelines so that fruit juice no longer counts towards recommended fruit intake(Reference Chaltiel, Julia and Adjibade12,13) . Similarly, New Zealand’s guidelines classify fruit juice as a sugary drink and advise limiting intake(14). Germany recommends consuming a 150 ml–200 ml portion of fruit juice only occasionally in place of a portion of fruit, no more than twice/week(15,16) . In the USA, fruit juice may regularly contribute to intake, with whole fruits recommended to constitute at least half of total fruit intake(17). Meanwhile, Australia recommends consuming fruit juice only occasionally, with one portion defined as 125 ml(18). In the UK, a maximum fruit juice intake of 150 ml/d is advised, which can contribute no more than one portion of the 5-a-day recommendation(6).
Concerns about including fruit juice in fruit and vegetable targets typically centre on the naturally occurring sugar profile and lower fibre content of fruit juice compared with whole fruit. While fruit juices contain an identical sugar content to their constituent whole fruits (in amount and types of sugars), the WHO guidelines classify all sugars in fruit juices as ‘free sugars’. Sugars in fruit juice are assumed to exist outside of the cell structure (‘free’), while sugars in whole fruits are deemed ‘intrinsic’ and held within the cell structure(19,Reference Ruxton, Derbyshire and Sievenpiper20) , a distinction that is important for the risk of developing dental caries(Reference Moynihan21). However, more recent evidence suggests the source of sugars (fruit sugars v. non-fruit sugars) has a greater influence on physiological responses to their consumption than the form in which fruit sugars are consumed (whole fruit v. fruit juice)(Reference Gonzalez22). Furthermore, even though juicing reduces the fibre content of fruit per 100 g, fibre is not completely removed from fruit juice. For example, 0·4 g of fibre remains per 150 ml portion of freshly squeezed orange juice(Reference Caswell23). In addition, 100 % fruit juices deliver bioavailable micronutrients (e.g. vitamin C, potassium, and folate) and bioactive compounds, such as polyphenols and carotenoids, that have been associated with antioxidant and other health benefits and, for certain compounds, may be more bioavailable and bioaccessible from juice than from whole fruit(Reference Ruxton and Myers24). Despite concerns about the sugar and fibre content of fruit juice, there is currently no consensus that modest consumption of fruit juice negatively impacts health outcomes(Reference Rossi, Mignogna and Rio25). A recent umbrella review concluded that modest fruit juice consumption may confer some potential health benefits, for example, on blood pressure, vascular function and inflammation, with limited evidence of adverse outcomes(Reference Beckett, Fayet-Moore and Cassettari26). Meanwhile, another recent review concluded that consuming fruit juice likely does not affect body composition and may positively impact some cardiometabolic and cognitive health outcomes(Reference Rossi, Mignogna and Rio25). Furthermore, a meta-analysis found that consuming fruit juice lowered diastolic blood pressure but had no effect on systolic blood pressure or serum cholesterol concentrations(Reference Liu, Xing and Chen27). Similarly, consumption of commercially available, flavanone-rich fruit juices has been linked with improved global cognitive function in older adults(Reference Kean, Lamport and Dodd28), alongside greater cerebral blood flow and improved depressive symptoms in young adults(Reference Lamport, Pal and Macready29,Reference Choi, Kim and Park30) .
Given the conflicting perspectives on the role of fruit juice in a healthy diet, further research is needed to assess the impact of including or excluding fruit juice in dietary recommendations on fruit and vegetable intake and on resulting changes in health markers. Therefore, the present study aimed to investigate adherence to UK 5-a-day advice, with and without one daily portion of fruit juice or smoothie on fruit and vegetable intake over a 4-week period. Our secondary aims were to explore between-intervention differences in: (1) biomarkers of fruit and vegetable intake (circulating ascorbic acid and carotenoid concentrations), (2) perceived ease of increasing fruit and vegetable intake, and (3) a suite of potentially responsive (within a 4-week time frame) markers of health, including mood, changes in gut symptoms and circulating markers of metabolic health.
Methods
Participants
We recruited healthy participants aged 18–65 years from the staff and student population at Newcastle University, UK, via posters and an internal social networking site. Only individuals habitually consuming ≤ 2 servings/d of fruit and vegetables were eligible to participate (as identified using the six-item BRFSS fruit and vegetable screener(31)). Individuals were excluded if they: (1) used vitamins, minerals or dietary supplements, (2) had a food sensitivity, allergy or dietary restriction that limited their ability to take part, (3) had a medical condition (e.g. kidney disease, liver disease, CVD, diabetes, cancer, gastrointestinal disorders and other relevant health conditions – including psychiatric conditions – which they have or are receiving medication/investigation for) that would limit their ability to participate and/or (4) were pregnant or lactating.
Design
The study was a 4-week open-label, parallel-group, randomised controlled trial testing two interventions to increase fruit and vegetable intake compared with a control (data collection period: 23 October 2024 to 21 March 2025). After expressing initial interest via an online form, individuals attended the laboratory at Newcastle University for a preliminary visit during which they provided written informed consent and completed a screening questionnaire to determine their eligibility to participate. The six-item BRFSS fruit and vegetable screener(31), which enquires about fruit and vegetable intake over the past 30 d, comprised part of the screening questionnaire. We calculated participants’ average frequency of fruit and vegetable consumption per day to assess study eligibility using four items from the BRFSS screener (excluding questions concerning potato consumption). Once their eligibility was confirmed, we measured their body mass and height. Eligible participants were invited to visit the laboratory on a second occasion to complete pre-intervention (baseline) assessments, which included several questionnaires and a venous blood sample. We also provided guidance on completing at-home dietary recalls prior to each laboratory visit and instructed participants on how to prepare for each laboratory visit (including fasting overnight, avoiding caffeine for 12 h and refraining from strenuous exercise and alcohol for 24 h). Following completion of the baseline measurements, participants were randomly assigned to one of three intervention arms and told which they had been allocated to: (1) Control; (2) Whole fruit and vegetables (FV) or (3) Whole fruit and vegetables plus fruit juice/smoothies (FV + FJ). The randomisation sequence was stratified by sex in blocks of six and generated using www.sealedenvelope.com(32). Researchers who recruited and collected data had access to the randomisation sequence. Participants were assigned a place in the sequence in the order in which they attended the laboratory for their baseline visit. Laboratory and at-home measurements were repeated at the end of the 4-week intervention period.
Study intervention
Control group
We asked participants in the control group to maintain their habitual diet for the 4-week intervention period and provided them with a brief document outlining the importance of a control group in research studies to encourage adherence to the group’s requirements. Control group participants received a £10 voucher per week during the intervention period (a total of £40) and an additional £60 upon study completion to mimic the voucher provision structure of the intervention groups. Participants in the control group could choose to spend their vouchers at any retailer supported by the gift card provider (GiftPay, Unified Incentives UK Ltd), including supermarkets. Mimicking the voucher provision of the intervention groups during the intervention period in the control group was designed to minimise participant attrition and reduce the risk of confounding by differential financial remuneration between groups. We chose not to limit the control group’s spending to supermarkets (as in the intervention groups) to minimise the risk that the vouchers inadvertently influenced their diet during the intervention period.
Whole fruit and vegetable intervention group
We asked participants in the FV intervention group to increase their fruit and vegetable intake to meet the 5-a-day guidelines for the 4-week intervention period, consuming only whole fruits and vegetables (i.e. not fruit juice/smoothies). One portion was defined as 80 g for fresh, frozen or tinned fruit and vegetables and 30 g for dried fruit. They received an educational information booklet to support dietary behaviour change (see Information booklet) and a £10 voucher per week during the intervention period (a total of £40) to support the purchase of fruits and vegetables from a supermarket of their choice. Participants chose a supermarket each week from the seven large UK supermarkets with which the gift card provider was affiliated. As in the control group, participants received an additional £60 voucher upon completion of the study to spend at a retailer of their choice.
Whole fruit and vegetable plus fruit juice intervention group
We asked participants in the FV + FJ intervention group to increase their fruit and vegetable intake to meet the 5-a-day guidelines for the 4-week intervention period with one portion per day consumed as fruit juice/smoothies. One portion of fruit juice/smoothie was defined as 150 ml of unsweetened, 100 % fruit juice/smoothie, including products made from concentrate. The type of fruit juice/smoothie consumed was not standardised, with participants free to select products based on their personal preferences to support acceptability and adherence. For participants who choose to consume apple juice, we advised consumption of cloudy rather than clear juice, given some evidence of superior health properties(Reference Vallée Marcotte, Verheyde and Pomerleau33). As in the FV group, the FV + FJ group received an information booklet to support dietary behaviour change. The FV + FJ group booklet contained additional information about consuming fruit juice/smoothies as one portion of their 5-a-day, including photographs demonstrating what 150 ml of juice looks like in different glass sizes, to support participants’ understanding of fruit juice/smoothie portion sizes. The FV + FJ received the same vouchers on the same schedule as the FV group.
Information booklet development
Participants in the FV and FV + FJ groups received a physical copy of a sixteen-page information booklet (available at https://osf.io/skgwa/). The booklet was initially designed to address key barriers to increasing fruit and vegetable intake identified by previous research(Reference de Mestral, Stringhini and Marques-Vidal9,Reference Mc Morrow, Ludbrook and Macdiarmid10) , specifically knowledge, preparation time and cost. The booklet provided to the FV group was identical to the one provided to the FV + FJ group, except that references to fruit juice/smoothies were removed. After completing a draft of the FV + FJ booklet, we conducted an online survey to collect public feedback on its design, content and usability. We used this feedback to refine the booklet’s clarity and content before beginning the trial. Further details of the online survey are presented in online Supplementary Materials 1–3.
Outcome assessment
Primary outcome: Fruit and vegetable intake
Participants remotely completed one 24-h dietary recall per day for the 4 d leading up to both their baseline and endpoint visits, using Intake24 – a validated and reliable dietary reporting software hosted online(Reference Foster, Lee and Imamura34). Intake24 uses a multiple-pass method to ensure accurate reporting of quantities and types of foods and drinks consumed in the previous 24 h. Our primary outcome was the number of portions of fruit and vegetables consumed daily at the endpoint, calculated from self-reported 24-h dietary recalls completed in the lead-up to the laboratory visit. We calculated fruit and vegetable intake at endpoint by summing the mass or volume of fruit and vegetables consumed and dividing by 80 g (for fruit/vegetables) or 150 ml (for fruit juice/smoothies), respectively. Intake was averaged across the number of days for which participants had provided dietary recalls. According to current UK guidelines, a 150 ml portion of fruit juice/smoothies can only contribute once per day to the 5-a-day target. Consequently, if participants reported consuming more than 150 ml of these drinks, we capped their daily portion contribution to one. As the same guidelines apply to legumes, we implemented an equivalent approach for these foods, capping the contribution to the 5-a-day at 80 g/d. The contribution of other fruits and vegetables was not capped to reflect current 5-a-day guidelines (e.g. if one consumes 160 g of bananas, it would count as two portions of fruit towards the 5-a-day). Fruit and vegetable intake data from Intake24 also served as the primary method for determining adherence to the interventions.
Secondary outcomes
Dietary intake
Using variables automatically calculated from Intake24, we explored how participants’ energy and macronutrient intake were affected by the interventions. Fibre values reflect AOAC.
Biomarkers
Blood collection and processing
Blood samples were collected at the baseline and endpoint study visits by a trained phlebotomist via venepuncture from an antecubital vein following an overnight fast. Plasma samples (used for vitamin C and metabolomics analyses) were collected into 4 ml lithium heparin vacutainer tubes (BD Vacutainer, Becton, Dickinson and Company). Tubes were gently inverted 5–10 times after sample collection and immediately placed on ice. Within 2 min of collection, samples were centrifuged at 2800 × g for 10 min at 4℃. Plasma intended for metabolomics analyses was aliquoted into two 350 µl portions. Plasma intended for vitamin C concentration measurements was aliquoted into three 300 µl portions, and each portion was mixed with an equal volume of 10 % metaphosphoric acid(Reference Robitaille and Hoffer35). Following this processing, all plasma samples were stored at –20℃ before being transferred to –80℃ freezers later the same day. Serum samples (used for carotenoid analysis) were collected into 4 ml serum separator vacutainer tubes (BD Vacutainer, Becton, Dickinson and Company) and left to clot in the dark at room temperature for 30–60 min. Samples were then centrifuged at 3000 × g for 10 min at 4℃. Serum was aliquoted into three 500 µl portions and stored at –20℃ before being transferred to –80℃ freezers later the same day.
Biomarkers of fruit and vegetable intake
As a secondary measure of dietary change, we analysed biomarkers that may be responsive in the short term to increased fruit and vegetable intake. We measured serum concentrations of lipid-soluble carotenoids (including α-carotene, β-carotene, β-cryptoxanthin, lutein, lycopene and zeaxanthin), using a previously validated HPLC method(Reference Liu, Lee and Garofalo36). Lutein and zeaxanthin are reported as a combined concentration, as the method did not separate their peaks. Plasma ascorbic acid concentrations were measured using a combination of methods, as follows. Once thawed, 5 µl of the sample was analysed on a Shimadzu Prominence HPLC system with isocratic mobile phase 0·5 % pH 2·8 ammonium dihydrogen phosphate at 1 ml/min(Reference Zhanguo and Jiuru37) using a Reverse-phase Luna 5µ C18 100A column (5 µm, 250 × 4·6 mm from Phenomenex) at 30℃ and detection at 245 nm. Measurements were taken at baseline and endpoint assessments for all participants.
Biomarkers of metabolic health
We used an untargeted metabolomics approach to quantitatively profile a range of biomarkers from plasma samples using Nightingale Health’s ‘Core Metabolomics’ Blood Analysis service(38). Measured biomarkers included amino acids (branched-chain and aromatic), lipoproteins, fatty acids, glycolysis-related metabolites, ketone bodies, markers of inflammation and markers of fluid balance. We did not include ratio or percentage change outcomes from the Nightingale panel, as per Hengist et al. (Reference Hengist, Davies and Walhin39), given documented concerns that they can be misleading(Reference Atkinson and Batterham40). Measurements were taken at baseline and during endpoint assessments for all participants. A full list of biomarkers is available at: https://research.nightingalehealth.com/.
Mood (depression and anxiety)
Participants completed the Patient Health Questionnaire-9 (PHQ-9)(Reference Kroenke, Spitzer and Williams41) and Generalised Anxiety Disorder Questionnaire (GAD-7)(Reference Spitzer, Kroenke and Williams42) during baseline and endpoint visits. These are validated tools for measuring depression and anxiety, respectively, and ask participants questions about how frequently they experienced depression-related (PHQ-9) and anxiety-related (GAD-7) symptoms in the last 2 weeks. Participants responded by choosing one of four options, each of which was associated with a value (‘Not at all’ (0), ‘Several days’ (1), ‘More than half the days’ (2) and ‘Nearly every day’ (3)). We calculated an outcome variable for each questionnaire by summing a participant’s answers.
Gut symptoms
During the endpoint visit, participants completed a questionnaire about changes in their gut symptoms in the past month. The questionnaire was selected because it is shown to be sensitive to short-term dietary interventions in healthy populations and captures common symptoms that may be experienced when increasing fruit and vegetable intake(Reference Winham and Hutchins43). Specifically, the questionnaire comprised four closed-ended questions (‘Yes’/‘No’) inquiring whether the participant experienced changes in flatulence, stool frequency, stool consistency and bloating in the past month. If a participant responded ‘Yes’ to any of these questions, they were asked to indicate the direction (‘Increase’/‘Decrease’) and magnitude (on a scale of 1 ‘Least change’ to 5 ‘Greatest change’) of the change, and whether these changes caused them to alter their social activities or daily routine.
Acceptability questionnaire
Participants completed a custom questionnaire at the end of their endpoint visit to assess intervention acceptability. Part of the questionnaire was informed by the Theoretical Framework of Acceptability(Reference Sekhon, Cartwright and Francis44) and contained questions concerning the ease and palatability of the interventions, as well as the potential for longer-term maintenance of behaviour. We used these responses to assess acceptability and preferences regarding 5-a-day recommendations with and without the inclusion of fruit juice/smoothies. The rest of the questionnaire comprised questions adapted from the public involvement study conducted to develop the information booklets, to obtain feedback from participants who used them on the suitability and efficacy of the materials to support behaviour change.
Statistical analyses
The present study was primarily designed and powered to detect between-group differences in post-intervention fruit and vegetable intake. We determined our required sample size via a priori power analysis, conducted for omnibus ANCOVA using the ‘Superpower’ package in R(Reference Lakens and Caldwell45). The power analysis suggested that eleven participants per group would provide 83 % power to detect at least a one portion difference in endpoint fruit and vegetable intake between the control (μ = 2) and the intervention groups (FV, μ = 3; FV + FJ, μ = 3) at an α level of 0·05. Estimated values for the post-intervention sd of intake (0·93) and the correlation between pre- and post-intervention intake (R 2 = 0·36) were informed by previous research(Reference McCall, McGartland and McKinley46,Reference Neville, McKinley and Draffin47) . To allow for potential participant attrition and data loss, we recruited forty-two participants (fourteen per study arm).
For our primary outcome, we compared endpoint fruit and vegetable portion intakes of the control, FV and FV + FJ groups using ANCOVA, with baseline intake, age and BMI included as covariates. Fruit juice/smoothie intake was capped at one portion/d (150 ml) in line with UK 5-a-day guidance, and this capped definition was used to calculate the primary outcome as the outcome itself was designed to reflect adherence to UK dietary guidelines. An additional secondary analysis was conducted without this cap. To establish whether a particular category of fruit or vegetables contributed to between-group differences in overall intake, we conducted a series of ANCOVA with endpoint consumption of fruit juice/smoothies, fruit, dried fruit, tomatoes, brassica vegetables, peppers, other vegetables and beans (including pulses) as outcome variables, again, with covariates of age, BMI and baseline intake. Food group categories were based on the predefined classification system within Intake24. We adjusted this series of ANCOVA for multiple testing using the Bonferroni method (k = 8). We used an equivalent approach to assess differences in dietary macronutrient and energy composition between groups at the endpoint (k = 8).
Furthermore, we conducted additional ANCOVA to assess the effectiveness of our intervention on our secondary outcome measures (serum carotenoid concentration, plasma ascorbic acid concentration, metabolomic markers, depression and anxiety scores (PHQ-9 and GAD-7 scores)) with their endpoint values as response variables, and covariates of age, BMI and the corresponding baseline value of the respective response variable. Both the series of ANCOVA conducted for carotenoid concentrations (total, α-carotene, β-carotene, β-cryptoxanthin, lutein + zeaxanthin and lycopene) and the series of ANCOVA conducted for the metabolic markers concentrations were adjusted for multiple comparisons using the Bonferroni method (k = 6 and k = 40, respectively). We used k = 40 for the latter, as previous analyses of the Nightingale panel(Reference Würtz, Kangas and Soininen48) suggested that correcting for all markers is overly conservative. The markers are correlated with one another, and there are 30–50 principal components in the panel; thus, we chose k = 40 so that our number of adjustments was in the mid-point of this range.
If any of the ANCOVA produced a significant result, we assessed which groups differed by running pairwise comparisons between groups, adjusting for multiple comparisons using the Bonferroni method (k = 3; note that our approach led to some P values ≥ 1, and such values are reported as P = 1·00). Unless otherwise stated, in the Results section that follows, we present group summary statistics as estimated marginal means (EMM) and their se, adjusted for the corresponding baseline value of the variable, age and BMI, followed by the 95 % CI for the EMM. Covariates used across the ANCOVA (baseline value of the outcome, age and BMI) were selected a priori based on their potential to improve model precision and account for inter-individual variability in dietary intake rather than to control for confounding, as randomisation was expected to minimise systematic differences between groups. We did not adjust for additional lifestyle or socio-economic variables, as these were not collected and are unlikely to have differed systematically between groups due to the randomised design.
Due to the nature of the data, we used a different approach to evaluate group differences in changes in gut symptoms. For each symptom, we used a 3 × 3 Fisher’s exact test to compare the proportions of participants in each of the three groups who reported no change, an increase or a decrease in symptoms. To explore group differences in the total number of gut symptoms in which participants reported a change, we employed a one-way ANOVA. We used a one-way multivariate ANOVA (MANOVA) to compare the magnitude of changes in each symptom between groups. For these magnitudes of change variables, those reporting no change in a given symptom were scored as 0, and those reporting increases or decreases were scored as their reported magnitude multiplied by +1 or −1, respectively. To assess whether there were group differences in the number of participants altering their social activities due to changes in their gut symptoms, we used a 3 × 2 Fisher’s exact test. We summed the number of participants who reported altering their social activities across symptoms for each group, as there was no variation in reporting for some symptoms (e.g. no participants in any group reported altering social activities as a result of changes in their stool frequency or stool consistency).
We used R to conduct all analyses(49), using commonly used packages for data processing, visualisation and statistical modelling(Reference Bates, Mächler and Bolker50–Reference Wickham, Averick and Bryan55). To visualise our metabolomics analyses, we used GraphPad Prism version 10.5.0 for Windows, GraphPad Software, Boston, Massachusetts USA, www.graphpad.com.
Results
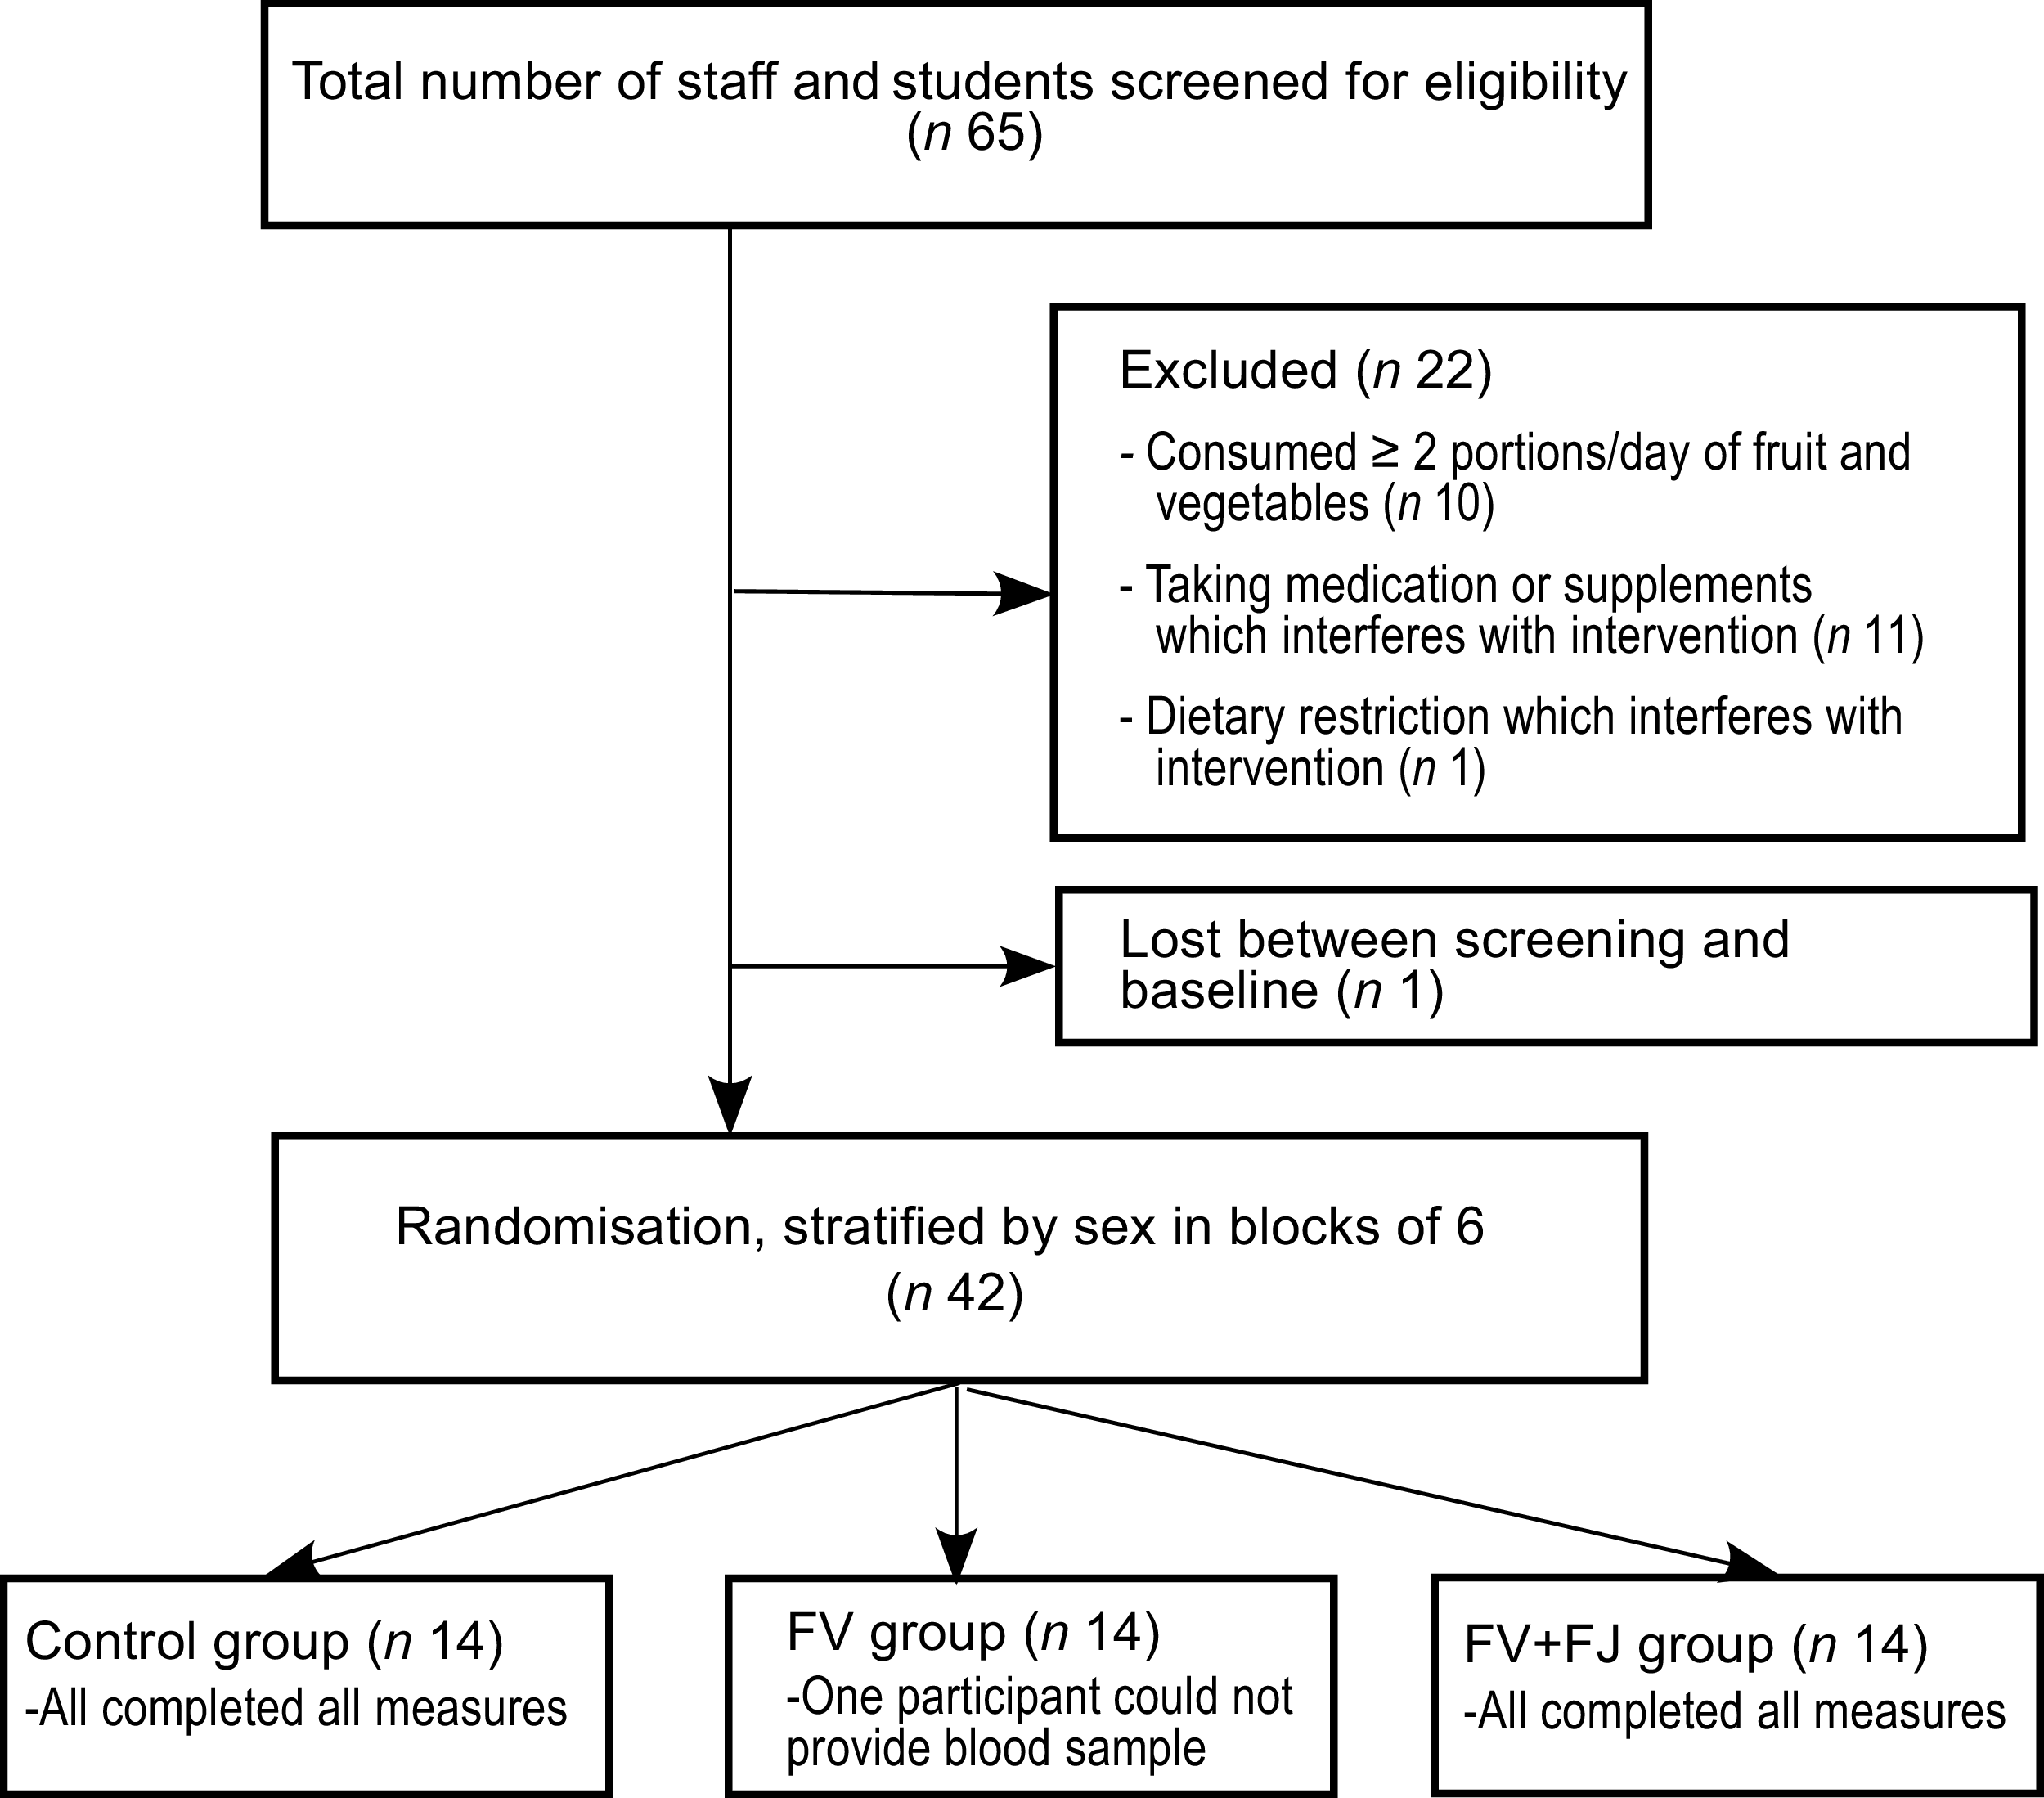
Of the sixty-five individuals screened, forty-two were eligible to participate (males, n 21; females, n 21) and were randomised to one of the three study arms (Figure 1). No participant withdrew during the study; however, one participant was unable to provide blood samples at the baseline and endpoint. Therefore, data from forty-two participants were available for inclusion in all analyses, except for biomarker analyses (n 41). Participants’ characteristics at screening are presented in Table 1. The percentage of participants with a BMI ≥ 25 (in the overweight or obesity range) in the Control, FV and FV + FJ groups were 50 %, 57·14 % and 42·86 %, respectively
Flow diagram of individuals through study. FV, whole fruit and vegetables; FV + FJ, whole fruit and vegetables plus fruit juice and smoothies.

Figure 1. Long description
The flowchart begins with the total number of staff and students screened for eligibility, which is 65. From this group, 22 individuals are excluded for various reasons: 10 consumed two or more portions of fruit and vegetables per day, 11 were taking medication or supplements that interfere with the intervention, and 1 individual had a dietary restriction that interfered with the intervention. Additionally, 1 individual was lost between screening and baseline. This leaves 42 individuals who are randomized into three groups: the control group, the FV group, and the FV+FJ group. Each group consists of 14 individuals. In the control group, all participants completed all measures. In the FV group, one participant could not provide a blood sample. In the FV+FJ group, all participants completed all measures.
Characteristics of study participants at screening

Table 1. Long description
The table presents the characteristics of study participants at screening, divided into three groups: Control, FV, and FV + FJ. It includes data on age, body mass index (BMI), and daily portions of fruit and vegetables. The table has three columns for each group, showing the mean (M), standard deviation (SD), and range for each characteristic. For age, the Control group has a mean of 27.0 years, a standard deviation of 7.9 years, and a range of 18 to 42 years. The FV group has a mean age of 30.5 years, a standard deviation of 11.8 years, and a range of 18 to 64 years. The FV + FJ group has a mean age of 32.4 years, a standard deviation of 11.0 years, and a range of 20 to 53 years. For BMI, the Control group has a mean of 25.7, a standard deviation of 5.5, and a range of 18.0 to 40.8. The FV group has a mean BMI of 26.9, a standard deviation of 6.3, and a range of 19.7 to 39.3. The FV + FJ group has a mean BMI of 25.8, a standard deviation of 4.8, and a range of 19.3 to 38.0. For daily portions of fruit and vegetables, the Control group has a mean of 1.2 portions, a standard deviation of 0.6 portions, and a range of 0.5 to 1.7 portions. The FV group has a mean of 0.8 portions, a standard deviation of 0.5 portions, and a range of 0.1 to 1.9 portions. The FV + FJ group has a mean of 1.2 portions, a standard deviation of 0.6 portions, and a range of 0.0 to 1.9 portions.
FV, whole fruit and vegetables; FV + FJ, whole fruit and vegetables plus fruit juice and smoothies.
* Calculated using BRFSS screening tool(31).
Primary outcome: Fruit and vegetable intake
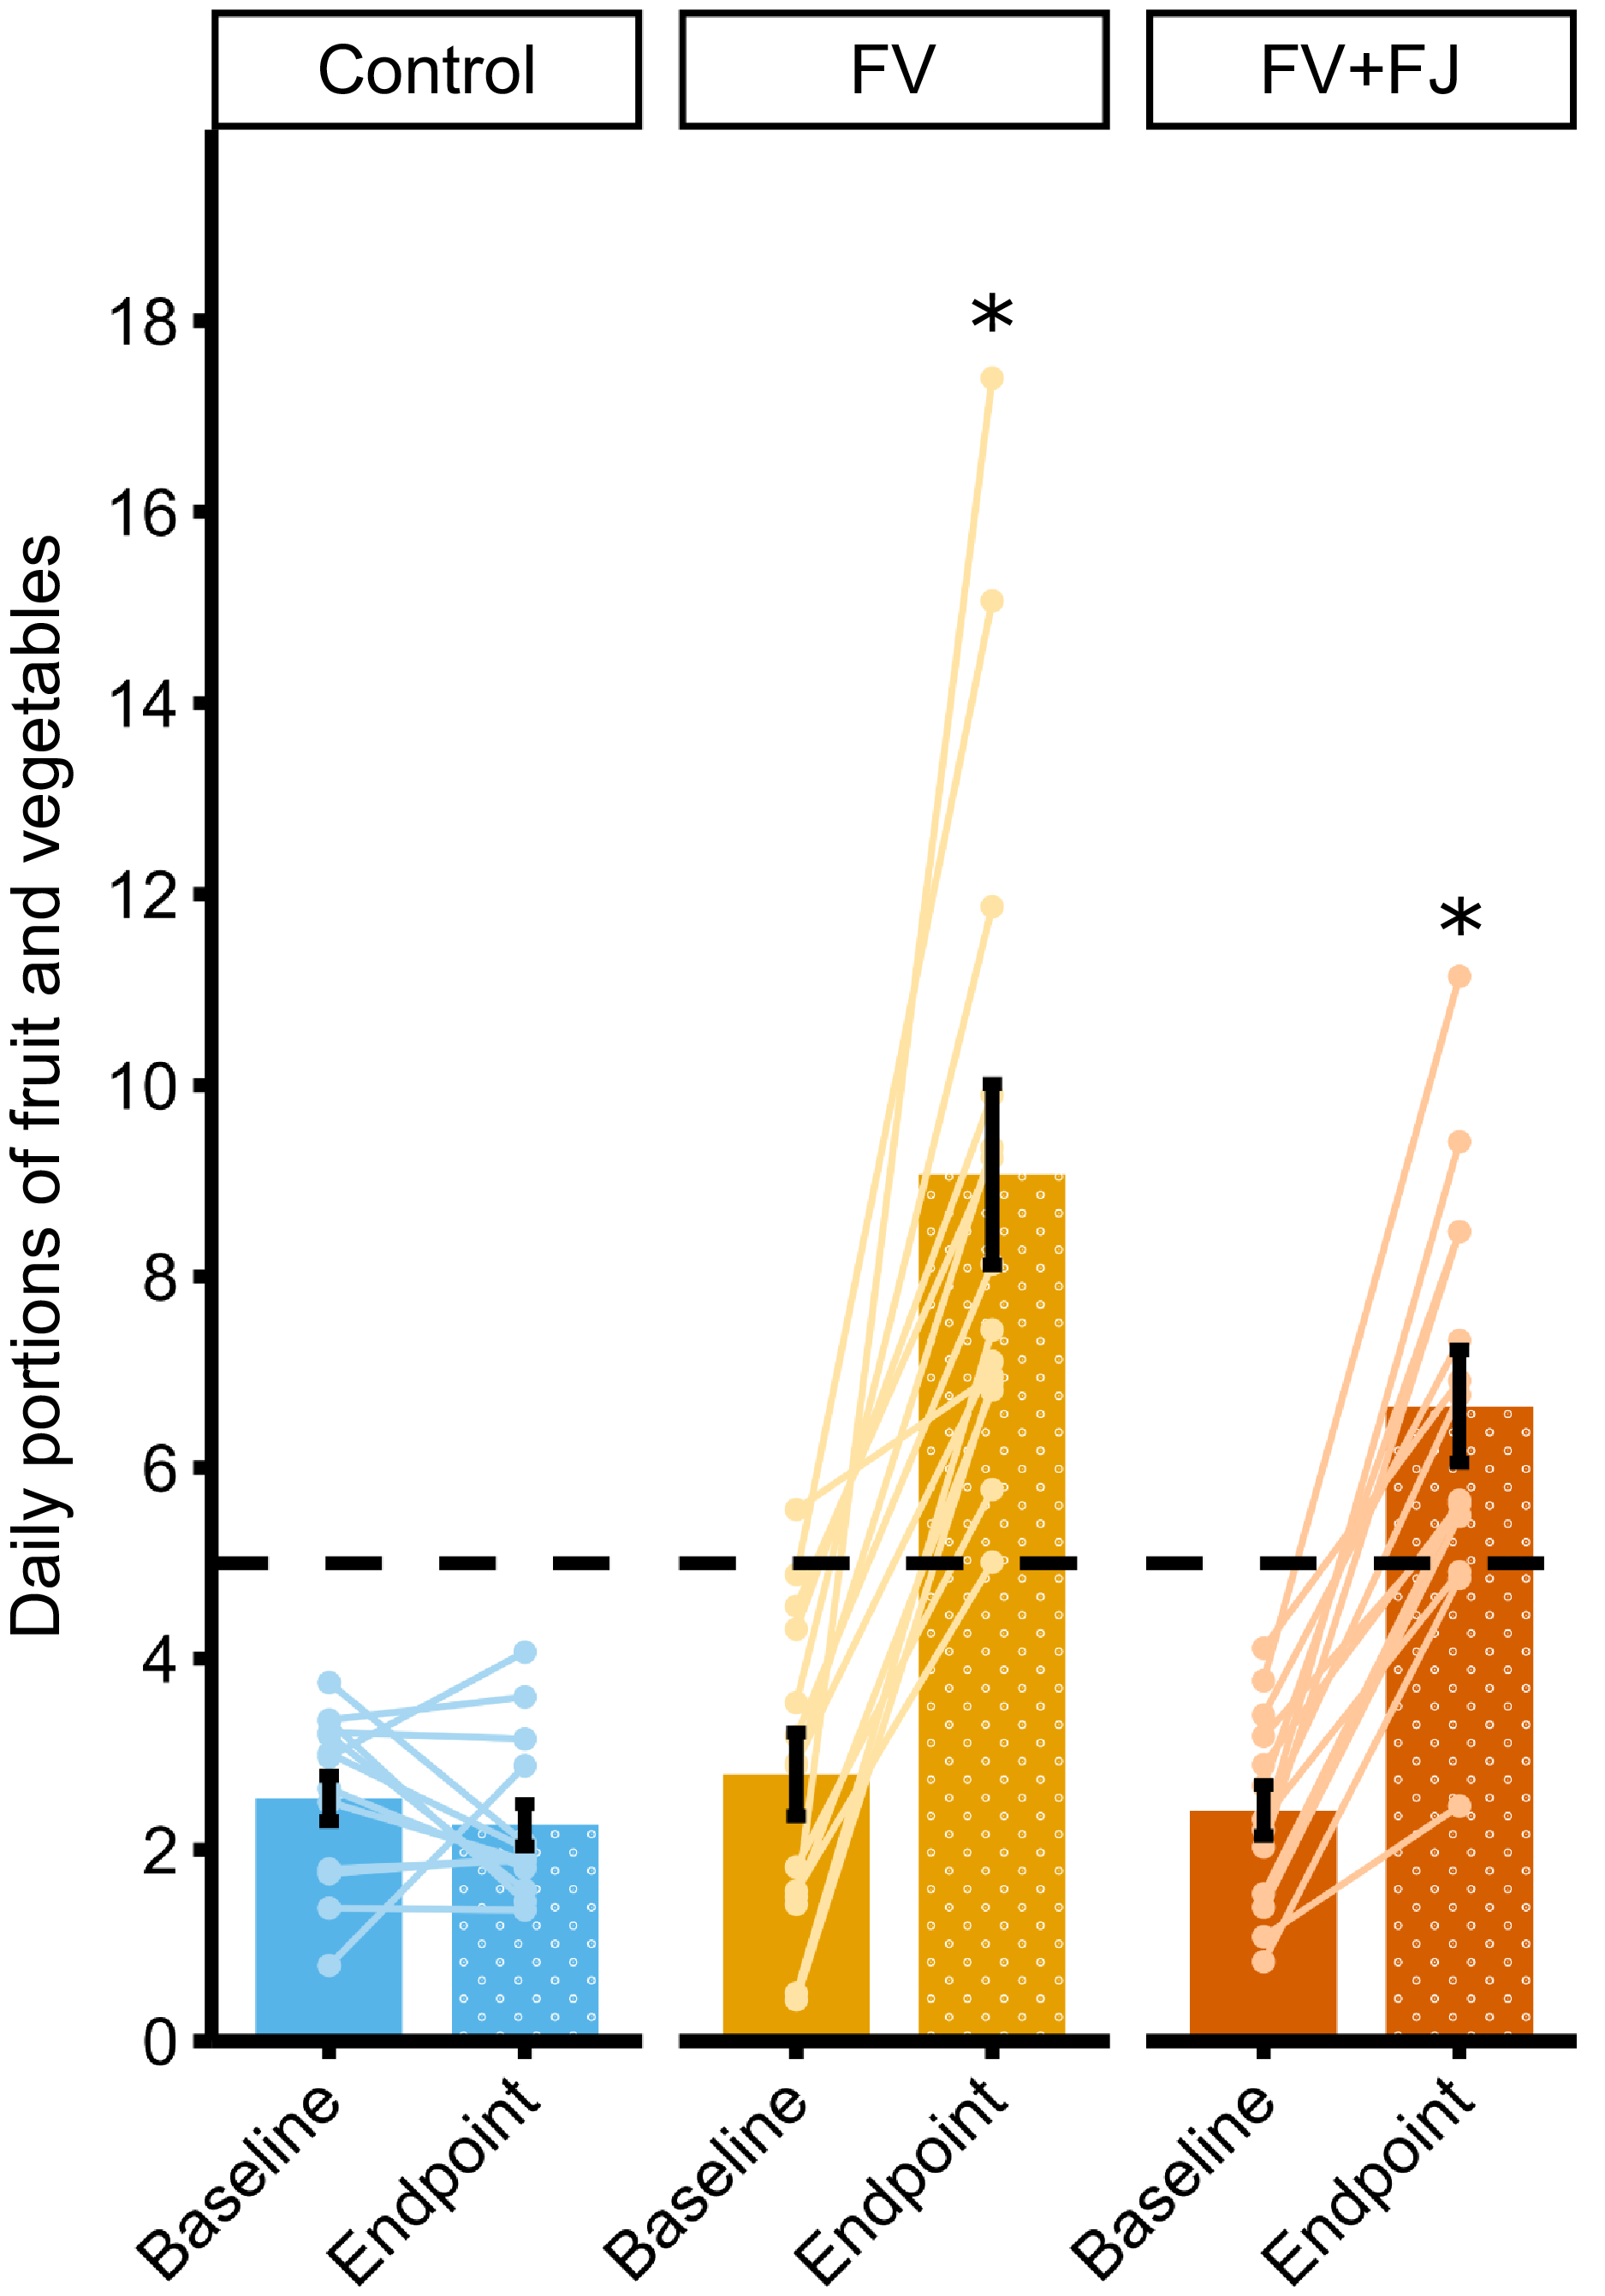
When capping portions of fruit juice/smoothies and pulses in line with UK dietary guidelines, the number of fruit and vegetable portions consumed daily at endpoint – as determined by four 24-hr dietary recalls – was significantly different between groups (P < 0·001; η p 2 = 0·62, 95 % CI (0·45, 1·00); Figure 2). Follow-up pairwise comparisons showed that the FV (M = 8·90, se = 0·64, 95 % CI (7·60, 10·19); P < 0·001) and FV + FJ (M = 6·62, se = 0·64, 95 % CI (5·32, 7·92); P < 0·001) groups had significantly higher consumption post-intervention than the control group (M = 2·45, se = 0·64, 95 % CI (1·15, 3·75)), but FV + FJ and FV did not significantly differ from each other after adjusting for multiple comparisons (P = 0·051). Our primary outcome was robust to sensitivity analyses that excluded two participants from the FV group who reported consuming over twelve servings of fruit and vegetables per day on average at endpoint (see online Supplementary Materials 4). At baseline and endpoint, none of the participants in the control group met UK 5-a-day guidelines. At baseline, 7·14 % (one participant) of the FV group and 0 % of the FV + FJ group met UK 5-a-day guidelines. However, at endpoint, 100 % of the FV group and 78·57 % (11 participants) of the FV + FJ group met UK 5-a-day guidelines.
Mean (raw) daily portions of fruit and vegetable intake at baseline and endpoint from 24-h dietary recalls. Note: Error bars are ±1 standard error around the mean, and lines are individual participant changes from baseline to endpoint. * denotes significantly higher intake than control, with P values for follow-up pairwise comparisons adjusted for multiple testing (Bonferroni method, k = 3). Counts for fruit juice/smoothies, and pulses, were capped at one portion per day in line with UK dietary guidelines. FV, whole fruit and vegetables; FV + FJ, whole fruit and vegetables plus fruit juice and smoothies.

Figure 2. Long description
The bar graph compares daily portions of fruit and vegetables at baseline and endpoint for three groups: Control, FV, and FV plus FJ. The x-axis represents the time points (Baseline and Endpoint), and the y-axis represents the daily portions of fruit and vegetables. The Control group shows minimal change from baseline to endpoint, with values around 2 to 3 portions. The FV group shows a significant increase from baseline to endpoint, with values rising from around 3 to approximately 9 portions. The FV plus FJ group also shows a notable increase from baseline to endpoint, with values rising from around 3 to approximately 7 portions. Error bars indicate standard error around the mean, and lines represent individual participant changes. The FV and FV plus FJ groups have significantly higher intake than the Control group, denoted by asterisks. The color scheme includes blue for the Control group, yellow for the FV group, and orange for the FV plus FJ group. All values are approximated.
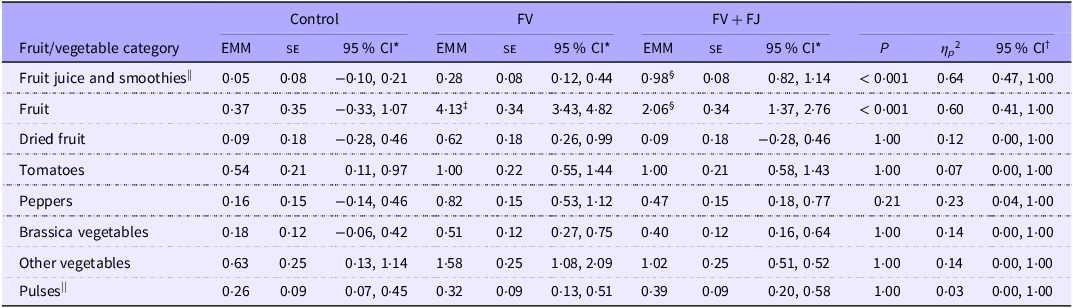
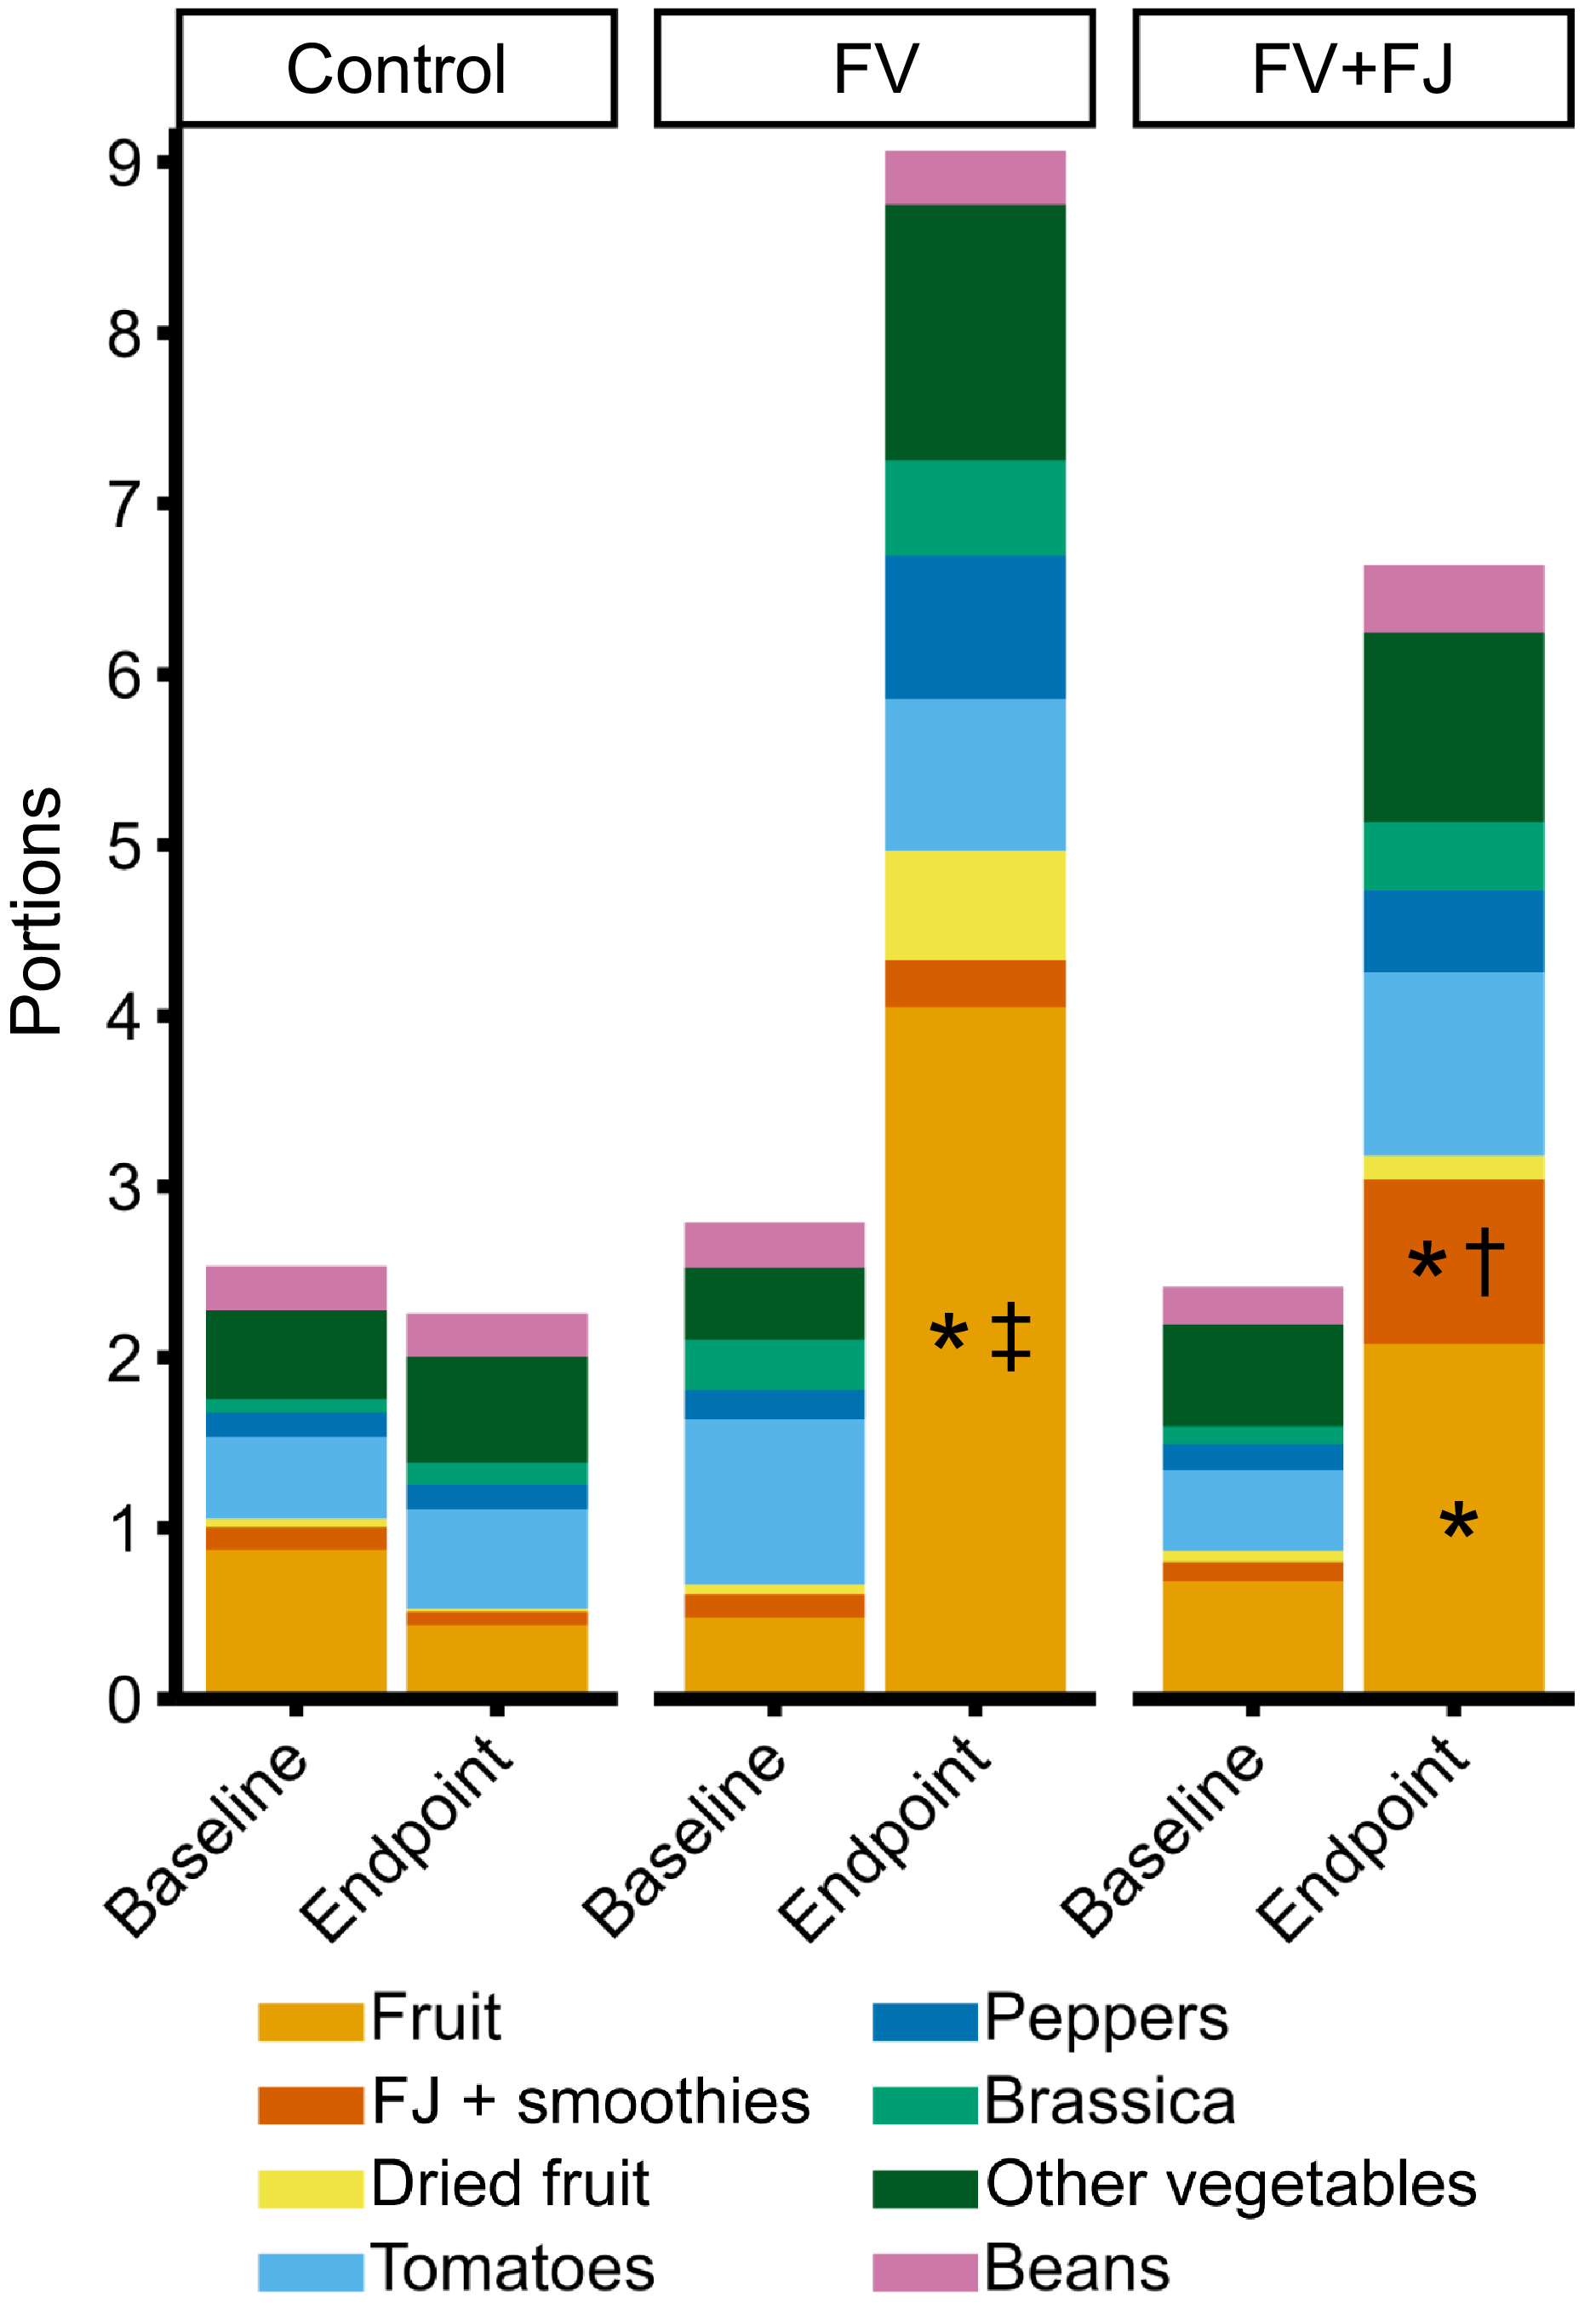
There were no significant differences between groups in endpoint intake of dried fruit, tomatoes, brassica vegetables, peppers, other vegetables and pulses; group differences at endpoint were due to increases in fruit juice/smoothie intake (as expected in the FV + FJ group), as well as whole fruit intake (for all EMM, se, P values, effect sizes and CI, see Table 2; Figure 3). The FV + FJ group consumed more portions of fruit juice/smoothies per day than the control (P < 0·001) and FV (P < 0·001) groups, but intake did not significantly differ between the control and the FV groups (P = 0·15). The FV group consumed more whole fruit than the FV + FJ (P < 0·001) and control groups (P < 0·001). Fruit intake was also higher in the FV + FJ than in the control group (P = 0·005). This indicates that higher endpoint total fruit and vegetable intake in the FV and FV + FJ groups compared with control was driven predominantly by changes in fruit intake (including fruit juice/smoothies in the FV + FJ group), with no evidence of higher endpoint vegetable intake in the intervention groups compared with control.
ANCOVA results assessing post-intervention intake (portions/d) of fruit and vegetable categories across intervention groups, with baseline intake of that corresponding category, age and BMI as covariates
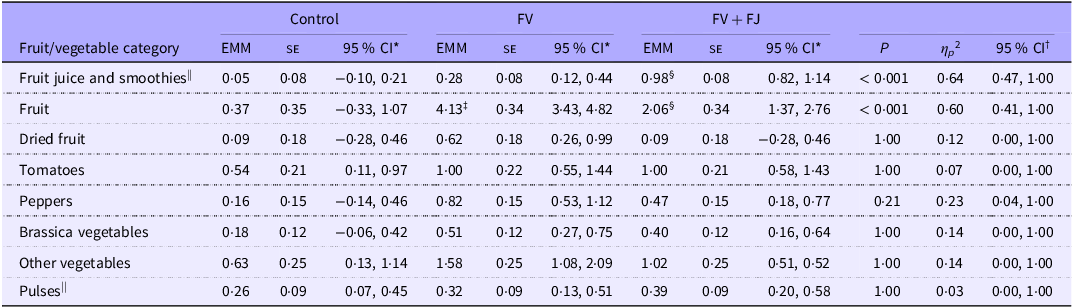
Table 2. Long description
The table presents ANCOVA results assessing post-intervention intake of various fruit and vegetable categories across three groups: Control, FV, and FV + FJ. The table includes columns for estimated marginal means (EMM), standard error (SE), 95% confidence intervals (CI), P-values, and effect sizes (eta squared). The fruit and vegetable categories analyzed include fruit juice and smoothies, fruit, dried fruit, tomatoes, peppers, brassica vegetables, other vegetables, and pulses. Notable trends include higher intake of fruit juice and smoothies in the FV + FJ group compared to the Control and FV groups, and higher whole fruit intake in the FV group compared to both the FV + FJ and Control groups. There were no significant differences between groups in endpoint intake of dried fruit, tomatoes, brassica vegetables, peppers, other vegetables, and pulses.
FV, whole fruit and vegetables; FV + FJ, whole fruit and vegetables plus fruit juice and smoothies; EMM, estimated marginal mean (adjusted for baseline, age and BMI).
*95 % CI of the EMM.
†95 % CI of the effect size estimate (η p 2).
‡FV significantly different from control.
§FV + FJ significantly different from FV.
||Capped at a maximum of one portion per day in line with 5-a-day recommendations. P values are adjusted for multiple testing (Bonferroni method, k = 8).
Mean (raw) daily portion intake of each fruit and vegetable category at baseline and endpoint from 24-h dietary recalls. Note: Counts for fruit juice/smoothies and pulses were capped at one portion per day in line with UK dietary guidelines. *denotes significantly higher intake than control group, † denotes significantly higher intake than FV group, ‡ denotes significantly higher intake than FV + FJ group, with P values for follow-up pairwise comparisons adjusted for multiple testing (Bonferroni method, k = 8). FV, whole fruit and vegetables; FV + FJ, whole fruit and vegetables plus fruit juice and smoothies.

Figure 3. Long description
The bar graph compares the mean daily portion intake of various fruit and vegetable categories across three groups: Control, FV, and FV plus FJ, at baseline and endpoint. The x-axis represents the time points (Baseline and Endpoint) for each group, while the y-axis indicates the number of portions. The graph is a stacked bar chart with different colors representing different categories: Fruit, FJ plus smoothies, Dried fruit, Tomatoes, Peppers, Brassica, Other vegetables, and Beans. The Control group shows minimal change from baseline to endpoint. The FV group shows a significant increase in fruit and vegetable intake at the endpoint, particularly in the Fruit category. The FV plus FJ group also shows a significant increase, with notable portions from FJ plus smoothies. Annotations indicate significant differences in intake compared to other groups. All values are approximated.
When we removed the one portion/d cap on fruit juice/smoothies intake, the total number of fruit and vegetable portions consumed daily at endpoint differed significantly between the groups (P < 0·001; η p 2 = 0·65, 95 % CI (0·48, 1·00); online Supplementary Materials 5–6), with no significant difference between the FV (M = 8·99, se = 0·63, 95 % CI (7·70, 10·27)) and FV + FJ groups (M = 7·73, se = 0·64, 95 % CI (6·44, 9·01); P = 0·51), but higher total fruit and vegetable consumption in both groups compared with the control (M = 2·41, se = 0·64, 95 % CI (1·12, 3·70); both P < 0·001). On average (raw means), the FV + FJ group consumed 2·04 (sd = 0·96) portions of fruit juice/smoothies per day after the intervention. In contrast, the FV and control groups consumed 0·34 (sd = 0·53) and 0·10 (sd = 0·32) portions, respectively. See online Supplementary Materials 7 for further breakdown in ml, servings and contributions of fruit juices v. fruit smoothies. At endpoint in the FV + FJ group, there were twenty-one reports of smoothie consumption and thirty-five reports of fruit juice consumption (thirteen orange, nine apple, thirteen mixed juices or other fruits).
Secondary outcomes
Dietary intake
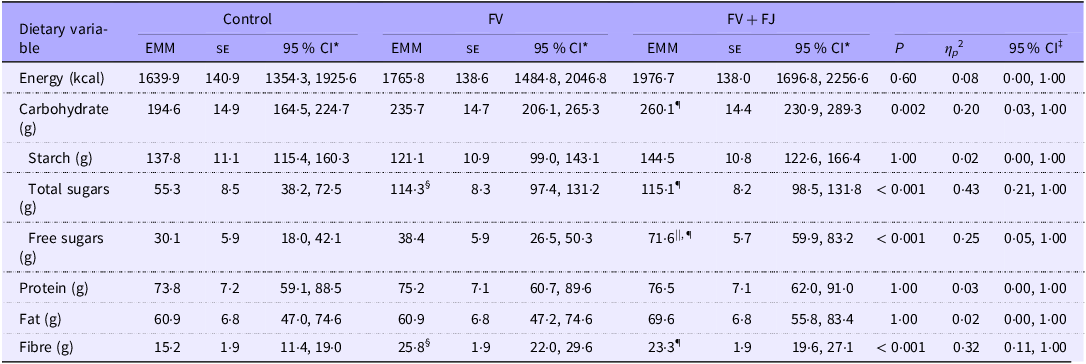
To assess broader dietary changes, we conducted a series of ANCOVA with energy (kcal), carbohydrates, protein, fat and fibre (all measured in grams) intake at endpoint as outcome variables (for all EMM, se, P values, effect sizes and CI, see Table 3). Post-intervention carbohydrate, total sugars, free sugars and fibre intake significantly differed between groups. Carbohydrate intake was higher in the FV + FJ group than the control group (P = 0·01), but there was no significant difference in carbohydrate intake between the FV + FJ and the FV group (P = 0·72), nor between the FV and control group (P = 0·19). Because of these group differences in carbohydrate intake, we explored which carbohydrates may contribute to these differences by also running the same analyses with starch, total sugars and free sugars. Total sugars intake was higher in both the FV + FJ (P < 0·001) and FV group (P < 0·001) than the control group, but there was no significant difference between the FV + FJ and FV groups (P = 1·00). Intake of free sugars was higher in the FV + FJ group compared with both the control (P < 0·001) and the FV groups (P < 0·001). However, there was no significant difference in intake of free sugars between the FV and control groups (P = 1·00). Lastly, fibre intake was significantly higher in the FV + FJ (P = 0·01) and FV groups (P = 0·001) compared with the control group, with no difference between the FV + FJ and FV groups (P = 1·00). Descriptive statistics of baseline and endpoint values for each group for each dietary variable are presented in online Supplementary Materials 8.
ANCOVA results assessing post-intervention energy (kcal) and macronutrient intake (g) across intervention groups, with baseline intake of that corresponding variable, age and BMI as covariates
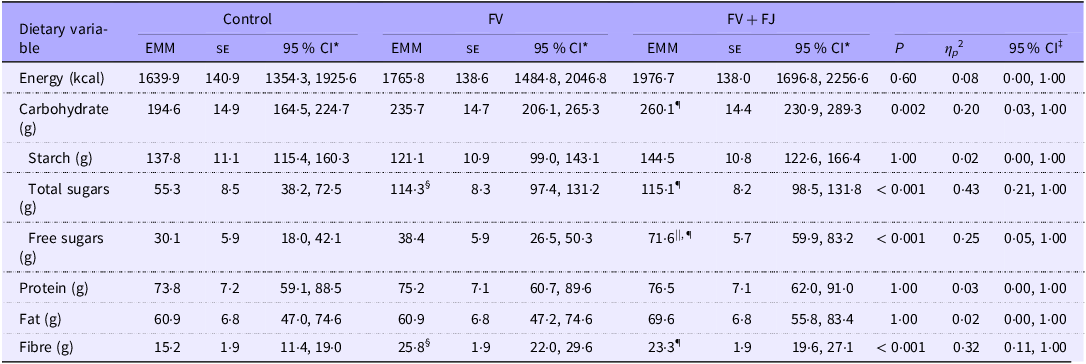
Table 3. Long description
The table presents ANCOVA results assessing post-intervention energy and macronutrient intake across three intervention groups: Control, FV, and FV + FJ. The table includes nine rows for different dietary variables and three columns for each group, with additional columns for standard error, confidence intervals, P values, and effect sizes. Key variables include energy in kilocalories, carbohydrates, starch, total sugars, free sugars, protein, fat, and fiber in grams. Notable trends include higher carbohydrate intake in the FV + FJ group compared to the Control group, higher total sugars intake in both the FV + FJ and FV groups compared to the Control group, and higher fiber intake in the FV + FJ and FV groups compared to the Control group. The table provides detailed statistical data to compare dietary changes across the groups.
FV, whole fruit and vegetables; FV + FJ, whole fruit and vegetables plus fruit juice and smoothies; EMM, estimated marginal mean (adjusted for baseline, age and BMI).
*95 % CI of the EMM.
‡95 % CI of the effect size estimate (η p 2).
§FV significantly different from control.
||FV + FJ significantly different from FV.
¶FV + FJ significantly different from control. P values are adjusted for multiple testing (Bonferroni method, k = 8).
Biomarkers of fruit and vegetable intake
Fasted circulating ascorbic acid concentration
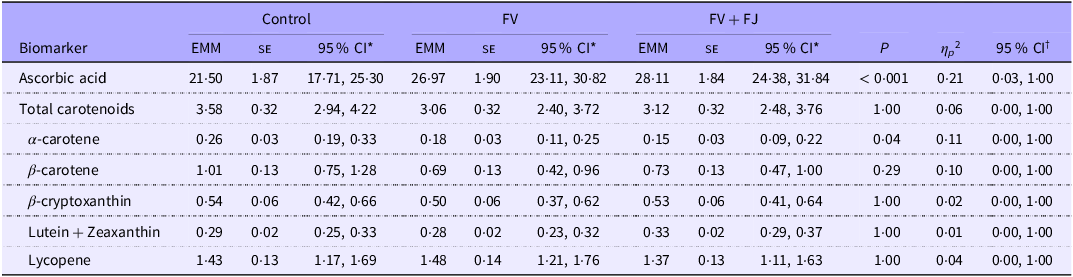
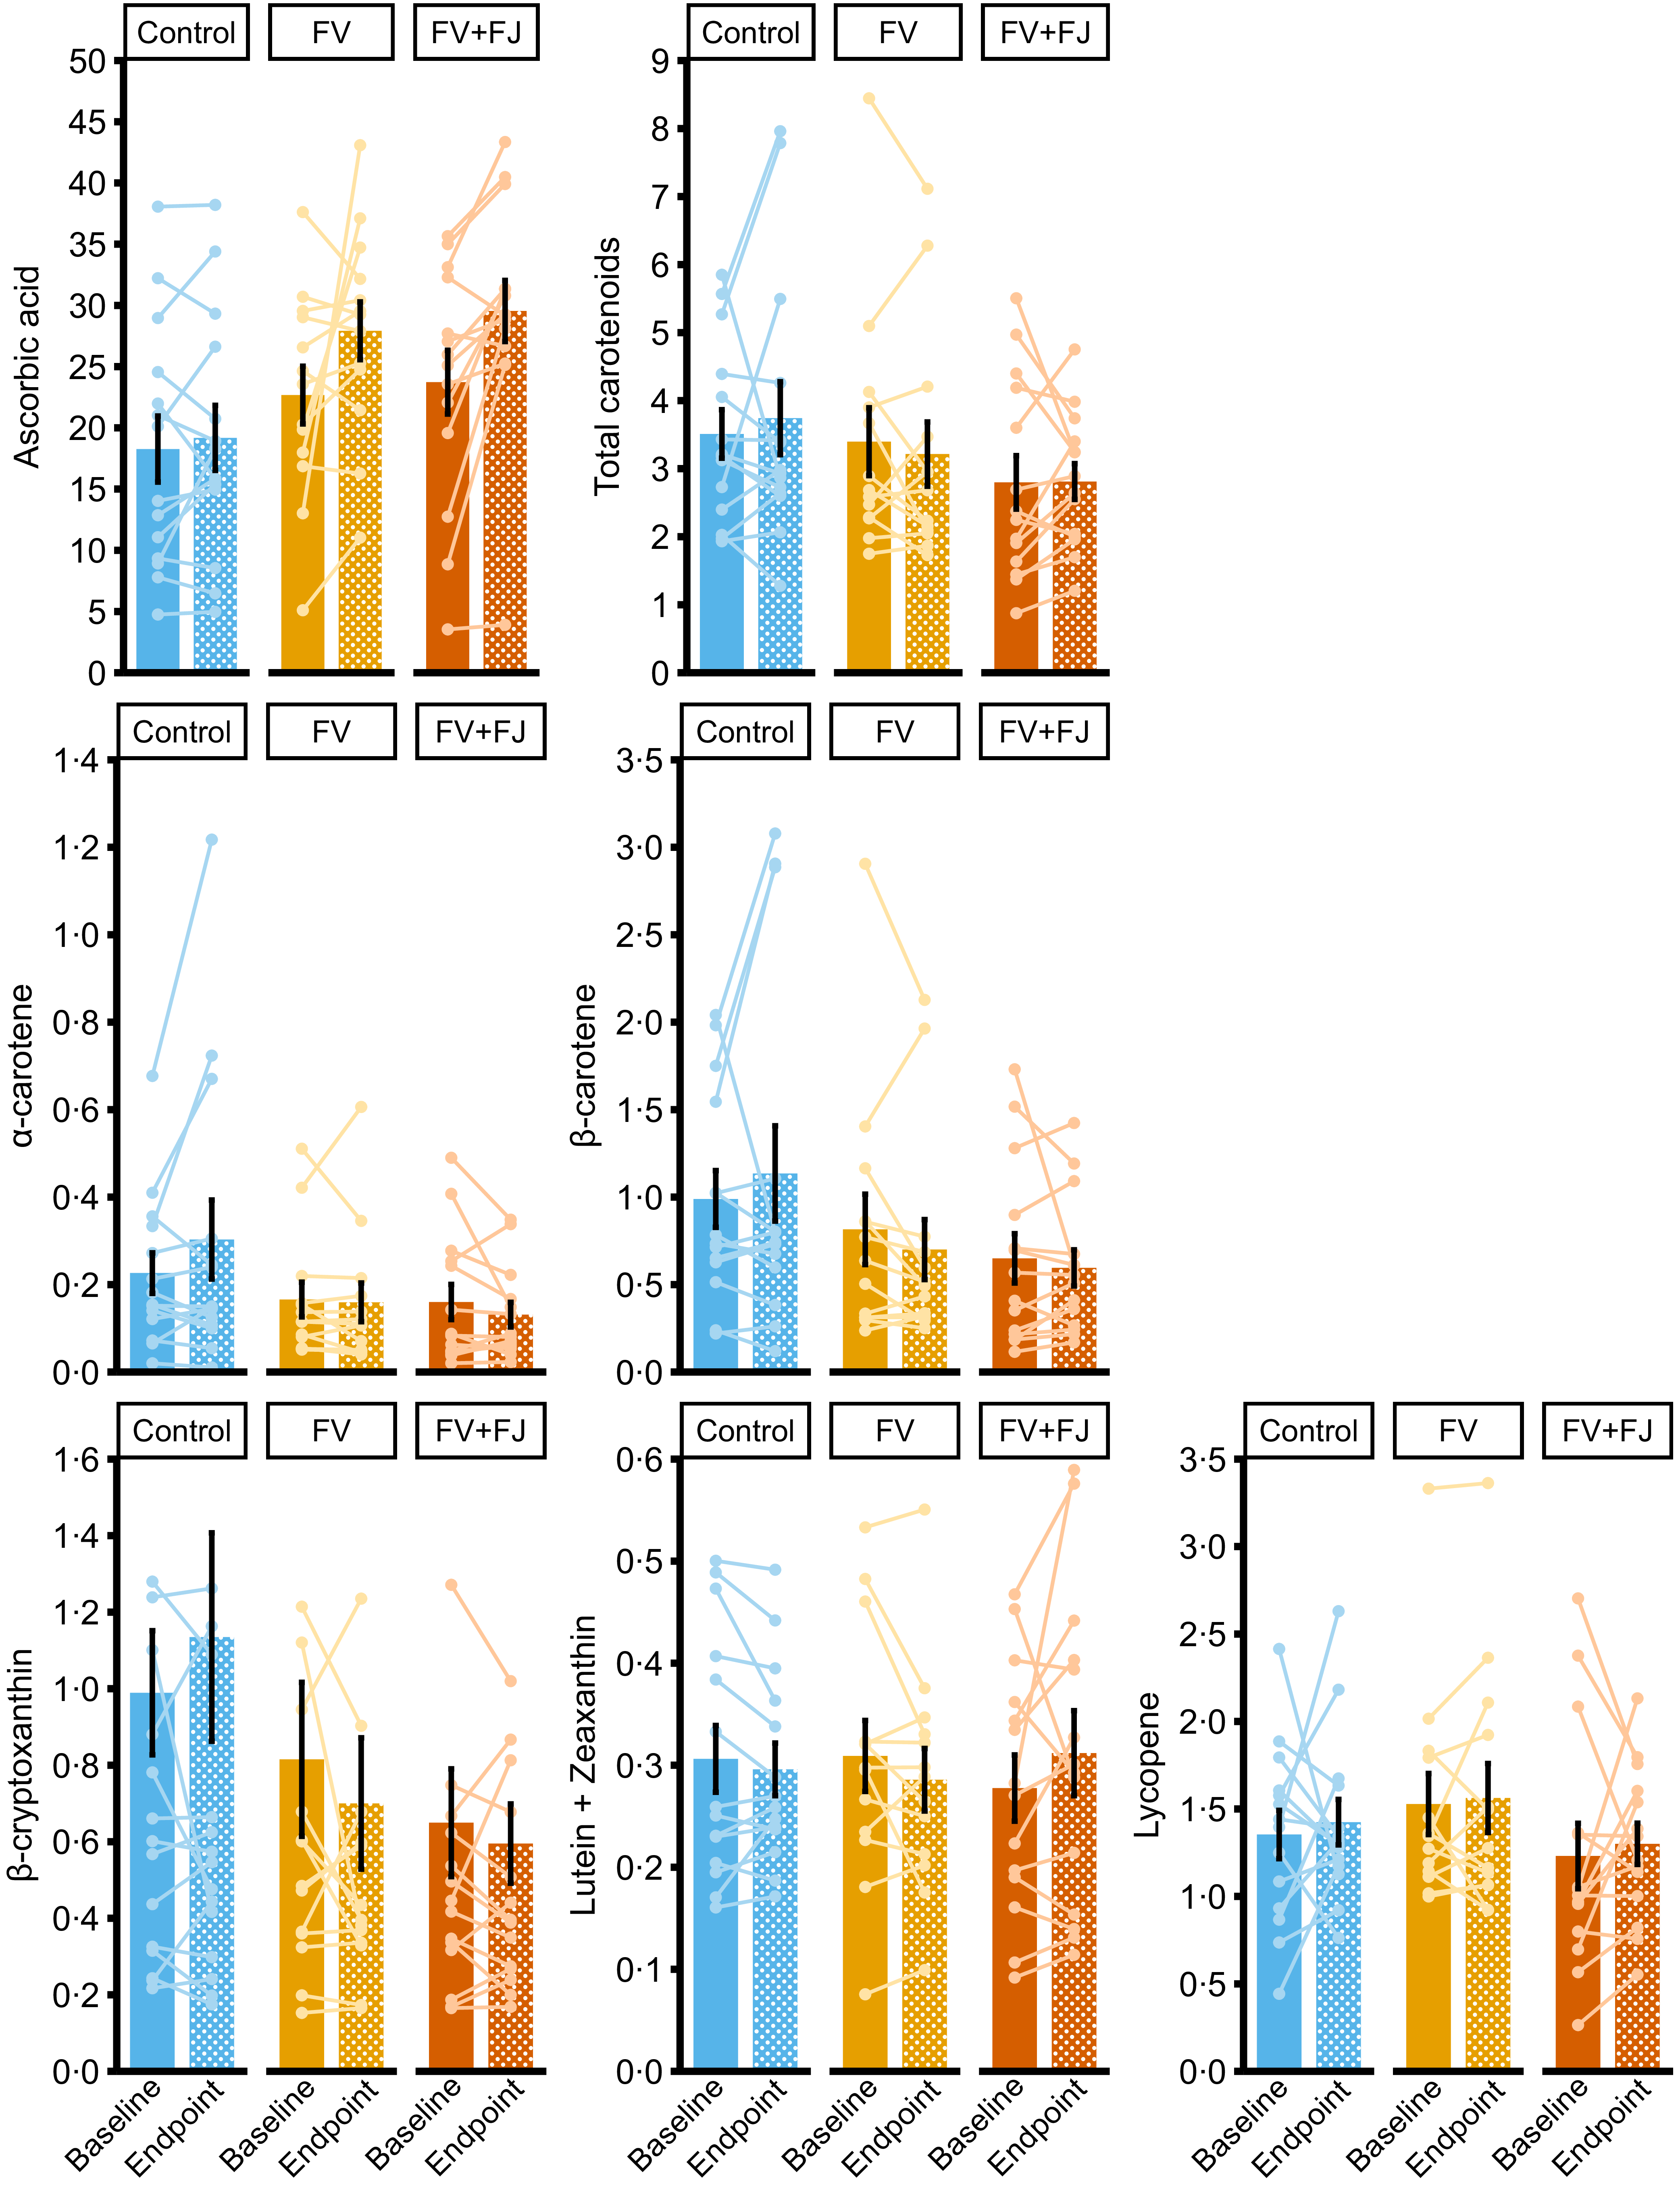
Fasted circulating ascorbic acid concentration (µmol/l) was significantly different between the groups at the endpoint (for all EMM, se, P values, effect sizes and CI, see Table 4; Figure 4). The FV + FJ group had higher fasted circulating ascorbic acid concentrations post-intervention than the control group, but this difference was not significant after adjusting for multiple comparisons (P = 0·05). There were no significant differences between the FV + FJ and the FV groups (P = 1·00), nor between the FV and control groups (P = 0·15). Between-run CV for ascorbic acid analysis was 2·3 %. Descriptive statistics of dietary vitamin C intake can be found in online Supplementary Materials 8.
ANCOVA results assessing post-intervention circulating plasma ascorbic acid and serum carotenoid concentrations (µmol/l) across intervention groups

Table 4. Long description
The table presents data on circulating ascorbic acid concentration and serum carotenoid concentrations across three groups: Control, FV, and FV + FJ. It includes columns for Estimated Marginal Means (EMM), Standard Error (SE), 95% Confidence Intervals (CI), P-values, and effect sizes (ηp²). The table has seven rows for different biomarkers: Ascorbic acid, Total carotenoids, α-carotene, β-carotene, β-cryptoxanthin, Lutein + Zeaxanthin, and Lycopene. The FV + FJ group shows higher ascorbic acid concentration compared to the Control group, though not significantly after adjustments. No significant differences are observed between the FV and FV + FJ groups, or between the FV and Control groups. The table also includes statistical values for each biomarker across the groups.
FV, whole fruit and vegetables; FV + FJ, whole fruit and vegetables plus fruit juice and smoothies; EMM, estimated marginal mean (adjusted for baseline, age and BMI); se, standard error of the EMM.
*95 % CI of the EMM.
†95 % CI of the effect size estimate (η p 2).
P values for all carotenoid tests are adjusted for multiple testing (Bonferroni method, k = 6).
Mean (raw) fasted circulating concentrations (µmol/l) of ascorbic acid, total carotenoids (sum of α-carotene, β-carotene, β-cryptoxanthin, lutein and zeaxanthin and lycopene) and listed carotenoids at baseline and endpoint. Note: Error bars are ±1 standard error around the mean, and lines are individual participant changes from baseline to endpoint. FV, whole fruit and vegetables; FV + FJ, whole fruit and vegetables plus fruit juice and smoothies.

Figure 4. Long description
The image contains eight bar graphs with overlaid lines, each representing mean concentrations of different compounds at baseline and endpoint. The x-axis shows three groups: Control, FV, and FV+FJ, while the y-axis varies by graph. The first graph shows ascorbic acid levels, with bars indicating mean values and lines showing individual participant changes. The second graph displays total carotenoids, followed by individual graphs for alpha-carotene, beta-carotene, beta-cryptoxanthin, lutein and zeaxanthin, and lycopene. Each graph includes error bars representing one standard error around the mean. The graphs compare the impact of different diets on these concentrations, with FV representing whole fruit and vegetables, and FV+FJ representing whole fruit and vegetables plus fruit juice and smoothies. All values are approximated.
Fasted circulating carotenoid concentration
Fasted circulating total carotenoids concentration (µmol/l; sum of α-carotene, β-carotene, β-cryptoxanthin, lutein and zeaxanthin and lycopene) was not significantly different between groups at endpoint. When carotenoids were considered individually, only fasted circulating α-carotene concentrations significantly differed between groups at endpoint (for all EMM, se, P values, effect sizes and CI, see Table 4; Figure 4). The control group had higher fasted circulating α-carotene concentrations than the FV + FJ group, but after adjusting for multiple comparisons, the difference was not significant (P = 0·09). There were no significant differences between the control and FV group (P = 0·30), nor the FV and FV + FJ group (P = 1·00). Average within- and between-run CV for each carotenoid ranged between 4·6–8·0 % and 7·1–14·1 %, respectively.
Mood (depression and anxiety)
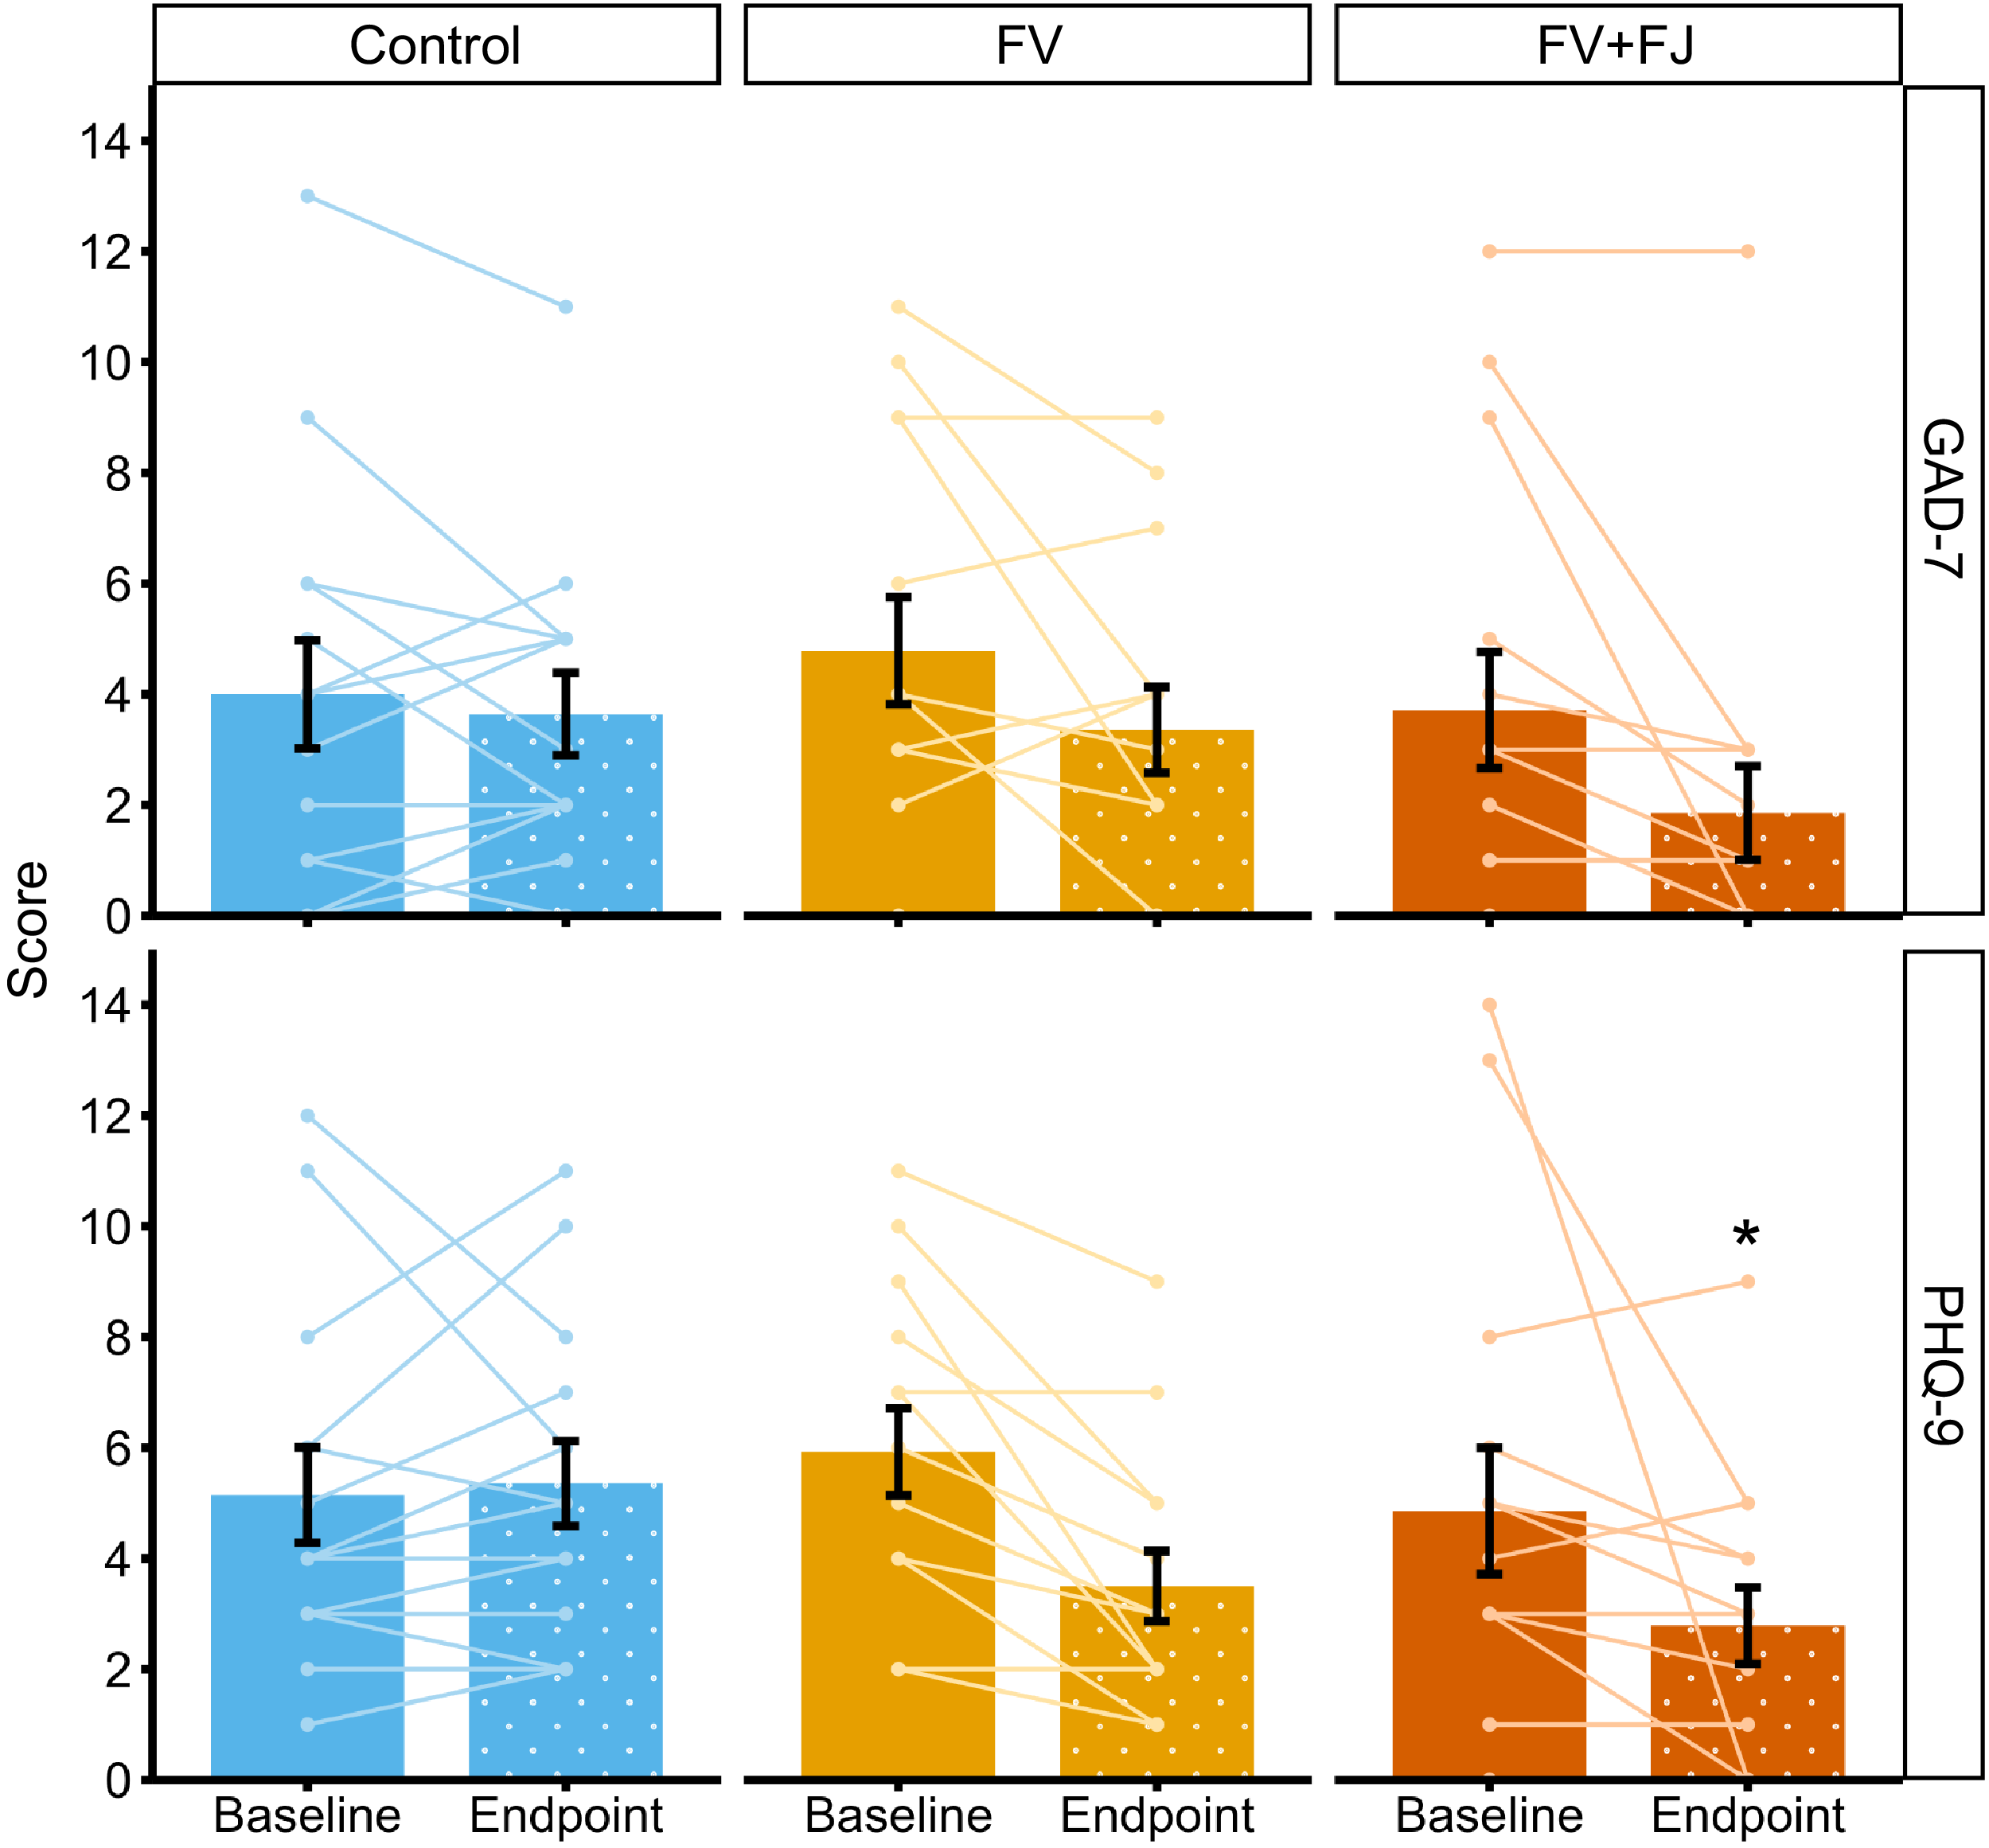
Endpoint GAD-7 scores (anxiety) did not significantly differ between groups (P = 0·06; η p 2 = 0·14, 95 % CI (0·00, 1·00); Figure 5). In contrast, endpoint PHQ-9 scores (depression) differed significantly (P = 0·01; η p 2 = 0·21, 95 % CI (0·03, 1·00); Figure 5), with lower scores in FV + FJ (M = 2·93, se = 0·61, 95 % CI (1·69, 4·17)) compared with the control group (M = 5·45, se = 0·61, 95 % CI (4·20, 6·69); P = 0·02). While PHQ-9 scores were lower in the FV group (M = 3·27, se = 0·61, 95 % CI (2·03, 4·51)) than the control group, the difference was not significant (P = 0·05). There was no significant difference between the FV + FJ and FV groups (P = 1·00).
Mean (raw) anxiety (GAD-7) and depression (PHQ-9) scores at baseline and endpoint. Note: Error bars are ±1 standard error around the mean, and lines are individual participant changes from baseline to endpoint. * denotes significantly lower value than control, with P values for follow-up pairwise comparisons adjusted for multiple testing (Bonferroni method, k = 3). GAD-7 Generalised Anxiety Disorder-7; PHQ-9, Patient Health Questionnaire-9; FV, whole fruit and vegetables; FV + FJ, whole fruit and vegetables plus fruit juice and smoothies.

Figure 5. Long description
The bar graph compares anxiety and depression scores at baseline and endpoint for three groups: Control, FV, and FV plus FJ. The x-axis represents the time points (Baseline and Endpoint), and the y-axis represents the scores. The graph is divided into two sections: GAD-7 for anxiety and PHQ-9 for depression. Each section contains three grouped bars for the Control, FV, and FV plus FJ groups. The Control group is represented in blue, the FV group in yellow, and the FV plus FJ group in orange. Individual participant changes are shown with lines connecting baseline and endpoint scores. Error bars indicate one standard error around the mean. In the GAD-7 section, the FV plus FJ group shows a notable decrease in scores from baseline to endpoint. In the PHQ-9 section, the FV plus FJ group also shows a significant decrease, marked with an asterisk indicating a significantly lower value than the Control group. All values are approximated.
Gut symptoms
The groups did not significantly differ in the number of participants who reported changes in flatulence (P = 0·13, Cramer’s V = 0·28), stool frequency (P = 0·19, Cramer’s V = 0·25), bloating (P = 0·50, Cramer’s V = 0·20) or stool consistency (P = 0·47, Cramer’s V = 0·21). Furthermore, the control (M raw = 1·00, sd = 1·41), FV (M raw = 1·79, sd = 1·31) and FV + FJ (M raw = 2·21, sd = 1·19) groups did not significantly differ in the total number of gut symptoms in which participants reported a change (P = 0·06; η p 2 = 0·14, 95 % CI (0·00, 1·00)). There was no significant difference between groups in the magnitude of changes reported in any gut symptom (P = 0·63; η p 2 = 0·08, 95 % CI (0·00, 1·00)) nor in the number of participants who reported altering their social activities because of changes in gut symptoms (P = 0·76, Cramer’s V = 0·23).
Biomarkers of metabolic health
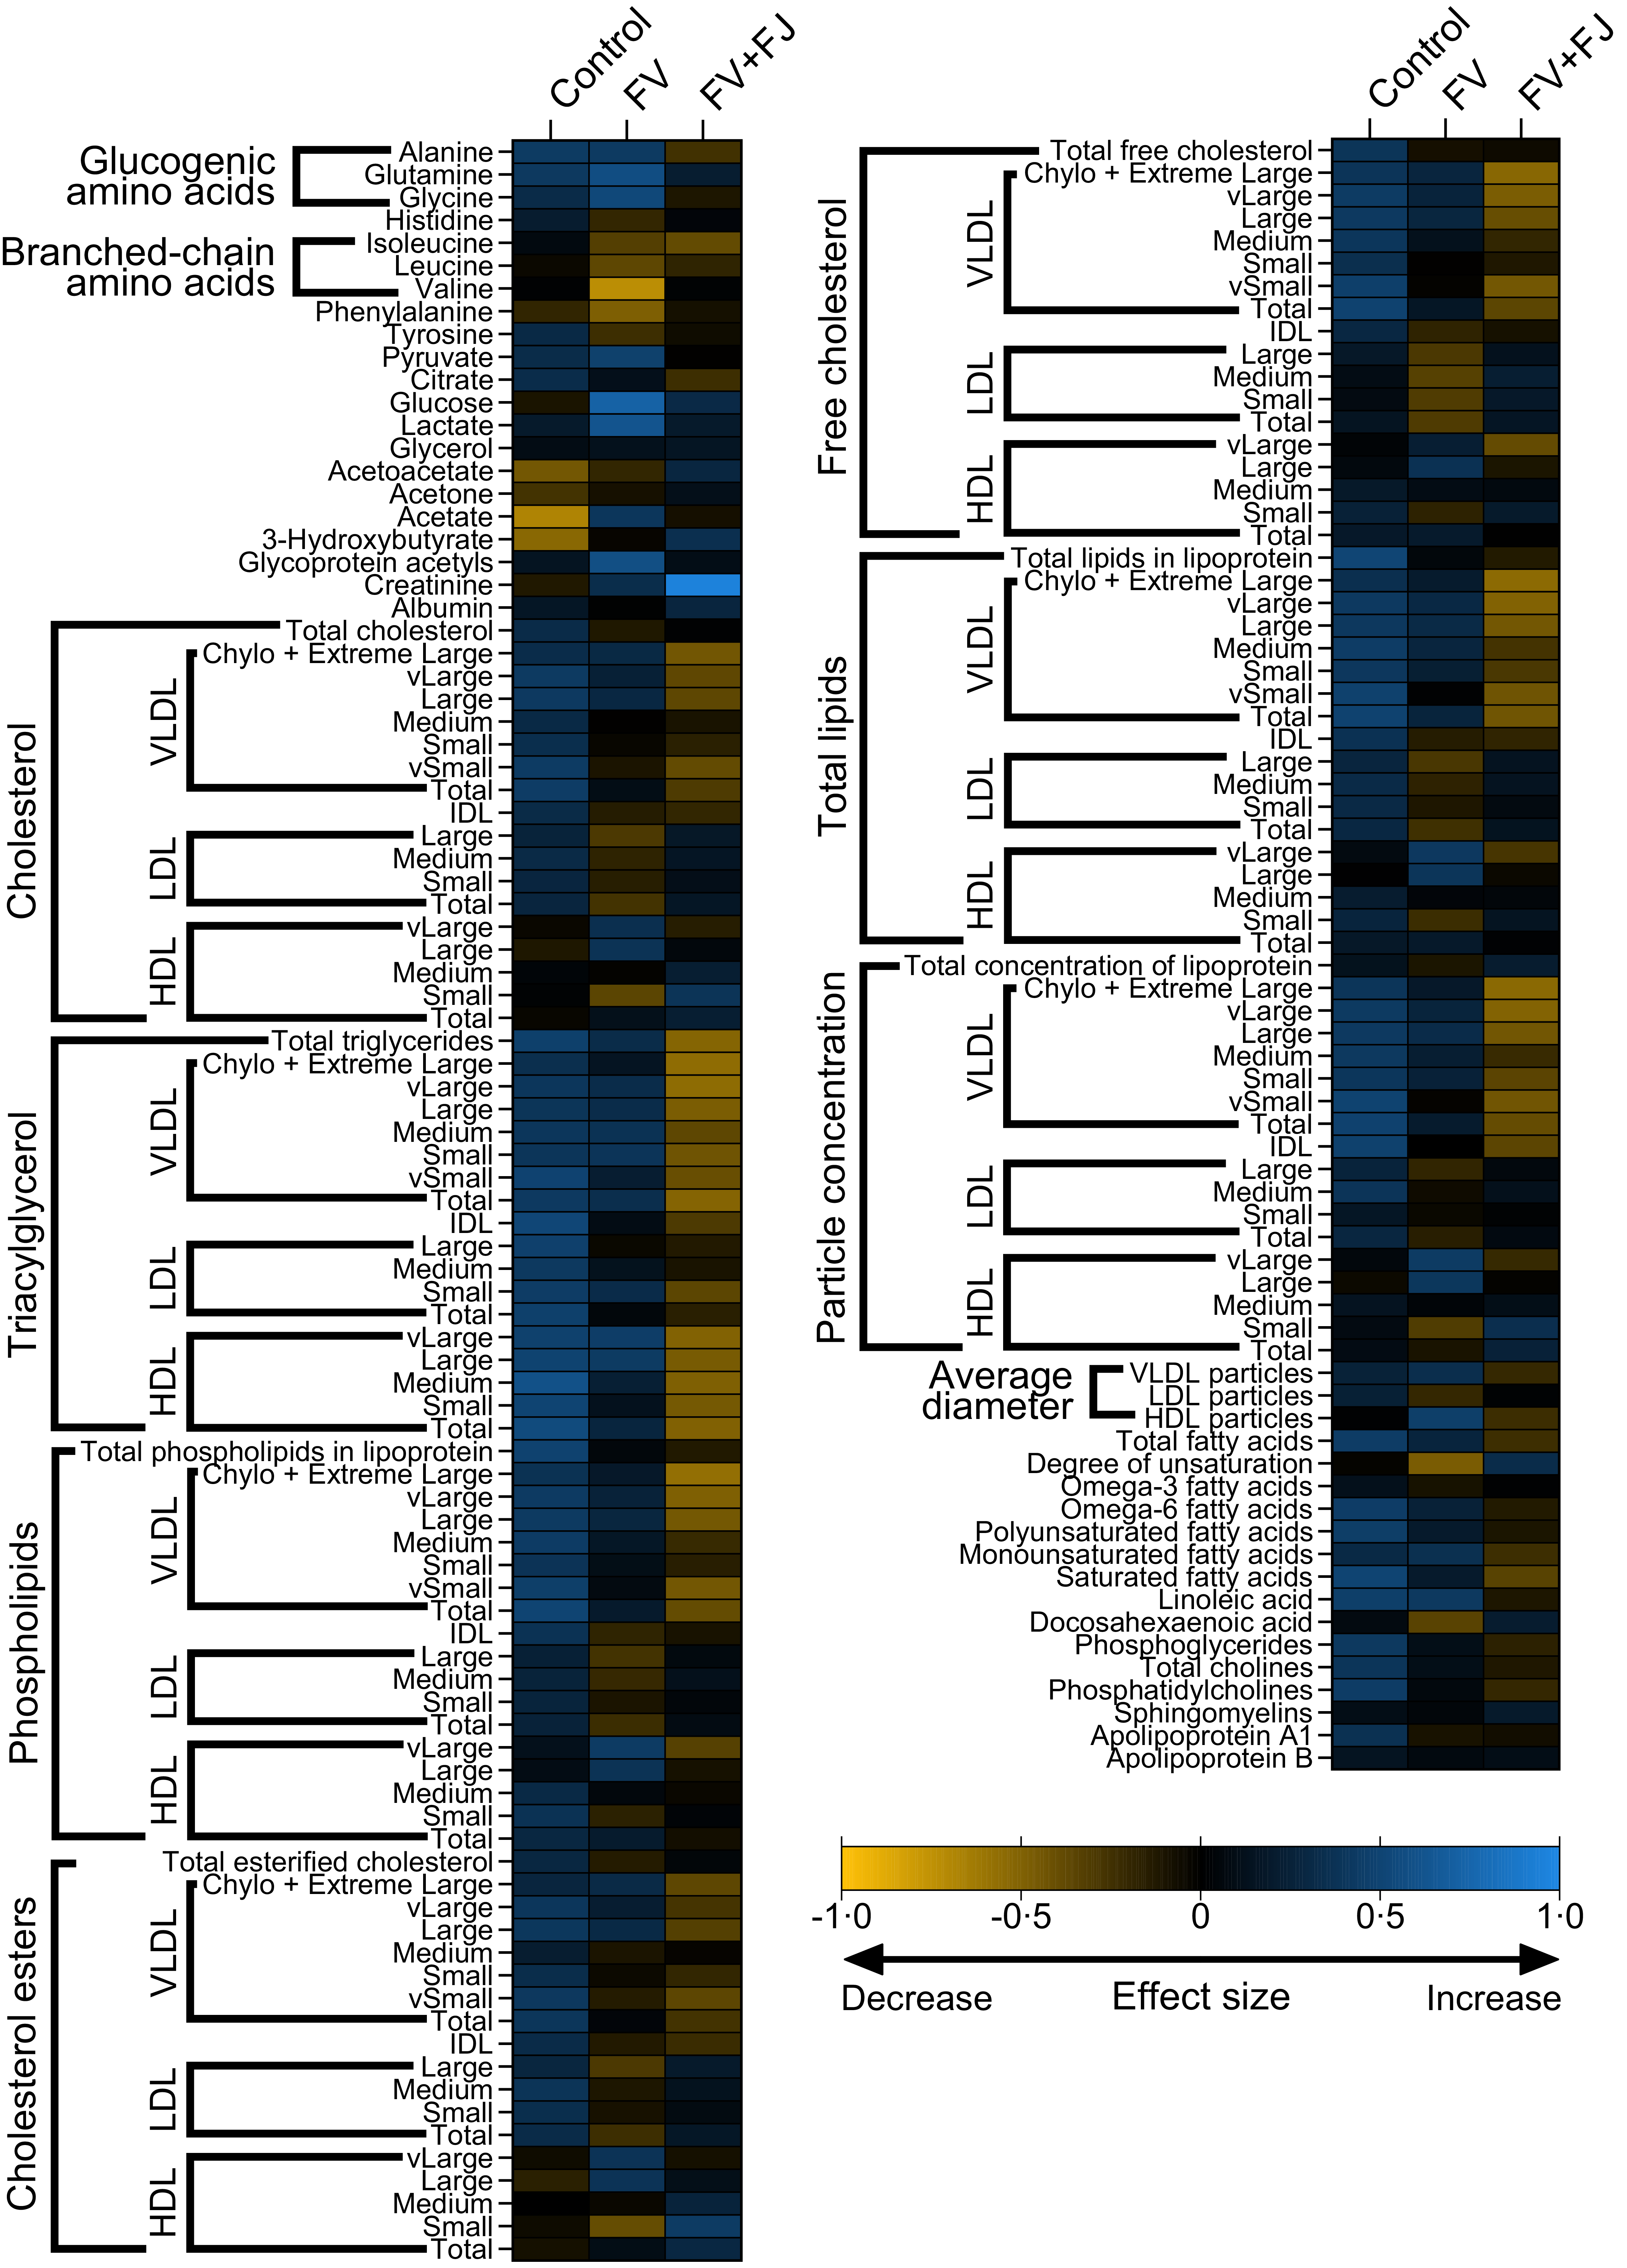
There were no significant between-group differences at endpoint in any of the metabolic markers tested (all P values > 0·05). Figure 6 shows the effect sizes (Cohen’s d) for the change from baseline calculated for each marker.
Effect sizes of the change in circulating metabolomic markers from baseline to endpoint. FV, whole fruit and vegetables; FV + FJ, whole fruit and vegetables plus fruit juice and smoothies.

Figure 6. Long description
A heat map displays the effect sizes of changes in circulating metabolomic markers from baseline to endpoint across different dietary groups. The map is divided into two main sections, each with multiple categories such as glucogenic amino acids, branched-chain amino acids, cholesterol, triacylglycerol, phospholipids, and cholesterol esters. Each category is further divided into subcategories like total cholesterol, free cholesterol, and particle concentration. The color scale ranges from blue to yellow, indicating a decrease to an increase in effect size. The dietary groups compared are Control, FV (whole fruit and vegetables), and FV+FJ (whole fruit and vegetables plus fruit juice and smoothies). Notable trends include variations in the intensity of colors across different markers and dietary groups, suggesting differential impacts on metabolomic markers.
Acceptability
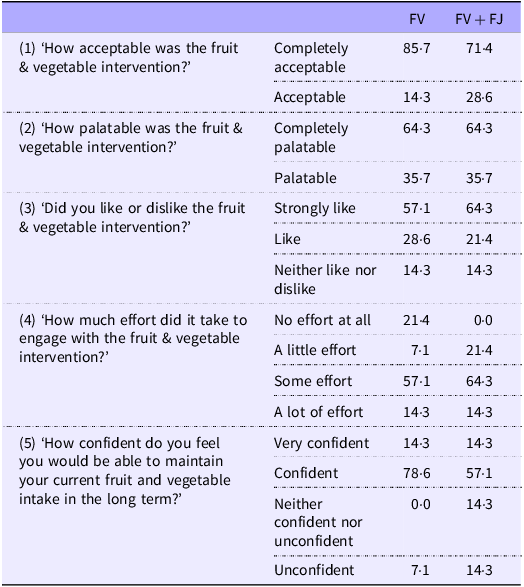
There were no significant differences between the two intervention groups in how acceptable or palatable they found the intervention, how much they liked it, how much effort they found it, nor in how confident they were in their ability to maintain their post-intervention fruit and vegetable intake in the longer term (all P values > 0·05; Table 5).
Acceptability questionnaire results (% of participants responding) across FV and FV + FJ intervention groups

Table 5. Long description
The table presents acceptability questionnaire results as percentages of participants’ responses across two intervention groups, FV and FV plus FJ. It includes five questions about the fruit and vegetable intervention, such as acceptability, palatability, liking, effort required, and confidence in maintaining intake. The table has five rows for each question and two columns for the intervention groups. Notable trends include high acceptability and palatability in both groups, with slight variations in effort and confidence levels. For instance, 85.7 percent of the FV group found the intervention completely acceptable compared to 71.4 percent in the FV plus FJ group. Both groups rated the intervention similarly on palatability and liking. Effort required shows a notable difference, with 21.4 percent of the FV group finding it no effort at all, while none in the FV plus FJ group felt the same. Confidence levels are high in both groups, with 78.6 percent of the FV group feeling very confident compared to 57.1 percent in the FV plus FJ group.
FV, whole fruit and vegetables; FV + FJ, whole fruit and vegetables plus fruit juice and smoothies.
Possible responses without any respondents are not shown. Missing options for each question include (1) Neither acceptable nor unacceptable, Unacceptable and Completely unacceptable; (2) Neither palatable nor unpalatable, Unpalatable and Completely unpalatable; (3) Dislike and Strongly dislike; (4) Huge effort and (5) Very unconfident.
Discussion
The present study investigated the impact of dietary interventions based on UK 5-a-day advice, with or without fruit juice, on fruit and vegetable intake in adults with low baseline fruit and vegetable intake. It also assessed their impact on broader dietary behaviour, mood, gut symptoms and markers of metabolic health. Following a 4-week intervention, both the FV and FV + FJ groups showed significantly higher total fruit and vegetable intake compared with control, with no significant difference between the two interventions. Both interventions showed good acceptability and feasibility, whilst metabolomic profiling revealed no differences in plasma metabolite profiles between groups at endpoint. Participants in the FV + FJ group experienced significant improvements in depression symptoms as measured by PHQ-9 scores, suggesting potential mental health benefits of this intervention.
Participants in both interventions exceeded UK-based 5-a-day fruit and vegetable recommendations, with endpoint intakes (EMM with fruit juice intake capped according to UK guidelines) of 8·9 portions/d and 6·6 portions/d in the FV and FV + FJ groups, respectively, compared with 2·5 portions/d in the control group. Although intake was numerically lower in the FV + FJ group v. the FV only group, this difference was not statistically significant and was attenuated further when the cap on fruit juice/smoothies was removed. Several other well-controlled dietary intervention studies show similar, albeit slightly lower, increases in fruit and vegetable intake to those observed here. For example, in a series of investigations, conducted by Woodside and colleagues, involving the provision of free fruit and vegetables and behaviour change support over 8–16 weeks (including the ADIT, DISCO, FAVRIT and FVD studies(Reference Fulton, McKinley and Neville56)), participants increased their fruit and vegetable intake by an average of 2·3–4·6 portions/d. Conversely, larger-scale public health-based interventions have typically shown smaller effect sizes (e.g. < 1 portion/d(Reference Wolfenden, Barnes and Lane57)).
The increase in total fruit and vegetable intake we observed was driven by higher fruit intake in both the FV and FV + FJ groups and higher fruit juice/smoothies intake in the FV + FJ group. Despite including similar recommendations for both fruits and vegetables in our intervention booklet (including recipes, recommended shopping lists and dietary swaps), endpoint intake of vegetables, dried fruit and pulses did not differ between groups. This aligns with broader data showing that vegetable intake is particularly difficult to increase, with improvements typically smaller, less consistent and more challenging to sustain over time than with fruit(Reference Wolfenden, Barnes and Lane57). Given the well-established links between vegetable intake and health(Reference Wallace, Bailey and Blumberg58), future interventions should target vegetable consumption, for example, through strategies such as cooking skills development, providing additional recommendations for vegetable-based snacks or vegetable juices/smoothies and addressing specific barriers to vegetable acceptance.
A unique feature of our study was that it allowed us to explore whether including or excluding fruit juice from the provided recommendations impacted dietary intake and attendant health outcomes. Whilst both intervention groups achieved similar total fruit and vegetable intake, there were nutritional differences between groups which warrant consideration. Total energy did not differ between intervention groups, suggesting that participants may have made compensatory changes to their diets to accommodate their increased fruit/fruit juice intake. Nevertheless, total sugar intake was significantly higher in the FV and FV + FJ groups than in the control group but did not differ between the FV and FV + FJ groups. Such a result is unsurprising given that the increased fruit and vegetable intake was driven by greater fruit and fruit juice consumption, both of which are natural sources of sugars. Intake of free sugars (i.e. sugars added to foods and drinks, plus those naturally present in honey, syrups, fruit juices and smoothies) was significantly higher in the FV + FJ group (71·6 g/d) compared with both the FV group (38·4 g/d) and controls (30·1 g/d). This anticipated difference reflects the fact that the natural sugars in fruit juices are classified as ‘free’ (based on their not being confined within a cell structure), whilst identical sugars in whole fruits are not. In the context of these findings, it is important to note that, on a per-portion basis, the total sugar and energy content of fruit juice is broadly comparable to that of its whole fruit counterpart, with key differences relating to the fibre content and physical structure. This distinction underpins current UK guidance but remains an area of ongoing debate, particularly given emerging evidence suggesting that the physiological response to fruit-derived sugars may depend more on the food source and matrix than the ‘free’ v. ‘intrinsic’ classification(Reference Ruxton, Derbyshire and Sievenpiper20,Reference Gonzalez22) . Nevertheless, the increased intake of free sugars did not influence markers in the metabolic panel. Furthermore, the average endpoint fruit juice/smoothie intake among FV + FJ participants was approximately double the daily recommended intake of one 150 ml portion/d, as per UK guidelines, meaning the free sugars intake figures exceed what would be consumed if a participant adhered to recommendations. This suggests that participants do not naturally consume fruit juice/smoothies in 150 ml portions but instead tend to exceed this amount. Participants received information on recommended portion sizes for fruit juice/smoothies as part of the intervention, along with visual aids to support portion-size estimation. Yet it appears that the information did not effectively limit participants’ fruit juice/smoothie consumption. In future studies, careful consideration should be given to ensure fruit juice/smoothie consumption does not exceed recommended amounts, which could help constrain any associated increases in free sugars intake.
When considering our findings, it is relevant to note that because its sugars are considered ‘free’, fruit juice is often likened to sugar-sweetened beverages (SSB), which have been robustly linked to a range of negative health outcomes(Reference Lane, Travica and Gamage59). However, a cohort study of adults in the Netherlands found that substituting fruit juice for SSB was associated with a lower risk of type 2 diabetes, CVD, CHD and stroke over a 14-year follow-up period(Reference Scheffers, Boer and Wijga60). Furthermore, substituting fruit juice for whole fruit was not associated with an increased risk of these health conditions at follow-up, suggesting that the effect of fruit juice on health outcomes is more similar to whole fruit than to SSB. Similarly, in controlled feeding trials where drinks were added to participants’ diets, evidence from meta-analyses suggests that when fruit juice was added at lower doses (i.e. ≤ 10 % of energy intake), there was an overall reduction in BMI, but in trials in which SSB were added, there was an increase in BMI(Reference Chiavaroli, Cheung and Ayoub-Charette61). The source of the dietary sugars and the food matrix in which they exist are likely to impact the physiological response to consumption and longer-term cardiometabolic outcomes(Reference Gonzalez22). Importantly, fruit juice also provides a relatively affordable (due to the high cost-to-nutrient ratio) source of micronutrients and bioactive compounds (e.g. vitamin C, potassium and polyphenols), which are largely absent in SSB and may contribute to its differing physiological effects(Reference Ruxton and Myers24). SSB typically have negligible fibre, polyphenols and potassium concentrations, whereas these are present in higher concentrations in fruit juice. Such differences may explain why fruit juice and SSB consumption often lead to different physiological outcomes and support the notion that the potential benefits of fruit consumption may extend, at least in part, to fruit juice when consumed in appropriate amounts.
Importantly, both intervention groups achieved significant increases in fibre intake compared with control (endpoint EMM were about 8–10 g/d higher). This was unexpected in FV + FJ, given concerns that fruit juices have low fibre content and their consumption tends to lower overall fibre intake. If such fibre intakes were maintained in the long term, they could lead to significant health benefits. At present, only 4 % of the UK population achieves the recommended levels of fibre intake(5), despite links between higher intake and lower risks of various non-communicable diseases(Reference Veronese, Gianfredi and Solmi62). Nevertheless, average fibre intake in our study remained below the recommended 30 g/d, with most participants failing to meet this target at endpoint. Therefore, focusing solely on fruit and vegetable intake (with or without fruit juice/smoothie) may be insufficient to meet fibre targets without simultaneously increasing intake of other fibre-rich foods, such as pulses and whole grains(Reference Boyle, Dye and Seal63,Reference Biscarrat, Bedu-Ferrari and Langella64) .
A key exploratory finding of this study was that PHQ-9 scores were significantly lower in the FV + FJ group and tended to be lower in the FV group compared with the control group, reflecting an improvement in symptoms of depression. We also observed trends towards improved anxiety symptoms in both of our intervention groups, although these were not statistically significant. While the study was not explicitly powered to detect these outcomes, these exploratory findings are consistent with emerging evidence that increasing fruit and vegetable intake can support brain health(Reference Pontifex, Malik and Connell65). In a recent pooled analysis of 7801 participants from ten culturally diverse cohorts, higher fruit intake was associated with a 13 % lower risk of incident depression over 3–9 years of follow-up(Reference Matison, Flood and Lam66). Similarly, in 82 643 participants from the Nurses’ Health Study and Nurses’ Health Study II, who were followed for about 10 years, consuming ≥ 2 servings/d of citrus fruits or juices was associated with an 18 % lower risk of incident depression compared with consuming < 1 serving/week(Reference Chang, Cassidy and Willett67). Several plausible biological mechanisms could underpin these effects, including antioxidant and anti-inflammatory actions(Reference Pontifex, Malik and Connell65), modulation of gut–brain axis pathways, including alterations in the microbiome via the provision of flavonoids(Reference Park, Choi and Lee68) and increased production of compounds with known cognitive effects such as brain-derived neurotrophic factor(Reference Park, Choi and Lee68) – a key mediator of antidepressant therapeutic response(Reference Kao, Liu and Yu69) – and SCFA(Reference Choi, Kim and Park30).
However, evidence linking increased fruit and vegetable intake to improved brain health from randomised controlled trials is limited and somewhat inconsistent. Carr et al. (Reference Carr, Bozonet and Pullar70) reported significant reductions in mood disturbances and fatigue in young adult males with high baseline mood disturbance who consumed two kiwi fruits/d for 6 weeks. However, no effects were observed in participants with low baseline mood disturbances, nor in those consuming half a kiwi fruit/d. Conner et al. (Reference Conner, Brookie and Carr71) found that young adults provided with two portions/d of fruit and vegetables for 14 d experienced improvements in their psychological well-being, including increased vitality, flourishing and motivation. Yet, a separate group of participants who received an ecological momentary intervention (text reminders to increase fruit and vegetable intake, alongside a voucher to cover purchasing costs) did not differ from the control group. Meanwhile, consumption of three 190 ml flavonoid-rich orange juice drinks/d (equivalent to about 4 UK portions) for 8 weeks improved depressive symptoms in younger adults with major depressive disorder in one study(Reference Choi, Kim and Park30) but showed limited effects in another(Reference Park, Choi and Lee68). Overall, the specific circumstances under which increased fruit, juice and vegetable intake improves depression symptoms require further investigation.
Our novel design enabled investigation of whether including or excluding fruit juice/smoothies in dietary recommendations differentially affected fruit and vegetable intake, as well as markers of health. Given the inconsistency of international guidelines around fruit juice/smoothie intake, the present research is particularly pertinent. The personalisable and flexible nature of the FV and FV + FJ interventions likely contributed to the study’s success in increasing fruit and vegetable intake, as well as to its high acceptability and participant retention. Such an approach could be applied in future trials or public health interventions. Participants’ behaviour change was supported by an information booklet informed by behaviour change theory and co-created with members of the public to ensure clarity and relevance. The booklet was not prescriptive and aimed to promote choice. Participants could flexibly choose dietary changes to align with their preferences (e.g. types of fruits/vegetables/juices, recipes or dietary ‘swaps’), which is likely to enhance acceptability, efficacy and scalability(Reference Celis-Morales, Lara and Mathers72). Weekly vouchers to support dietary change removed cost as a potential barrier and enabled the better isolation of the influence of fruit juice/smoothie consumption on fruit and vegetable intake and related health outcomes. This approach was also flexible and accessible, as participants chose which supermarket to spend their vouchers at each week, and vouchers were automatically sent to participants, a protocol that could be readily upscaled. Neither intervention was associated with changes in gut symptoms, further supporting their tolerability.
The nature and logistics of our intervention meant that it was not possible to blind (i) researchers to the participant’s group from the point of randomisation or (ii) participants to their experimental condition after completing their baseline measures. The former may have inadvertently influenced participant behaviour, whilst the latter may have increased the risk of expectation bias. Further, the study’s generalisability is limited by a modest sample size and recruitment via convenience sampling of participants who self-reported low fruit and vegetable intake. In addition, we did not collect data on the physical activity or socio-economic status of participants, and, although randomisation reduces the risk of confounding by these factors, residual imbalance cannot be entirely excluded. Furthermore, because it was not feasible to use Intake24 to screen individuals (for fruit and vegetable intake < 2 portions/d) during recruitment, we used a brief measure of intake frequency(31). This meant that for some participants, baseline intake (via Intake24) was > 2 portions/d despite the brief measure reporting < 2 portions/d at screening.
The study was adequately powered for our primary outcome (fruit and vegetable intake), and we reasoned that focusing on individuals with already low fruit and vegetable intake was justified, as this group may be most likely to benefit from dietary change, and consequent shifts in their health markers may be more observable in a short intervention. However, as the study was not specifically powered for our secondary outcomes, small but potentially meaningful changes may have gone undetected. For example, circulating vitamin C and carotenoid concentrations did not differ significantly between groups, despite increased self-reported fruit and vegetable intake. These results likely reflect that our blood samples were taken when participants were fasted (which may reduce circulating concentrations), the small sample size (which may make results more vulnerable to variability in inter-individual differences in metabolism and diet) and the study’s short duration (previous research suggests that about 40 d is required for circulating carotenoids to reach equilibrium with dietary carotenoid supplementation(Reference Thürmann, Schalch and Aebischer73)). Finally, the study did not focus on vegetable juice, as it is less commonly consumed than fruit juice/smoothies in the UK. As vegetable juices could also support fruit and vegetable intake, their impact should be investigated in future studies.
Overall, this study demonstrated that 4-week interventions based on UK 5-a-day recommendations, combined with financial support, with or without fruit juice/smoothies, significantly increased overall fruit and vegetable intake in adults with low baseline consumption. Both approaches raised mean fruit and vegetable intake above guideline-recommended amounts and improved fibre intake, with exploratory evidence indicating mood benefits in the FV + FJ group. Longer and larger trials, specifically powered to identify effects on health outcomes and biomarkers, are now required.
Supplementary material
For supplementary material/s referred to in this article, please visit https://doi.org/10.1017/S0007114526107569
Acknowledgements
The authors would like to thank their participants for giving up their time to take part in this study.
This study was funded by a grant from the Fruit Juice Science Centre (https://fruitjuicesciencecentre.eu/en). The Fruit Juice Science Centre had no role in the study design, data collection, analysis, interpretation, writing of this manuscript or the decision to publish.
O. M. S. and A. W. W. obtained funding for the study. C. N., G. L., K. B., A. W. W. and O. M. S. designed the study. C. N. collected the data, with guidance from A. W. W. and O. M. S. C. N. conducted the biochemical analyses with guidance from G. L. and K. B. C. N. analysed the data, with G. L., K. B., A. W. W. and O. M. S. critically interpreting the data. C. N., A. W. W. and O. M. S. drafted the manuscript. C. N., G. L., K. B., A. W. W. and O. M. S. critically revised the manuscript. All authors have read and approved the final manuscript.
C. N. has received research funding from ESRC and BBSRC. K. B. has received consultancy fees and unrestricted research funds from food and non-food industry organisations as well as the UK Research and Innovation (UKRI). G. L. has received research funding from BBSRC, MRC, Bill and Melinda Gates Foundation, Harvest Plus, IAEA and DSM, and has carried out paid consultancy (paid to institution) for Nutricia (Danone). O. M. S. has received research grants from EPSRC, BBSRC, Rank Prize, MRC, Wellcome Trust, NIHR, ARUK, OHID, the Fruit Juice Science Centre (which funded the current work) and the Nutrition Society. O. M. S. has carried out paid consultancy (paid to institution) for Delta Hat Ltd and is a Section Chair for the Nutrition Society. A. W. W. has received funding from the BBSRC, Sacco S.R.L, Aelius Biotech Ltd, Better You Ltd, Greggs PLC and Calysta UK. A. W. W. is an external examiner at Queen Margaret University, Edinburgh University and Northumbria University Newcastle (for which he receives a fee) and has received consultancy fees (paid to institution) from non-food industry organisations.
This study was conducted in accordance with the guidelines laid down in the Declaration of Helsinki, and all procedures involving human participants were approved by the Newcastle University Faculty of Medical Sciences Ethics Committee (2792/48171). Written informed consent was obtained from all participants. The protocol was prospectively registered on ClinicalTrials.gov (NCT06628401).
Data described in the manuscript, code book and analytic code will be made available upon request pending author approval.



 Open access

