Implications
Understanding the factors that impact milk yield in dairy animals is very important. We know that when we feed calves better they make more milk as cows, but we do not know why. Recent work from our lab uncovers part of this reason. The information presented will help us to understand how we can feed a young heifer calf to make her more productive as a cow. This will yield greater returns on investment for producers and help us create more milk for an increasing world population.
Introduction
Mammary biologists have often wondered which periods of bovine mammary development are most impactful or represent the biggest potential carry-over effect in terms of future lactation potential. A vast majority of previous work has focused on the development of the mammary gland (MG) near the end of gestation and into lactation. Additionally, previous work has shown that pre-pubertal MG development can be negatively influenced by management factors (feeding rate, etc.; Capuco and Akers, Reference Capuco, Akers, Greenwood, Bell, Vercoe and Viljoen2010). However, more recent work has indicated that the traditional allometric phase of MG growth as defined by Tucker (Reference Tucker2000) actually begins from birth, a time during which the MG can grow by greater than 60-fold and the body essentially doubles in size (Capuco and Akers, Reference Capuco, Akers, Greenwood, Bell, Vercoe and Viljoen2010). This realization has ignited a massive undertaking by mammary biologists and nutritionists worldwide to understand what may impact this incredibly active period of development within the bovine MG.
A summary of all work dedicated to early life mammary development is outside the scope of this review, but it has become quite clear that the MG tissue created within the pre-weaning period provides at the very least a foundation for subsequent MG growth, which may dictate, to some extent, the success of lactation. However, a brief discussion of the history in this area of research is warranted.
Multiple studies over the last half century have looked at the way in which dairy replacements are raised, and how future lactation performance may be impacted. Many of these studies did not focus on the MG, and some of the studies conducted in this time were not ‘true’ mammary biology studies. However, many studies in nutrition, etc., added to the body of work that is now used to explain the impacts of early life management decisions on future milk yield potential. The basis of these studies began with the goal of shortening the time from birth to first calving. Dairy heifers have a roughly 2-year non-productive period where no return on investment is made unless the heifer is sold. The idea was to shorten this period by encouraging a younger age at first calving. In order for first parturition to occur earlier, earlier breeding and thus earlier attainment of puberty must also occur. Puberty is highly correlated with BW (Sejrsen, Reference Sejrsen1994); thus, the most practical way to decrease the age at first calving is to stimulate faster growth rates in early life to achieve pubertal BW at a younger age. But, as mentioned, it has been well documented that accelerating gains during the entire pre-pubertal period decrease the first lactation performance (Sejrsen and Purup, Reference Sejrsen and Purup1997; Zanton and Heinrichs, Reference Zanton and Heinrichs2005). Reasons for decreases in first lactation performance associated with higher pre-pubertal BW gains are still debated to some extent, but a common theme is an increase in mammary fat pad (MFP) mass accompanied with excessive pre-pubertal weight gain that impedes the development of the parenchymal (PAR) tissue. This increase in lipid accumulation is considered to be ‘non-productive’ in nature, and an increase in the proportion of the gland occupied by the MFP would come at the expense of the more productive, PAR tissue. Additionally, exhaustive studies conducted by Meyer et al. (Reference Meyer, Capuco, Ross, Lintault and Van Amburgh2006a, Reference Meyer, Capuco, Ross, Lintault and Van Amburgh2006b) provided evidence that when pre-pubertal BW gains are excessive, the traditional allometric growth window is shortened, which limits udder development during this time.
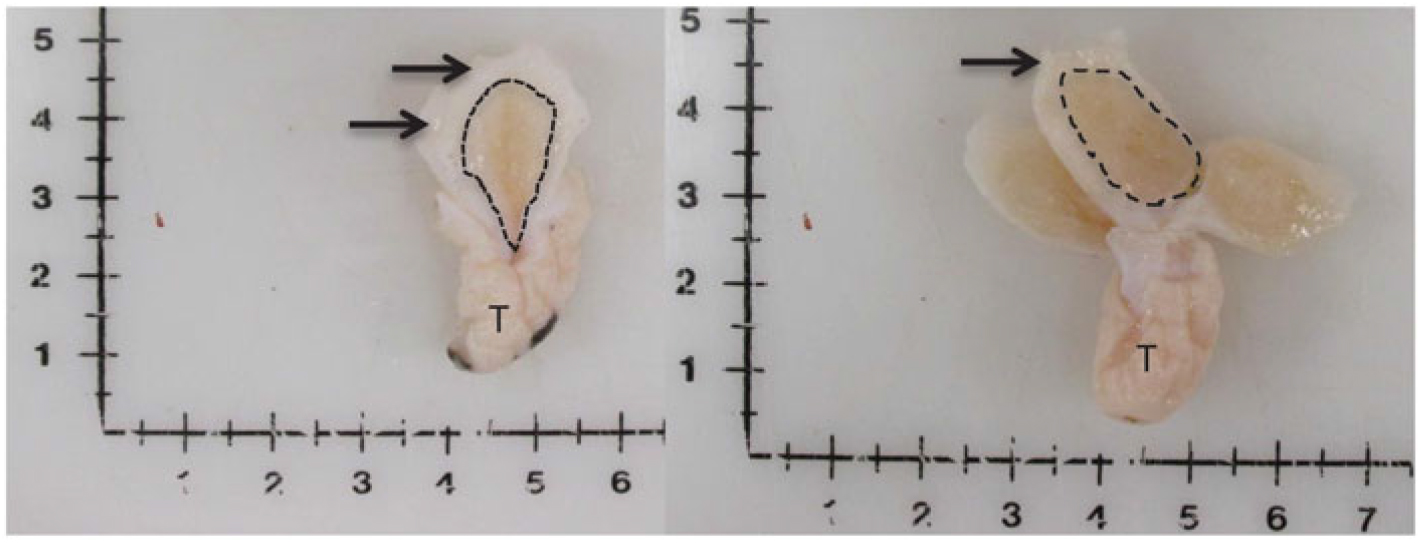
Although it has been generally accepted that accelerated BW gain during pre-puberty has a detrimental impact on future milk yield, first lactation performance may benefit from high rates of BW gain during the early periods of life (<3 months of age; pre-weaning period; milk-fed stage), as recently summarized by Khan et al. (Reference Khan, Weary and von Keyserlingk2011). The other well-referenced work (Soberon et al., Reference Soberon, Raffrenato, Everett and Van Amburgh2012) further discussed the positive impacts of greater BW gains in early life on future milk yield potential. Our lab and others (Geiger et al., Reference Tucker, Beaudry, Parsons, Ellis and Akers2016a; Soberon and Van Amburgh, Reference Soberon and Van Amburgh2017; Figure 1) have shown that enhanced feeding of calves during the milk-fed stage can increase mammary parenchyma growth both in terms of raw mass and also on a per BW basis. These findings conflict with previously mentioned data regarding the entire pre-pubertal period of life (period of time from birth until estrus is attained) in the dairy heifer, and at the very least, indicate how much we have left to learn about this unique organ. The goal of this review is to discuss known factors that impact the development of the pre-pubertal MG, which have a heavy influence on early life nutritional management.
Visual depiction of mammary gland parenchyma development differences between calves fed a low plane of nutrition (left; 20% protein and 20% fat milk replacer) or a high plane of nutrition (right; 28% protein and 25% fat milk replacer). Arrows indicate the MFP and the light brown tissue within the dotted line indicates mammary parenchyma. This represents over a seven-fold increase in PAR mass (Geiger et al., Reference Geiger, Parsons, James and Akers2016b).
The influence of hormones on the development of the bovine mammary gland
At its basis, the MG is an accessory reproductive organ. The MGs are compound, tubulo-alveolar skin glands located on the ventral surface of the animal, and this organ’s growth is subject to the heavy influence of various hormones and growth factors. This results in a complicated communication network across multiple pathways that participate in a ‘cross-talk’ to ultimately control the development of the MG. These concepts have been reviewed previously (Sejrsen and Purup, Reference Sejrsen and Purup1997; Purup et al., Reference Purup, Vestergaard and Sejrsen2000; Vestergaard et al., Reference Vestergaard, Purup, Frystyhk, Løvendahl, So- Rensen, Riis, Flint and Sejrsen2003). Alterations in feeding rate of replacements, as well as dietary changes, have been shown to result in changes in circulating growth hormone (GH), insulin-like growth factor (IGF) -I, and IGF binding proteins that undoubtedly affect the activity of the MG both through local and systemic influences (Akers et al., Reference Akers, McFadden, Purup, Vestergaard, Sejrsen and Capuco2000). Our lab has also conducted a host of studies using the ovariectomy (OVX) model to assess the impact of endocrine ablation on MG development. In all of these studies, the OVX procedure occurred well before the attainment of puberty. Perhaps the most important findings from these studies are that the earlier the OVX procedure occurs, the greater the negative impact on MG development is (Berry et al., Reference Berry, Jobst, Ellis, Howard, Capuco and Akers2003; Velayudhan et al., Reference Velayudhan, Huderson, McGilliard, Jiang, Ellis and Akers2012). This indicates that MG development, as would be anticipated, is heavily reliant on sex steroids produced in the ovary and that this influence begins very early in life. Similar to increased nutrient intake, local MG tissue IGF-I production is reduced and the production/secretion of IGF-I binding proteins is increased when an OVX procedure occurs (Berry et al., Reference Berry, Jobst, Ellis, Howard, Capuco and Akers2003). A reduction in cellular proliferation in the MG epithelium is also observed following an OVX (Purup et al., Reference Purup, Sejrsen, Foldager and Akers1993, Reference Purup, Sejrsen and Akers1995). Of high interest is the fact that GH is unable to stimulate MG growth in OVX heifers, further supporting the idea of a complex network of communication responsible for MG development (Purup et al., Reference Purup, Sejrsen and Akers1995). It has been known for some time that IGF-I is critical to the early MG development, which is supported by observed increases in cellular proliferation in MG explants when IGF-I is added. However, a decrease in sensitivity to IGF-I is observed in MG explants collected from OVX heifers. In all of this, it should be noted that circulating levels of estradiol in young heifers appear to be relatively stable following an OVX procedure (Purup et al., Reference Purup, Sejrsen, Foldager and Akers1993; Velayudhan et al., Reference Velayudhan, Huderson, Ellis, Parsons, Hovey, Rowson and Akers2015).
The IGF-I/GH axis is merely one participant in the processes that control MG development. Older work has shown that estradiol stimulates MG growth (Woodward et al., Reference Woodward, Beal and Akers1993; Ellis et al., Reference Ellis, McFadden and Akers1998), and this response is increased in a dose-dependent manner (Purup et al., Reference Purup, Sejrsen, Foldager and Akers1993). However, Capuco et al. (Reference Capuco, Ellis, Wood, Akers and Garrett2002) provided evidence that proliferating bovine mammary epithelial cells do not express estrogen receptor-α (ER-α), the primary isotype of the estrogen receptor (ER) in the MG. This would suggest that estrogen does not have a direct effect on the proliferating mammary epithelium but, rather, is utilized locally by other tissues and cell types, triggering local tissue mediators that are more directly responsible for stimulating cellular proliferation in the MG. One hypothesis is that estrogen produced in the ovary acts on cells within the neighboring epithelium and stroma, which results in an increase in IGF-I production leading to greater PAR proliferation. However, given the nature of the MG, this is, if true, undoubtedly only a small aspect of the cross-talk occurring. Evidence for this exists in the work conducted by Li and Capuco (Reference Li and Capuco2008), where 1016 genes in the MG (common genes to both PAR and MFP) were influenced when estrogen was administered to heifers.
Aside from estrogen, progesterone is also produced in the ovary and thought to influence the development of the MG. While estrogen is thought to be heavily important in the early stages of MG development, progesterone has been suggested to play a role later in life when lobulo-alveolar development occurs. Progesterone receptors are present in the pre-pubertal bovine MG, but interestingly enough, they become undetectable following an OVX procedure (Velayudhan et al., Reference Velayudhan, Huderson, Ellis, Parsons, Hovey, Rowson and Akers2015). Previous work has shown that treatment of mammary cells from heifers with progesterone alone did not have a significant impact on cellular proliferation (Woodward et al., Reference Woodward, Beal and Akers1993), whereas a much more favorable result was observed when estrogen and progesterone were administered in concert. Since the removal of the ovary via OVX undoubtedly has a complex impact on the animal, the ability to assess the impact of removal of one mammogenic stimulus is desirable. One such option to do so is by injecting calves with tamoxifen, an antiestrogen, to assess the impacts of only blocking the action of estrogen on the MG (Tucker et al., Reference Tucker, Parsons, Ellis, Rhoads and Akers2016b). Similar to the impacts of an OVX procedure, calves treated with tamoxifen (Tucker et al., Reference Tucker, Parsons, Ellis, Rhoads and Akers2016b; treated from 28 to 120 days of life) experienced a decrease in overall mammary PAR growth. Of particular interest was that tamoxifen-treated calves had more proliferating cells (measured via Ki67 labeling) at 120 days of age. The percentage or location of cells expressing the ERα or the progesterone receptor was not impacted by treatment, but ERα-positive cells expressed ERα with a 6.2-fold lower intensity. A similar result was observed for the degree of progesterone receptor expression in OVX calves (Velayudhan et al., Reference Velayudhan, Huderson, Ellis, Parsons, Hovey, Rowson and Akers2015). To the best of our knowledge, our lab is the first to gauge intensity of expression of steroid receptors in the MG epithelium using this technique.
The influence of early life nutrition on the development of the bovine mammary gland
With the understanding that the bovine MG is more active in the first 3 months of life than previously understood (Capuco and Akers, Reference Capuco, Akers, Greenwood, Bell, Vercoe and Viljoen2010), our lab sought to impact how plane of nutrition in early life may influence the development of this organ. The concept of influencing future milk yield and/or MG development via nutrition in early life became popular roughly a decade ago (Soberon et al., Reference Soberon, Raffrenato, Everett and Van Amburgh2012). This review serves as the first complete summation of our work to this point (methods, etc., more thoroughly explained in Geiger et al., Reference Geiger, Parsons, James and Akers2016b). The overarching hypothesis of this work was that plane of nutrition positively influences the growth of the calf and the developing MG through a developmental programming mechanism, wherein the neonatal, bovine MG epithelium is ‘primed’ to respond to mammogenic stimuli already present in the body (i.e., higher plane of nutrition (HPN) increases the efficiency with which the MG epithelium utilizes biologically normal levels of circulating estrogen). In this work, heifer calves (<1 week old) were fed either a 20% protein, 20% fat milk replacer (0.35 kg powder/day) or 28% protein, 25% fat milk replacer (1.13 kg powder/day) for 8 weeks. A portion of calves on study were harvested at weaning (8 weeks), and half of the remaining calves from each diet were given estrogen for 2 weeks to assess responsiveness to mammogenic stimuli. We hypothesized that calves fed a HPN would experience greater MG development in early life and that these calves would respond with greater magnitude to estrogen.
The impact of the above-mentioned treatments was greater than expected. At weaning, calves fed on a HPN were over 20 kg heavier with no negative impacts on health observed (Figure 2; Geiger et al., Reference Geiger, Parsons, James and Akers2016b). Additionally, mammary PAR weights were increased by roughly seven-fold (Figure 3; Geiger et al., Reference Geiger, Parsons and Akers2016a, Reference Geiger, Parsons and Akers2016b). Similar results were observed by Soberon and Van Amburgh (Reference Soberon and Van Amburgh2017). It should be noted, however, that in this study, protein and fat content of the milk replacer was not altered between treatments. Visually, calves fed the HPN treatment experienced more complex PAR development into the MFP with clear secondary and tertiary branching of the MG epithelium, whereas calves fed less had a mammary PAR with little to no development (Figure 4).
Weekly body weights through weaning of calves fed a low plane of nutrition (R; triangles; 20% protein and 20% fat milk replacer) or a high plane of nutrition (EH; squares; 28% protein and 25% fat milk replacer). Significant treatment differences were observed during weeks 2 through 8 (P < 0.01; Geiger et al., Reference Geiger, Parsons, James and Akers2016b).

Mammary weights of Holstein heifer calves at weaning fed either a restricted diet (R; 20% protein and 20% fat milk replacer) or a HPN (EH; 28% protein and 25% fat milk replacer) pre-weaning. Superscripts within a given parameter (a and b) indicate treatment differences (P < 0.01). Trimmed MG = whole trimmed mammary gland, MFP = mammary fat pad, PAR = mammary parenchyma (Geiger et al., Reference Geiger, Parsons and Akers2016a).

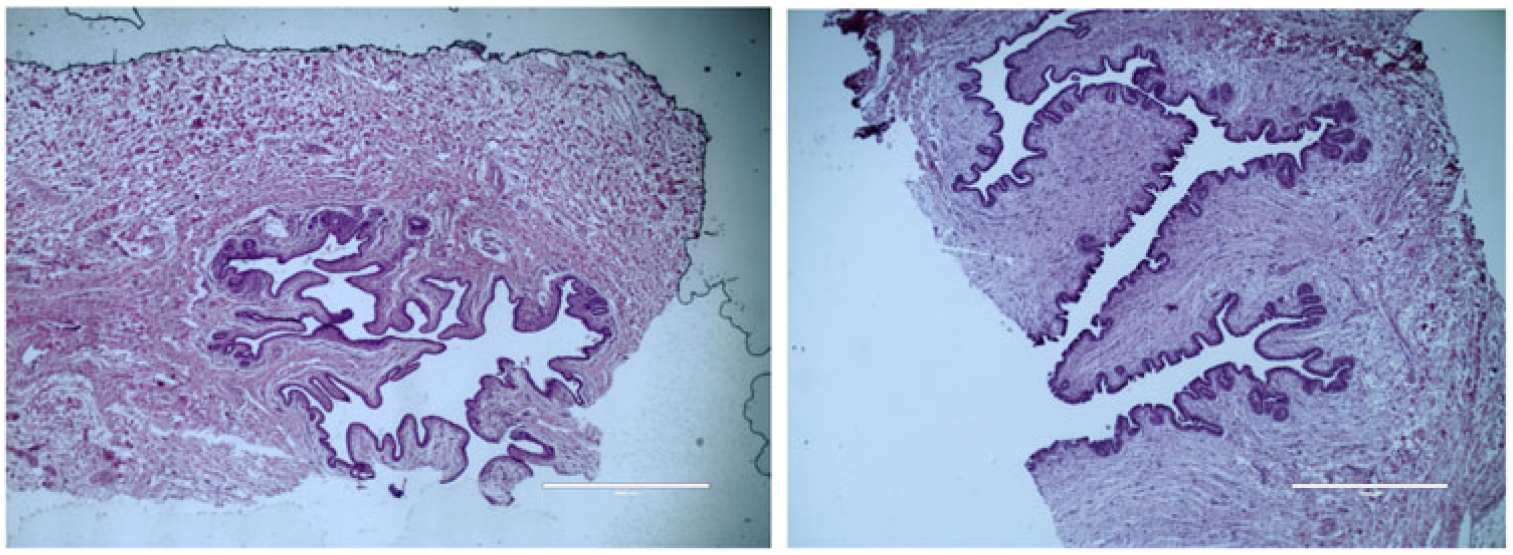
Histological depiction of MG parenchyma development differences between calves fed a low plane of nutrition (left; 20% protein and 20% fat milk replacer) or a high plane of nutrition (right; 28% protein and 25% fat milk replacer) at weaning. Images are of hematoxylin and eosin staining and are acquired with a 4× objective lens. Note a lack of coordination of branching in calves fed a low plane of nutrition, whereas calves fed a high plane of nutrition experienced secondary and tertiary branching of the parenchyma. The magnification bar equals 1000 μm for the upper and middle panels (Geiger et al., Reference Geiger, Parsons and Akers2016a).
When assessing cellular characteristics of the MG from calves fed a HPN, no differences were seen for the percentage of ERα positive cells (Figure 5), similar to the results found by Brown et al. (Reference Brown, Vandehaar, Daniels, Liesman, Chapin, Forrest, Akers, Pearson and Nielsen2005). However, Brown et al. (Reference Brown, Vandehaar, Daniels, Liesman, Chapin, Forrest, Akers, Pearson and Nielsen2005) did not assess the intensity of ERα mRNA expression. In the present work, calves fed the HPN experienced almost a doubling of ERα protein expression intensity in ERα-positive cells compared to calves fed less (Geiger et al., Reference Geiger, Parsons and Akers2017). This is in direct opposition to results of tamoxifen-treated calves observed by Tucker et al. (Reference Tucker, Parsons, Ellis, Rhoads and Akers2016b). One potential biological impact of these results may be that although calves fed the HPN did not have more ERα-positive cells, the cells that were ERα-positive were expressing a greater number of ERs and thus may be able to utilize estrogen with greater efficiency. In addition, the overall cellular proliferation rate of the mammary PAR was increased from 9.4% to 15.3% when a HPN was fed (Geiger et al., Reference Geiger, Parsons and Akers2017; measured via Bromodeoxyuridine (BrdU) incorporation over a 24 h period), and in the terminal ductular units, percentage of epithelial cells proliferating increased from 12.7% to 22.9%. Soberon and Van Amburgh (Reference Soberon and Van Amburgh2017) did not assess cellular proliferation as a result of dietary modifications, whereas Brown et al. (Reference Brown, Vandehaar, Daniels, Liesman, Chapin, Forrest, Akers, Pearson and Nielsen2005) observed a reduction in Ki67 positive cells in the subtending ducts and terminal ductular units when a HPN was fed. Similar to that of Li and Capuco (Reference Li and Capuco2008), 895 genes were up-regulated and 666 genes were down-regulated in the mammary PAR of calves fed a HPN. Gene classes impacted by feeding a HPN included nutrient metabolism/absorption, cell movement, cellular proliferation, differentiation of cells and steroid/hormone biosynthesis.
Percentage of cells expressing ER-α (left) and intensity of ER-α protein expression from ER-α positive cells (right) in calves fed a low plane of nutrition (white bars; 20% protein and 20% fat milk replacer) or a high plane of nutrition (black bars; 28% protein and 25% fat milk replacer). Note almost a doubling of ER-α expression intensity in calves fed a HPN (Geiger et al., Reference Geiger, Parsons and Akers2017).

From the discussed data, it is clear that the mammary PAR in early life is at the very least, more nutrient sensitive than suggested in earlier work. The extent of this sensitivity, however, is not fully understood and requires further investigation. Whether or not the MG itself is more estrogen-sensitive as a result of feeding a HPN requires more than one study be conducted. In the present study, when calves fed a HPN were given exogenous estrogen, mammary PAR mass accumulation was greatest compared to all other calves on trial. Calves fed less did not have a greater PAR mass when given exogenous estradiol (Figure 6). Similarly, although providing exogenous estrogen to calves fed a low plane of nutrition increased the cellular proliferation rate, calves fed a HPN and given exogenous estrogen experienced the highest rate of cellular proliferation (Geiger et al., Reference Geiger, Parsons and Akers2017). Therefore, recent data may indicate that calves fed a HPN experience an increase in mammary PAR mass as a result of these dietary modifications, and this increase in MG development may in part be due to the fact that alterations to the mammary transcriptome create an environment within the MG that allows the organ to better utilize mammogenic stimuli, such as estrogen. It is doubtful that this would completely explain differences in future milk yield observed as a result of differing planes of nutrition in the pre-weaning period, but it may be an important piece of the puzzle.
Mammary parenchyma (PAR) weights from calves fed either a low plane of nutrition (R; white bars) or a high plane of nutrition (EH; black bars) with or without estrogen treatment post-weaning (R-E2 and EH-E2 indicate calves fed a low and high plane of nutrition and given estrogen for 2 week post-weaning; light cross bars and black bar with white dots, respectively). Superscripts above error bars (a, b and c) indicate treatment differences (P < 0.05). Note the significant increase in PAR growth in calves fed a HPN and given estrogen (Geiger et al., Reference Geiger, Parsons and Akers2017).
Other factors impacting the development of the bovine mammary gland
The involvement of various other hormones and growth factors as they may relate to early MG development has been assessed. Examples of such factors include epidermal growth factor, prolactin, insulin, fibroblast growth factor, transforming growth factor β and many others, and the success of understanding the role(s) these factors play in MG development has been variable. Recently, rodent studies (Coussens and Pollard, Reference Coussens and Pollard2011; Need et al., Reference Need, Atashgaran, Ingman and Dasari2014, Brady et al., Reference Brady, Chuntova and Schwertfeger2016) have shown that a number of immune cells (macrophages, eosinophils and mast cells) congregate in the MG and may be involved in the regulation of ductal elongation and the development of the mammary PAR. To this point, data related to the involvement of immune cells in bovine MG development are limited, but our lab recently attempted to assess these populations in the neonatal bovine MG (Beaudry et al., Reference Beaudry, Parsons, Ellis and Akers2016). Immune cells were not randomly distributed within the MG, but congregated rather near epithelial structures. The exact function of these cell populations in the bovine MG is still unknown, but if they are involved, it is likely that they play a role in the complicated cross-talk that coordinates the development of the MG.
Myoepithelial cells have also been hypothesized to play a role in the development of the pre-pubertal MG as early differentiation of myoepithelial cells as a result of an OVX procedure has been implicated in blocking the action of growth factors and hormones on the mammary epithelium (Ballagh et al., Reference Ballagh, Korn, Riggs, Pratt, Dessuage, Akers and Ellis2008; Safayi et al., Reference Safayi, Korn, Bertram, Akers, Capuco, Pratt and Ellis2012; Tucker et al., Reference Tucker, Beaudry, Parsons, Ellis and Akers2016a). Further investigation is needed to uncover the true role that this cell type may play in the development of the neonatal MG. Early work in our lab (Geiger et al., Reference Geiger, Parsons and Akers2018) has shown that calves fed a HPN have myoepithelial cells that are morphologically different from calves fed a lower plane of nutrition. Calves fed a HPN had myoepithelial cells with a greater nuclear area and perimeter and had a greater number of neighboring myoepithelial cells in close proximity to them. Interestingly, calves subject to an OVX procedure appear to have myoepithelial cells with a smaller nuclear area compared to intact calves (Safayi et al., Reference Safayi, Korn, Bertram, Akers, Capuco, Pratt and Ellis2012), and calves injected with tamoxifen also experienced a reduced myoepithelial cell nuclear area (Tucker et al., Reference Tucker, Beaudry, Parsons, Ellis and Akers2016a). Additionally, tamoxifen treatment reduced the amount of neighbor contact between myoepithelial cells and decreased the myoepithelial cell nuclear perimeter (Tucker et al., Reference Tucker, Beaudry, Parsons, Ellis and Akers2016a). It is interesting to note that differences seen in the myoepithelial cell population as a result of feeding a HPN are opposite to that of the impact of either an OVX procedure or tamoxifen treatment, but the exact impact of these changes requires more investigation.
Concluding remarks
The study of the immature bovine MG is still in its infancy, but it is clear that interest in this area of mammary physiology is increasing. It is known that feeding dairy calves a HPN in early life results in increases in future milk yield. It is unlikely that improvements in the development of the MG deserve all credit for this, but it is undeniable that these improvements most likely play a key role. Just as the development of the neonatal MG is under the influence of a complicated network of cross-signaling between various factors, so too is the impact that early life nutrition has on the development of this extraordinary organ.
Acknowledgements
The authors acknowledge Land O’ Lakes, Inc. (St. Paul, MN, USA) and Tom Earleywine (Land O’ Lakes) for providing the milk replacer and support during this trial. We also acknowledge grant support from USDA-NIFA-AFRI (Washington, DC, USA), 2016-67015-24575, Impact of Pre-Weaning Nutrition on Endocrine Induction of Mammary Development in Dairy Heifers awarded to R. M. Akers and 2016-67011-24703 (pre-doctoral fellow-ship to A. J. Geiger).
A. J. Geiger, 0000-0002-2486-0553
Declaration of interests
The author reports no conflict of interest. All data published in other journals by this author are appropriately referenced in the references section (Geiger et al., Reference Geiger, Parsons and Akers2016a, Reference Geiger, Parsons and Akers2016b, 2017).
The author has permission to reproduce all images from the original journal source.
Ethics statement
Work is approved by the appropriate parties.
Software and data repository resources
Not applicable.