

I. INTRODUCTION
Several future missions foresee the use of small satellites or small descending units, landers, and rovers, in particular for Mars exploration. These kinds of systems have the advantage of a low weight and a reduced launching cost and are for these reasons an attractive alternative to larger options.
The natural trend toward miniaturization in both mechanical and electronic fields is a key enabling factor for the small satellite market: the use of a distributed antenna system with minimal spacecraft surface requirement offers the potential to reduce mass and mitigates accommodation constraints. This requires miniaturized and easily tunable radiating elements (REs), characterized by low mass, simple manufacturing, and low recurring cost. The concept presented here is intended to enable the reduction of satellite mass and size for Space Science and Exploration missions.
To achieve this goal a miniaturization technique will have to be applied to develop a RE in the targeted ultra-high frequency (UHF) band. Theoretical studies of small antennas are very well documented in the literature [Reference Wheeler1–Reference Collin and Rothschild4] concluding that size reduction of an antenna will result in reduction of bandwidth and/or radiation efficiency. The miniaturization techniques mainly used consist of loading the antenna with lumped elements, high-permittivity dielectric materials, or with conductors, also, using ground planes and short circuits [Reference Skrivervik, Zurcher, Staub and Mosig5]. Other methods include optimizing the antenna geometry or using the antenna environment to participate to the radiation. Several possible candidates for RE have been considered. Helical antennas, although benefiting from high gain, all-metal design, and wide bandwidth, have the size essentially comparable to the wavelength [Reference Gao6]. SAP (shorted annular patch) and PEC (patch-excited cup) antennas are already proven to be a good solution for satellite applications due to the high directivity, wide bandwidth and all-metal design [Reference di Massa and Mazzarella7] (http://www.ruag.com/en/Space/Space_Home) but, also in this case the size prevents their usage in the UHF band.
The folded planar inverted F-antenna (PIFA) is a moderately miniaturized antenna whose bandwidth of about 2% can fit the UHF band application [Reference Li, DeJean, Tentzeris and Laskar8]. A design without any dielectric can be envisaged, resulting in an all-metal antenna design, except for the dielectric in the SubMiniature version A (SMA) feed. Additionally, the structure is completely Direct Current-grounded. For these reasons, the PIFA turns out to be the proper choice for this application.
II. REQUIREMENTS
The RE has been designed in the scope of the ESA (European Space Agency) funded project Miniaturized Multi-function Antenna System (MMAS) that is aimed at having three different operational modes at UHF band, precisely at 400 MHz. The return loss of the whole system is to be larger than 20 dB in all these operational modes, while the REs need to be perfectly tuned to the desired frequency. The axial ratio of all three modes is aimed to be <3 dB. Depending on the mode the antenna system is working in, the gain of the whole system is aimed to go up to 5 dB. The RE is linearly polarized, while the antenna system is circularly polarized in all three modes of operation. Therefore, the Radio Frequency (RF) response and radiation pattern of the element are designed to support these requirements.
For the environmental tests, the RE must withstand space requirements regarding vibration and shock exposure. Variation of 5% maximum of the resonance frequencies due to vibration test can be allowed between two successive tests.
The shock test is intended to demonstrate operational capability before and after exposure to shock environments. The shock requirements are specified in Table 1.
Shock environmental requirements for antenna element.

* Flat spectrum from 1600 Hz to 10 KHz.
III. RE DESIGN
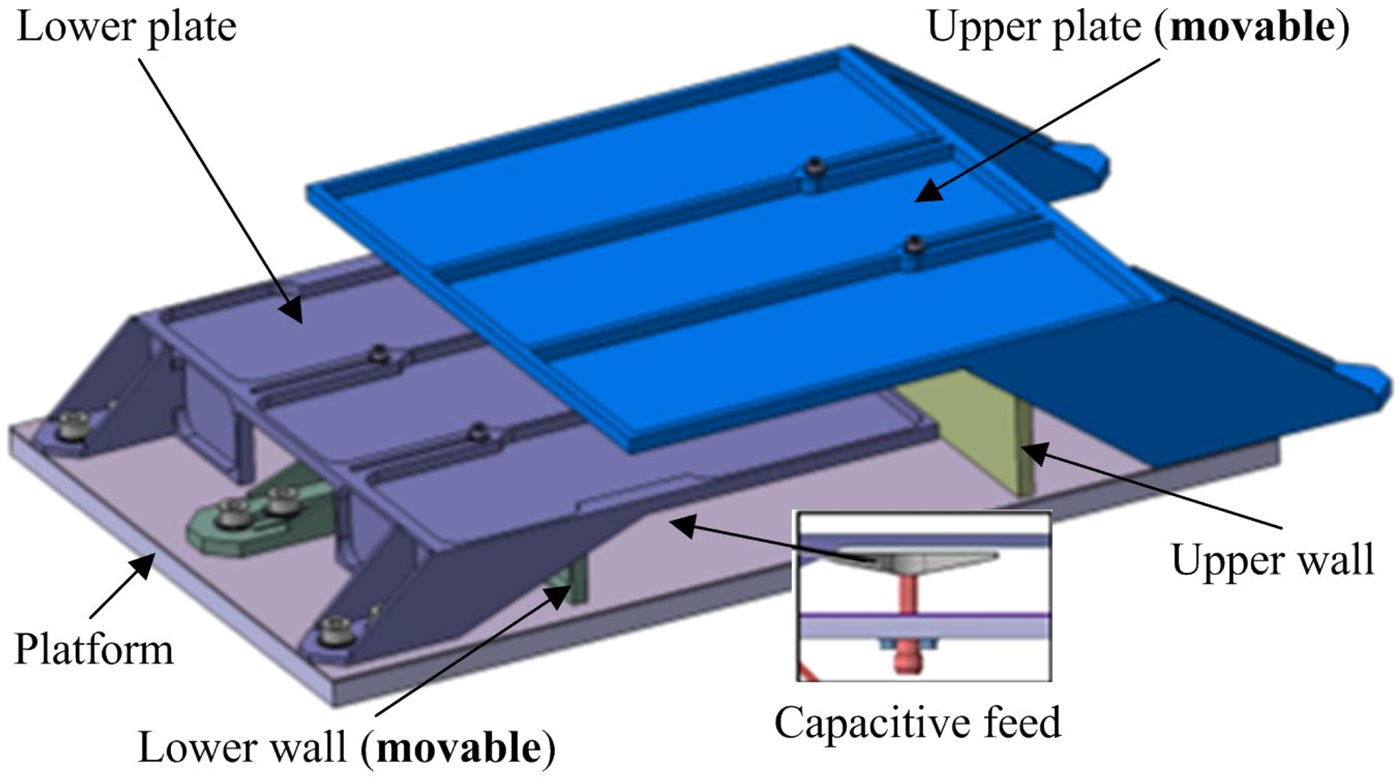
A PIFA design has been developed to minimize the size and the cost of the RE, and also to introduce the possibility for tuning. It is a completely metallic design made of aluminum alloy treated with Alodine 1200S. The only non-metallic part is the Teflon dielectric of the SMA connector. In order to avoid welding the SMA connector pin to the lower plate of the RE, capacitive feeding is employed. The RE geometry is shown in Fig. 1.
Radiating element geometry.
A) Electrical design
The PIFA structure is folded once more regarding the classical design, which theoretically further reduces its size from λ/4 to λ/8. The total length of the RE including mechanical support is, however, still comparable with λ/4 at 400 MHz. Mechanical tuning by changing the length of the upper plate has additionally extended the total antenna size regarding the theoretical minimum. The width and height of the developed RE are approximately λ/6 and λ/20, respectively, therefore, the antenna can be considered as low profile.
The current excited on the RE is concentrated in its vicinity as shown in Fig. 2. Therefore, the RE can be regarded as a “standalone” design whose operation is relatively undisturbed by its position on the satellite body, protruding objects in the vicinity, or by the satellite shape. However, some influences to antenna input impedance can occur and the tuning mechanism has been implemented in order to additionally adjust the antenna for any satellite configuration. The RE has two degrees of freedom that allow mechanical tuning: the lower shorting wall and the upper plate. By sliding these parts, the resonance length of the PIFA is changing, and therefore its resonant frequency as well. Additionally, when moving the lower wall (short) closer or further from the feeding point, the real part of the antenna impedance is directly affected leading to adjustment of the antenna's matching level.
Current distribution on the radiating element isolated (up) and fastened to the satellite body (down).

On top of this, the tuning optimization algorithm has been developed that allows finding appropriate tuning parameters using EM results from ANSYS HFSS simulations.
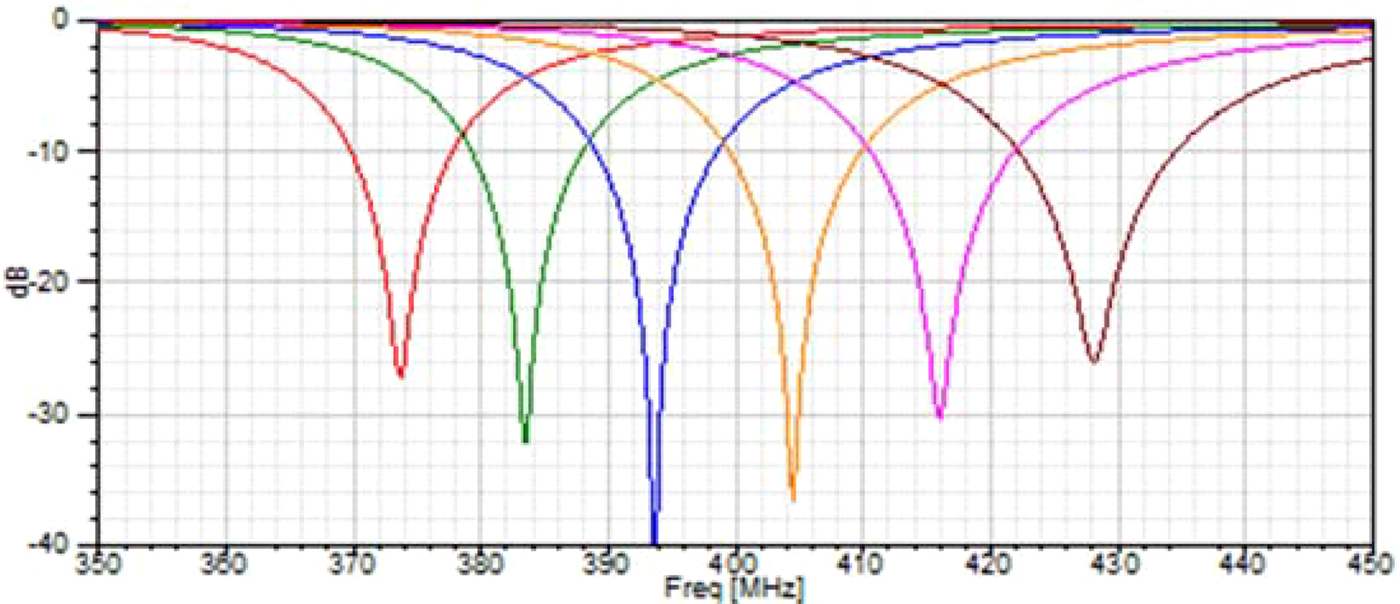
Return losses of the RE, simulated for different tuning parameters are presented in Fig. 3. Each curve presents return loss of the RE matched at different frequency for corresponding tuning parameters. The element can be easily tuned around the central frequency of 400 MHz. Total tunable range of the antenna is 60 MHz and is proportional to the length of shift_up and shift_down tuning slots. The design is scalable up to L band for other frequencies of interest. Required data-rates for applications in UHF band are typically in the order of a few kbit/s, therefore the operational bandwidth requirement is not stringent. The antenna element has a narrow −10 dB bandwidth of 10 MHz that fulfills the requirements of the system. RE operates in linear polarization.
Simulation results for radiating element return loss for different values of tuning parameters. The antenna can be mechanically tuned for any frequency in the designed range.
B) Mechanical design
The RE presents a lightweight and reliable construction. The parts withstand all the requirements, including quasi-static loads as well as random and sine vibration sweeps, shock and thermo-elastic stresses. Alodine 1200S is applied to all aluminum parts to ensure good electrical conductivity at the interfaces to guarantee bonding and grounding. The PIFA mechanical design is presented in Fig. 4.
Mechanical design of the radiating element.
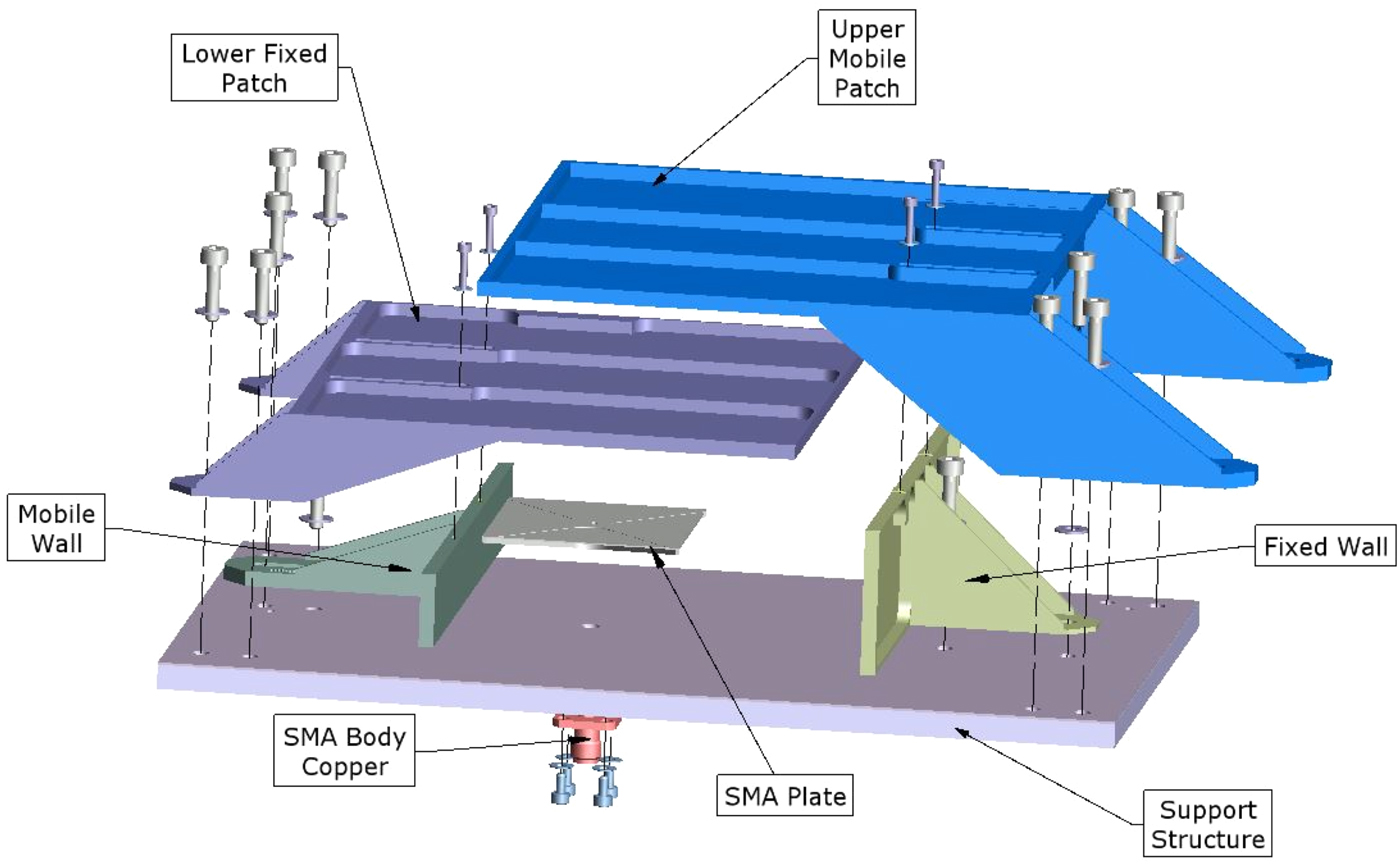
The upper mobile patch is an L-shaped structure fixed to the support structure. The position of this part is adjustable in longitude direction for tunability. The total movement range is provided by a slit in the fixation feet. The lower fixed patch is an L shape and is fixed with respect to the support structure. The mobile wall is interfacing the lower mobile patch that provides electrical contact between these two elements. The position of the mobile wall is adjustable on a same range as for the upper patch. The antenna system is targeted for space applications, therefore the capacitive feed is chosen for feeding the antenna in order to avoid any soldering. The capacitive feed is constituted by a flat surface, stiffened by ribs on the connector side. A drilling placed in the center allows the attachment to a connector for RF transmission. The connector body is attached to the support structure. On the other end, the connector pin is welded onto the capacitive cap.
A thermal study has been performed in order to determine the possible deformation of the structure impacts on the RF performances of the RE. The study has been done for +130 and for −150°C. The frequency shift generated by highest and lowest temperatures deformations is lower than the frequency bandwidth at −20 dB of the RE, meaning not big enough to move the resonance out of −20 dB frequency bandwidth.
The quasi-static stress verification analysis was done with 120 g acceleration applied in all directions. The compliant results are shown in Fig 5 and summarized in Table 2.
The quasi-static stress verification analysis for the radiating element.

The quasi-static stress verification analysis summary of the radiating element.

C) Optimization software
To make the design easier and versatile, some electrical tasks have been automated. In this sense, the matching of every RE placed on the cube was automatically done by an internally developed software tool called Tuning Optimizer. Essentially, this software finds the tuning settings for each RE so that its return loss at the operating frequency of 400 MHz is better than 20 dB. In addition, the radiation pattern can also be improved by adjusting the excitation values at the RE ports. This task is carried out by the Radiation Optimizer. In Fig 6 the complete design cycle to obtain the antenna system is presented. To make it fast and feasible, the complete design cycle has been implemented in MATLAB, yielding a powerful routine that accounts not only for the present situation but also for any situation regarding the placement of REs on a certain surface under some radiation prescriptions.
Flux diagram of the complete optimization software for tuning (left) and radiation (right).

The Tuning Optimizer is first used to match every RE. For that purpose, every RE must have some degrees of freedom, but the positions of the REs must be the final ones. Once the REs are tuned, the excitation of every RE is optimized in terms of amplitude and phase to obtain the prescribed radiation diagram. In this step, cost functions depending on the radiation prescription are needed. To build up these cost functions, the following parameters can be considered: coverage mask, gain, gain ripple, axial ratio, and cross-polar discrimination.
IV. ANTENNA SYSTEM
The RE described here was used in MMAS, shown in Fig. 7. The system requires eight REs distributed on two opposite faces of the satellite body and fed by appropriate beam-forming networks (BFNs). Depending on the utilized BFN, the antenna system operates in one of the three modes of operation:
-
• Mode A: Omnidirectional mode with high coverage; using eight REs with equal amplitudes and specific phases.
-
• Mode B: Directive mode for data transmission; using four REs on one face with equal amplitudes and specific phases.
-
• Mode D: Mode for RF tracking; using four REs on one face with equal amplitudes and specific phases for generating four slanted beams.
Minaturized Multi-function Antenna System consisting of eight radiating elements distributed on two opposite faces of the satellite body.
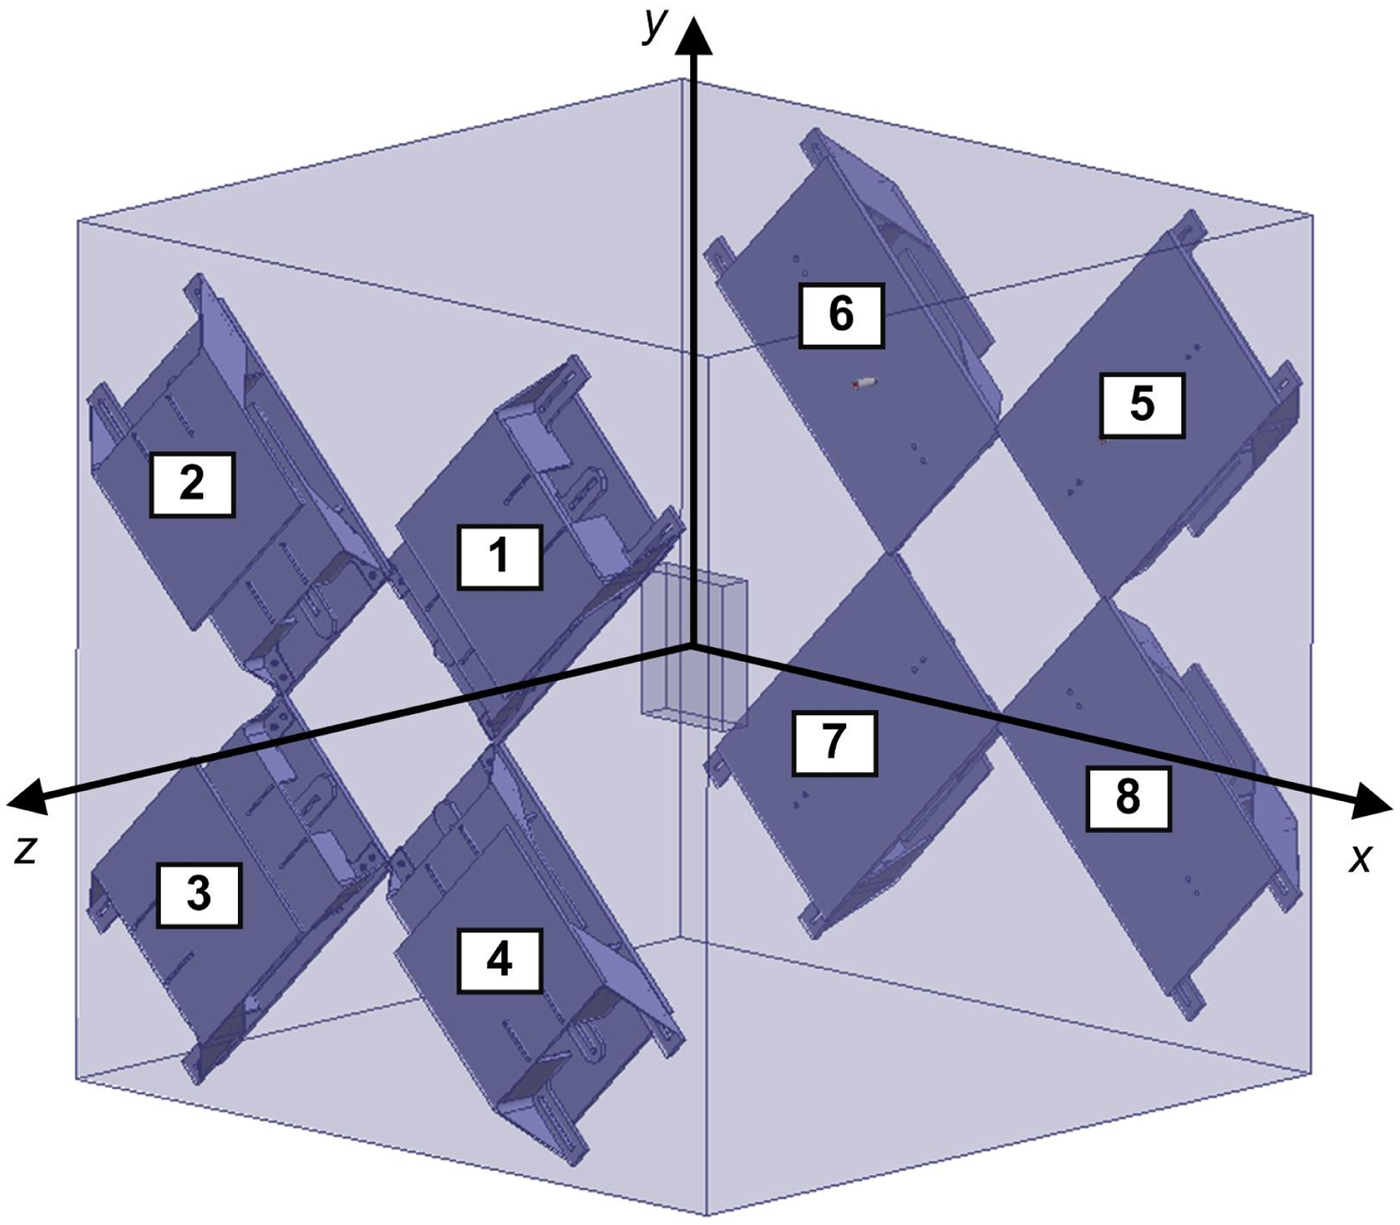
All modes operate at UHF and in circular polarization. The satellite size is 0.5 × 0.5 × 0.5 m3; therefore the length of the cube side is equal to just two-thirds of wavelength at the operating frequency.
Additionally, the possibility to have the system radiating in there different modes with fixed position of all the elements required precise calculation of excitations amplitudes and phases. More details on the antenna system and the results obtained are given in [Reference Debogovic9].
A) Omnidirectional mode A
In Mode A, all REs are excited such that the energy is radiated into both hemispheres (around ±z-directions), resulting in a good coverage in circular polarization (theoretically higher than 80%). When the first BFN port is excited, the phase distribution at the elements 1–8, respectively, is (0, −90, 180, +90, 0, −90, 180, and +90°), and the excitation magnitudes are equal. The nearly full-sphere coverage can be realised by combining the signals from both ports of the BFN.
B) Directive Mode B
In Mode B, only REs 1–4 are excited, resulting in a relatively directive beam in the +z-direction. Depending on the excited port of the BFN, the dominant polarization can be right hand circular polarization (RHCP) or left hand circular polarization (LHCP). The excitation phases at the elements El1–El4, respectively, when Port1 is excited are: (0, −90, 180, and +90°), while the excitation magnitudes are equal.
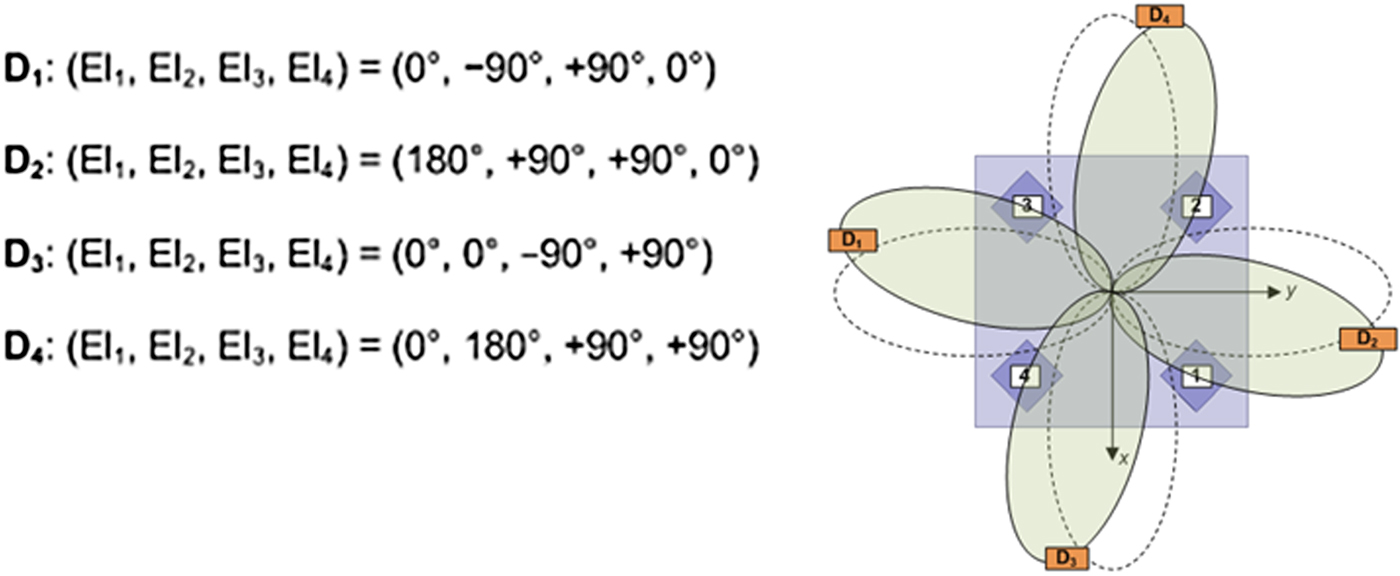
C) Tracking Mode D
In Mode D again only REs 1–4 are excited, but this time four slanted beams are obtained. The beams are theoretically slanted 30° off the +z-direction and their projections to the xy-plane are approximately aligned with ±x- and ±y-axes. In this mode the dominant polarization is RHCP. Figure 8 shows the phase distributions required to obtain the four orthogonal tracking beams D1–D4. The excitation magnitudes are equal.
Excitation distribution and illustration of the tracking beam directions in Mode D.
V. VALIDATION
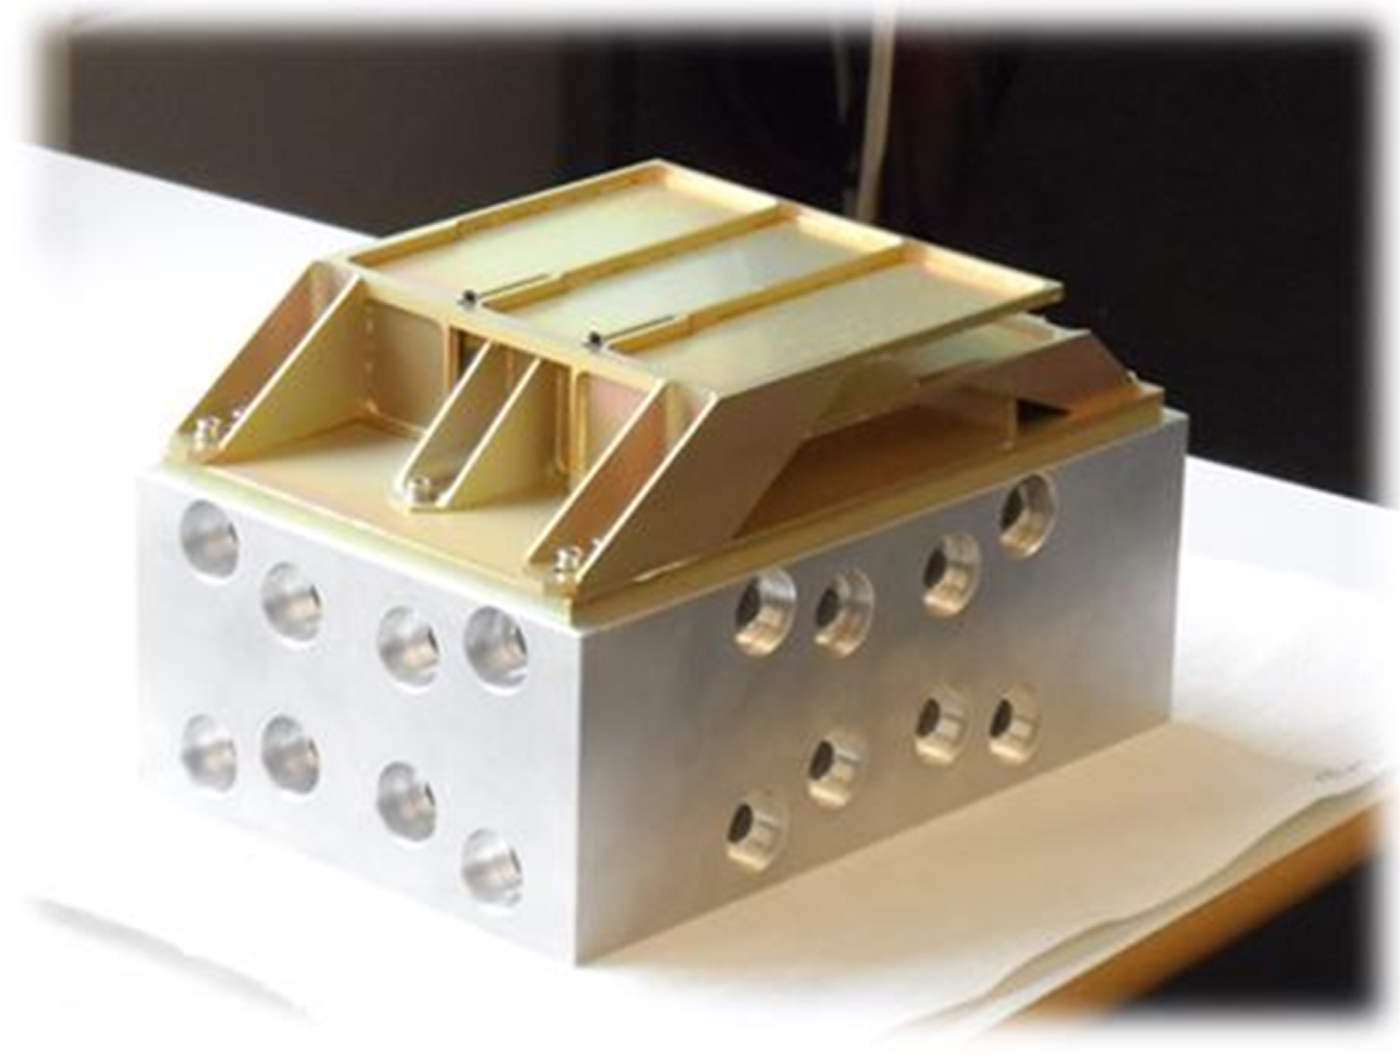
The manufactured element weights 0.23 kg. It presents a lightweight, easily manufactured and tunable structure. The manufactured RE, fastened to the vibration test support is shown in Fig. 9. In order to validate design and compare the performances with HFSS simulations, radiation pattern, and S parameter measurements were performed.
Radiating element manufactured and fastened to vibration test support.
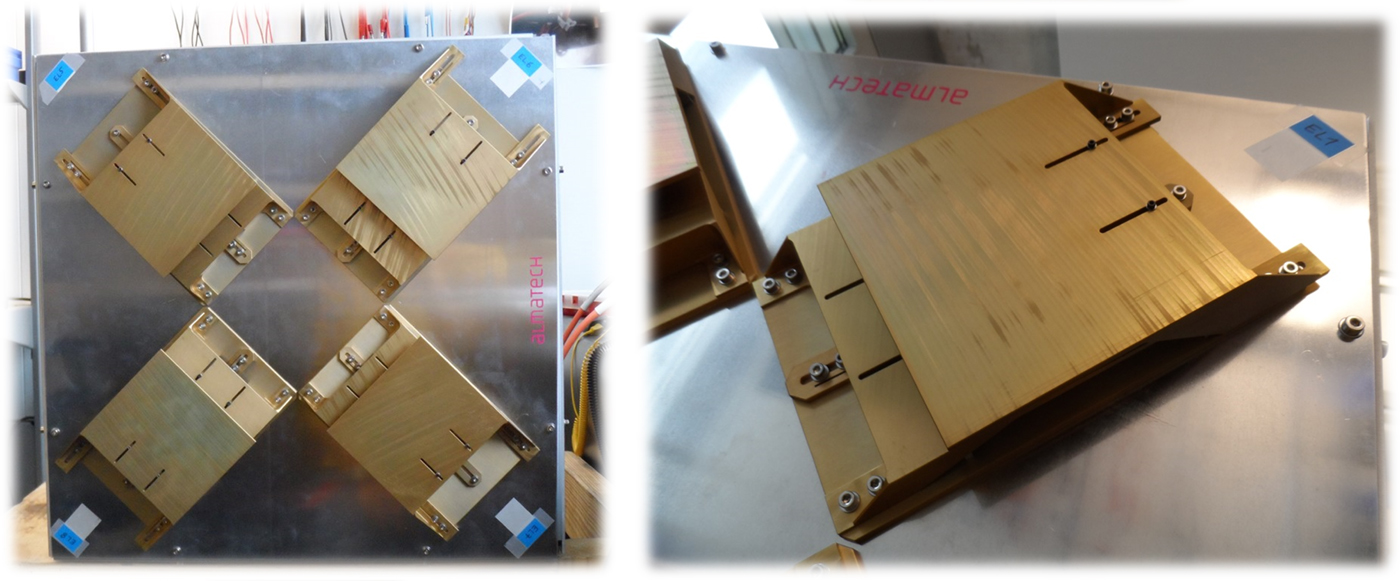
For the eight elements manufactured for testing the antenna system, design simplifications were applied in order to reduce the price and weight of the elements, which have limited impact on the RF performances. The so-called “simplified elements” attached to the metallic cube representing the satellite body are shown in Fig. 10.
Simplified radiating elements manufactured and fastened to the cube representing the satellite body.
A) Radiation pattern measurements
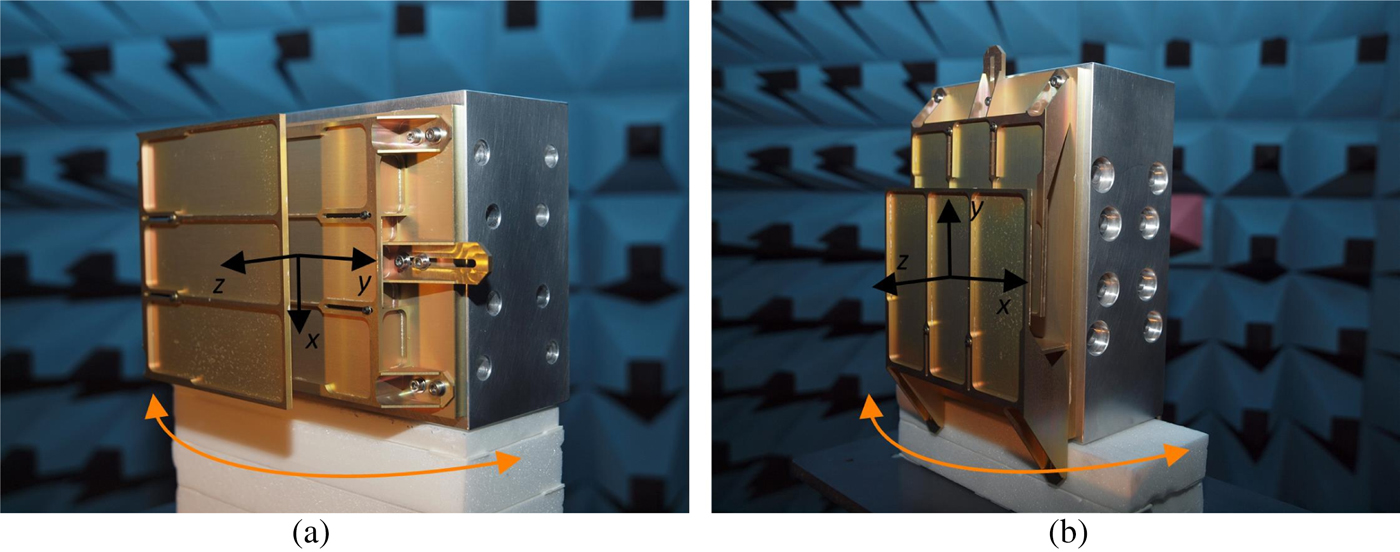
Radiation patterns in the E- and the H-plane were measured in linear polarization at three frequencies: 395, 400, and 405 MHz. Co- and cross-polarization components were examined. With the reference to the coordinate system shown in Fig. 11, the E-plane is the yz-plane, and the H-plane is the xz-plane. A typical radiation pattern for a PIFA on small ground plane has been obtained and results are presented in Fig. 12. Good agreement between measurement and simulation results can be observed in both principal planes. In addition, radiation patterns are consistent within the measured frequency band. The gain in the direction of maximum radiation was measured as well and the value obtained at the central frequency is 3.4 dB. The result of this measurement is compared with expectations obtained from simulation and is presented in Fig. 13. The measured and simulated values at the central frequency of 400 MHz are practically the same and only a small variation with frequency can be observed.
Radiation patterns measurement of radiating element mounted on the mechanical test fixture and the coordinate system: (a) E-plane; (b) H-plane.
Radiation patterns of radiating element: E-plane (up); H-plane (down). Legend: ··/—/-- 395/400/405 MHz; ![]() Co-pol measurement;
Co-pol measurement; ![]() Co-pol simulation;
Co-pol simulation; ![]() Cross-pol measurement;
Cross-pol measurement; ![]() Cross-pol simulation.
Cross-pol simulation.

Total gain of radiating element. Legend: ♦ Measurement; ![]() Simulation.
Simulation.

B) Return loss measurements
The RE has been tuned to the central frequency of 400 MHz using predicted values from HFSS simulations. The simulations and measurements of S11 parameter are presented in Fig. 14. As predicted, the element is well matched and tuned to the central frequency having the return loss value larger than 25 dB what is enough for having 20 dB return loss requirement for the whole antenna system fulfilled. Although the bandwidth is relatively narrow, this is not considered critical here since the data-rates in UHF band are in the order of a few kbit/s.
Simulated (up) and (measured) return loss of radiating element tuned to the central frequency of 400 MHz.

C) Vibration test and shock test
Both shock and vibration tests were performed with the RE fully extended to provide the worst case mechanical conditions. Therefore, for the maximum values of tuning parameters, the element was not matched any more at 400 MHz.
The vibration tests were done at the EPFL (École Polytechnique Fédérale de Lausanne) facilities. Two accelerometers were mounted on the antenna, one on the extremity of the upper mobile patch, and the other one on the lower fixed patch. The resonance search is performed according to the levels shown in Table 3 in a sweep up with sweep rate of 2 oct/min. In the same table, sine and random vibration levels are given for out-of-plane and in-plane axis.
Random and sine vibration levels.

* Flat spectrum from 40 to 200 Hz.
† Decaying from 0.22 at 200 Hz to 0 at 2000 Hz.
The antenna has been successfully tested. The variation of the resonant frequencies between two successive tests was going from 0 to 3.6%. The acceptance criterion of up to 5% variation between two successive tests is, therefore, reached. Furthermore, the maximal change between the last and the initial test is only about 5%.
For the shock test, the two worst cases directions were tested: the x-direction that is the worst case for screws and z-direction that presents the worst case for mechanical parts.
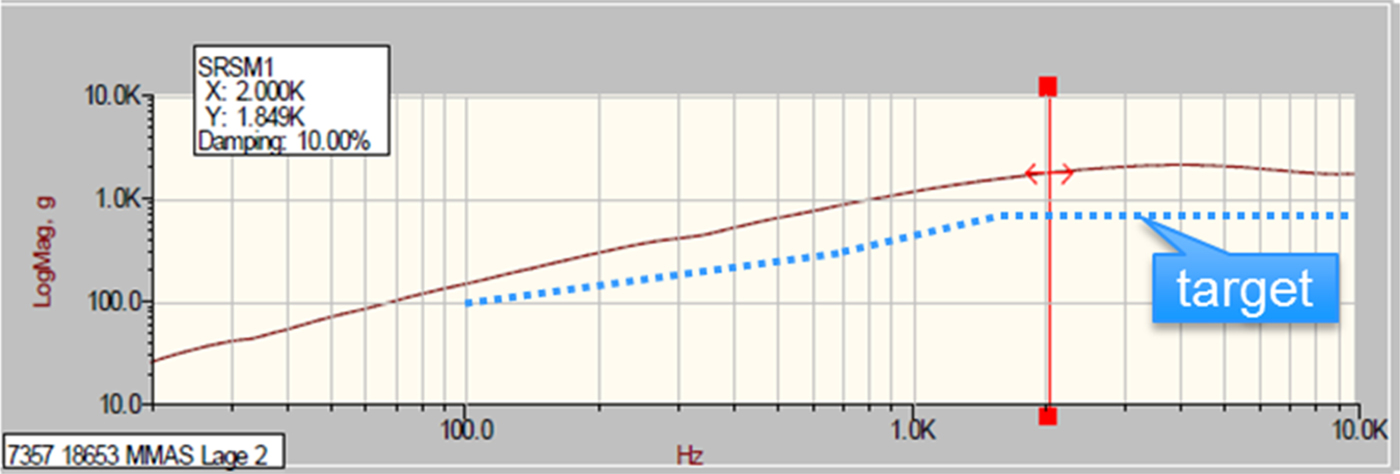
Shock tests were successfully performed and, although the SRS (shock-response spectrum) were well above the target as shown in Fig. 15, there were no noticeable deformation or damages detected on the part. All screws remained in place.
Shock Response Spectrum for x and z axes. The shock levels were far above the target.
D) RF influence of mechanical tests
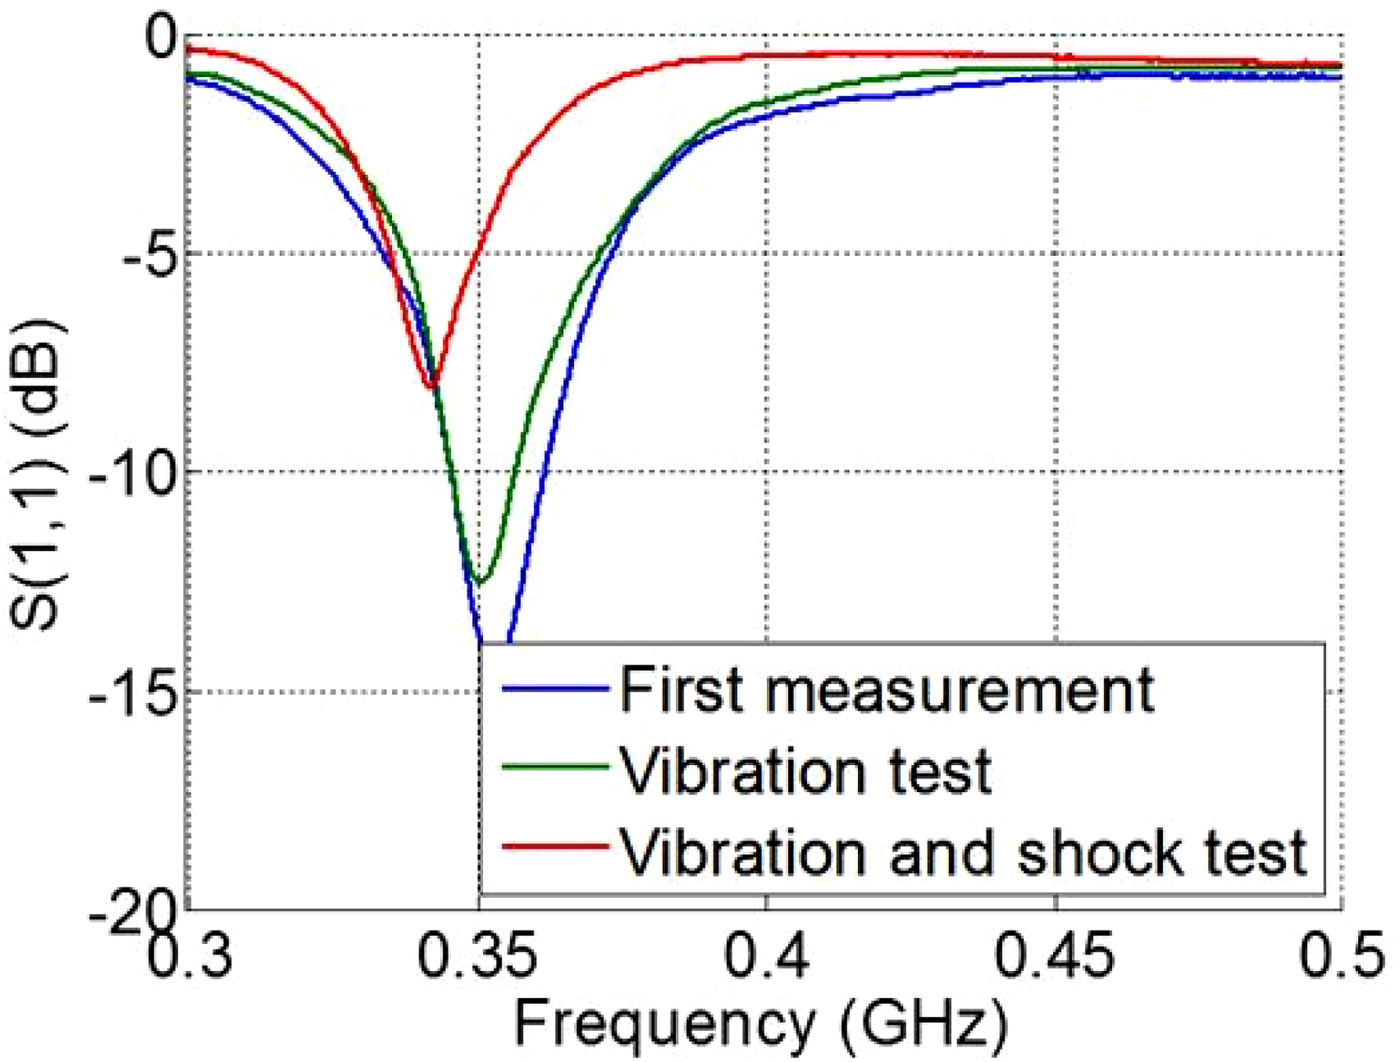
Return loss measurements of mechanical RE were performed in the worst mechanical position for the vibration and shock tests, when the element was not matched any more at 400 MHz. Three different measurements to test vibration and shock influence on RF performance of RE were performed. The comparative result is shown in Fig. 16. When looking at the return loss results, it can be observed that the vibration has negligible influence on the RF response. However, after the shock test, the resonant frequency is shifted down of 10 MHz and, since the element has a very narrow band, the level of matching went down for almost 10 dB.
Comparison of return loss measurements for radiating element before and after mechanical tests.
The most significant parameter that may be affected by the shock testing is the position of the capacitive feed, most probably due to the extremely high shock levels that were not adjusted according to the requirements. A way to improve the shock resistance, if necessary, is by changing the feeding mechanism from capacitive fed to direct feeding.
VI. VIABILITY OF TRANSLATION OF THE CONCEPT TO THE OTHER FREQUENCY BANDS
The developed RE is capable of operation at UHF (400 MHz), and has dimensions small enough to fit four of these REs on a 0.5 × 0.5 m cube face. In addition, the realised RE is essentially a “standalone” solution so translating its operation to other frequency bands would in principle only require a proportional scaling of its geometry. However, the viability of the frequency translation of the whole concept (antenna system) depends on the satellite platform size. In a scenario where the platform size has to be reduced as well (e.g. proportionally to the wavelength at higher frequencies), the choice of the RE realized in this project still seems sound up to S-band. However, some critical points should be considered. First, the coupling gap in capacitive feed is already small at 400 MHz. Hence, going up in frequency should reconsider the feeding technique. Second, the current tuning system relies on the 0.75 mm mechanical tuning resolution. Higher frequency would require a finer resolution and probably involve developing a new mechanical tuning approach.
From a manufacturing standpoint, Fig. 17 shows the effect of the frequency scaling. The current design diagonal size is 252 mm for a 400 MHz working frequency. Scaling up in frequencies implies scaling down in dimension with the same ratio. Therefore, with the current design and manufacturing technology a solution could reasonably be found for frequencies up to 2 GHz (diagonal of 50 mm).
Size of the element versus frequency chart.
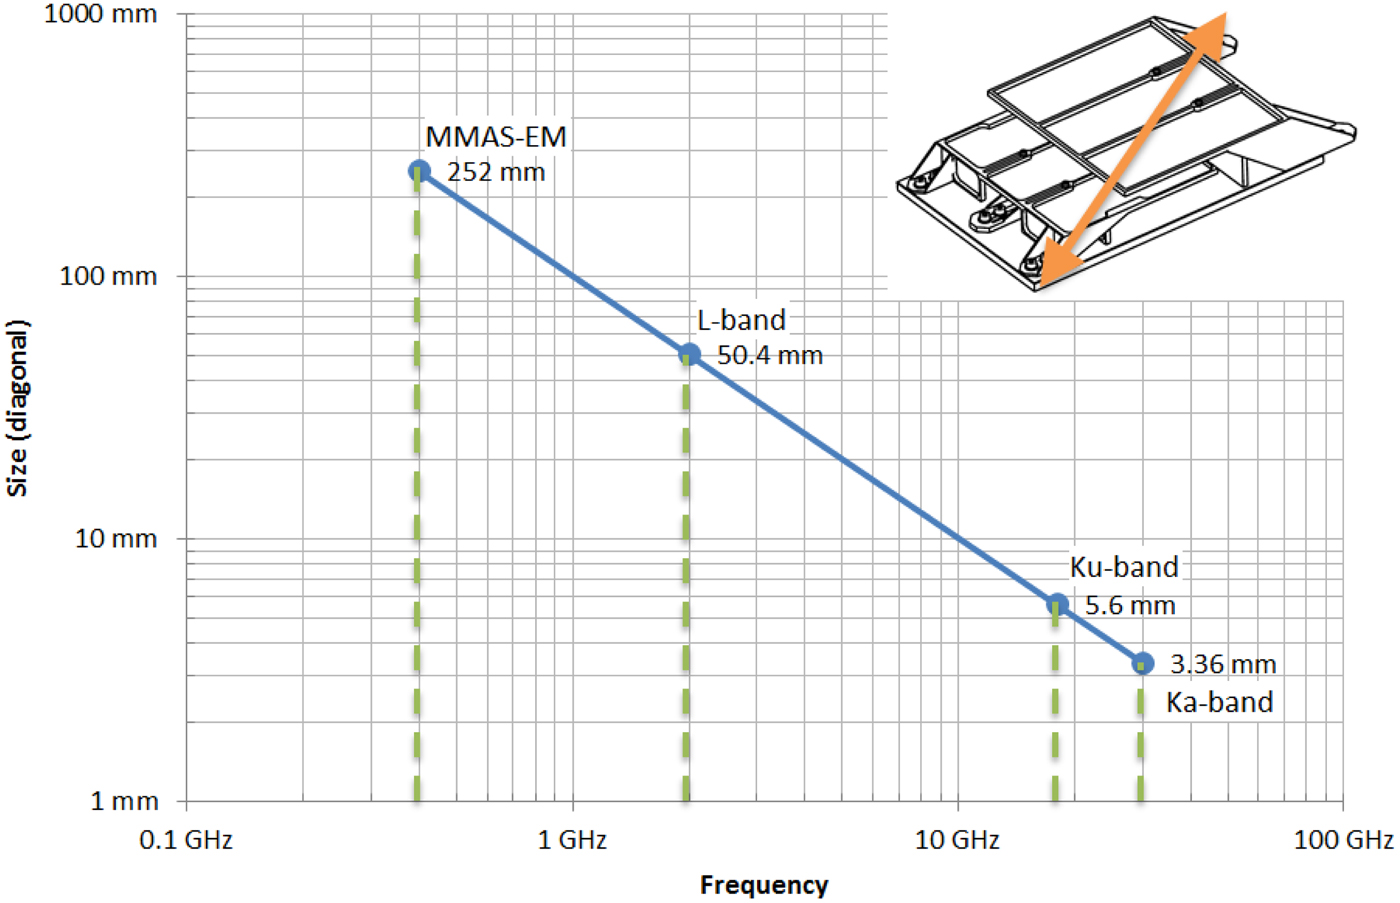
At the beginning of S-band (2 GHz), dimensions start to become critical for the current technology. Above this frequency, parts will become very small and tolerances will prevent using the same manufacturing technology. Additionally, adjustment of the element will also become more and more critical for higher frequencies.
VII. CONCLUSION
The miniaturized RE based on folded PIFA design has been developed and its size (including the supporting platform) is comparable to one-quarter wavelength. The element is proven to be a good choice for MMAS.
Geometry of the REs is relatively simple and easily scalable up to L-band. Excited currents are concentrated mostly in the vicinity of the REs. Therefore, the RF characteristics of RE are rather independent on the satellite size, shape, and position of the RE on the satellite. Furthermore, REs are independently mechanically tunable, which makes them even more suitable for usage independently on various positions on the satellite and additional obstacles. The RE has been successfully validated for electrical and environmental requirements.
ACKNOWLEDGEMENT
This work was encouraged and supported by European Space Agency in the frame of “Miniaturized Multi-Function Antenna System” activity (ESA Contract 4000107145).
 Nevena Šaponjić was born in Nova Varoš, Serbia. She received the B.Sc. degree in Electrical Engineering and Computing from the University of Belgrade, Serbia, in 2012 and the M.Sc. degree in Electrical Engineering from the École Polytechnique Fédérale de Lausanne – EPFL in 2014. Since October 2014, she has been with ViaSat Antenna Systems SA as an Antenna Engineer, where she has been working on development of phased antenna arrays and various antennas and antenna systems for space, airborne, and ground mobile applications. She has been involved in several projects for the European Space Agency (ESA).
 Tomislav Debogovic was born in Zagreb, Croatia. He received the M.Sc. and Ph.D. degrees in Electrical Engineering from the Faculty of Electrical Engineering and Computing (University of Zagreb) in 2004 and 2011, respectively. From 2005 to 2012 he was Research Assistant with the Department of Wireless Communications, Faculty of Electrical Engineering, where he was involved in projects related to design and measurement of antennas and microwave devices. From 2012 to 2016 he was Research Fellow with the Laboratory of Electromagnetics and Acoustics, Ecole Polytechnique Fédérale de Lausanne (LEMA-EPFL), where he was involved in academic and industrial projects in the field of antennas and microwave devices, as well as responsible for microwave and antenna measurements. He is currently electrical engineer at SWISSto12. His main research interests are in the areas of antennas and passive microwave devices.
 Frédéric Bongard received the M.Sc. degree in Electrical Engineering and Ph.D. degree from the Ecole Polytechnique Fédérale de Lausanne (EPFL), Lausanne, Switzerland, in 2003 and 2009, respectively. From 2003 to 2004, he was an Assistant with the acoustics portion of the Laboratory of Electromagnetics and Acoustics (LEMA), EPFL. From 2004 to 2009, he was with the electromagnetics part of LEMA, where he completed his Ph.D. while working as a Research and Teaching Assistant. Since November 2009, he is an R&D Antenna Engineer at the company ViaSat Antenna Systems SA (formerly JAST SA), Lausanne, Switzerland. He has been involved in several projects for the European Space Agency (ESA). His research interests include phased array antennas for mobile user terminals for satellite communications.
 Dr. Pedro Robustillo-Bayon was born in Bienvenida (Badajoz, Spain). He received his Ingeniero de Telecomunicación degree from Universidad de Sevilla (Seville, Spain), in 2006, and his PhD degree from Universidad Politécnica de Madrid (Madrid, Spain), in 2013. From 2013 to 2016, he joined the Laboratoire d’Electromagnetisme et Acoustic (LEMA) at Ecole Politechnique Fédérale de Lasuanne (Lausanne, Switzerland), where he worked as Post-Doc researcher. Among his areas of interest and research there are: numerical methods and technique for electromagnetic modelling, antenna and MW design, and optimization techniques. Dr. Robustillo-Bayon has authored and co-authored several peer-review magazine papers as well as papers submitted to relevant conferences. From 2016, he is part of the Microwave Department, at Airbus (Friedrichshafen, Germany), serving as RF/MW Engineer for subsystems management included in space programs.
 Maria Carolina Vigano received the Master degree in Telecommunication Engineering from the University of Florence in 2006. After she worked as YGT at ESA-ESTEC in the Antenna Section. She completed her Ph.D. degree in Innovative Array Architectures for Space Applications at the Technical University of Delft in 2010, co-sponsored by TU Delft, Thales Alenia Space Toulouse and ESA-ESTEC. Since 2010 she is working at ViaSat Antenna Systems SA as Senior Antenna Engineer first and lately in the Terminal Development Group.
 Mikael Krummen received his Master of Science degree in Microengineering from Ecole Polytechnique Federale de Lausanne – EPFL in 2004. Since then, he has been working in Mecanex, Dolima, RUAG Space and SICPA as Project Leader until 2012 when he started working In ViaSat Antenna Systems in Lausanne as Program Manager. Since September 2016 he is teaching mathematics and physics in Ecole des Arches.
 Jean-Daniel Landis received his master of sciences in 2005 from the School of Engineering department of the Ecole Polytechnique Federale de Lausanne – EPFL. He has been working at the Swiss Plasma Center and wrote several articles in the nuclear fusion engineering domain. He is working as a mechanical engineer at Almatech space engineering since 2009.
 Marco Sabbadini received the M.Sc. degree in 1983. Until 1988 he was with the Antenna Group, Thales Alenia Space Italy, Roma (IT), then with the European Space Agency. Currently he holds a post in the post of Senior Antenna Engineer, at the European Space Research Centre Technology (ESTEC) in Noordwijk (NL). His main areas of professional activity are: antenna research, technology development, and design, involving also computational electromagnetics and computer-aided antenna engineering tools. His main contribution in the space antenna field include: the design of antennas for a number of satellite missions, the conception of the first antenna design framework and the management of its development over about 20 years, antenna “miniaturization” to use the limited space and mass allocation available on spacecraft in the best way and, most notably, the recent work on modulated metasurface antennas and their applications in Space missions, which currently amounts to a large part of its professional activity.


