

The authors regret that they identified a missingness issue in a few variables in their dataset that capture state capacity, and which was due to an error in the merge code. After fixing this issue, the overall interpretation of the findings or the conclusions of the article remain unchanged.
Specifically, the R merge code for the state capacity variables (04_merging_capacity_variables.R) contained errors leading to unnecessary NAs in the cross-sectional (final_cross.dta) and panel (final_panel.dta) final datasets for all the variables that were imported from the Hanson and Sigman (Reference Hanson and Sigman2021) (HS) (Capacity, Pre_capacity, Post_capacity) and O’Reilly and Murphy (Reference O’Reilly and Murphy2022) (OM) datasets (Pre_sci_comp, Post_sci_comp). It also led to unnecessary NAs in the cross-sectional dataset (final_cross.dta) for the variable Sci_comp_diff, which is calculated as Post_sci_comp minus Pre_sci_comp. The authors thank Ulaş Erdoğdu for letting them know about unnecessary missing cases in one of the variables, which helped identify the problem in the code.
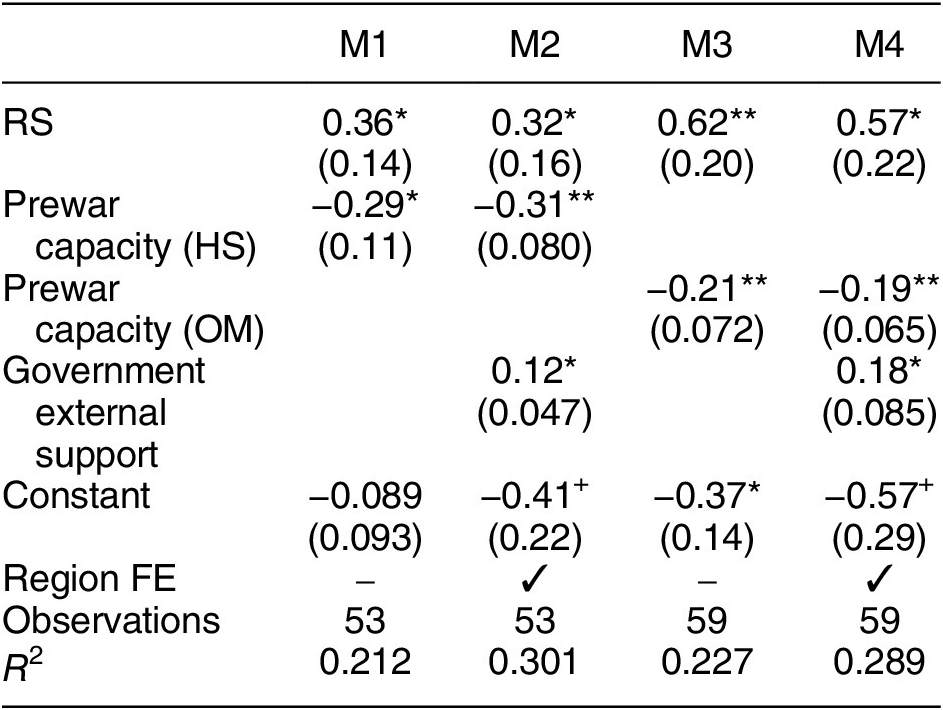
The authors have not identified any other errors in the imported state capacity data—only unnecessary missing values. To fix this problem, they hand coded the values of the HS and OM prewar capacity data in the cross-sectional dataset (Pre_capacity and Pre_sci_comp), and the value of the HS capacity data in the panel dataset (Capacity). They also hand coded the measures of postwar state capacity (Post_capacity and Post_sci_comp). These variables are used to calculate “state capacity difference” (Capacity_diff and Sci_comp_diff), a variable included in Table 7 of the main paper (and Table B.7 of the SM). They note that, for these variables, they have hand coded only the relevant cases for these analyses, which are wars that started before 1991 and did not end in rebel victory.
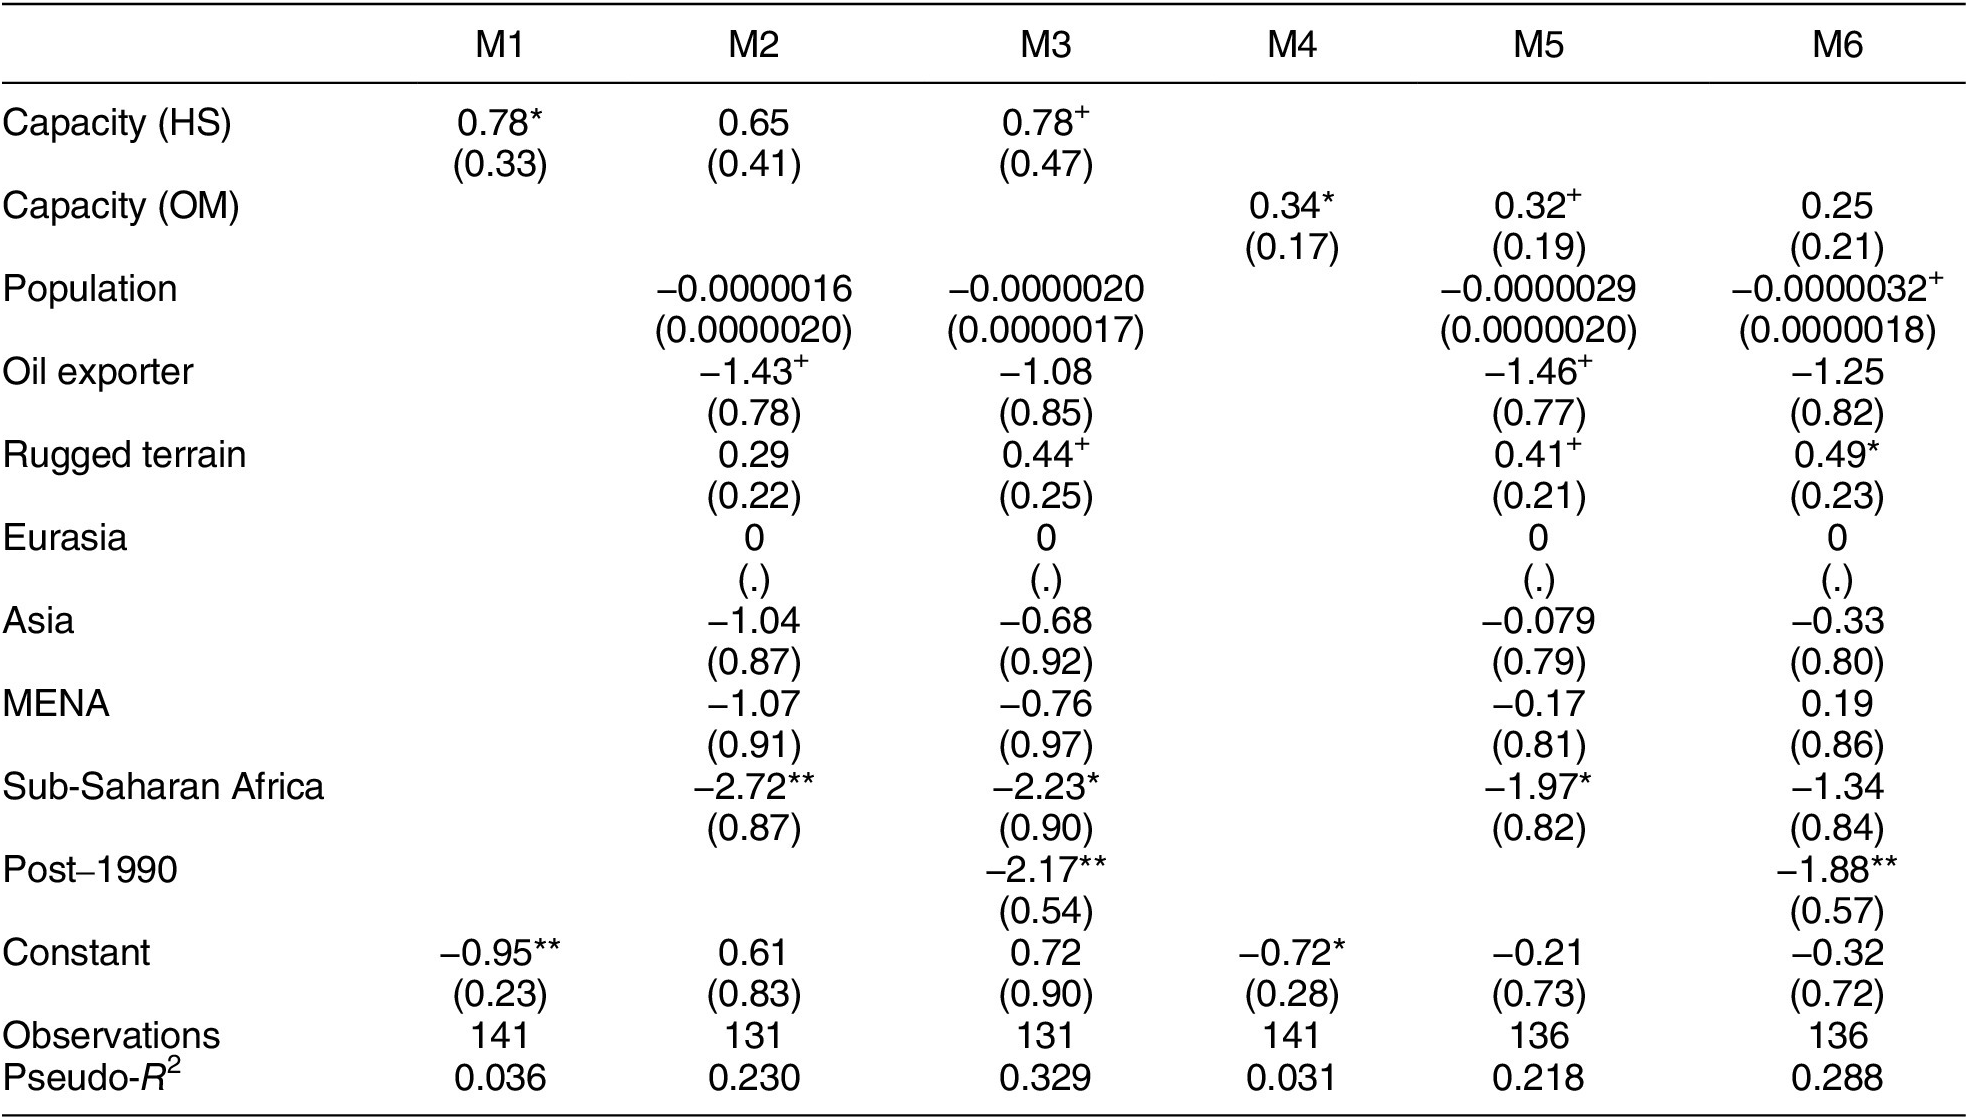
The missingness issue impacted the following tables and figures in the paper and SM: Table 6 and Table 7 in the main article; Figure B.1, Table B.2, and Table B.7 in the SM. The rest of tables and figures in the article and SM are unaffected by this issue. The article’s revised tables are included in this corrigendum; the revised SM is uploaded in the revised Dataverse.
The new results do not present any substantial changes in the direction or magnitude of results, but a few minor differences are worth noting. In Table 7, for Models 3 and 4 (with Sci_comp_diff), the number of observations increases substantially—from 40 to 59—which makes the results more robust and yields slightly more precise estimates for the key coefficient, RS, especially in Model 4. The point estimate of the RS coefficient drops slightly in these models. Conversely, some of the state capacity coefficients in Table 6 become slightly smaller and less precise, although the direction of all effects remains consistent with those in the original table and reported in the paper. Only the Capacity (HS) coefficient in Model 2 of Table 6 loses statistical significance in the revised analysis.
With regards to the SM, new Figure B.1 (corresponding to Model 3 of Table 6) shows that the state capacity marginal effect is no longer statistically significant at the 95% level; it is at the 90% level. The rest of the results are nearly identical to those in the original figure. In Table B.2, both the magnitude and direction of the RS rebels coefficients remain highly consistent across models, with only a minor drop in statistical significance in Model 4 (it is now significant at the 90% level). In revised Table B.7, the RS coefficient is extremely stable in both point estimate and standard error in Models 1 and 2. In Models 3 and 4, the point estimate drops slightly, and standard errors shrink, making the results a bit more precise.
Table 6. Logit on RS Rebels (1944–2016), Revised Results

Note: All models report robust clustered standard errors by conflict (in parentheses). Models M1 to M3 use Hanson and Sigman’s (HS) capacity; M4 to M6 use O’Reilly and Murphy’s (OM) comprehensive capacity. These measures of state capacity are all lagged 1 year before the civil war onset. Latin America is the reference category for region. + $ p<0.10 $
, *
$ p<0.10 $
, * $ p<0.05 $
, **
$ p<0.05 $
, ** $ p<0.01 $
.
$ p<0.01 $
.
Table 7. RS and State Capacity Growth, Revised Results

Note: All models report robust clustered standard errors by conflict (in parentheses).
The universe of cases in this table are civil wars that started before 1991 and that were not won by the rebels. + $ p<0.10 $
, *
$ p<0.10 $
, * $ p<0.05 $
, **
$ p<0.05 $
, ** $ p<0.01 $
.
$ p<0.01 $
.

 Open access
Comments
No Comments have been published for this article.