





Policy Significance Statement
In this article, we describe a platform that can support informed decision-making with regard to the design, implementation, monitoring, and evaluation of flood reduction policies, considering a variety of data. The system supports policy makers by (a) effectively modeling the policy-making cycle and structuring the decision-making process, using business process models; the models are integrated in a user-friendly frontend and guide the decision-makers through the process; (b) combining different social, economic, and environmental data, including both real data and simulation results; (c) offering a flexible architecture that allows easy adaptation to any flood risk reduction policy; and (d) transforming the decision-making of public administrations from an intuition-based to an evidence-based process.
1. Introduction
Climate change is a defining problem of our time. Its consequences are observed with increased frequency and the necessity of action by politicians and the society has never been as crucial as it is now. Climate change has caused an increase of natural disasters such as floods (Seneviratne et al., Reference Seneviratne, Nicholls, Easterling, Goodess, Kanae, Kossin, Luo, Marengo, McInnes, Rahimi, Reichstein, Sorteberg, Vera, Zhang, Field, Dahe, Stocker and Barros2012), wildfires, and tornadoes that requires the creation of risk management policies to effectively address them (Aalst, Reference Aalst2006). For the efficient monitoring of climate change effects, cities have started using different intelligent technologies such as internet of things (IoT) sensors, weather stations and cameras that produce an ever-growing amount of data (Silva et al., Reference Silva, Khan and Han2018). The existence of this abundance of data provides a unique opportunity to local authorities that could utilize this information for developing the necessary risk management policies (Lee, Reference Lee2020). However, the development of such policies involves a complex decision-making process that needs to consider multiple parameters in order to effectively protect the cities against these natural threats.
The term Decision Support System (DSS) was first established in 1970s–1980s, when Gorry and Scott Morton (Reference Gorry and Scott-Morton1971) defined it as an interactive computer based system that helps decision-makers solve structured or semi-structured problems based on data and models. A similar definition is given by Loucks and Da Costa (Reference Loucks and da Costa1991), who extend it by adding the existence of interactive, graphical and modeling characteristics to the system. During the last couple of decades, there have been several attempts to develop such systems to help policy makers with flood risk management. Simonovic (Reference Simonovic1999), for example, proposed a system whose main objectives were planning for different flood management alternatives, evaluating them, and finally planning the recovery after a flood event has occurred. The system comprised of a web-based user interface that provided access to distributed virtual databases (through a shared metadata catalog), and modeling tools (hydrologic, hydraulic, economic, and environmental models available by different agencies). Since then, DSSs for flood risk management have significantly evolved. The evolution of DSSs is closely related with the advancements made on information technology; better and faster simulation and forecasting models, more advanced graphical user interfaces, easier and more interactive data visualizations and many more are incorporated to such systems nowadays. Ahmad and Simonovic (Reference Ahmad and Simonovic2006), for example, present a DSS, which includes advanced forecasting methods as well as modeling and operation of flood control structures to support decision-makers in selecting measures and predict flood consequences in several scenarios. Finally, in more recent years, real-time monitoring capabilities have also been included in DSSs thanks to the recent explosion of IoT sensor technologies that allow easy monitoring of flood-related parameters. Several examples of DSSs that include real-time sensor monitoring in addition to the information presented in earlier DSS implementations are examined by Acosta-Coll et al. (Reference Acosta-Coll, Ballester-Merelo, Martinez-Peiró and De la Hoz-Franco2018) in a comprehensive review.
The evolution of flood-related DSSs, illustrates how policy making related to flood risk management deals with a variety of complex decisions that entail significant challenges. To begin with, harnessing the potential available data requires that public authorities address the challenges of data access and data analysis capacity (Fan et al., Reference Fan, Han and Liu2014). Additionally, despite the increase in data availability, the decisions are still largely based on intuition, past experience and general assumptions made by the people involved in the decision-making process (Dror, Reference Dror2017). Finally, the decision-making process concerning climate or environmental risk management is a complex process that includes several policy officials getting involved in different parts of the process, in many cases using completely different systems, for example, to design a flood protection measure and then to monitor its operation.
In this article, we propose an innovative DSS that could help policy makers make informed decisions with regard to the design and implementation of flood risk management policies. At a European level, the Floods directive (FD) (2007/60/EU) establishes an integrated framework aimed to reduce the negative consequences of floods for the human health, the environment, the cultural heritage and the economic activities. However, when examining the relevant information and communication technology (ICT) solutions proposed in the literature, it is clear that there is a lack of a universal approach that handles simultaneously the different phases of the policy cycle, that is, the design, implementation, monitoring, and evaluation of flood protection policies.
On the contrary, the proposed systems offer functionalities that support the needs of a specific phase of the policy cycle. Through their review, Newman et al. (Reference Newman, Maier, Riddell, Zecchin, Daniell, Schaefer, van Delden, Khazai, O’Flaherty and Newland2017) observe that such systems mostly focus on identifying areas of risk (Inform phase, prior to design), whereas systems that support the evaluation of risk reduction options are not researched as much. For example, such a system that focuses on providing information about flood hazard is presented by Saha et al. (Reference Saha, Shekhar, Sadhukhan and Das2018) who develop a model based on rainfall history, which can predict the areas with increased flood risk, using vulnerability and hazard calculations. The risk zones and vulnerable areas are presented in a geo-visualization, which allows decision-makers to utilize the presented information and take necessary measures of prevention. Similarly, Sharma et al. (Reference Sharma, Rao, Amminedu, Nagamani, Shukla, Rao and Bhanumurthy2016) utilize heterogeneous flood-related information such as meteorological and rainfall satellite information, spatial data and more, and use it as an input for simulation, aiming to predict probable flood events and present them in spatial views.
Regarding the assessment of risk reduction options in order to identify the most appropriate measure (Advise phase, prior to the measure selection), Laine et al. (Reference Laine, Cook and Lemass2012) describe an interesting methodology that allows the selection between several different flood risk management measures. The proposed process revolves around scoring, weighting options and constraints, and the system results to numerically ranked preferences for consideration. To verify this methodology, they present the development of a new flood management DSS, which can support the identification of adaptation solutions in case of flood risk, facilitate community consultation for flood risk management, and communicate flood risk management decisions to the stakeholders. Another example of a DSS used for the development of alternative strategies for flood risk management is the Planning Kit Room for the River proposed by Van Schijndel (Reference Van Schijndel2006). Even though the aforementioned works allow selection between several different measures, they do not support monitoring of the performance of the selected measures after their implementation, nor the evaluation of their effectiveness after a specific period of time.
Finally, Horita et al. (Reference Horita, Mendiondo, Souza, Fava, Rotava, Ueyama and de Albuquerque2014) focuses on the Monitor phase of the policy cycle. More specifically, they describe a way to perform real-time monitoring by calculating the Hazard Index, a KPI that “represents the vulnerability to loss with regard to human stability,” using data from a sensor network in Brazil. Similar implementations have been presented by Sunkpho and Oottamakorn (Reference Sunkpho and Oottamakorn2011) and Garcia et al. (Reference Garcia, Retamar and Javier2015). Their proposals focus solely on monitoring flood hazard and they do not include any other functionalities such as informing or advising in advance of the implementation of a measure.
For efficient and comprehensive policy making, it is essential to interconnect all these different policy cycle steps: from designing the necessary flood mitigation measure and estimating its potential impact on flood reduction, to its implementation and monitoring, to the evaluation of the policy outcomes and performance, and finally the revision of the parts of the policy that do not provide the expected benefits.
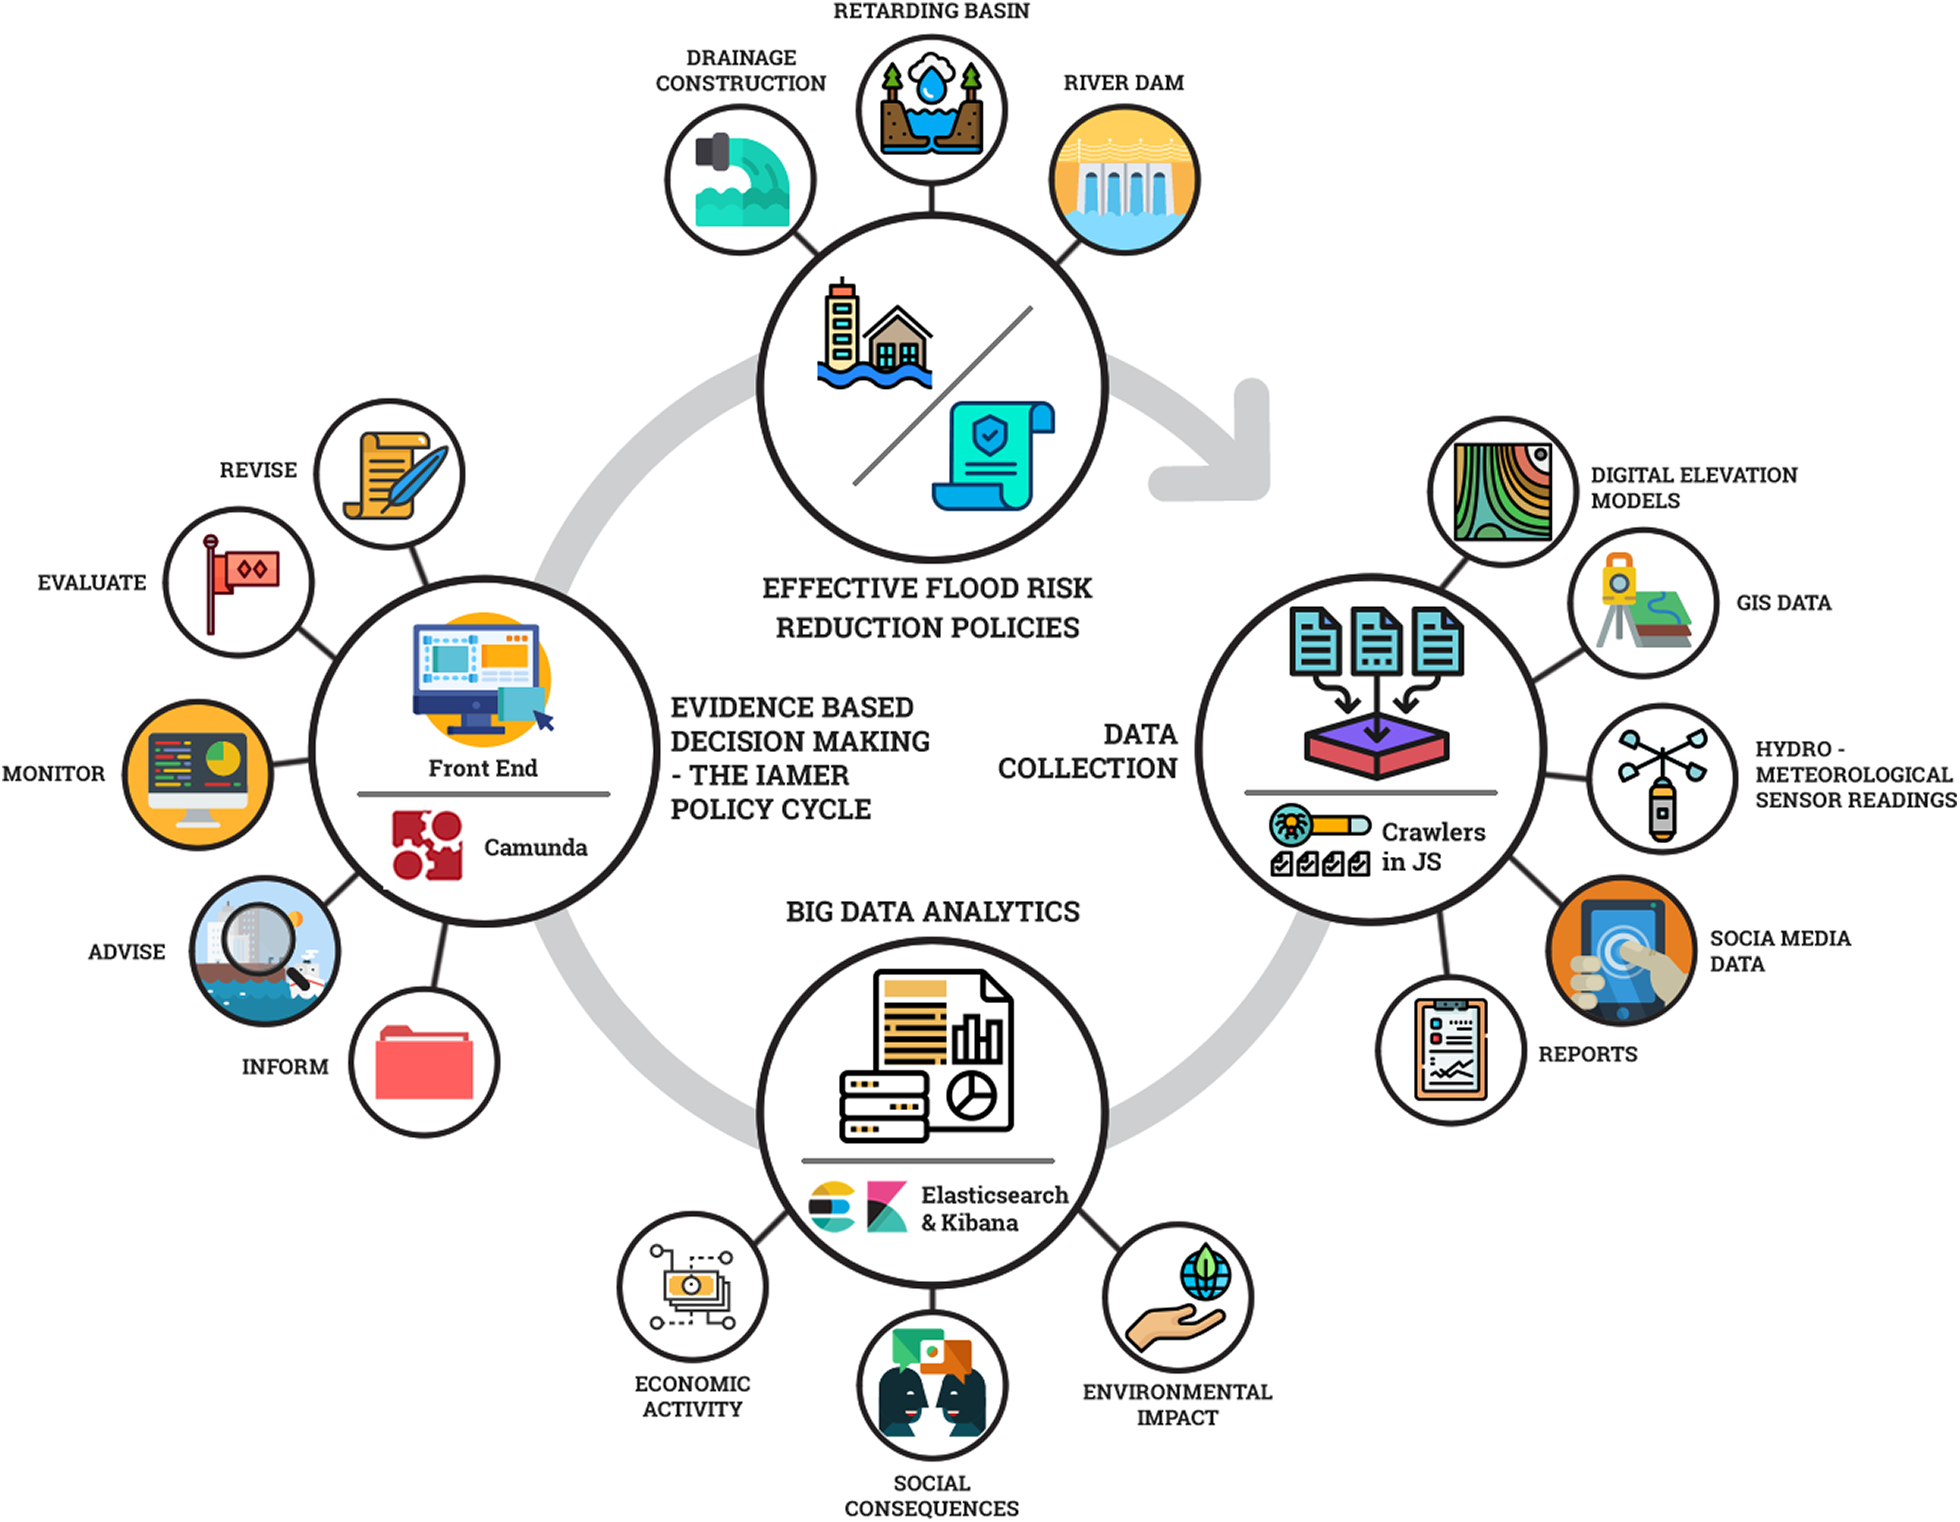
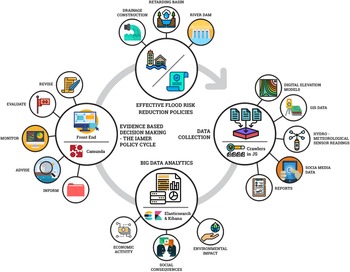
In this work, we adopt a methodology that supports the interconnection of the aforementioned phases of the policy making cycle, called IAMER. IAMER stands for Inform, Advise, Monitor, Evaluate and Revise, which are the different steps a policy maker has to go through to complete the policy cycle. This methodology was developed in the context of the CUTLER project (CUTLER, n.d.) and is incorporated in the design of a DSS that is based on big data for the environment, the economy, and the society and aims to help policy makers make informed decisions based on evidence. Specifically, for the case we are examining in this article, the policy makers will use the IAMER methodology to first decide whether a specific flood risk reduction measure should be implemented or not, and then monitor and evaluate its performance once it has been implemented. The decision support mechanism is enabled by data visualizations and business process modeling, using data analytics of both current and historical data, as well as GIS data and flood risk and hazard simulation data. This process is summarized in Figure 1. The necessity of real and simulation data is not limited to the design phase of the flood protection measure; they are also necessary to estimate the expected impact of measure implementation as well as the actual impact of the measure after it has been implemented and monitored for a period of time.
The main concept of the proposed decision support system (DSS) for developing flood risk reduction policies, and the main technologies used.
Finally, we propose a multifacet interface that seamlessly integrates and combines all steps of the decision-making process, as described by the IAMER methodology, into one platform. This allows the policy-makers to obtain a holistic overview of the process as well as to be able to communicate with each other thus, bridging the gap that usually exists between stakeholders responsible for different steps of the policy making cycle. The developed framework and platform support the modeling of existing decision-making processes in public administrations (e.g., municipal and regional authorities), which are enriched with big data analytics and advanced visualizations to allow evidence-driven decisions. The tools and technologies described in this article have been developed in the context of the CUTLER (CUTLER—Coastal Urban developmenT through the LEnses of Resiliency) H2020 project (contract no. 770469) (CUTLER, n.d.).
Unlike the works presented above, the proposed system does not focus on a specific policy phase but rather provides a holistic solution that allows policy makers to use a single platform throughout the entire policy making cycle, from policy design to policy implementation monitoring and evaluation. In addition, unlike other works that focus on the analysis of limited data sources (Horita et al., Reference Horita, Mendiondo, Souza, Fava, Rotava, Ueyama and de Albuquerque2014; Sharma et al., Reference Sharma, Rao, Amminedu, Nagamani, Shukla, Rao and Bhanumurthy2016; Saha et al., Reference Saha, Shekhar, Sadhukhan and Das2018), we propose a system that effectively combines heterogeneous environmental, social and economic data, including also new sources of information such as social media, providing a more complete overview of the current status but also of the potential impact and real-life consequences of the examined flood protection measure. Moreover, for the first time we propose the use of a Business Process Engine to help steer the decision-making process with regard to flood-related policies, exploiting and combining recent advances in business process modeling and DSS systems. The most important contribution to the state-of-the-art however is that we propose a generic methodology and a DSS platform that offer a standardized way of presenting the decision-making process to policy makers and visualizing the necessary evidence in each step of the process, while at the same time being flexible enough to allow easy adaptation to the needs of different cities in terms of examined flood management policies, decision-making processes, and IT infrastructure. None of the works mentioned in the previous paragraphs covers such a wide range of functionalities or provides such a flexible solution. Additionally, most of the existing DSSs (Emergency|Copernicus, n.d.; European Centre for Medium-Range Weather Forecasts, n.d.; Regional Environmental Protection Agency, n.d.; Strumenti di modellistica idrologica, n.d.) are early warning systems that include flood forecasting models, which are focused on civil protection and they are used as a tool for short-term emergency response. Our proposal, on the other hand, targets flood risk management policy planning rather than civil protection, and it has a more long term focus. Finally, something that the proposed system is currently missing is the option to compare different measures and select the most appropriate one, a functionality that is offered by the solution of Laine et al. (Reference Laine, Cook and Lemass2012). However, our system can be easily adapted to provide such functionalities as long as the necessary data for the analysis of the impact of different flood management measures becomes available.
2. The IAMER Methodology for the Use of Big Data in Policy Making
The abundance of data produced by the cities and citizens on a daily basis can significantly improve policy making; however, to do so the data should be efficiently exploited and processed and the generated information should be properly presented. A common problem of decisions based on big data analytics is that the amount of information given to the policy maker is often large and unstructured. To address this issue, we propose the IAMER (Inform, Advise, Monitor, Evaluate, Revise) methodology (CUTLER, 2020a), which interconnects the different phases of policy making, from the design of a flood risk management measure, to the monitoring and evaluation of its performance. In more detail, this methodological approach uses big data to:
1. Inform policy-makers by effectively visualizing and presenting to them all the available social, economic, and environmental information that is relevant to the policies under consideration.
2. Advise them about the estimated impact of planned policy measures.
3. Help them monitor the progress of enforced measures and ensure compliance with objectives by visualizing in real-time data obtained from the sensing infrastructures and detecting significant changes.
4. Allow them to evaluate the performance of the policies by quantifying and assessing their real-life impact based on the data collected by the monitoring mechanisms and by defining a set of key performance indicators (KPIs).
5. Assist them in revising their action plans in an iterative manner so as to achieve the policy objectives.
The aforementioned methodology can be used to effectively structure the decision-making process for a variety of policies. To properly explain, test and evaluate the usefulness of the methodology as well as its incorporation in a DSS, we will focus on a policy related to flood risk management in the city of Vicenza.
3. Decision-Making Process Modeling and DSS Functionalities for Flood Protection Policies
In the following subsections, we present the policy problem, explain how we model the decision-making process and define the desired DSS functionalities, and finally describe the types of data that can be used to inform flood-related decisions.
3.1. The policy problem
While being the home to many UNESCO-protected cultural and artistic heritage sites and a vibrant economic center of northern Italy, the Municipality of Vicenza is also very vulnerable to floods, due to the presence of the Bacchiglione River and its many tributaries crossing the urban area. The catchment of the upper Bacchiglione River, closed at the bridge “Ponte degli Angeli” in the historical center of Vicenza, is located in the north of the Veneto Region, a plain fringed by the Alpine barrier.
With regard to the precipitation climatology, the southern part of this plain is drier, whereas heavy rainfall is observed closer to the pre-alpine area. This difference is mainly related to the mountain barrier and its interaction with southerly warm and humid flows coming from the Mediterranean Sea. A significant portion of the annual rainfall often concentrates into very short periods, in the form of what turns out to be an extreme event, with deep convection playing a central role. As a consequence, severe flooding events have threatened agricultural and urban areas in the recent past in the highly populated and urbanized area of the upper Veneto plain. Vicenza was lastly affected by such a flood on October 31 and November 1, 2010. The flood was triggered by extreme rainfall and snowmelt in the upper Bacchiglione basin. The cost of damages for the Municipality of Vicenza was 62 million euros. At the same time, three human lives were lost while 3,500 people had to evacuate their homes (Veneto Region, L. grande alluvione, 2011).
As climate change becomes a reality, such flood events will become more frequent. To address the problem of flooding, local authorities are called to take effective measures for flood risk management, including prevention, protection, preparedness, and emergency response. Even though all aspects of flood risk management are crucial, in this work the focus will be on flood protection measures.
3.2. The flood protection measure under consideration
To protect the city of Vicenza from future floods, a variety of flood reduction measures are indicated in the Flood Risk Management Plan (FRMP) redacted by the District Basin Authority of the Eastern Alps (AAWA) according to the FD. In this work, a specific structural flood reduction measure has been selected: a Retarding Basin for the Bacchiglione River, which has been recently completed. The selected measure contributes to the protection of the city against floods caused by flooding of the Bacchiglione River and its tributaries and it is located in the Municipality of Caldogno, upstream to Vicenza.
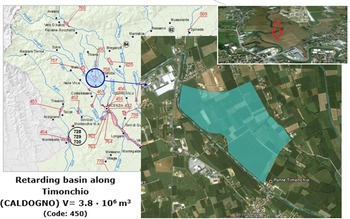
Such a measure was necessary because of the previous insufficiency of the hydraulic network in case of flow rates associated with events with high and medium probability of occurrence. For that reason, the Hydraulic and Geological Risk mitigation action plan estimated the need of no less than 9 million cubic meters detention basins to guarantee safe hydraulic conditions. As part of the active defense solutions, the recent implementation of the retention basin of Caldogno (Figure 2) is of strategic importance for the reduction of the hydraulic hazard in Vicenza territories.
Location of the Caldogno Retarding Basin in Veneto, Italy.
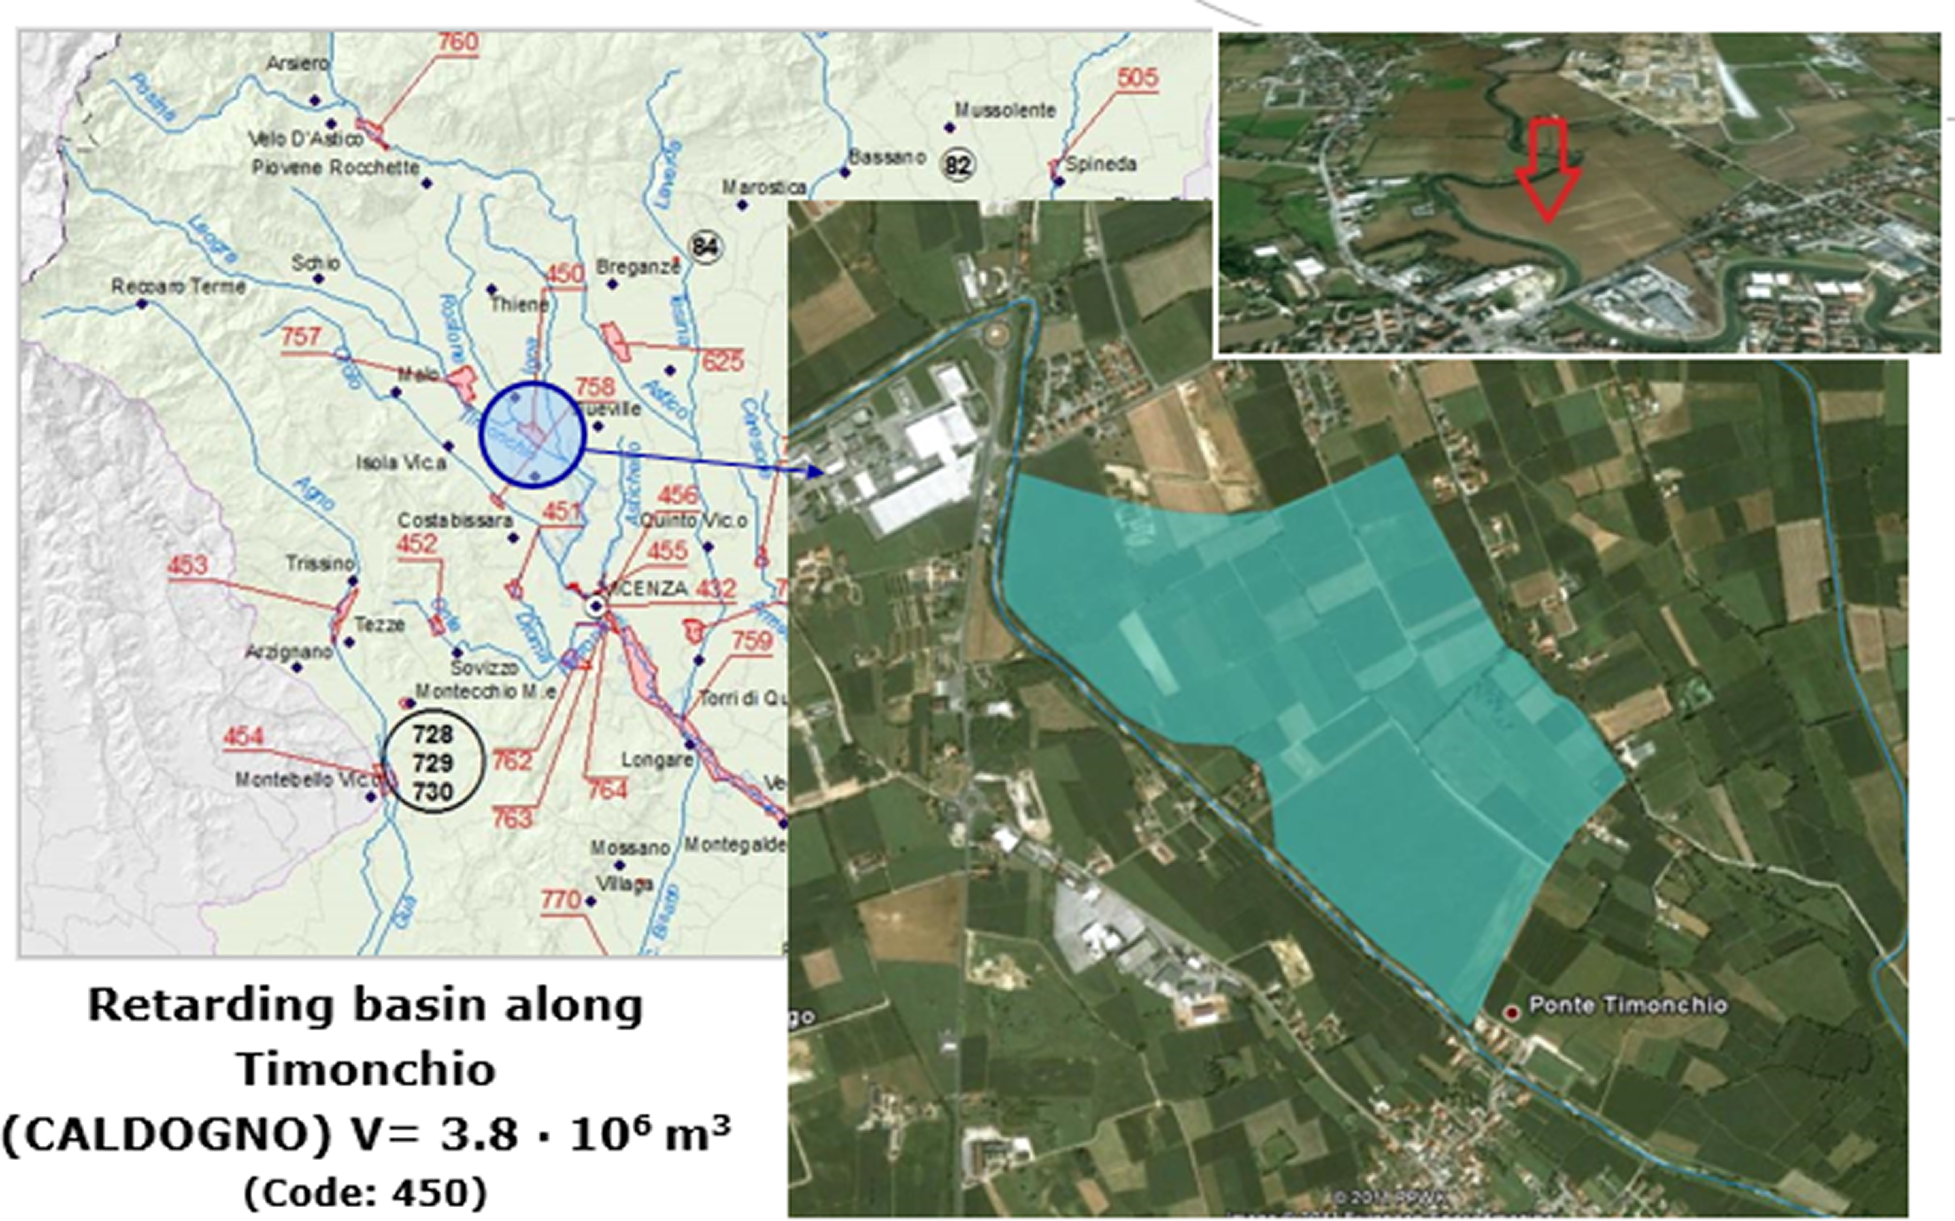
A retarding (also called detention basin) is a large, open, free draining basin that temporarily “detains” the water flow in case of flood. This basin is designed to be located in a particular river segment that is well known to be critical in case of flood and where river breaches have occurred during past flood events. The main goal of this manufact is to delay and laminate the peak of the flood in the downstream path of the river, in particular inside the City of Vicenza. The incoming flow, which exceeds a defined threshold, will be derived into the basin through proper intake infrastructure. The basin will return gradually the stored water volumes to the river after the peak of the flood (CUTLER, 2020b).
3.3. DSS functionalities
To make informed decisions about the policy measure discussed in the previous paragraphs, the policy makers require a DSS to support them during the various phases of the policy cycle; from planning and assessing the potential impact and expected benefits of the Caldogno Basin to monitoring and evaluating its effectiveness in real-life. For the identification of the necessary DSS functionalities, policy makers and data experts collaborated to (a) co-create a business process model that efficiently models the policy cycle and provides the policy-maker with the functionalities and data visualizations necessary for making their decision, and (b) determine the data requirements. In the following, the term “Policy maker” refers to technical staff of public administrations involved in flood risk management from a hydraulic and hydrologic point of view; in our case, these were three people from the staff of the District Basin Authority of the Eastern Alps (AAWA). Any administrative or bureaucratic aspects related to the selected measure are outside the scope of this article.
This co-creation process included several steps: first, several workshops and interviews were conducted to create an accurate BPMN 2.0 model (Eisner, Reference Eisner2018) of the actual decision-making process in the administration. This model depicted every necessary administrative task the administration has to perform to make its decision about the policy measure. Second, the functionalities and data visualizations needed for each administrative task to support the decision-making have been elicited. For that, the policy makers wrote simple one-sentence user stories of what they want the system to do, for example, “I want to examine maps of past floods overlaid with socioeconomic layers to see which commercial or social activities may be affected the most.” One user story can be interpreted as the wish of a specific user for a specific feature or functionality. Each user story was then discussed among the relevant stakeholders to ensure a mutual understanding of the needed functionality from a user’s perspective and to clarify how it should and can be implemented technically. This resulted in a collection of better-defined user stories, which served as a first set of end-user requirements. These stories were then grouped into story maps, which create a visual overview by clustering similar features, bringing features in a logical sequence and matching subfeatures to their parent features, where possible. The story maps were further discussed with data experts in the context of dedicated workshops, aiming to further define a set of functional requirements that would feed analytics development and dashboard design. Where expedient, the dashboard design was supported by the creation of wireframes, which are preliminary sketches of the potential dashboard (CUTLER, 2018, 2019).
This exercise resulted in the following basic set of functionalities for the different phases of the policy cycle: as a first step, the policy makers should be able to assess the current conditions of flood risk as well as the meteorological, hydrological and hydraulic conditions of the area under examination. The system should subsequently help the user analyze the flood protection measure itself as well as its expected impact in terms of flood risk reduction. Then, after the implementation (i.e., construction) of the basin, the policy maker should be able to monitor the actual impact of the measure and assess its benefits for the city of Vicenza. Finally, after the monitoring period ends, the system should help the decision-maker to sum up the evaluation results and verify whether they are in line with the expected results or, if this is not the case, whether policy revisions are required. In each step of this process, the policy makers should be presented with all the necessary environmental, economic, and social data analytics and KPIs that will help them make informed decisions.
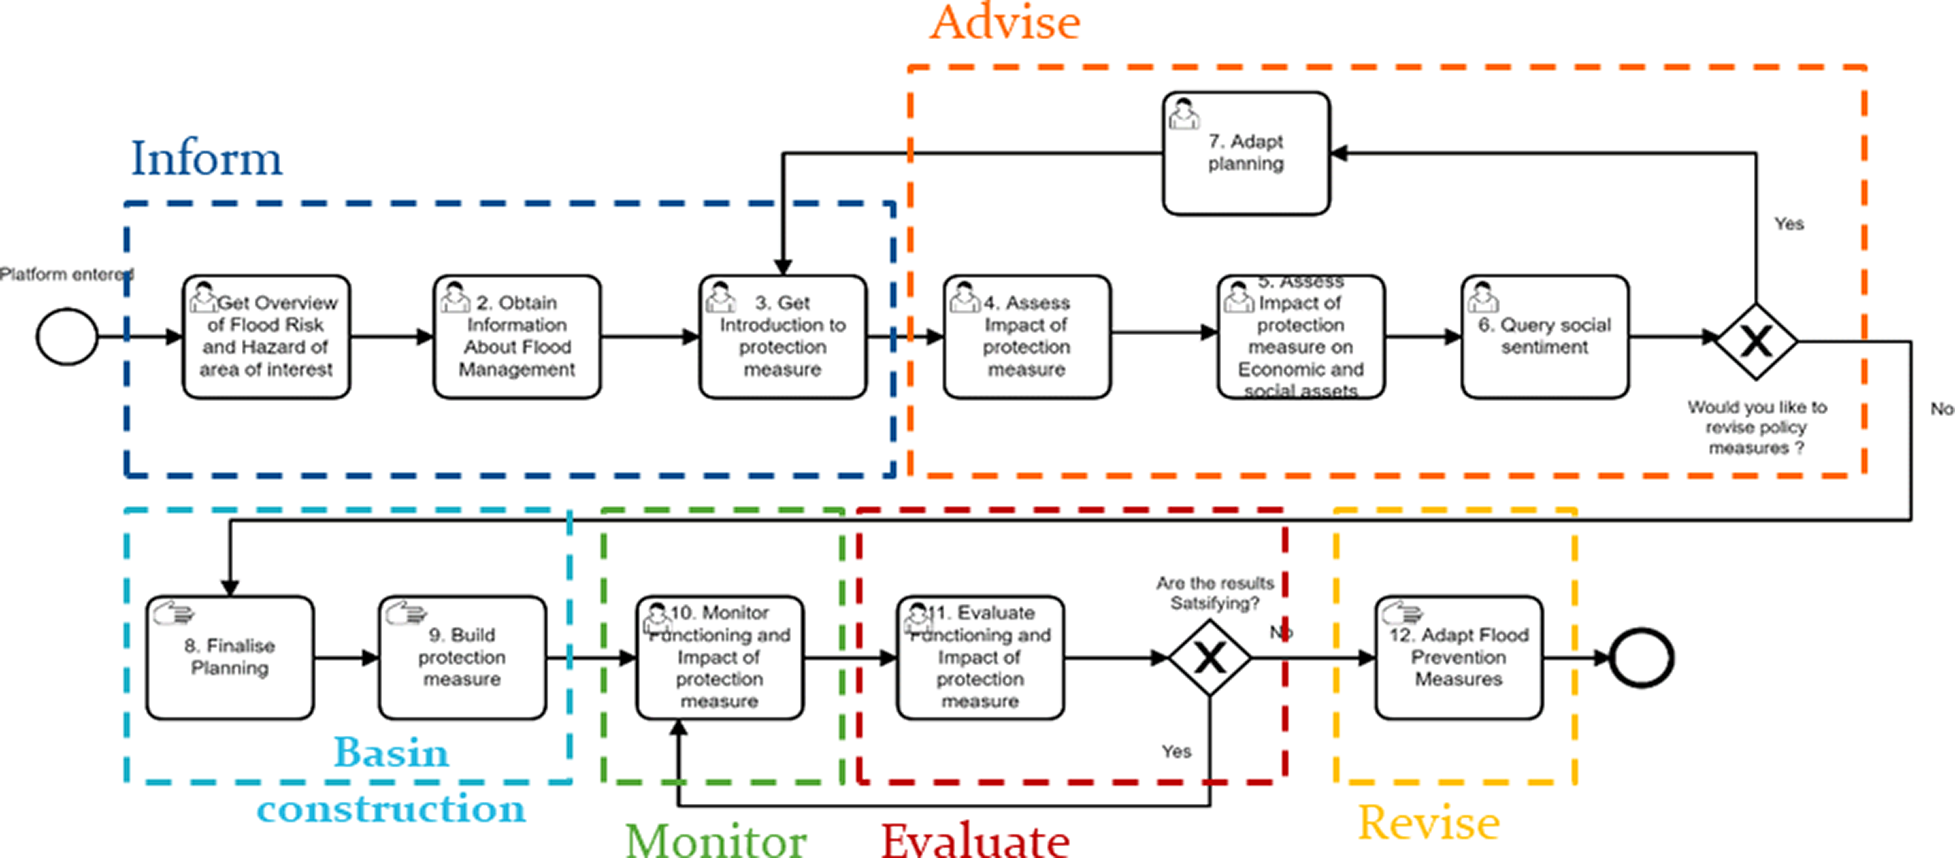
The business process model that resulted from this process can be seen in Figure 3. Each step of this business process is called a “Task” and each Task has been assigned to a specific phase of the IAMER methodology. At the same time, the data necessary or available for each process task were identified as part of the co-creation process. The execution of these tasks is not consecutive; there are gateways (rhomboid boxes in Figure 3) where the policy-maker is asked a question related to the process and depending on the answer s/he is directed to the appropriate task and continues the process (CUTLER, 2020h).
Business process model modeling the decision-making process concerning a flood protection policy.
3.4. General overview of the data used
It is clear from the business process model presented in Figure 3 that several data sources (sensor data, GIS data, flood simulation data, social media data, etc.) need to be collected and visualized to provide the necessary information to the policy maker in each step of the decision-making process. In the following, we briefly present the data used by the proposed DSS for the flood reduction policy in the city of Vicenza.
• Measurements from a hydro-meteorological monitoring network: It is essential to have real-time measurements from both meteorological and hydro-meteorological stations. Such a monitoring network is established in the Veneto region of Italy and includes more than 130 sensors. The meteorological stations measure rainfall, temperature, air humidity, air pressure, while hydro-meteorological stations measure water level and water flow in specific sections of the area’s river network (CUTLER, 2020b). This information allows reviewing past flood events and identifying high-risk areas. For selected hydro-meteorological stations located in strategic locations in the area under examination there are also three official flood alert thresholds for the water level measurements that provide relevant flood warnings.
• Flood simulation data: The simulation data may include flood risk and hazard maps (in GIS format) for different flood return time scenarios. In this case, three different flood scenarios have been calculated: for a high frequency (30 years return time), medium frequency (100 years return time) and low frequency (300 years return time). This data can model the status of the area of interest before and after the implementation of the measure and it is used to calculate several KPIs. Some of these reflect the impact of the measure in terms of flooded area by comparing pre and post implementation states for different return times while the rest show the impact of floods on the social and economic activities in the city of Vicenza, again pre and post measure implementation (CUTLER, 2020b). Additionally, a flood simulation model can be used to estimate the time series of water level and water velocity measurements in the different sections of a river, based on input meteorological variables. In this work, we use a flood model developed by AAWA, which is the combination of a hydrological and a hydraulic model (Mazzoleni et al., Reference Mazzoleni, Verlaan, Alfonso, Monego, Norbiato, Ferri and Solomatine2017) using techniques proposed by Tarboton and Luce (Reference Tarboton and Luce1996), Kitanidis (Reference Kitanidis1997), as well as Rinaldo et al. (Reference Rinaldo, Botter, Bertuzzo, Uccelli, Settin and Marani2006). This data can be compared with reference thresholds and indicate some upcoming flood incident.
• GIS data (environmental and socioeconomic): Several GIS layers are used to demonstrate the current state of the area and help identify the infrastructure and activities that have been or will be possibly affected by flooding. The GIS data include historical data from past floods, the locations of the hydro-meteorological stations, the locations of the river sections used in the flood simulation model, river networks, roads, railways, public buildings, economic activities, schools, houses, cultural heritage sites, protected areas, zones of high environmental relevance, district demographics, and so forth.
• Social media data: Local authorities and policy makers make their decisions considering the interest of the people in the area they are responsible for. Therefore, data from popular social media platforms can be collected to assess the opinion of the public that is active in such platforms. In this case, we use posts collected from Twitter and TripAdvisor. For Twitter, the search API (Twitter Search API, 2021) was used to collect tweets associated with custom queries based on specific keywords or hashtags relevant to flooding and rivers, in both Italian and English (e.g., “flood,” “alluvione a Vicenza,” “sotto acqua”). The TripAdvisor reviews were selected by focusing on touristic points of interest in Vicenza that were affected by past floods. Sentiment analysis techniques (Hutto and Gilbert, Reference Hutto and Gilbert2015) are used to capture the sentiment of Tweets and TripAdvisor reviews in English, which is the most well studied language in this field. Additionally, raw post data are also available in Italian. More details on the social media data used in this case but also on the use of other available data sources of citizens’ opinions can be found at (CUTLER, 2020d).
4. The Integrated DSS
In this section, we discuss the tools used for data collection, indexing and visualization, we describe the dashboards developed to support the decision-making process, and we present the integrated frontend interface of the proposed DSS.
4.1. Technologies for data collection, indexing, and visualization
For the implementation of the suggested framework, several technological solutions have been utilized to address the needs of data collection, data storage, data analysis, and finally data visualization. The data were collected from two different types of data sources. Static data (such as GIS data) was provided once by the relevant authorities; whereas data that are periodically produced (such as sensor data or simulation results) are collected daily from the API that has been set up for this purpose, using dedicated data crawlers. A data harmonization procedure is applied to the collected raw data, aiming to align the different datasets in terms of attribute naming and structure (CUTLER, 2020e). The volume of the data is large and requires the use of a storage tool that can handle big data. For this purpose, Elasticsearch (Elasticsearch Service, 2021) has been selected, which is a distributed, open-source search and analytics engine built on Apache Lucene and developed in Java. Elasticsearch allows storing, searching and analyzing of large amounts of data in very short time and returns answers very quickly. Additionally, it allows the integration of an intuitive platform for visualization called Kibana (Kibana: Explore, Visualize, Discover Data, 2021). Kibana and Elasticsearch are integrated, which makes it an ideal option for the visualization of both static and real-time data and their presentation in dashboards.
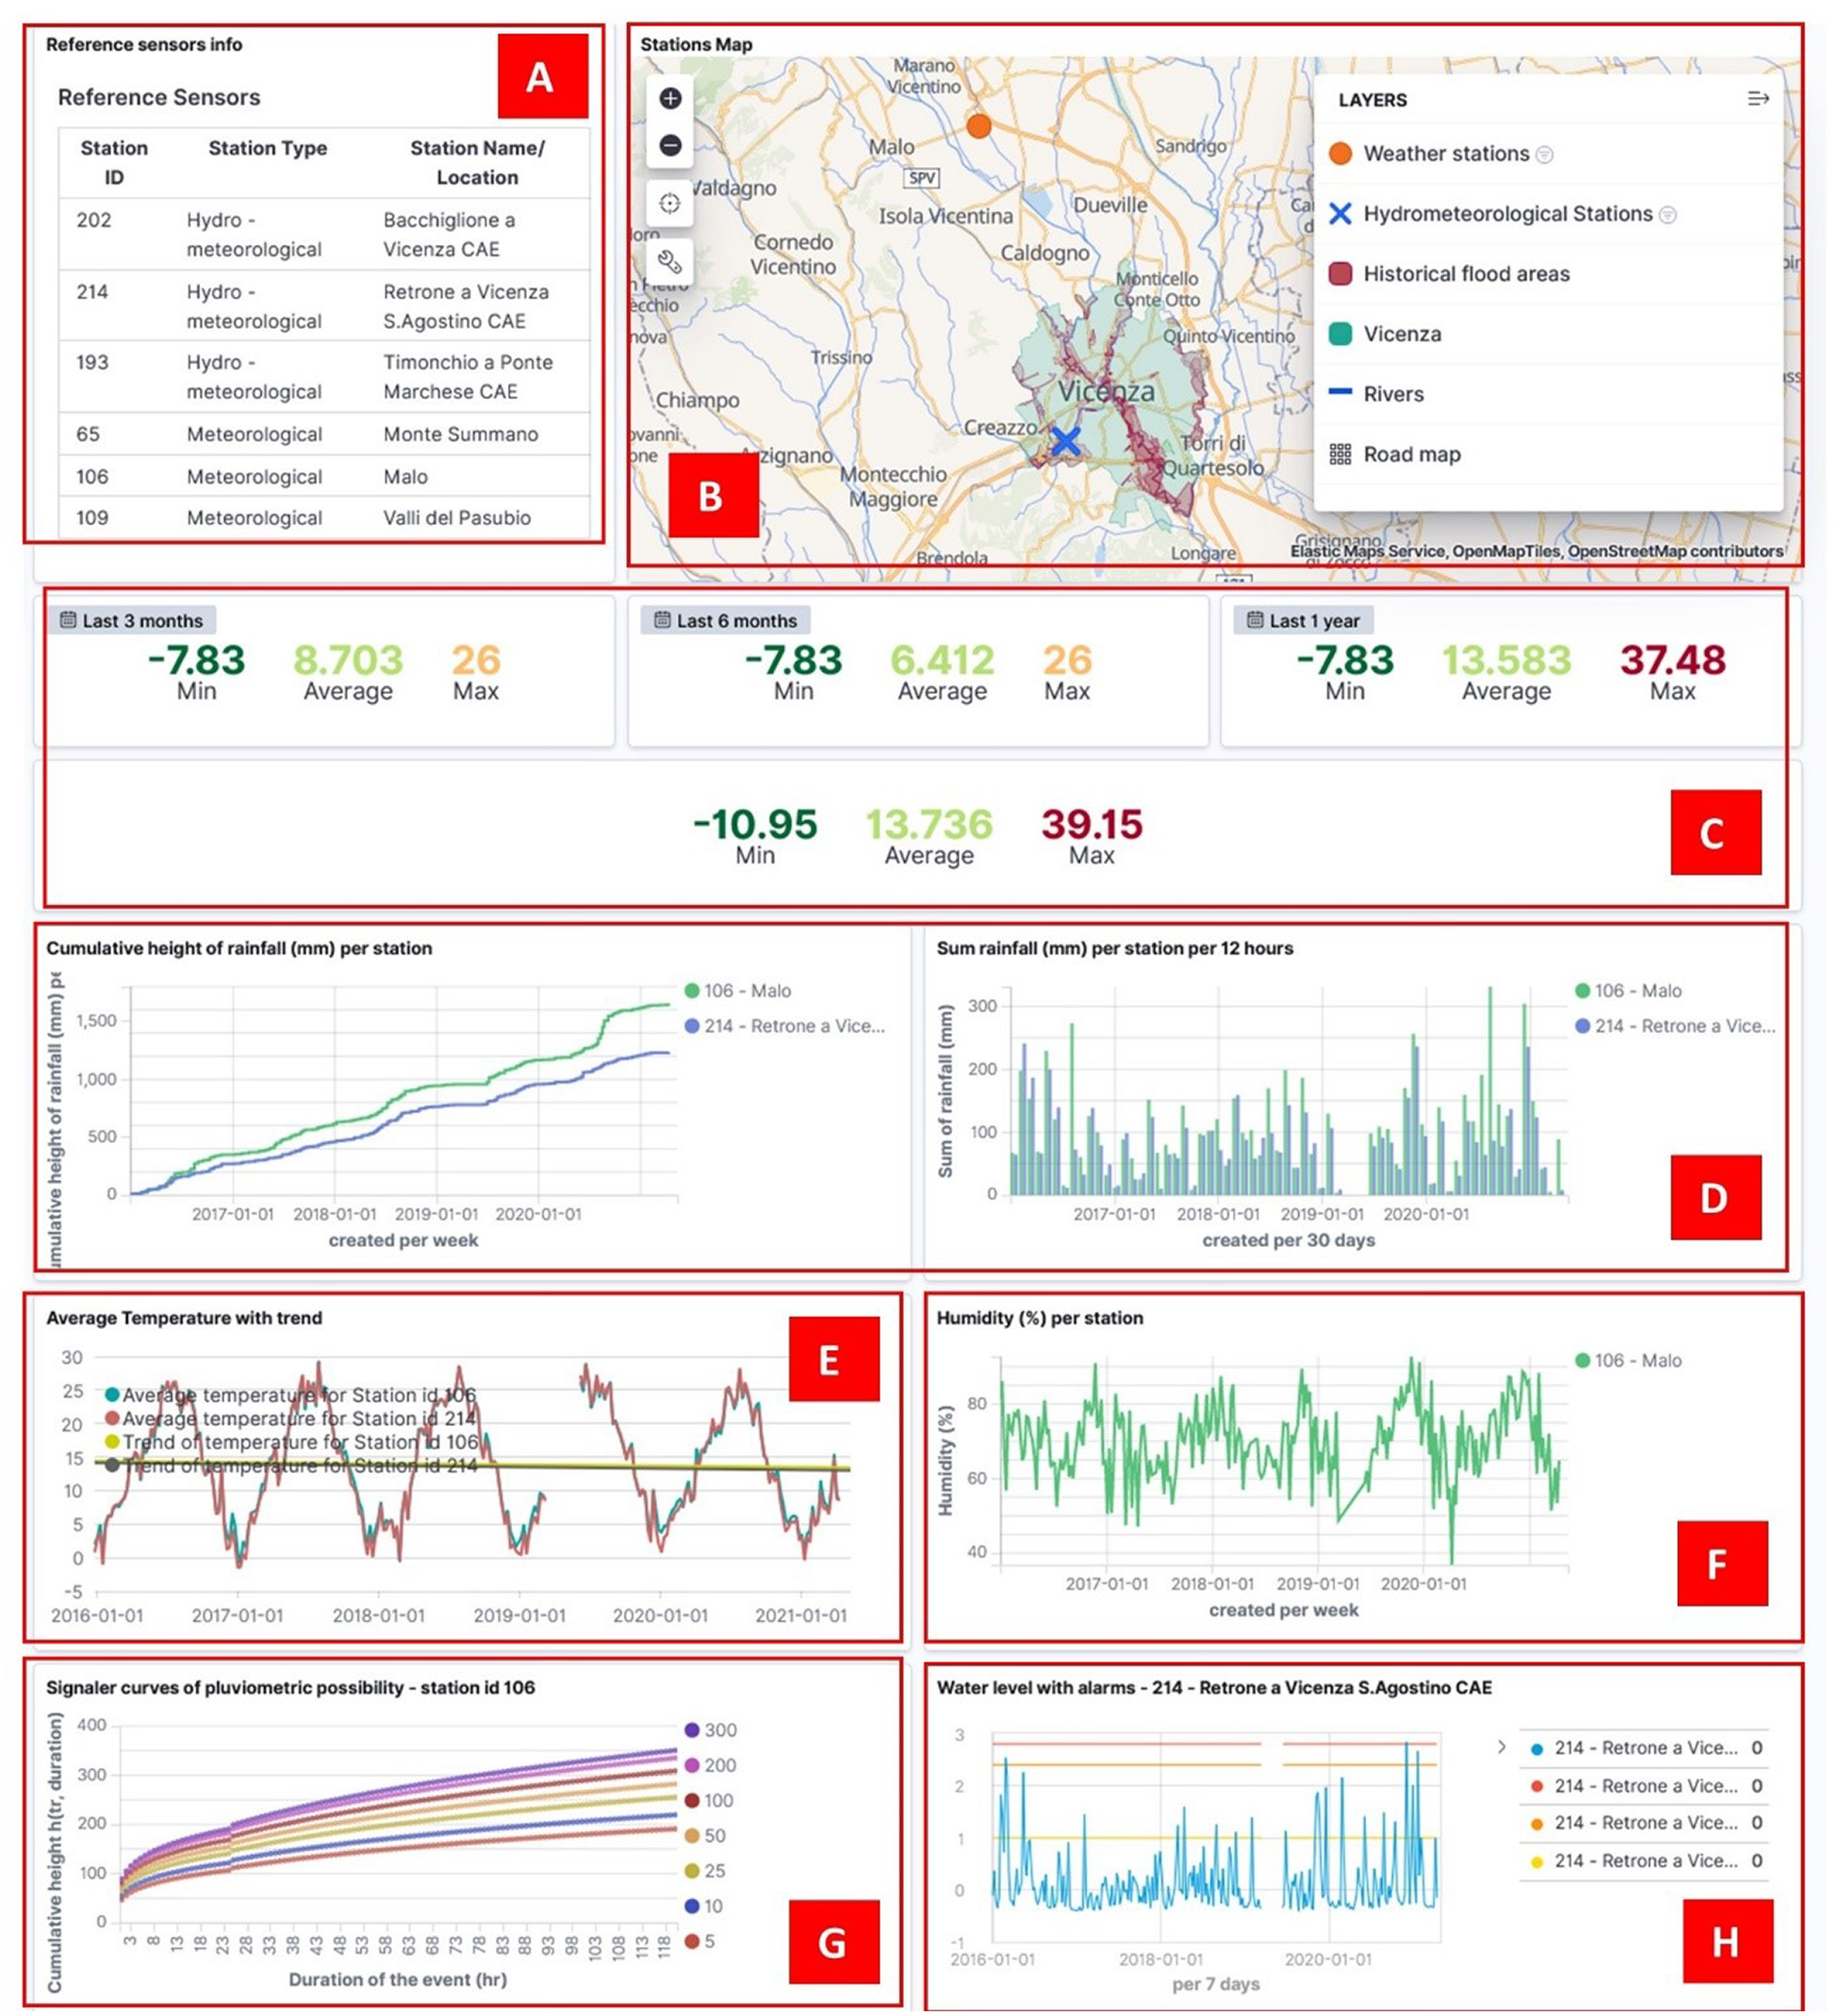
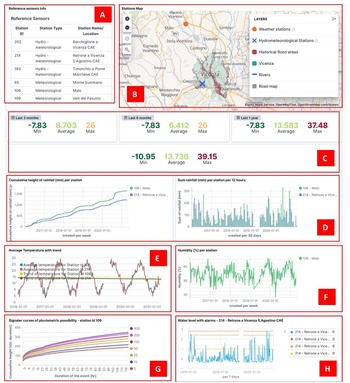
Kibana dashboards are ideal for supporting policy making for several reasons. They can include many different types of graphs, metrics, search filters and maps (time series plots, heat maps or maps with different GIS layers) in a single view, thus offering the policy maker the option to derive at-a-glance insights about the policy under consideration. Another important Kibana feature is date filtering; Kibana graphs and dashboards support a date field, which allows the user to focus on the period of time that is most crucial. Finally, the policy maker can interact with the dashboard by applying filtering based on specific fields, if the user needs to focus, for example, on a specific sensor or river section. With this functionality, it becomes easier to connect information while analyzing the data and to extract the necessary evidence for the decision-making process (Figure 4).
Example of a Kibana dashboard showing meteorological sensor measurements. (a) Hydro-meteorological station information; (b) Location of the stations with additional GIS layers; (c) Minimum, average and maximum temperatures measured by the stations for specific periods of time; (d) Rainfall information—cumulative height and sum height per 12 hr; (e) Average temperature with trend; (f) Humidity (%) per week; (g) Signal curves of pluviometric possibility for 5–300 years return time; and (h) Water level measured by station 214 with alarm levels.
4.2. Dashboards to support IAMER-based decision-making
In this section, we describe the Kibana dashboards developed for the different tasks of the decision-making process shown in Figure 3. The tasks are classified under the five phases of IAMER and in each phase, different data and KPIs are presented to the policy-maker to facilitate informed, evidence-driven decisions. Some of the Kibana dashboards include subdashboards that appear as tabs.
4.2.1. Inform phase
In this phase of the policy-making process, the policy-maker is presented with environmental, economic and social data to assess the current level of flood hazard and risk in the City of Vicenza. This includes both real (historical) data as well as simulation results. The policy maker is able to review past flood events and examine the existing flood risk management plan to obtain a broader understanding of the flood management measures that can be implemented in the area. Finally, considering that this particular process focuses on the implementation of the Retarding basin of Caldogno, detailed information about this measure is also provided. In the following paragraphs, the different dashboards and subdashboards developed for this phase are presented.
Task 1: Overview of flood risk and hazard
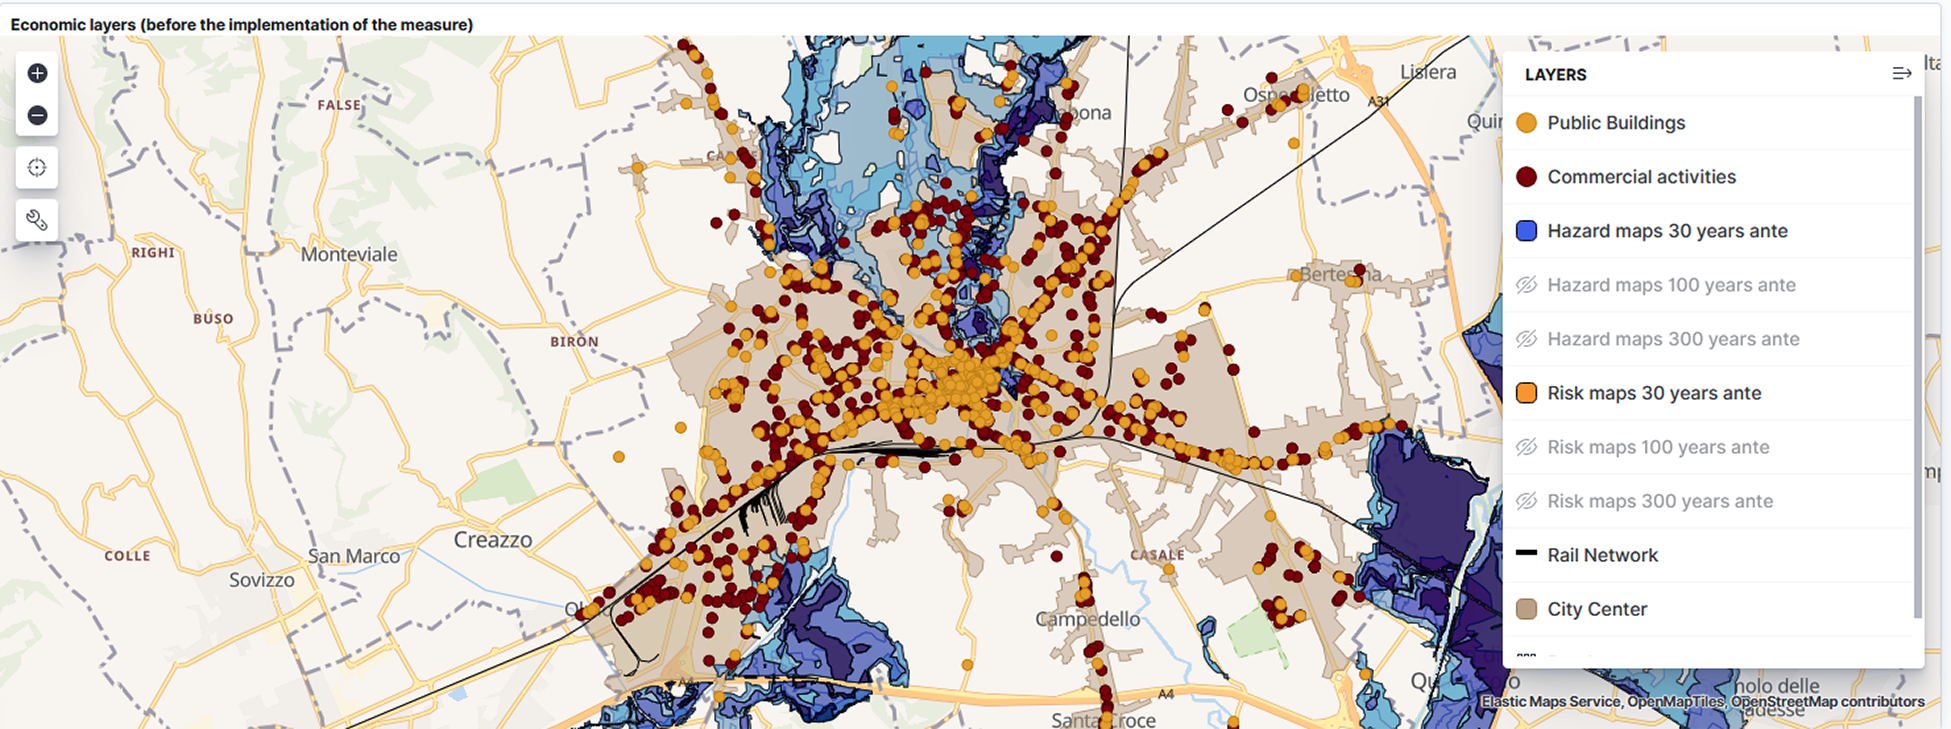
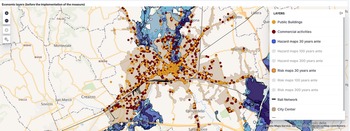
Risk and Hazard maps tab: The policy makers are able to see the pre implementation risk and hazard maps for the three flood scenarios (see Section 3.4) in map-based graphs that include several other GIS layers such as social, economic, and cultural activities as well as city demographics and a technical regional map of the area (Figure 5). These layers allow the policy maker to understand the potential damage caused by flooding on different activities and infrastructure and identify high-risk areas.
Hazard and risk maps overlayed with GIS layers presenting economic activity.
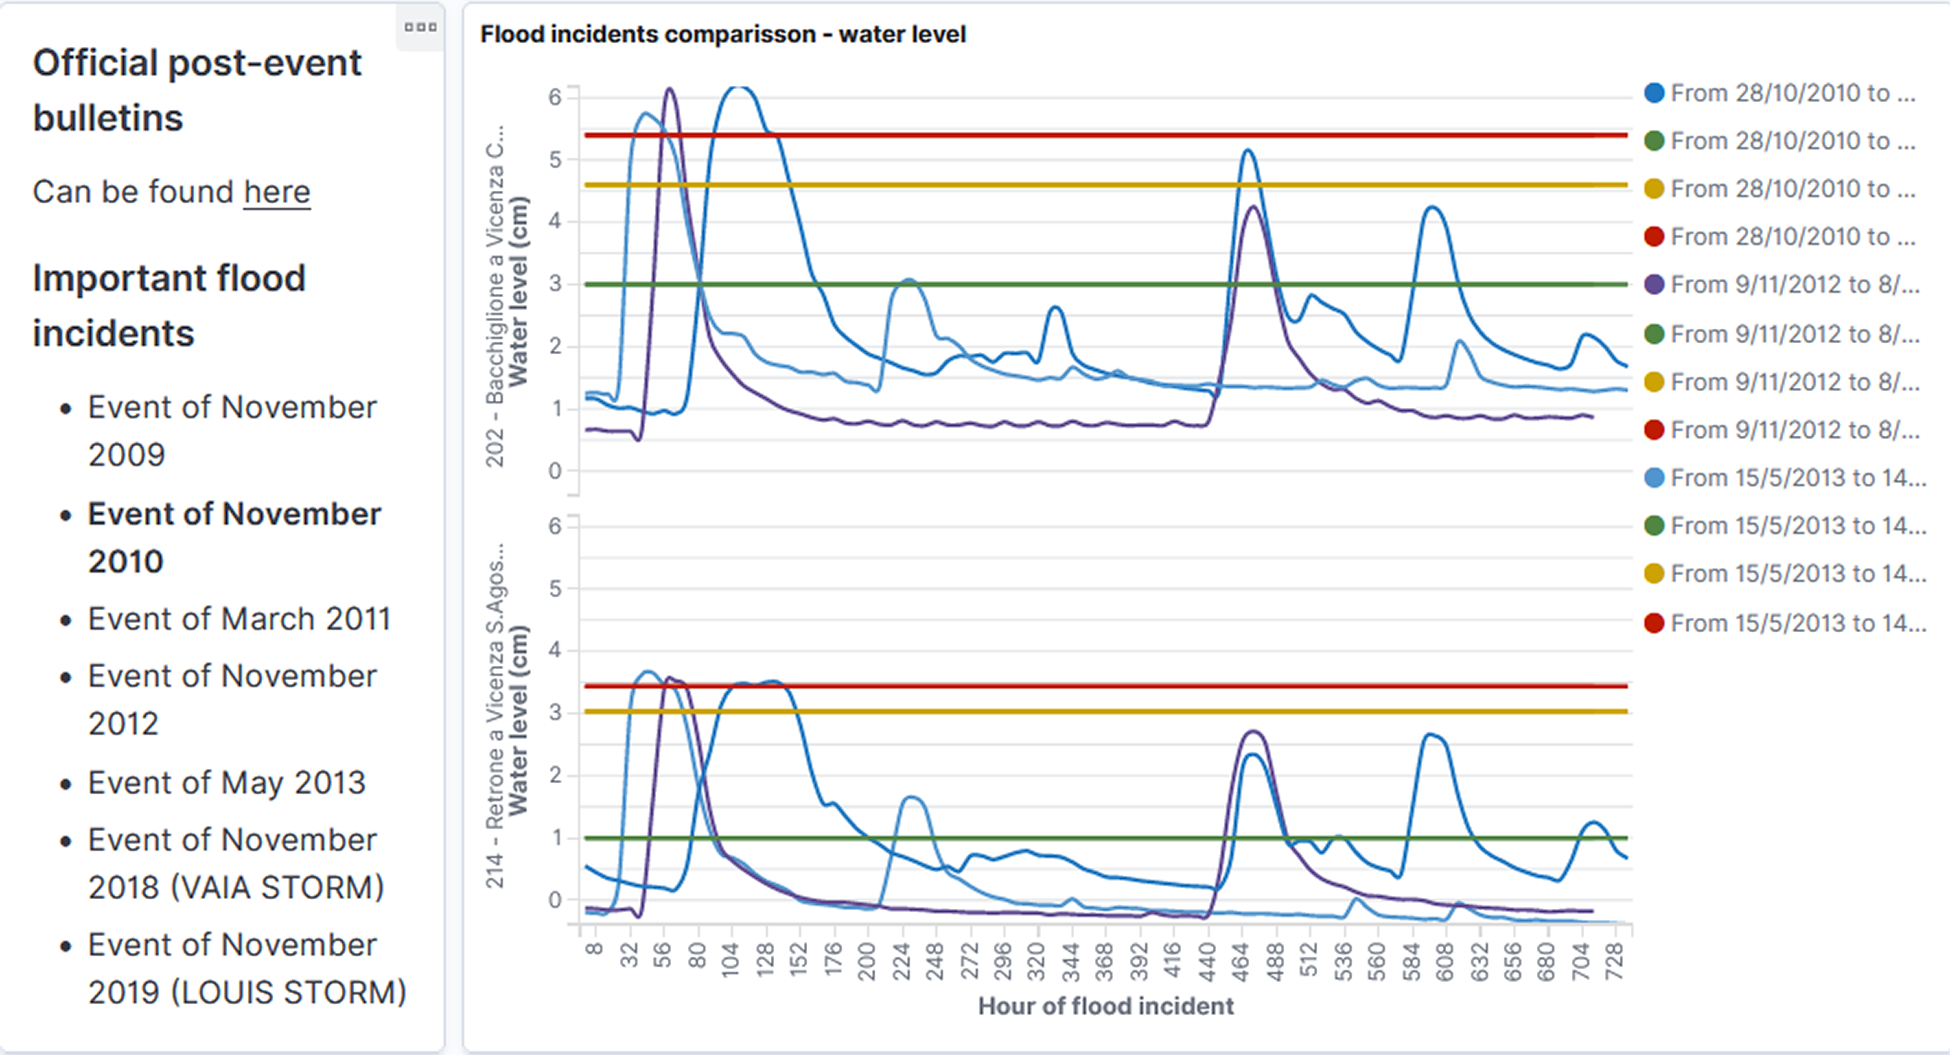
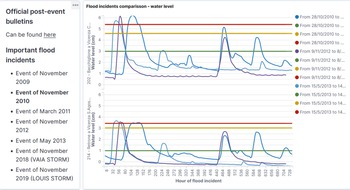
Overview of past flood events tab: The most important past flood events in the area of Vicenza have been analyzed and are compared via rainfall, water level, and water discharge timeseries. This allows the policy-maker to compare the severity of past floods and identify critical factors such as the peak value, the duration and the repetition of secondary peaks. For example, the policy maker can identify that the most severe flood event of the last decade took place in November 2010 (Figure 6).
Comparison of past flood events. Timeseries of measured water levels (in cm) and with relevant alarm thresholds. The events presented are for the years 2010, 2012, and 2013. The green, yellow, and red lines represent the first, second, and third threshold, respectively.
Measurements from a hydro-meteorological monitoring network tab (Figure 4): The hydro-meteorological data collected by the sensor network (see Section 3.4) represent some of the key variables of the hydrologic process that generates the floods. Thus, getting a historical overview of sensor measurements allows the policy maker to understand not only how ordinary hydro-meteorological conditions look like but also what are the conditions that produce flood events. Additionally, statistics of meteorological variables like temperature that are monitored over a long period of time are important for understanding the effect of climate change.
Flood simulation model results tab: Another piece of information the policy-maker needs to examine is historical flood simulation results (see Figure 12). This information is complementary to historical sensors’ measurements, which are “punctual data,” whereas flood models estimate the variation of the hydraulic variables in many additional river sections.
Task 2: Obtain information about flood management
For concrete decisions, the decision-maker should have a broad overview of the needs of the area of interest with regard to flood risk management. Some of the information necessary includes the plans that have already been established for the issue at hand, the different measures under consideration, and what are the emergency response options in case the disaster is already happening. All this information is an integral part of the FRMP, thus, the policy-maker has access to the latest version of the plan and other useful documents from regional and local authorities.
Task 3: Introduction to the flood protection measure
Similarly, for each policy that focuses on a specific flood protection measure, it is crucial to have a general understanding of the proposed measure. In this specific case, information about the Retarding Basin of Caldogno is available (see Section 3.2), including its purpose, the location, how it contributes to flood risk reduction, as well as its cost.
4.2.2. Advise phase
In this phase of the policy cycle, the policy maker focuses on the expected impact of the proposed flood protection measure, covering environmental, social and economic aspects, as well as expected results with regard to flood risk and hazard. Going through this data, the policy maker can decide whether the expected benefit from the proposed measure justifies the cost for its implementation. In other words, the policy maker will decide whether to approve the implementation of the policy, considering the technical aspects of his\her competence.
Task 4: Assess the impact of the flood protection measure related to risk and hazard
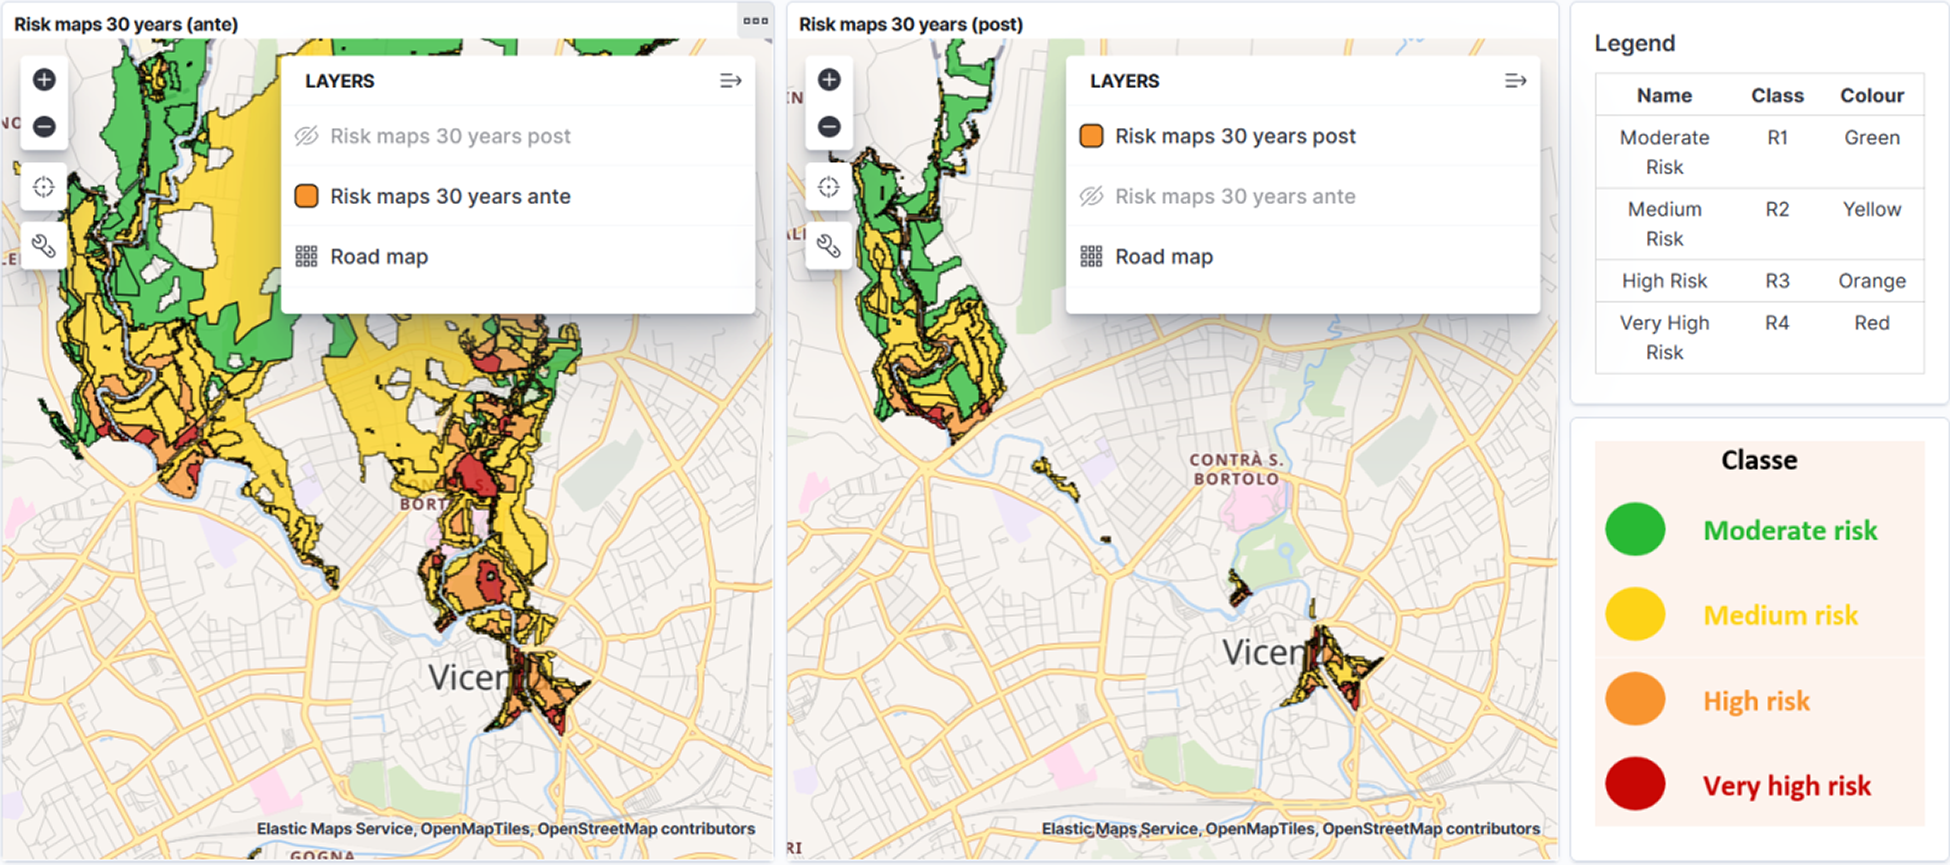
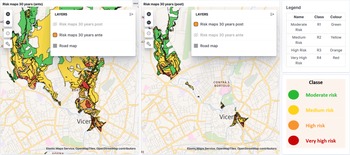
This dashboard focuses on the impact of the examined measure on flood risk and hazard. As described before, several simulations have been conducted for the state before and after the implementation of the measure (see Section 3.4). These simulations resulted to different GIS layers, pre and post implementation, for the three different flood scenarios. The policy maker is able to compare the simulation results that are visualized as layers on a map and decide if the expected impact, that is, the reduction of risk and hazard in different city areas, is satisfying (Figure 7). Additionally, some KPIs have been computed for a quantitative overview of this impact (CUTLER, 2020b): the percentage of under-risk areas in the municipality pre and post implementation; the percentage of the reduction of the risk area post implementation compared to pre implementation (Figure 8); the total risk reduction in square meters; and the distribution of the risk classes in the risk area.
Example of risk map pre and post implementation for a flood with a return time of 30 years.
Percentage of reduction of the risk area post implementation compared to pre implementation for a flood with a return time of 30 years. R1–R4 represent the Risk classes, from moderate risk to very high-risk.

Task 5: Assess the impact of the protection measure on economic and social aspects
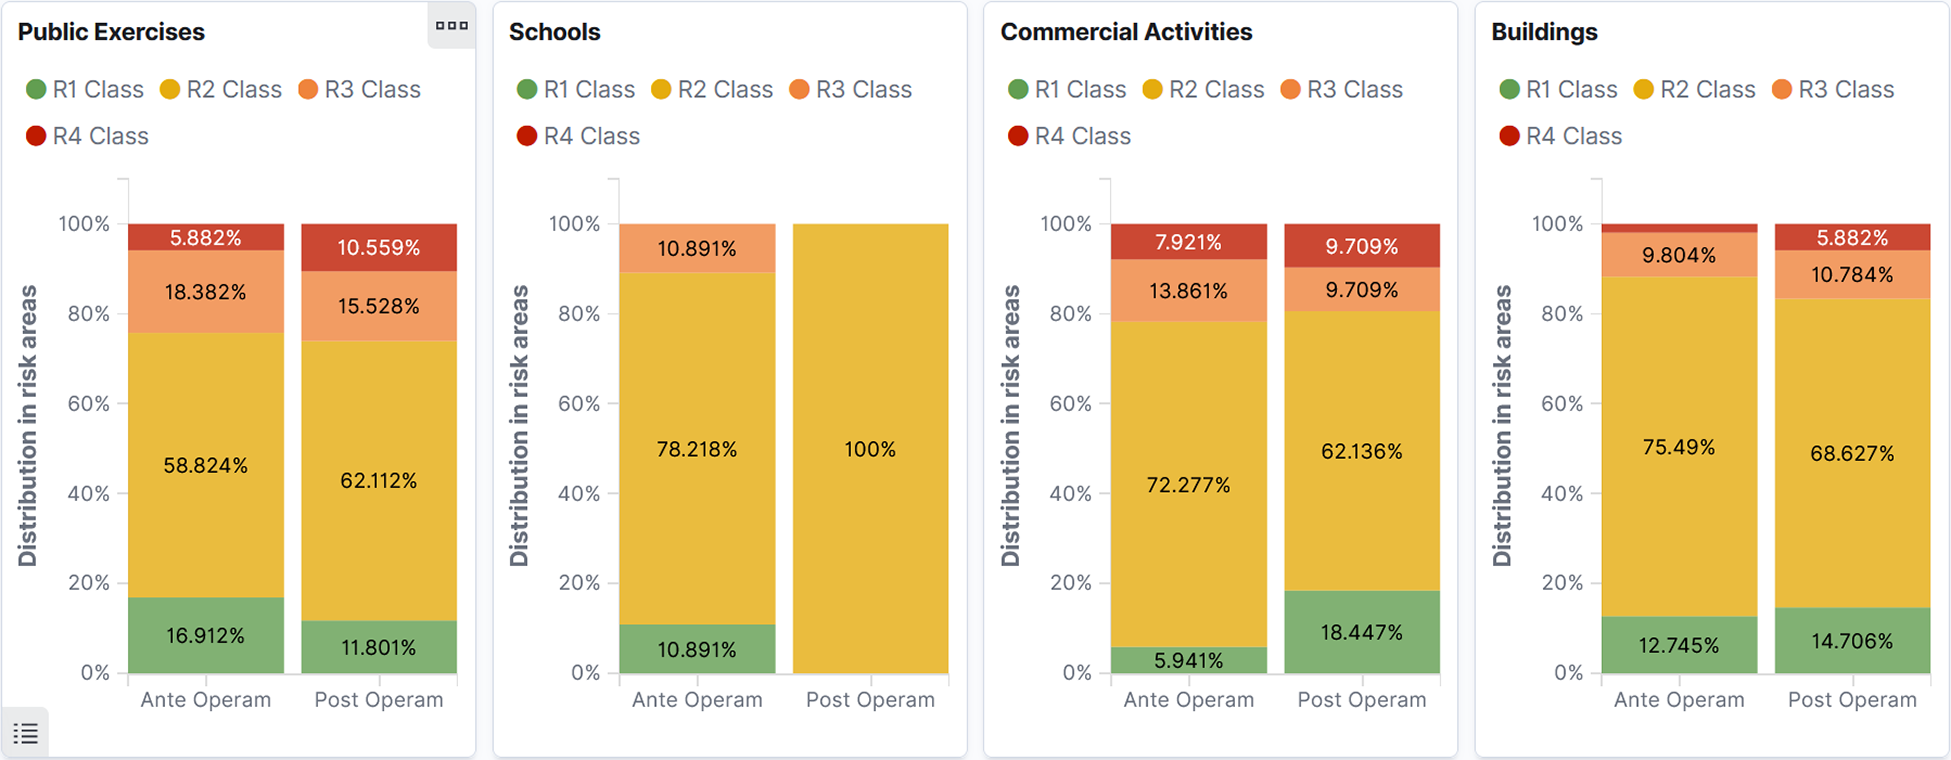
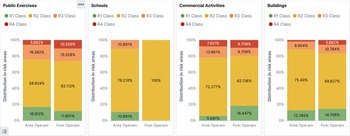
Apart from the general impact on flood risk and hazard, the impact related to specific economic and social aspects is also important. When a disaster occurs, the results usually affect the economic and social structures of the city and cause significant financial losses and in some cases loss of lives. Therefore, it is important for the policy maker to identify whether the proposed measure will reduce the damages caused by potential floods. The information presented in this step includes the same risk and hazard maps as before (pre and post implementation, for all three scenarios) as well as additional GIS layers. Risk maps quantify the negative consequences of the flood on three categories, people—economic activities—environment, where the risk for “people” is given a considerable higher weight. The additional GIS layers present important economic and social structures in the city of Vicenza such as schools, public buildings, public or commercial activities as well as demographic layers (e.g., number of inhabitants per neighborhood). Examination of these layers allows the policy maker to understand whether the impact on these structures is significant. Some KPIs have also been developed for a quantitative assessment of this impact (CUTLER, 2020b): the number of structures (e.g., restaurants and hotels) in the risk areas pre and post implementation (an example of structures are the public exercises, Figure 9); the distribution of risk areas correlated to the economic and social structures (Figure 10); and the reduction of the total structures at each risk class post implementation compared to pre implementation. More complex calculations are currently examined for future updates of the DSS, including the development of an econometric model to estimate the economic impact of flood damages on different aspects of the local economy (commerce, tourism, construction, etc.) but also on socioeconomic indices like GDP or poverty rate.
Total number of public exercises (restaurants, hotels, etc.) affected by flood pre and post implementation with a flood return time of 30 years.

The distribution of risk areas correlated to the economic and social structures of Vicenza pre and post implementation with a flood return time of 30 years. The total surface at risk is reduced post implementation.
One aspect to consider when estimating the socioeconomic impact of policy making is the bias that may be associated with the use of big data. For example, property damage metrics are relatively easy to compute but may introduce a bias in favor of wealthy communities, which have more expensive property. To mitigate such bias it is important to consider carefully the data used and, where available, to use additional data, for example, in this case GIS layers of poverty rates or house prices per neighborhood.
Task 6: Query social sentiment
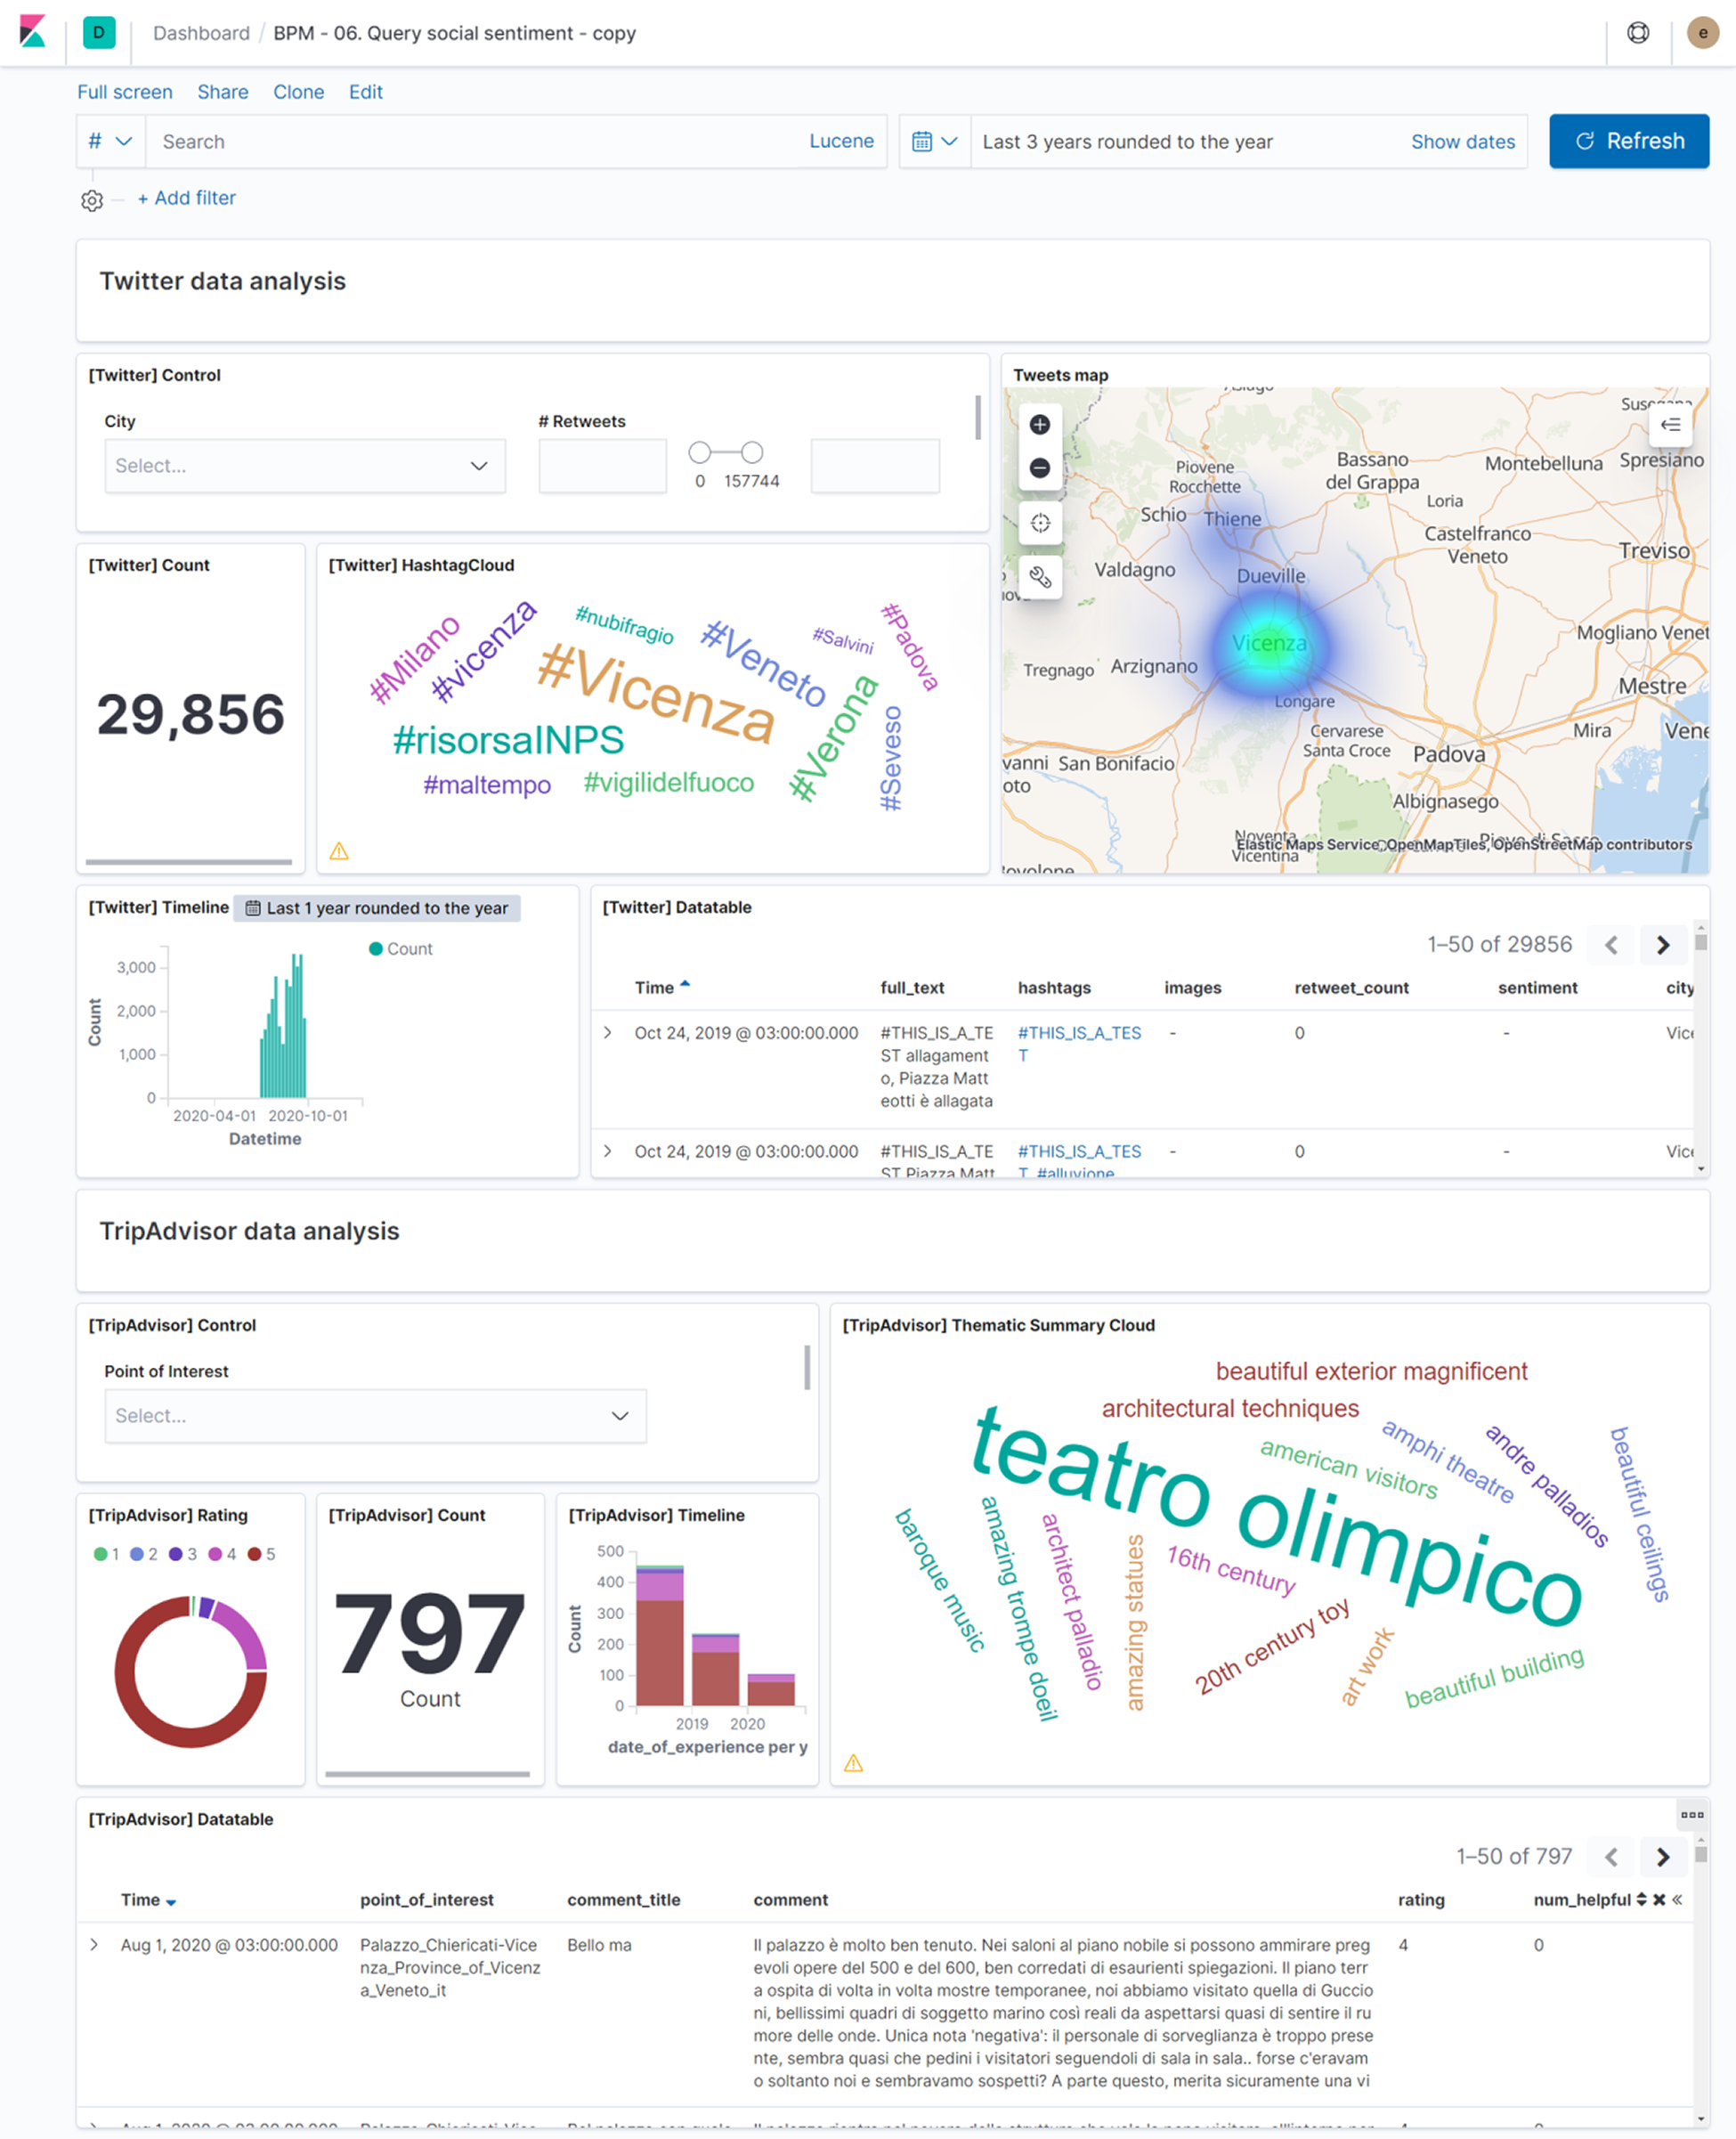
Infrastructural projects like the Retarding Basin of Caldogno are debated at length in public and citizens report their opinions through official channels (e.g., public consultations imposed by dedicated EU regulations like 2007/60/EC, 2914/52/EC, and 2001/42/EC). Even when such official channels exist, citizens could also use unofficial channels like their personal social media accounts to provide their opinion or comment about the policy issue; thus, it is advisable for decision-makers to be aware also of this type of citizen feedback. For that purpose, an analysis of Twitter and TripAdvisor posts has been performed, as described in Section 3.4, which involves topic modeling and sentiment analysis. By examining the results of this analysis and the relevant citizen posts, the decision-makers can understand how the public that is active in those platforms feels about specific policy measures (CUTLER, 2020d). Social media posts although very useful, sometimes introduce a bias with regard to public opinion, since they represent the views of relatively younger, more tech-savvy citizens (Hargittai, Reference Hargittai2015). To compensate for this, other data sources of citizen’s opinions may be also used in this task, for example, data from surveys organized by local authorities, focused on the specific policy issues (Figure 11).
Example of Kibana dashboard showing the results of social sentiment analysis on Twitter posts and TripAdvisor reviews.
4.2.3. Monitor phase
Using the dashboards presented in the two previous phases, the policy maker is able to decide if the measure has a positive impact on flood reduction in case it is implemented or if the measure needs further revisions before being implemented. If the decision is that revisions are required, then as shown in Figure 3, the policy maker should first revise the policy measure and adapt some of the planning parameters (Task 7—“Adapt planning”) and then return to execute Tasks 3 to 6 to get information about the impact of the revised measure. If, on the other hand, the decision is that the measure will indeed have a positive impact as is, then the next step is to implement the structural measure (Task 9). This usually requires several months or years. Additionally, many other steps should be accomplished before the construction starts, mainly bureaucratic and administrative, which are currently out of the scope of the proposed tool (Task 8—“Finalize planning”). After the Basin is built and is operational, a monitoring period is required to assess if the measure works as expected. The monitor phase lasts for however long the policy makers decide, which in the case of a structural flood reduction measure could be several years or decades, a time span necessary to collect a sufficiently long series of measurements, including also the occurrence of a flood event comparable in terms of the return time with the one used for the hydraulic design of the basin, to properly assess whether the measure is fulfilling its purpose or not. During this phase, the policy maker accesses information similar to what is presented in the Inform phase. The difference here is that in the Monitor phase the policy-maker is interested in monitoring the post implementation situation instead of getting an overview about the past (pre implementation).
Measurements from a hydro-meteorological monitoring network tab: The policy-maker has access to the same information as in the Inform phase (see Section 4.2.1) but in this case, the data refer to the post implementation state.
Weather forecasts tab: Floods depend heavily on weather conditions; therefore, it is important for the policy-maker to have access to the weather forecast at any time. With this information, it is possible to identify a situation where the basin could be activated.
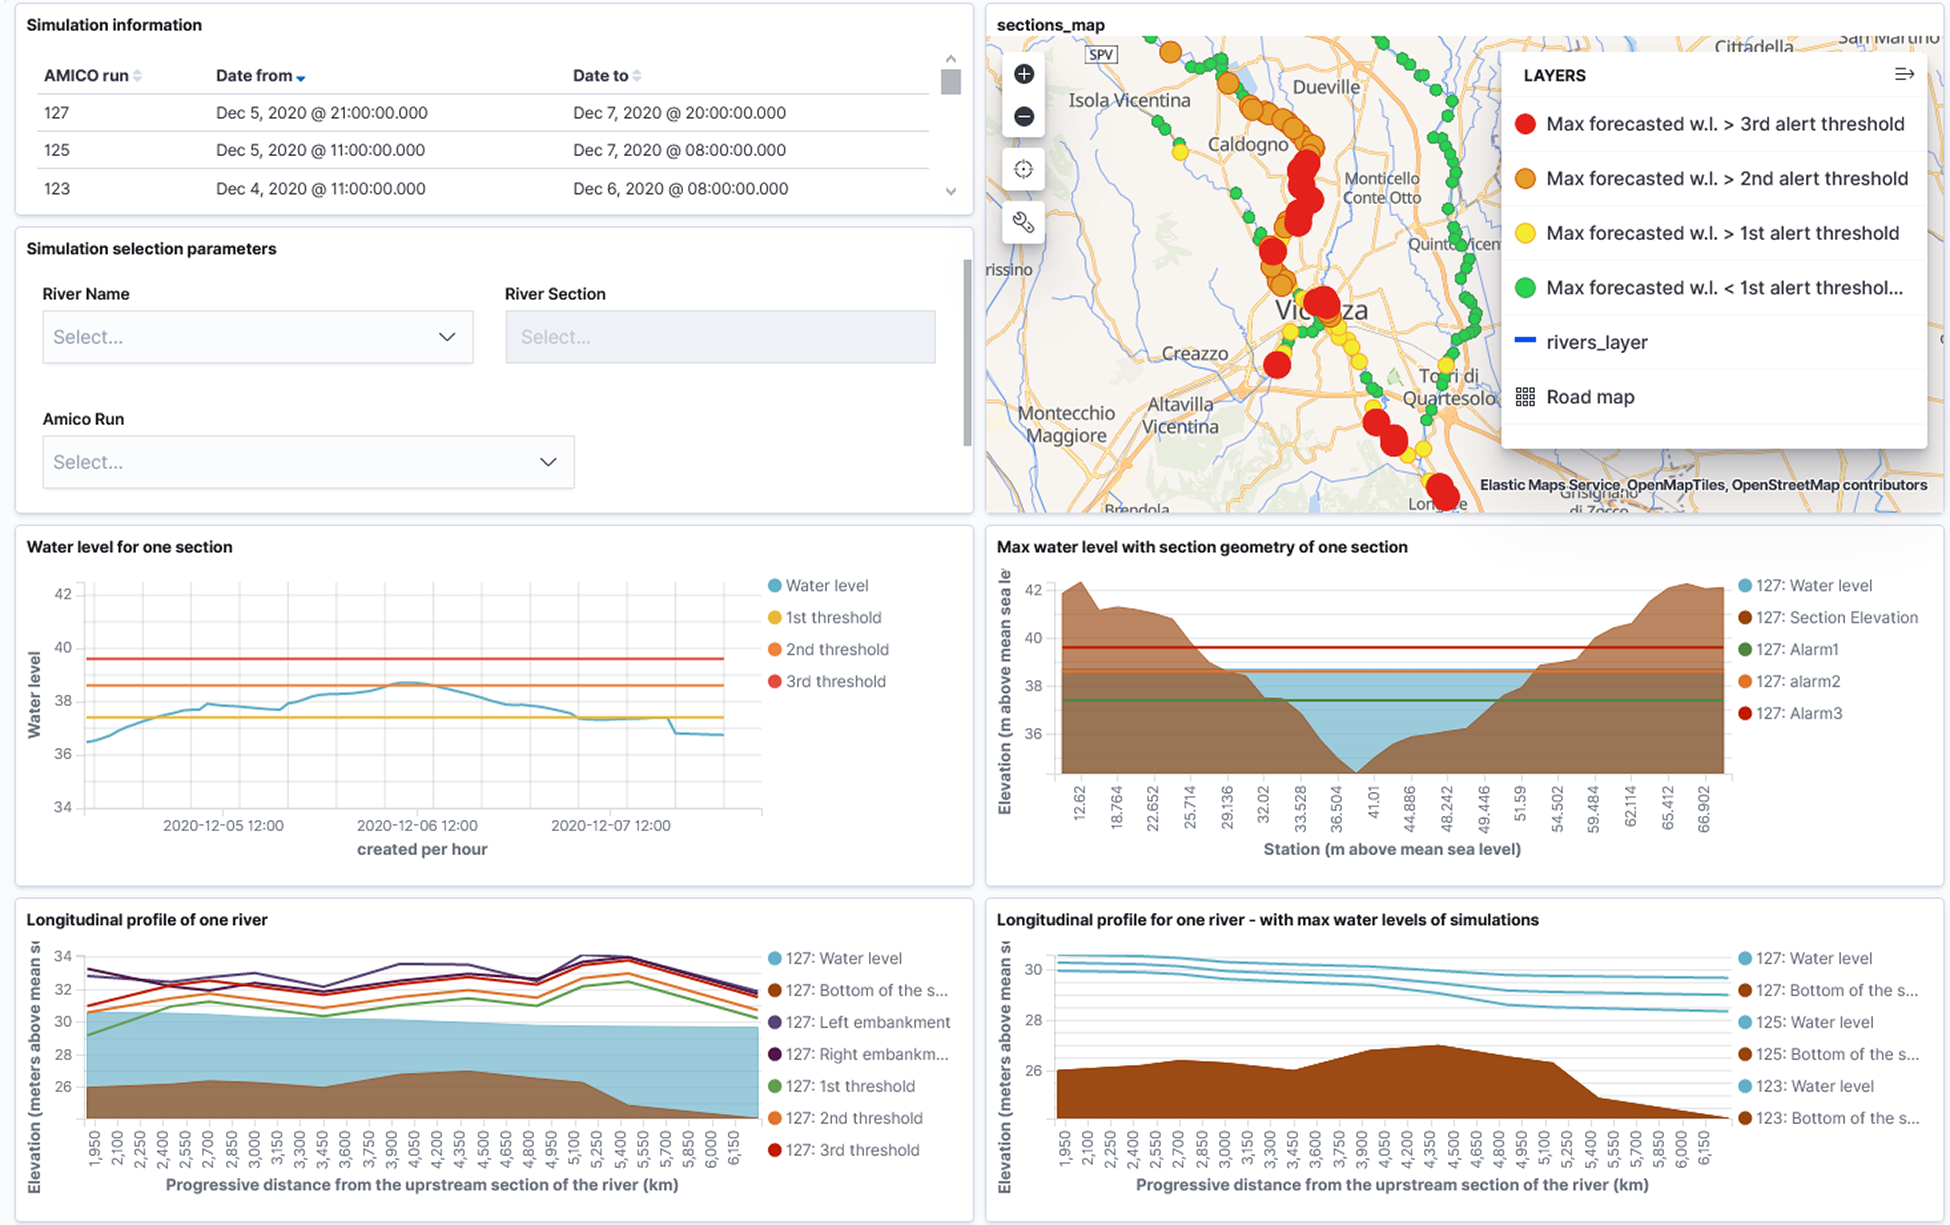
Flood simulation results tab (Figure 12): The policy maker may decide to examine the available flood simulation results, for example, water level in different river sections, for the post implementation state. This data allows her to identify areas that still face flooding issues, for example, areas where the rising water levels overtop the reference thresholds. Additionally, graphs visualizing the geometry of the different river sections as well as the longitudinal profile of the rivers in combination with the flood simulation results are available. By examining this information, the policy-maker can identify critical river segments (and areas of the city) where the river overtops and the estimated water level exceeds some of the thresholds.
Example of a Kibana dashboard showing flood simulation results.
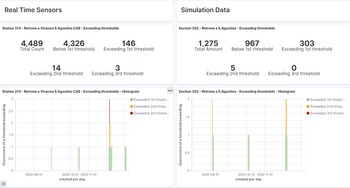
Comparison between sensor data and simulation results tab: For some hydrometrical network sensors, we can identify river sections of the flood model in approximately the same location. In these locations, the policy-maker has the option to compare the flood simulation results with the sensor measurements collected for the same period. These graphs (Figure 13), timeseries and numerical values, represent the number of thresholds that were expected to be exceeded according to the model and the number of thresholds that have been actually exceeded in the river for the selected period. Such comparisons can help assess the performance of the model in the post implementation state (e.g., how it simulates the protection measure and if further calibration is required).
Example of KPIs (top—amount of times a threshold has been exceeded, bottom—x axis is the date and y axis is the number of times a threshold was exceeded) used during the monitoring of the performance of the Basin.

Social sentiment tab: This dashboard visualizes similar information as the “Query social sentiment” dashboard of the Advise phase (Figure 11). In this case, however, the policy-maker observes the reactions of citizens and tourists with regard to flooding or the specific flood protection measure, after the measure has been implemented. By examining the results of social media analysis, policy makers can be better informed about the concerns and sentiments of the community that is active in those platforms.
4.2.4. Evaluate phase
After monitoring the operation of the basin for a long time, the policy maker is able to decide whether the information gathered is satisfying to evaluate the basin effectiveness. In this step of the policy cycle, the policy maker can obtain an accurate picture of the measure’s actual impact on the flooding risk in Vicenza. In order to evaluate the measure, a set of KPIs have been selected and calculated, mainly focused on the frequency of threshold overtopping since such incidents indicate possible flooding incidents. Some KPI examples include the total and average amount of times the thresholds were exceeded with regard to both sensor and flood simulation results.
These KPIs are related to the water level in the areas of highest interest, that is, how often the water level exceeds the thresholds and when, and they are calculated for two different periods: for a period (e.g., 5–10 years) before the implementation of the measure and for a period of equal time after the implementation of the measure. The policy maker can assess whether the protection measure has indeed had the estimated impact by observing the reduction of the frequency of threshold exceedance.
4.2.5. Revise phase
Finally, if the policy-maker is not satisfied with the evaluation results, impact and performance of the protection measure, changes can be made. By deciding to revise the measure, the policy-maker can initiate a new policy cycle, implementing the IAMER methodology from the beginning to design a new measure or improve the design of this one.
4.3. Integrated frontend interface
All of the aforementioned information and dashboards have been integrated and presented in a multifacet platform called the CUTLER platform. The CUTLER platform offers a user-friendly frontend and supports two types of users: data experts that design the dashboards and the decision-making process and policy makers that use these dashboards (via the frontend) to make informed policy decisions.
To allow easy design of the process and the dashboards, the platform frontend is integrated with two external tools: Camunda (n.d.) and Kibana. Camunda is a workflow and decision automation tool that allows the data expert to design a business process similar to the one presented in Figure 3 using BMPN 2.0 notation. Thanks to the integration between the platform frontend and the Camunda engine, the data expert is not only able to design the process model but also to assign each process task to a specific IAMER phase, provide a description of the task, and define the policy makers (individuals or groups) that are responsible for the execution of this task via the frontend. After the model is designed, the business process can be deployed through the Camunda server in the platform frontend. The model enforces that the appropriate task will be executed by the appropriate person in the appropriate order.
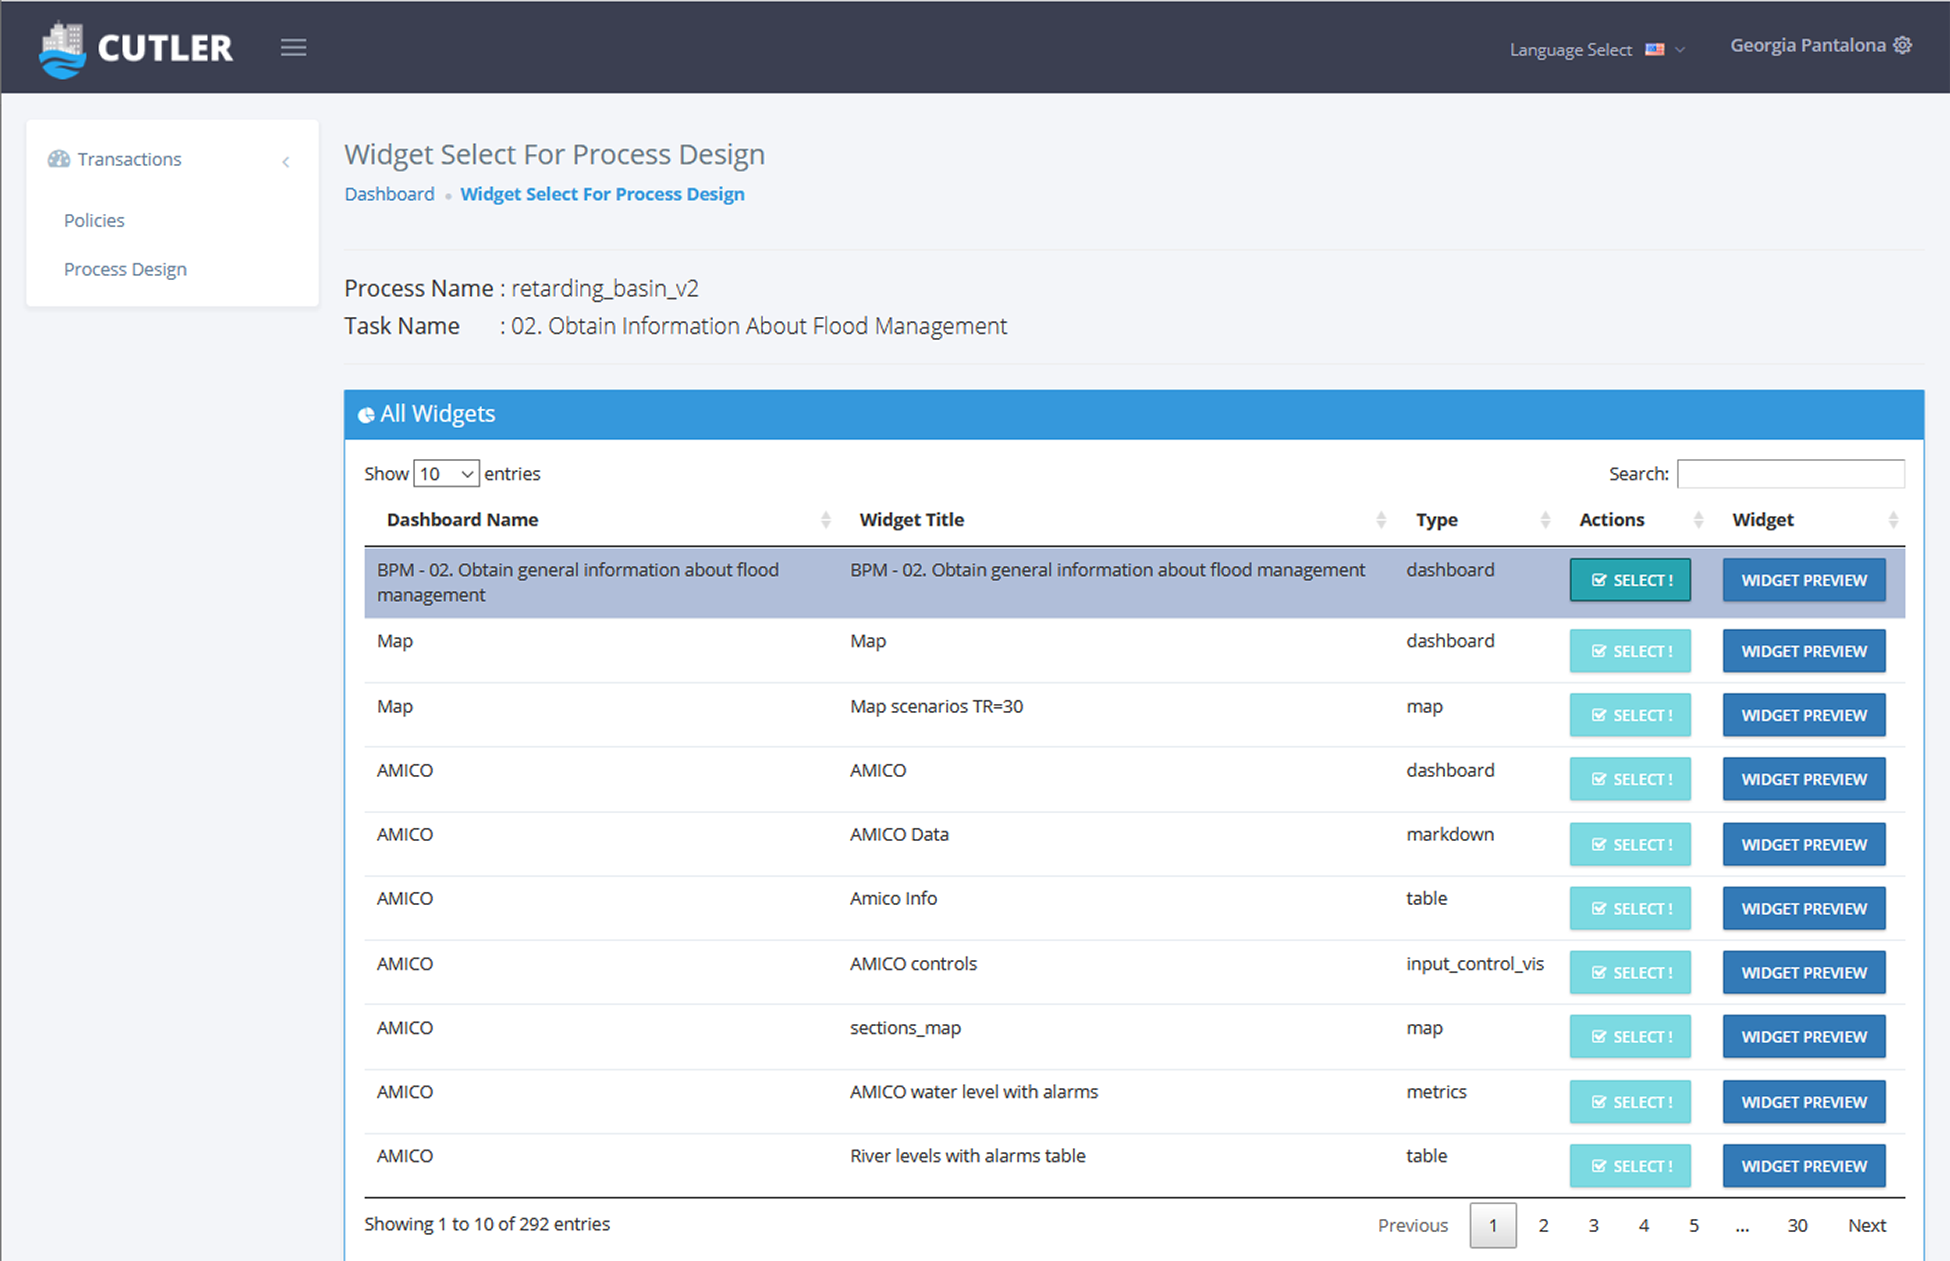
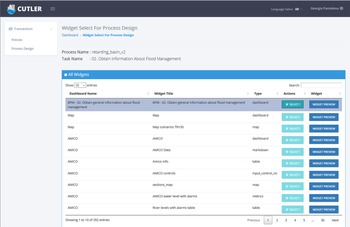
Through the frontend, the dashboards can be assigned to and connected with the relevant tasks of the deployed process (Figure 14). More specifically, by using the corresponding platform frontend wizard the data expert can easily select the appropriate visualizations from the available list of Kibana widgets and dashboards and add/assign these widgets or dashboards to the relevant task of the process.
The design page where the data expert connects a Kibana dashboard with a task of the business process.
The design of the frontend dashboards is an iterative process. Based on the functional requirements and the proposed business process model, first the data expert designs in Kibana the widgets that are necessary for the decision-making process. Then, the data expert designs the process in the Camunda modeler and deploys the process in the frontend. Afterwards, they use the frontend wizards to assign the necessary Kibana widgets to each task of the deployed process, that is, they design the frontend dashboards that correspond to each process task. These frontend dashboards are then examined by the policy makers, who may propose specific changes or even the addition of new widgets. If new widgets are required, then these are created in Kibana and are added to the frontend through the wizards. This process usually requires several iterations before finalizing the design of the process tasks in the frontend.
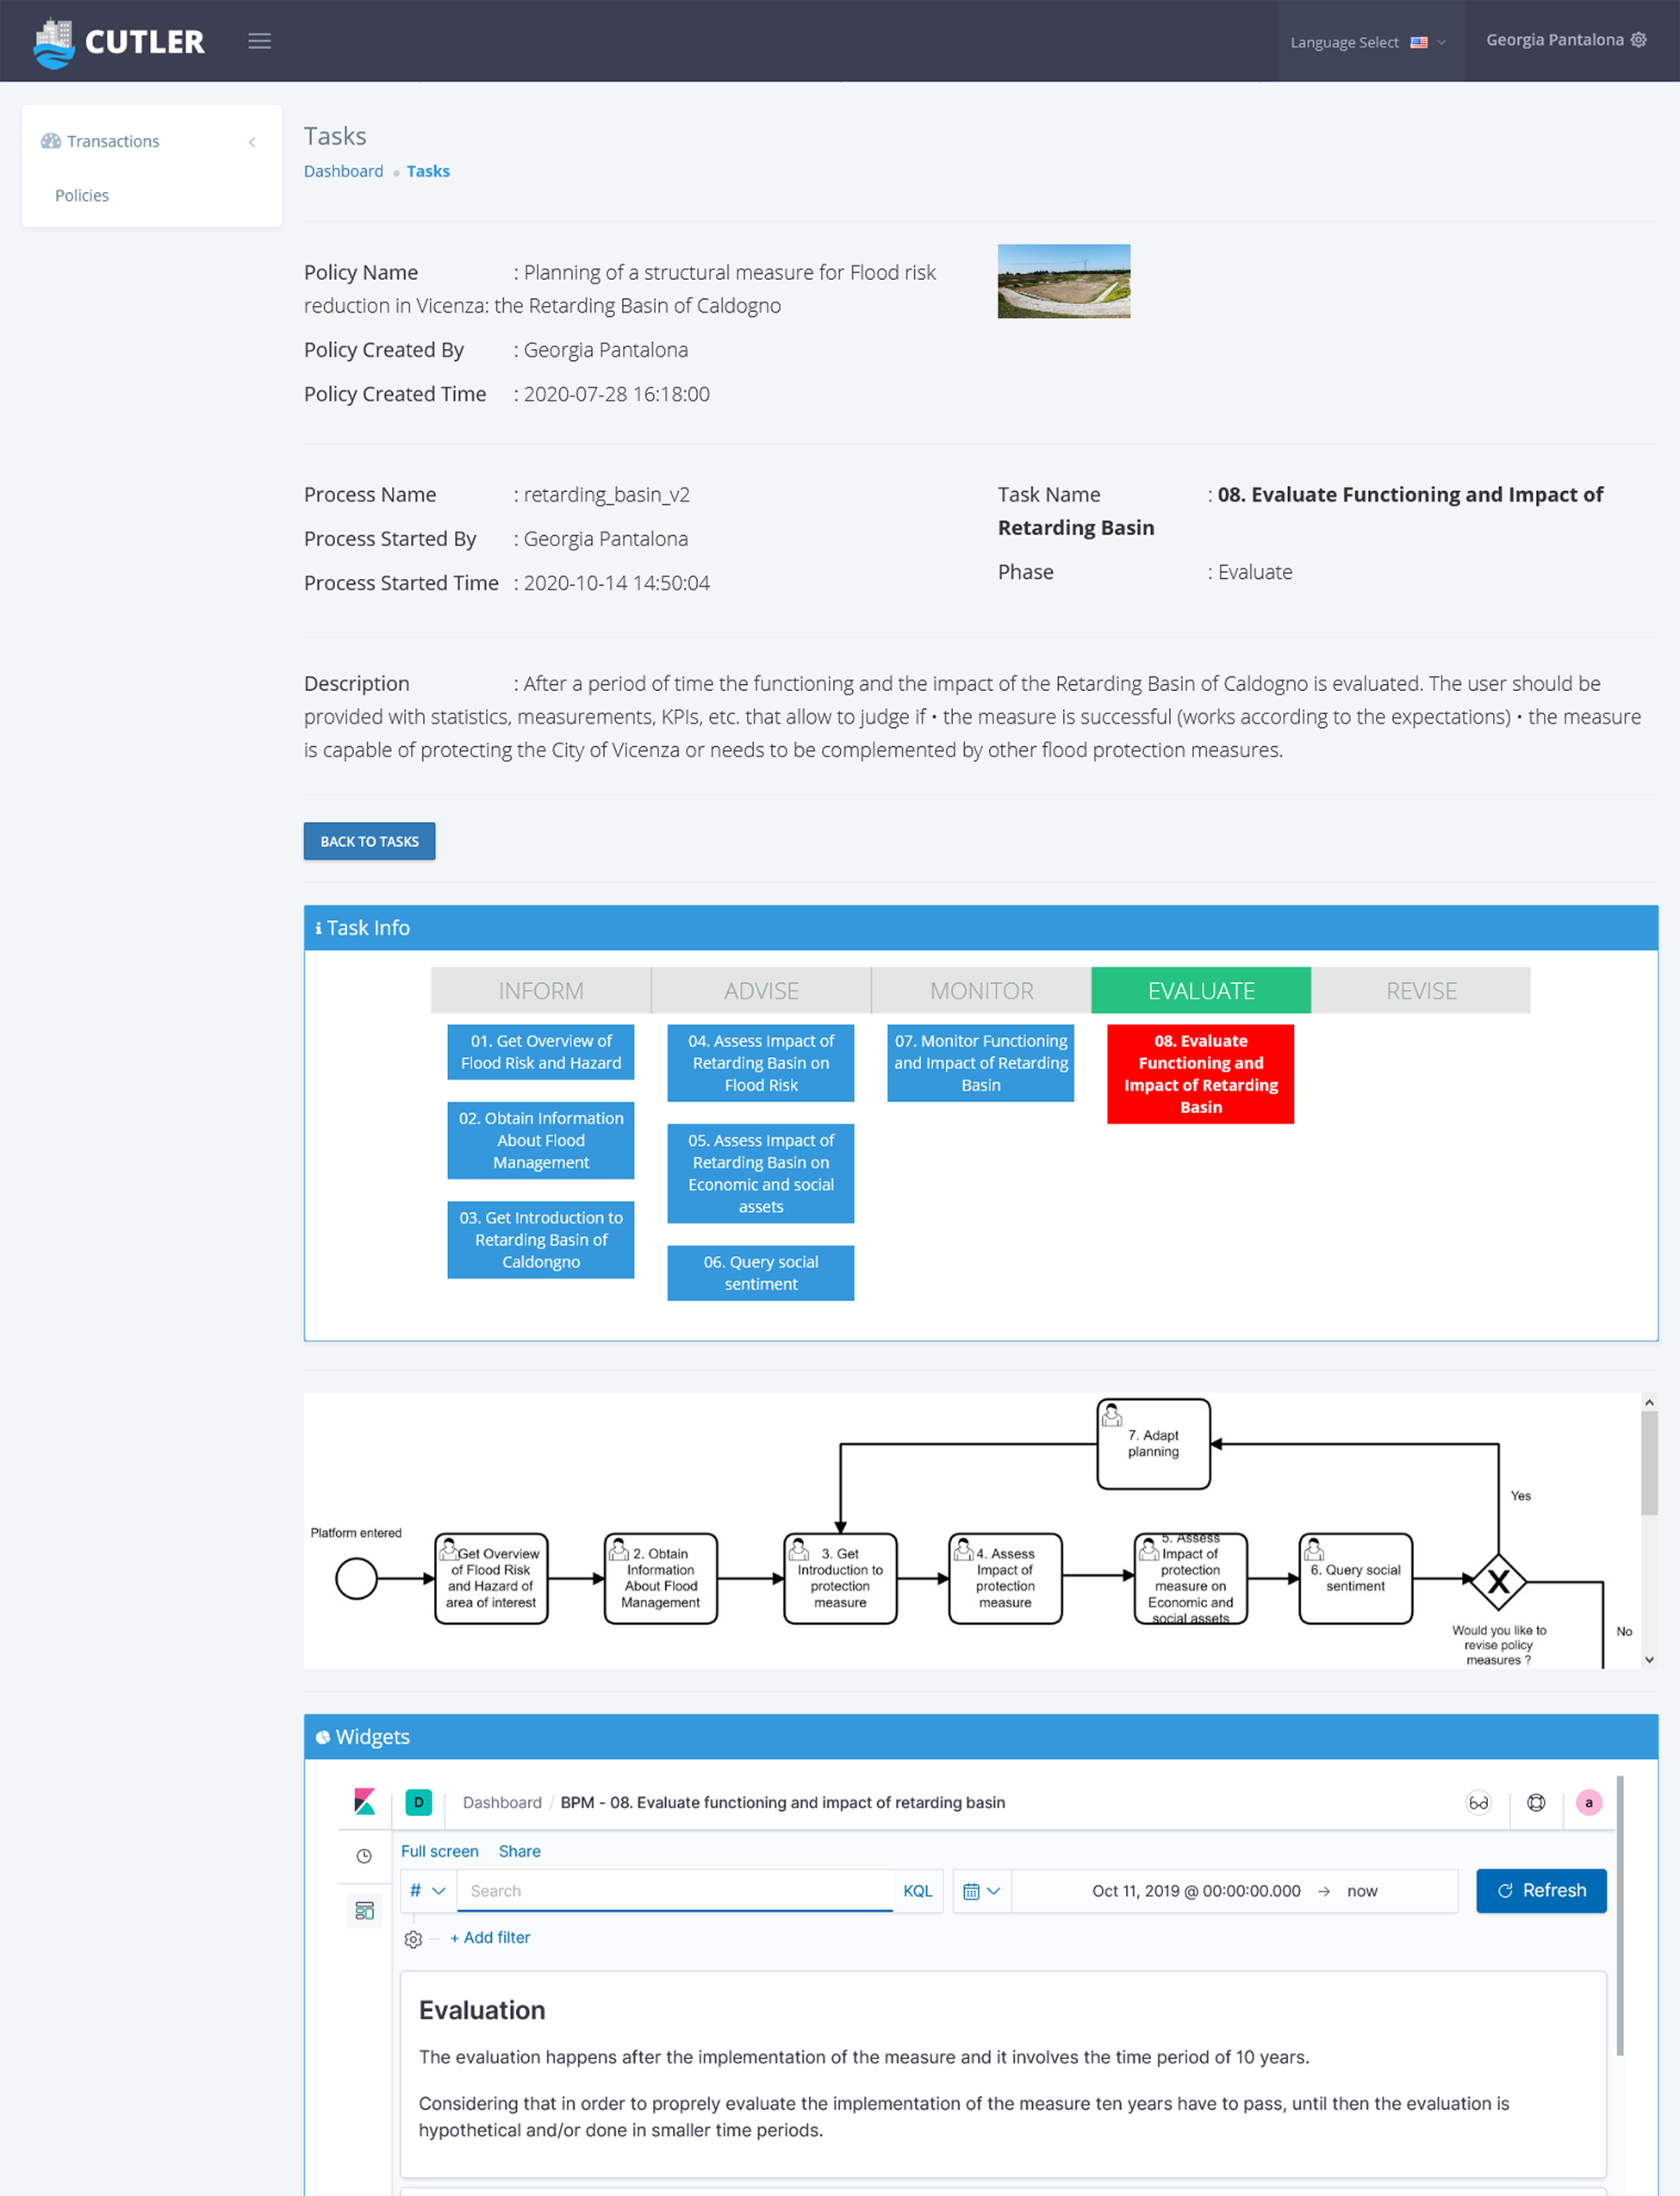
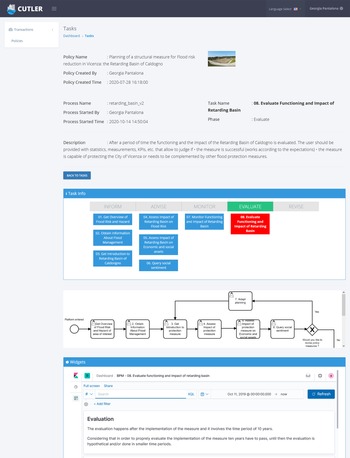
After a process has been fully designed by the data expert, policy makers can initiate instances of this process in the frontend and execute the process tasks one-by-one, guided by the underlying business process management (BPM) model. In each process task, the policy maker is able to view and interact freely with the corresponding dashboard to make informed decisions (Figure 15). After completing a task, the policy maker is guided to the next one, based on the decisions she has made (navigation through process tasks is directly guided by the BPM model). Given that many different policy makers of a local authority may be involved in different tasks of the same decision-making process, the platform enables policy makers involved in the specific process (as defined by the BPM model) to interact with each other by reporting their findings and commenting on the findings of others (CUTLER, 2020c).
The policy makers’ view in the frontend when working on a specific task.
5. Evaluation and Discussion
To evaluate the effectiveness of the platform as a DSS for flood protection policies, an evaluation study was organized. This included:
1. The recruitment of end-users; in total 15 people with a diverse background and experience in flood risk management participated in the study, most of them working in the District Basin Authority of the Eastern Alps. Three of them had also participated in the co-creation process for the definition of system requirements;
2. A training session, during which the end-users were introduced to the platform, the IAMER methodology, and the specific decision-making process. A user manual was also provided to the participants in advance, in order for them to have a document to refer to while they interact with the platform;
3. Several testing sessions, during which the users interacted with the relevant platform dashboards in each step of the IAMER policy cycle;
4. An evaluation workshop, including a questionnaire survey, discussion with participants, and interviews with selected stakeholders.
During the series of testing sessions, the participants together with the trainer went through each phase of the IAMER process and interacted with the relevant dashboards. Our aim was to simulate the process that a policy maker would follow to (a) decide whether the protection measure should be implemented, and (b) if the measure was implemented, how to monitor and evaluate it. Additionally, several statistics were gathered while the participants were interacting with the platform, including statistics about the activities of each end-user (how much time they spent in each process task, how many times they log in to the platform daily, etc.) as well as statistics for each page of the frontend and for the Kibana dashboards.
For the evaluation, a dedicated questionnaire was designed to gather user feedback, covering aspects such as usability, user-friendliness, effectiveness of visualizations, platform potential, and so forth. The users provided answers to several questions in a Likert scale of one to five. The analysis of the questionnaire results has shown that most participants found the platform useful in terms of supporting the decision-making process, since it allowed them to efficiently consider more parameters in terms of both quantity and variety. They also affirmed that the combination of different types of data (economic, environmental, and social) was particularly useful and facilitated the decision-making process (Figure 16, top).
Survey results about the proposed DSS system.

Additionally, many participants indicated that the platform was user-friendly since it was easy to operate and understand the various types of information provided as well as to interact with its features, but also noted that there is room for improvement. Whereas the visualization of the data helped them extract the information needed for decision-making, they faced some issues with Kibana’s filtering mechanism. When a filter is selected in a Kibana dashboard, all widgets of that dashboard are affected, which may not be desired in many cases. A solution could be to implement separate filters for each widget, a functionality that is however not currently supported by Kibana.
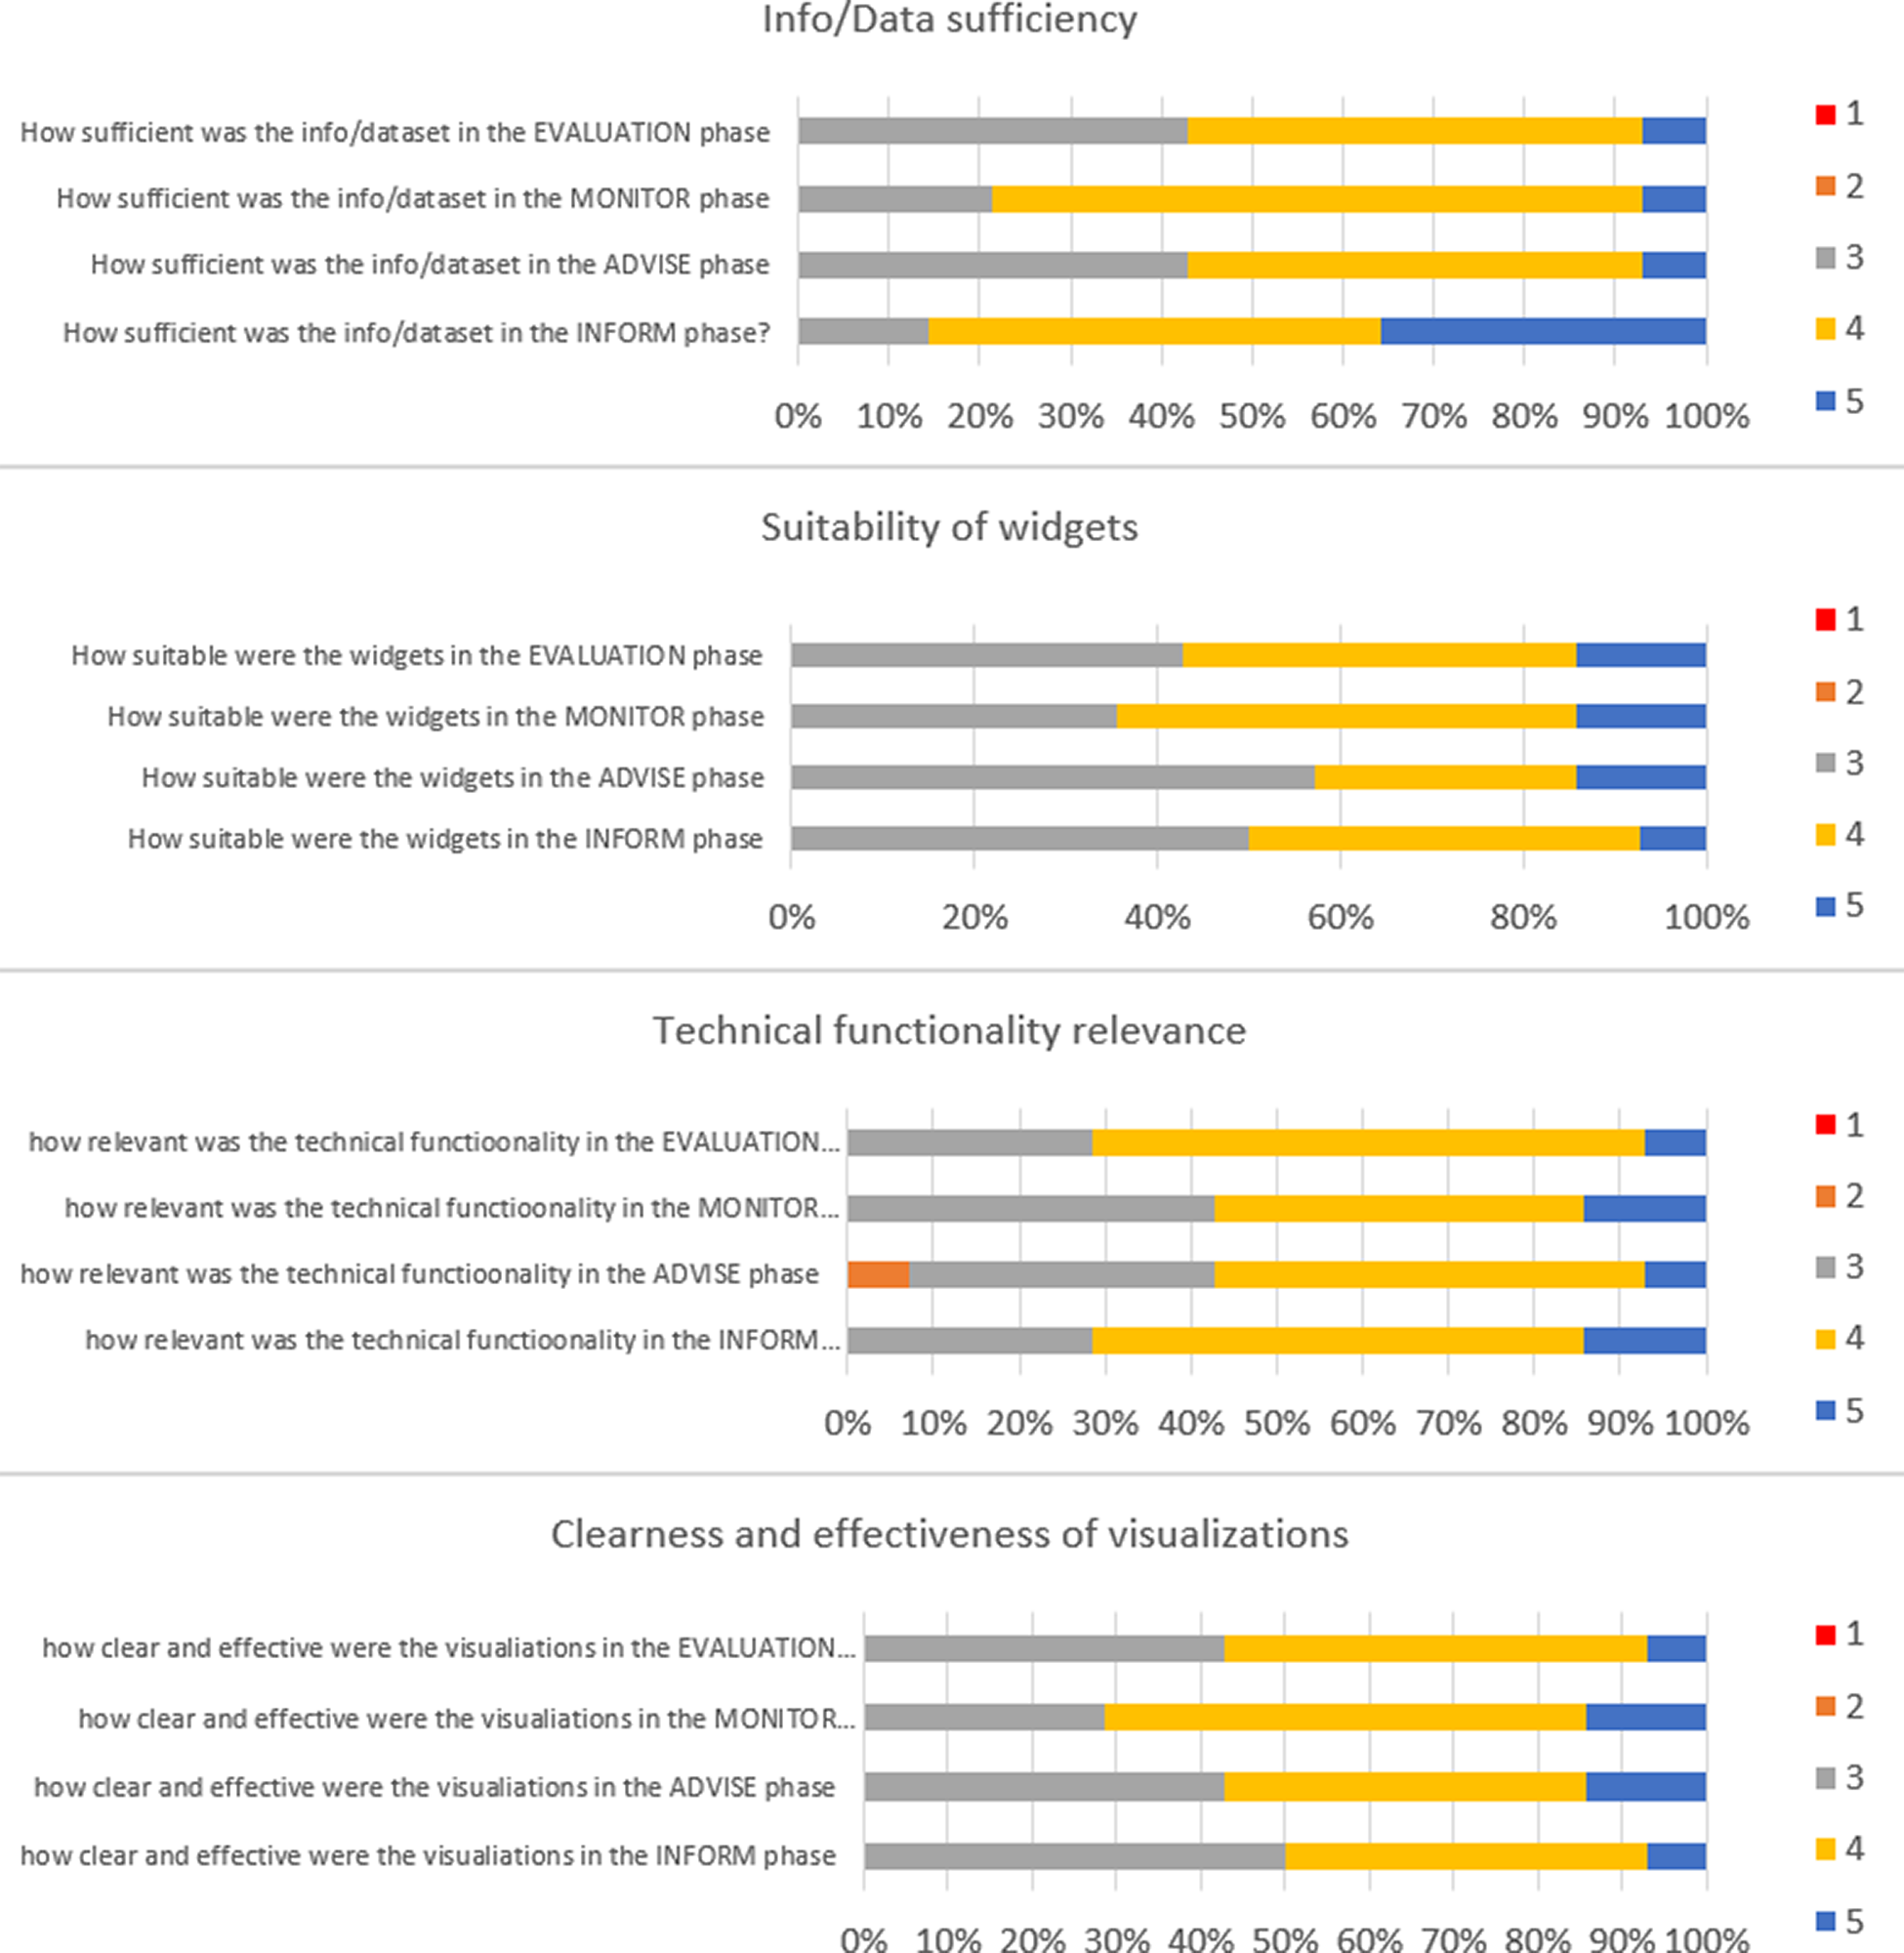
Finally, most of the participants were satisfied with regard to several aspects of the information provided in each IAMER phase, such as the volume and quality of information, the suitability of the widgets designed, the technical functionality relevance, and the clearness and effectiveness of the visualizations (Figure 17).
Survey replies about each phase of the IAMER methodology.
Another issue that the evaluation survey focused on was the future potential of the platform. The end-users agreed on the platform’s significant potential as a DSS for flood protection policies and proposed several improvements that could facilitate the adoption of the platform as an everyday work tool. Some of these are:
1. the examination of other flood reduction measures suggested in the flood risk management plan (other than the Caldogno retarding basin), which would allow a comparison of their impact and would promote the selection of the most appropriate one;
2. the integration of economic analysis, as well as cost versus benefit comparison related to the flood protection measure;
3. the enhancement of the social aspect and the citizen’s involvement in the process;
4. the inclusion of a way to promote the cooperation of other administrative procedures and public authorities for the same policy, as well as the inclusion of the various administrative procedures which regulate the implementation of a flood risk reduction measure.
In addition, two participants were selected for interviews, based on their high-level decision-making role and years of experience in planning flood reduction measures. The feedback from the interviewees gave a more high-level view of the CUTLER platform and its possibilities. One of the things made clear by the interviews was that policy-making related to flood risk management is part of some well-defined administrative procedures and it requires the synergy and cooperation of several local and regional authorities. This is something that can be easily incorporated in the platform. What is needed is simply a process model that correctly reflects the administrative decision-making procedure with all its incremental steps (aka. “tasks” in the business process model terminology) and with all the actors participating in a decision. This process model can be deployed in the platform and then be enriched with the respective dashboards containing the data visualizations necessary for making the decision. A necessary precondition is the close involvement of relevant administrative actors in the creation of the process model to ensure that it correctly depicts the administrative workflows and collaborations. The platform is therefore extremely flexible and can accommodate for any administrative decision-making procedure, however complicated or case specific. Adding to this, an integration mechanism between existing administrative software currently used by the public authorities and the CUTLER platform can be developed as well as additional more advanced communication features that will enable more substantial collaboration between the different stakeholders participating in the policy making process.
Another important issue raised during the interviews was that the platform use requires highly trained staff, with expertise not only in flood protection but also in digital technologies and big data. Therefore, the lack of data literacy of the people in administrative positions may complicate the integration of such a platform into the everyday work routine of policy-makers. Finally, it was noted that platforms such as this one could increase the transparency of policy making both inside the authorities that make the decisions but also with regard to the way policy makers communicate their decisions to citizens. This is also important for enhancing the democratic procedures and promoting a more active involvement of citizens in the policy making process (CUTLER, 2020f).
6. Conclusions and Future Work
In this article, we have presented an innovative platform that supports evidence-driven decision-making with regard to flood protection policies. A new methodology has been proposed and incorporated in the platform, which divides the policy making cycle into five different phases—inform, advise, monitor, evaluate, and revise (IAMER). For each phase, appropriate dashboards have been designed that allow the policy maker to make informed decisions by carefully inspecting several environmental, social, and economic data analytics and KPIs. The evaluation survey results were positive and highlighted the potential of this system for future use by public administrations that deal with flood management issues. At the same time, several recommendations for improvement have been proposed that inspired potential future work.
Future work will mainly focus on improving the social and socioeconomic analysis involved in estimating the predicted impact and assessing the actual impact of the proposed flood protection measures. Even though the proposed platform made use of a variety of environmental data (real and simulated), there were fewer social and socioeconomic data, as indicated also by the evaluation. Our aim is, first, to integrate the results of a socioeconomic simulation model in the Advise phase, which will predict the impact of different flood protection measures on the local economy and on the main socioeconomic indices (GDP, employment, poverty, etc.) in the context of different flood scenarios. Such simulation will allow policy makers to have a clear (quantitative) view of the economic and socioeconomic gains caused by the implementation of different flood protection measures. Second, to strengthen citizen involvement, we will integrate more social media platforms after identifying which ones are mostly appropriate, and also initiate a survey among citizens to collect feedback on how the authorities handle floods. Finally, our aim is to define a set of social and socioeconomic KPIs that will assess the actual impact of the measure during the Evaluation phase, for example, in terms of reduced economic damage to local businesses, households, reduced damage to social structures, and so forth. This way the policy-makers will be able to confirm that the implementation of the measure was indeed beneficial both economically and socially.
These extensions could require the collection of additional data, potentially owned or managed by third parties such as private organizations, civil society organizations, or other governmental organizations or departments of the same organization. Thus, it would be necessary for the authorities that will use the proposed system, to create or maintain a communication channel that will allow them to cooperate with these parties in order to ensure access to information that can further enrich urban planning.
While more data could help, the selection of the appropriate data for each policy and their ideal presentation to the policy maker is crucial for effective decision-making and this is something we plan to improve in the future through an agile-based co-creation process for the development of the various dashboards. This is important for two reasons; first, as discussed by Kitchin and McArdle (Reference Kitchin and McArdle2016) as well as Kitchin et al. (Reference Kitchin, Maalsen and McArdle2016), dashboards may provide partial views of the city, given that specific design decisions were made while creating those dashboards. Thus, the policy decisions made by the policy makers may be biased because the data was presented in a specific way. By co-creating the visualizations, such issues can be avoided. Another remedy for this is to apply adequate and powerful problem structuring and scenario planning methodologies (e.g., Causal Diagraming) in co-creation sessions before any dashboard design exercises take place. This allows to systematically gather knowledge and expectations from various experts and stakeholders and avoids that individuals or small groups of planners or decision-makers might reject or simply forget important correlations or information that is not in accord with their assumptions and expectations. Using problem structuring and scenario planning methodologies allows multiple perspectives from different stakeholders of a policy problem to be represented, debated, and incorporated, which greatly improves a holistic and systemic understanding of a problem and its domain. This can help minimize biases in data collection and presentation.
Second, the selection of the appropriate data to be presented to policy makers can help reduce the bias that is associated with big data based decision-making. For example, to avoid bias toward wealthy communities when considering flood damages, additional GIS layers could be included to present information such as poverty rate, GDP or rental/house prices in different city neighborhoods. Similarly, to avoid public opinion bias, alternative ways of opinion gathering can be utilized to consider the opinions of groups of citizens that are not active in social media (Hargittai, Reference Hargittai2015), for example, dedicated surveys conducted by local authorities focusing on specific policy issues. Note here that for the most relevant environmental policies, the EU imposes that they are presented to the public so that people can express their opinion about them (Directive 2003/35/EC, 2003). The collected data can be analyzed and presented in dashboards similar to the ones used for presenting Twitter and TripAdvisor analysis results.
Finally, considering that bias cannot be fully eliminated, an important step toward making sure policy makers are aware of it would be to study new ways to appropriately visualize bias aspects and incorporate them in the dashboards so as to foreground them in a manner that is actionable as part of judicious decision-making.
To conclude, the proposed methodology and platform can be easily adapted to any flood protection measure, as long as the necessary data are available, since they offer a standardized way for the design of the decision-making process and the corresponding dashboards. We consider this feature the most important outcome of our work, since it greatly facilitates the platform adoption from a variety of stakeholders involved in flood protection management (CUTLER, 2020g).
Acknowledgment
This work was supported by EU Horizon 2020 project CUTLER: Coastal Urban developmenT through the LEnses of Resiliency, under contract no. 770469 (http://www.cutler-h2020.eu/).
Funding Statement
This research was supported by grants from the European Community’s Horizon 2020—Research and Innovation Framework Programme under grant agreement no. 770469, CUTLER.
Competing Interests
The authors declare no competing interests exist.
Author Contributions
Conceptualization: F.T., S.N., H.H., L.K.; Data curation: G.P., F.L., D.N., M.F.; Formal analysis: F.T., S.N.; Funding acquisition: S.N., I.K.; Methodology: F.T., S.N., H.H., L.K; Project administration: F.T., S.N., I.K.; Resources: G.P., F.L., D.N., M.F.; Supervision: F.T., S.N., I.K.; Visualization: G.P.; Writing—original draft: G.P., F.T., S.N., F.L.; Writing—review and editing: G.P., F.T., S.N., F.L.
Data Availability Statement
Data availability is not applicable to this article as no new data were created or analyzed in this study.







 Open access


Comments
No Comments have been published for this article.