


Cognitive screening tools administered after patient complaints are prone to underdiagnosis, Reference Hess, Levy and Hashmi1 revealing a need for improvement. Routine electroencephalograms (EEGs) are a widely used clinical tool for assessing neurophysiological function. However, routine EEG typically involves 20–60 minutes of recording Reference Baud, Schindler and Rao2 with “activating methods,” such as photic stimulation and hyperventilation (to elicit epileptiform activity). Reference Schwarz and Zangemeister3 In addition to the recording time, EEG requires highly specialized personnel for electrode application, artifact mitigation, and data recording and handling. Reference Sinha, Sullivan and Sabau4 While routine EEG is a useful, high-density technique to analyze brain electrophysiology, it can be time-consuming and resource-intensive.
The brain vital signs (BVS) framework Reference Ghosh Hajra, Liu and Song5 offers a more rapid, accessible alternative. Introduced in a 2016 publication, Reference Ghosh Hajra, Liu and Song5 the last nine years of research focused on this framework as physiological proof of a living body, similar to blood pressure. It uses portable EEG technology to automatically extract well-established event-related potentials (ERPs) – N100, P300 and N400 – as objective indicators of cognitive processing (see Supplementary Materials). While evaluating BVS across diverse pathologies from concussions to dementia Reference Ighalo, Kirby and Song6 has provided clinical validation, its use in a hospital-based electrodiagnostic clinical setting with comparison to routine EEG is novel. This comparison is important for positioning standardized, automated ERP evaluation as a complementary cognitive assessment to resource-intensive evaluations like routine EEG.
This observational pilot study assessed the feasibility of employing the BVS framework in a hospital setting alongside routine EEG. An exploratory analysis compared abnormalities in BVS results to routine EEG. The hypothesis was that, due to the functional aspect of ERPs compared to the clinical-standard resting-state EEG, the BVS framework would detect more abnormalities than the routine EEG in clinical patients experiencing subjective cognitive complaints.
In the current study, 20 outpatients at the Royal Columbian Hospital of Fraser Health in New Westminster, British Columbia, were referred to a routine EEG for cognitive concerns. Participants were recruited for the study only when they were already prescribed to have a routine EEG by their treating physician (Figure 1). The participants were between 50 and 85 years of age, fluent in English and had normal or corrected-to-normal hearing.
Flowchart of study enrollment process and data collection. EEG = electroencephalogram.

The BVS framework Reference Ghosh Hajra, Liu and Song5 (employed with the NeuroCatch® Platform - Version 1.1) uses EEG to rapidly extract the N100, P300 and N400 ERPs. They were stimulated using a 6-minute standardized auditory sequence consisting of tones and spoken word pairs. An oddball paradigm with frequent standard tones and infrequent oddball tones elicited the N100 and P300 components, while semantically matched or mismatched word-pairs (e.g., match: bread-butter; mismatch: bread-window) elicited the N400. Participants passively listened and decided if the word pairs matched or mismatched. EEG data were recorded at 500 Hz and processed to generate individual BVS metrics (details in Supplementary Data). ERP peaks were automatically identified Reference Ghosh Hajra, Liu and Song5 and manually verified by an expert. One participant’s BVS data were corrupted, leaving a sample size of 19 for analysis. Each participant underwent repeated BVS scans; the first scan was used for all participants.
To contextualize results, a comparison group of 181 individuals (mean age = 40 years; range = 8–84 years; 91 females) from NeuroCatch reference data was included. Comparison thresholds were defined as group median ± 3 interquartile range (IQR) values, providing a broad comparison range to better highlight outliers.
Participants also completed a general health questionnaire and Mini-Cog assessment at data collection. Clinical EEG reports of each participant were retrieved and included a normal or abnormal categorization by a neurologist. Clinical information (e.g., referral letters, consultations and clinic notes) was retrieved from Meditech system within 6 months of the BVS scan for 16 of the 19 participants; three lacked data on problems and medications.
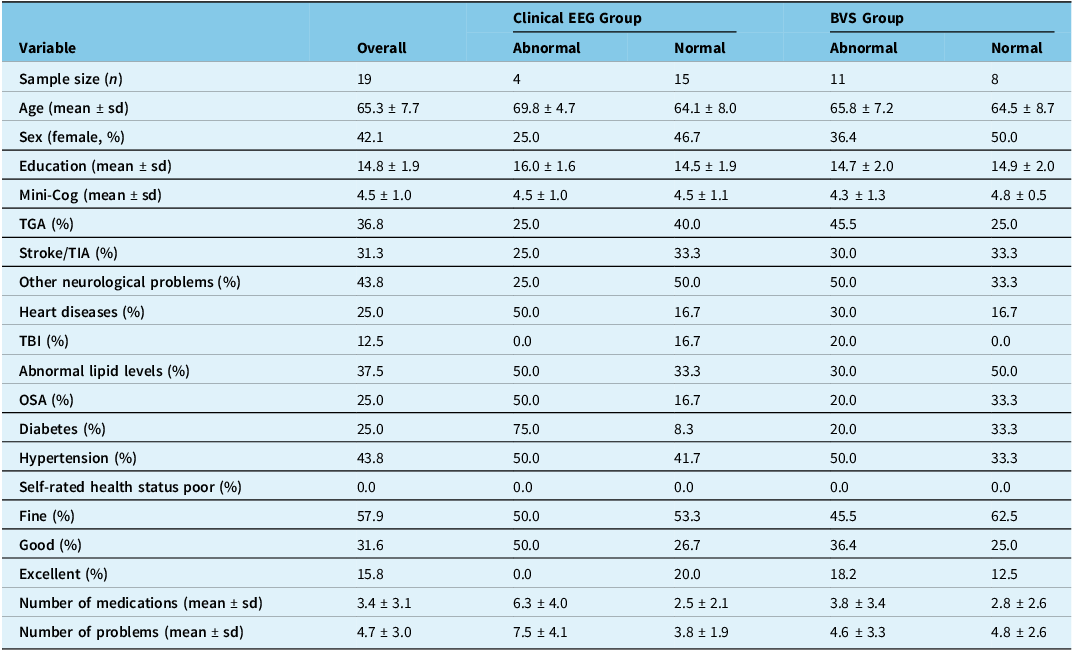
Participant characteristics by overall sample, BVS results and routine EEG groupings are shown in Table 1. From the sample (n = 19; 50 to 76 years of age (mean age [standard deviation] - 65.3 [7.7] years), 11 (57.9%) showed at least one BVS abnormality, whereas 4 (21.1%) had abnormal routine EEGs (Table 1). Of those with abnormal routine EEGs, only two also showed BVS abnormalities. BVS abnormalities included the latency (response time) and amplitude (response strength/synchrony) for the N100, P300 and N400 components. Most out-of-range BVS values reflected slower latencies and reduced amplitudes, except for one case showing an elevated P300 amplitude relative to the reference range.
Characteristics of all participants and by clinical EEG grouping and BVS grouping

Table 1 Long description
A table comparing participant characteristics across different groups. The table has 21 rows and 6 columns. The columns are labeled as Variable, Overall, Clinical EEG Group Abnormal, Clinical EEG Group Normal, BVS Group Abnormal, and BVS Group Normal. The rows list various variables such as Sample size, Age, Sex, Education, Mini-Cog, TGA, Stroke/TIA, Other neurological problems, Heart diseases, TBI, Abnormal lipid levels, OSA, Diabetes, Hypertension, Self-rated health status, Number of medications, and Number of problems. Each row provides specific values for each group. For example, the Sample size row shows 19 overall, 4 for Clinical EEG Group Abnormal, 15 for Clinical EEG Group Normal, 11 for BVS Group Abnormal, and 8 for BVS Group Normal. The table provides a detailed comparison of these variables across the different groups.
BVS = brain vital signs; EEG = electroencephalogram; Mini-Cog = quick screening for early dementia detection; TGA = transient global amnesia; TIA = transient ischemic attack; TBI = traumatic brain injury; OSA = obstructive sleep apnea; n = number of participants; sd = standard deviation; % = percentage of participants.
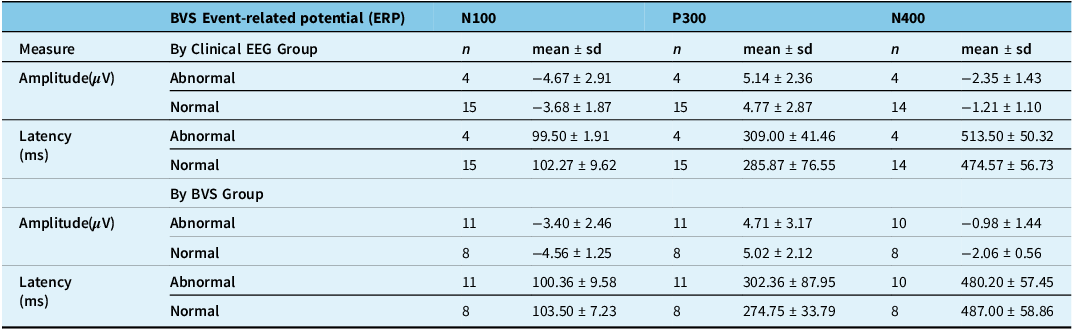
The mean amplitude and latencies of ERPs between participants grouped by routine EEG results and BVS results were compared (Table 2). For those who had abnormal routine EEGs, the mean latency of the P300 and N400 ERPs was slower than those who had normal routine EEGs (309.00 and 513.50 vs. 285.87 and 474.57, respectively; Table 2). Those who had normal routine EEGs had lower mean amplitudes for all three ERPs compared to those who had abnormal routine EEGs. In contrast, those who had abnormal BVS results had lower mean amplitudes for all three ERPs compared to those who had normal BVS results. The mean latency for the P300 ERP was also slower for those who had abnormal BVS results. The amplitude and latency for each of the three ERPs are shown in Figure 2 as a radar plot between routine EEG groupings and BVS groupings. Figure 3 shows the normal and abnormal EEG grouped average waveforms, including the latency and amplitude (Table 2), of all three ERP components.
Brain vital signs radar plots by routine EEG grouping and brain vital signs grouping. Note: EEG = electroencephalogram; BVS = brain vital signs; A = Amplitude; L = Latency; Gray shaded area indicates the 5th to 95th percentile for all reference data scans.

Average waveforms elicited by tones and word pairs in participants with a normal (A) and abnormal (B) EEG. General location of N100, P300, and N400 components is noted. 90% confidence interval shading included. Note: EEG = electroencephalogram.

Mean amplitude and latencies of BVS ERPs between routine EEG result groupings and BVS result groupings

Table 2 Long description
A table comparing mean amplitude and latencies of event-related potentials between participants grouped by routine EEG results and BVS results. The table has 12 rows and 10 columns. Column headers are Measure, Amplitude, Latency, By Clinical EEG Group, n, mean ± sd, n, mean ± sd, n, mean ± sd. Row labels are Amplitude, Latency, By BVS Group, Amplitude, Latency, Abnormal, Normal. Row 1: Measure, Amplitude, Latency, By Clinical EEG Group, n, mean ± sd, n, mean ± sd, n, mean ± sd. Row 2: Abnormal, 4, -4.67 ± 2.91, 4, 5.14 ± 2.36, 4, -2.35 ± 1.43. Row 3: Normal, 15, -3.68 ± 1.87, 15, 4.77 ± 2.87, 14, -1.21 ± 1.10. Row 4: Abnormal, 4, 99.50 ± 1.91, 4, 309.00 ± 41.46, 4, 513.50 ± 50.32. Row 5: Normal, 15, 102.27 ± 9.62, 15, 285.87 ± 76.55, 14, 474.57 ± 56.73. Row 6: By BVS Group, Amplitude, Latency, Abnormal, Normal. Row 7: Abnormal, 11, -3.40 ± 2.46, 11, 4.71 ± 3.17, 10, -0.98 ± 1.44. Row 8: Normal, 8, -4.56 ± 1.25, 8, 5.02 ± 2.12, 8, -2.06 ± 0.56. Row 9: Abnormal, 11, 100.36 ± 9.58, 11, 302.36 ± 87.95, 10, 480.20 ± 57.45. Row 10: Normal, 8, 103.50 ± 7.23, 8, 274.75 ± 33.79, 8, 487.00 ± 58.86.
BVS = brain vital signs; ERPs = event-related potentials; EEG = electroencephalogram; n = number of participants; sd = standard deviation; µV = microvolts; ms = milliseconds. (One participant did not have an N400 response, potentially due to a lack of attention or a lack of being able to semantically separate incongruent word pairs).
Both the clinically standard EEG and the BVS platform identified participants with abnormal brain function. The trend in Table 1 shows that neurological problems are better captured by BVS scans, while other comorbidities are associated with clinical EEG assessments. BVS identified an abnormality in 60% of patients with cognitive complaints, 37% more than clinical routine EEG. The difference in BVS and routine EEG abnormalities in these results suggests the complementary value of the BVS framework in addition to the routine EEG. The wide comparison range used (median ± 3 IQR values) encompasses the majority of the reference data to better highlight large outliers. These results suggested the increased sensitivity of the framework to detect abnormalities that may go unnoticed by routine EEG. Not only was the BVS sensitive, but the technology was also fast and convenient: it effectively reduced the assessment time by 70% from the standard care clinical EEG, and the assessment can come to the patients’ bedside (instead of being limited to hospitals or clinic settings). Once proven effective, these features can benefit the clinical uptake of the technology.
The N400 component detected the most BVS abnormalities in seven participants. The N400 ERP is associated with higher-level cognitive processing Reference Kutas and Federmeier7 and is sensitive to cognitive issues. Reference Ighalo, Kirby and Song6 Specifically, Ighalo et al employed the BVS framework in care home residents. While all measures seemed abnormal, the N400 followed the patterns of age and mini-mental state examination results. Reference Ighalo, Kirby and Song6 In line with the current study, these findings indicated that objective neurophysiological measures of impairment are detectable and may relate to a pattern of cognitive function. In the current study, the BVS framework detected more abnormalities and could potentially help in addressing patients’ cognitive concerns alongside the traditional routine EEG in clinical settings.
ERPs have been shown to be sensitive to cognitive changes and give insight into future developments of cognitive impairments. One study conducted by Gironell et al. Reference Gironell, García-Sánchez, Estévez-González, Boltes and Kulisevsky8 found that patients who had significantly slower P300 ERP latencies throughout a two-year period had a higher probability of being diagnosed with Alzheimer’s disease. Another study showed how certain ERPs can differentiate patients with progression in cognitive impairments. Reference Bennys, Rondouin, Benattar, Gabelle and Touchon9 This highlights the significant impact that introducing ERP measurements in clinical settings could have, in addition to routine EEGs, in early detection of cognitive impairments.
Interpretations of EEG results can vary between professionals. Reference Grant, Abdel-Baki and Weedon10 Perhaps rapid, automated ERPs, employed by the BVS framework, could improve the reliability and consistency of EEG interpretations. The present study showed the ability of ERPs to detect additional abnormalities compared to routine EEGs, which could assist professionals in analyzing routine EEG data and confirming the presence or absence of cognitive impairments. In addition to the initial detection of impairments, ERPs can assist in monitoring and tracking the improvements to cognition.
Our results must be interpreted with caution. We had a relatively small sample, limiting the statistical power to always detect a difference when such a trend was seen. Also, the participants were from a single clinic with imbalanced normal or abnormal EEG presentation, limiting the generalizability of the finding. Future research with increased sample size is needed to explore more equally distributed EEG-labeled samples. Additional investigations are also needed to understand the effectiveness and efficiency of using both methods to assess cognition, along with more in-depth neuropsychological investigations.
Despite the limitations, this study represents the initial effort to directly compare BVS-extracted values of ERPs and the standard-care EEG in clinical patient participants, providing insights into developing/examining novel technologies for improving the diagnosis and care of people with subjective cognitive complaints. In conclusion, this study shows the complimentary value of the BVS framework as a fast and convenient portable method of brain function assessment in addition to routine EEG.
Supplementary material
The supplementary material for this article can be found at https://doi.org/10.1017/cjn.2025.10362.
Acknowledgements
This study was supported by Royal Columbian Hospital Foundation and Surrey Hospitals Foundation.
HealthTech Connex Inc. provided the NeuroCatch® with technical support.
We acknowledge Royal Columbian Hospital Department of Neurology for research and administrative support and the EEG technologists for help with participant identification and clinical assessments.
We acknowledge Fraser Health Department of Evaluation and Research Services for research and administrative support, and Hilary Low for help with document preparation and management.
Author contributions
GM, XS and RCND contributed to project study design and manuscript editing. XS also contributed to result interpretation, data analysis and presentation review and consultation, supervision, and research funding acquisition. EDK contributed to data collection, data processing, statistical analysis, figure creation and manuscript drafting. KH contributed to data collection, figure creation and manuscript drafting. MG contributed to data collection and manuscript editing. TOF contributed to manuscript drafting and editing.
Funding statement
We acknowledge funding for this project from the Royal Columbian Hospital Foundation and Surrey Hospitals Foundation.
Competing interests
RCND is the co-founder of HealthTech Connex Inc., and the NeuroCatch Platform with financial and/or business interests that may be affected by the research reported in this paper. EDK and TOF are employed by NeuroCatch Inc., which may be affected by the research reported in this paper. KH, MG and XS have no disclosures with the present study.


 Open access