

Among the main national priorities in Chile are the decrease of extreme poverty and improvement in the quality of education. However, this depends on the child, his family and factors related to the educational system that affect scholastic achievement and desertion(Reference Ivanovic, Belleï and Fiabiane1–Reference Ivanovic, Rodríguez and Pérez7). Like in many other countries, few investigations have been carried out in Chile to measure the long-term effects of nutritional status at an early age on scholastic achievement because most of the research has been focused on the socio-economic determinants of the learning process. In addition, research related with a global approach of this in follow-up studies is scant(Reference Ivanovic, Pérez and Olivares5, Reference Ivanovic, Almagia and Toro8–Reference Schiefelbein and Simmons12). School-age children of the poor strata attend mainly public (state) schools and achieve significantly lower results than their peers from the medium or high socio-economic strata both in scholastic achievement and intelligence tests. The unsatisfactory results can be explained by deficient environmental conditions such as low parental income and schooling and precarious quality of housing with inadequate sewerage and water supply systems, situations that do not encourage learning and intellectual development(Reference Ivanovic, Pérez and Olivares5, Reference Schiefelbein and Farrel11–Reference Ivanovic, Zacarías, Saitúa and Moyal17).
In Chilean school-age children, nutritional status has been positively and significantly correlated with socio-economic conditions, scholastic achievement and intelligence, especially with those indicators of past nutrition, such as weight, height and head circumference (HC)(Reference Ivanovic, Leiva and Pérez4, Reference Ivanovic, Pérez and Olivares5, Reference Ivanovic, Leiva and Pérez10, Reference Schiefelbein and Farrel11, Reference Ivanovic, Forno and Castro13, Reference Ivanovic, Ivanovic and Middleton15, Reference Ivanovic, Zacarías, Saitúa and Moyal17–Reference Ishikawa, Furuyama and Ishikawa21). In this context, HC is the most relevant index associated with learning and intelligence. Children with a suboptimal HC graduating from high school have twice the probability of failing the academic aptitude test (AAT) for university admission. Even more, educational selectivity correlates with HC and not with weight and height; this results in a higher desertion rate among children with suboptimal HC(Reference Ivanovic, Rodríguez and Pérez7, Reference Ivanovic, Olivares and Castro22). HC is an anthropometric indicator of both nutritional background and brain development and constitutes the most sensitive physical index of undernutrition at an early age(Reference Ivanovic, Leiva and Castro3, Reference Ivanovic, Leiva and Pérez4, Reference Ivanovic, Almagia and Toro8, Reference Ivanovic, Leiva and Perez9, Reference Ivanovic and Marambio20, Reference Ivanovic, Olivares and Castro22–Reference Stoch, Smythe and Moodie25). Furthermore, it has been found by several investigators to be positively and significantly correlated with intelligence(Reference Ivanovic, Leiva and Castro3, Reference Ivanovic, Leiva and Pérez4, Reference Ivanovic, Almagia and Toro8–Reference Ivanovic, Leiva and Pérez10, Reference Ivanovic, Forno and Castro13, Reference Stoch, Smythe and Moodie25–Reference Willerman, Schultz and Rutledge45). Some of these studies confirmed that head size at age 1 year is a good predictor of later intelligence(Reference Dolk30–Reference Hack, Breslau and Weissman35, Reference Nelson and Deutschberger38, Reference Ounsted, Moar and Scott39, Reference Casey, Whiteside-Mansell and Barrett46).
Long-term studies indicate a positive and significant correlation between growth indicators, particularly weight, height and HC, and intellectual abilities of children(Reference Ivanovic, Leiva and Castro3–Reference Ivanovic, Pérez and Olivares5, Reference Ivanovic, Almagia and Toro8–Reference Ivanovic, Leiva and Pérez10, Reference Ivanovic, Forno and Castro13, Reference Stoch, Smythe and Moodie25, Reference Botting, Powls and Cooke27, Reference Dolk30, Reference Hack and Breslau34–Reference Gale, O'Callaghan and Godfrey36, Reference Nelson and Deutschberger38, Reference Stathis, O'Callaghan and Harvey42, Reference Willerman, Schultz and Rutledge45). On the other hand, intelligence has been described as the most important variable that explains scholastic achievement and AAT variances in both sexes(Reference Ivanovic, Pérez and Olivares5, Reference Ivanovic, Pérez, Leiva and Dupri6, Reference Ivanovic, Almagia and Toro8–Reference Ivanovic, Leiva and Pérez10, Reference Ivanovic, Ivanovic and Truffello47). A comparative study of high school graduates of the low socio-economic stratum (SES), with and without undernutrition in the first year of life, emphasised that maternal schooling, child brain volume and undernutrition in the first year of life were the independent variables with the greatest explanatory power on intelligence quotient (IQ), but only IQ explained scholastic achievement variance. The IQ, corpus callosum length, anteroposterior brain diameter and maternal schooling have been identified as the independent variables with the greatest explanatory power in AAT variance(Reference Ivanovic, Leiva and Perez9).
The AAT, the baccalaureate examination for university admission with national coverage, is the most relevant educational achievement measurement that reflects the result of the educational process along the school years. Cross-sectional studies carried out by us revealed that students with high AAT scores had IQ, parental IQ, scholastic achievement, brain volume, HC, maternal schooling, head of household occupation and quality of housing significantly higher than their peers that achieved the lowest AAT scores, of whom 19 % had been severely malnourished in the first year of life. Logistic regression analysis revealed that student IQ is the best predictor of AAT score and the OR (1·252) implies that when the IQ score increases by one point, the probability of a high AAT score increases by 25·2 %(Reference Ivanovic, Pérez, Leiva and Dupri6).
Taking into consideration the previous discussion, the aims of this follow-up study were: (i) to describe the nutritional, intellectual, family, educational and socio-economic characteristics of the children on admission to elementary school in 1987 that may affect outcomes at the end of the high school period, 12 years later, in 1998, when all have to take the AAT for university admission; (ii) the quantification of the impact of these independent variables on AAT scores; (iii) to learn which risk factors, when present at an early age, may predict outcomes at the AAT, with the purpose of suggesting steps to improve the learning process, considering that for most of high school graduates this test has considerable importance for their professional future.
Materials and methods
Study population and sample
The target population, 75 138 children, included all school-age children who were enrolled in the first grade of elementary schools in the Metropolitan Region of Chile in 1987. The mean age of the children was 6·5 (sd 0·4) years ranging from 5 years 6 months to 9 years 1 month and they belonged to public (state), private-subsidised and private non-subsidised schools from both urban and rural areas. The sampling system was designed to yield a sample including approximately 1·0 % of this population. The representative and proportional sample consisted of 813 school-age children randomly selected and stratified according to a multi-stage sampling system by geographic area, county, school grade, sex and type of school. For each stratum, sample size was proportional to its representation in the school-age population and was calculated with 95 % reliability (z = 1·96), 3·4 % of sample error, considering p = 0·5 (males) and q = 0·5 (females)(Reference Guilford and Fruchter48, Reference Chilean Ministerio de Educación Pública49). This sample is representative of 38·0 % of the wider Chilean school-age population(Reference Chilean Ministerio de Educación Pública49). Of the original sample, 77·7 % (632 school-age children) was located in 1998 at a time when they were graduating from high school (mean age 18·0 (sd 0·7) years). The educational situation of the school-age children detected in 1998 who had been members of the original sample of school-age children enrolled in elementary first grade in 1987 was as follows: 43·2 % of school-age children graduated from high school, 25·5 % experienced school delay, 9 % dropped out from the educational system and 22·3 % could not be located(Reference Ivanovic, Belleï and Fiabiane1, Reference Ivanovic, Rodríguez and Pérez7). Of the school-age children graduating from high school (351 children, 55·5 % of the located sample) who were ready to take the AAT for university admission in 1998, only 260 children (74 % of the students who graduated) took the AAT in that year; the present study describes the situation of these children.
Design
This longitudinal, prospective and observational study comprises two cross-sectional stages. The first, as mentioned before, related to the survey of 1987, was carried out in thirteen schools that belonged to eight counties from the Metropolitan Region of Chile in which 813 elementary school-age children were examined for nutritional, intellectual, socio-economic, socio-cultural, demographic and family characteristics, mass media exposure and educational assessments. The second stage was their follow- up in 1998, at the end of the fourth year of high school, when they took the AAT for university admission. School-age children from the survey of 1987 were located in their original educational establishments, in their homes and in the Chilean universities registering their educational situation in 1998 and their scores in the AAT were recorded(Reference Universidad de Chile50). The present study was approved by the Committee on Ethics in Studies in Humans of the Institute of Nutrition and Food Technology (INTA), University of Chile. The subjects' consent was obtained according to the norms for Human Experimentation, Code of Ethics of the World Medical Association (Declaration of Helsinki)(Reference Rickham51).
Measures
Academic aptitude test
AAT scores of 1998, both verbal and mathematics components, were registered. The AAT has a maximum score of 900 for each part (verbal test with ninety items and mathematics test with sixty items)(Reference Universidad de Chile50). The AAT score represents the mean between verbal AAT and mathematics AAT. AAT scores were analysed dividing the sample into quartiles (Q) and this sample division characterised each group as significantly different from the others (Table 1). In fact, Q1 grouped students who failed in the AAT, since scores below 450 barred students from applying to higher education; Q4 includes those students who obtained the highest scores in the AAT. This division allowed us to compare students who obtained the lowest scores in the AAT with their peers who obtained better outcomes.
(Mean values and standard deviations)

F, variance.
a,b,c,d Mean values within a row with unlike superscript letters were significantly different (P < 0·05; Scheffé's test).
* The mean AAT score in 1998 was 537·59 (sd 119·60). The AAT score is given as the mean of the verbal AAT and the mathematics AAT scores.
Nutritional status assessment
Nutritional status was assessed by registering weight, height, HC, arm circumference and triceps skinfold, measured by the principal author in 1987 according to standardised procedures(Reference Gibson52). Nutritional status was expressed as weight-for-age z-score (Z-W), height-for-age z-score (Z-H) and weight-for-height z-score (Z-W/H)(53). According to Z-W, children were classified as undernourished (Z-W < − 1 sd), well-nourished (Z-W between − 1 sd to +1 sd), overweight (Z-W between >+1 sd and +2 sd) and obese (Z-W >+2 sd); when Z-H was used as parameter, children were classified as growth failure (Z-H < − 1 sd), normal height (Z-H between − 1 sd and +1 sd) and tall (Z-H >+1 sd). HC was compared with the tables of Ivanovic et al., and was expressed as a z-score (Z-HC)(Reference Ivanovic, Olivares and Castro54). HC absolute values expressed in centimetres were adjusted for sex and body size (weight and height) through analysis of covariance(Reference Guilford and Fruchter48). In this respect, mean ± 2 sd was considered ‘normal HC’, < − 2 sd microcephaly and >+2 sd macrocephaly(Reference Ivanovic, Olivares and Castro54–Reference Tanner, Forfar and Arneil57). Percentages of adequacy to the median for arm circumference-for-age, triceps skinfold-for-age, arm muscle area-for-age and arm fat area-for-age were calculated using data from Frisancho(Reference Frisancho58). Birth weight was used as an index of prenatal nutrition, while Z-W, Z-H and Z-HC served as indicators of postnatal nutrition and Z-W/H was used as an index of current nutritional status. Other indicators of prenatal nutrition such as height and HC at birth not always can be obtained from the Registry Office or from mothers. Nutritional diseases, especially undernutrition (Z-W < 2 sd) at an early age, were registered. No other nutritional diseases were informed by the mothers.
Intellectual ability
Intellectual ability (IA) in 1987 was assessed with Raven's Progressive Matrices Test in book form, with a special scale for children aged 4 to 11 years(Reference Raven59, Reference Ivanovic, Forno and Durán60). The test was administered individually by a team of trained educational psychologists and the scores were plotted according to age in a percentile (p) scale: grade I, superior IA (score ≥ p95); grade II, above average (score ≥ p75 and < p95); grade III, average (score >p25 and < p75); grade IV, below average (score >p5 and ≤ p25); grade V, intellectually defective (score ≤ p5). There was no difference between the percentile scales of the sample and those obtained by Raven(Reference Ivanovic, Forno and Ivanovic14, Reference Raven59, Reference Ivanovic, Forno and Durán60).
Scholastic achievement test
The scholastic achievement test (SA) in 1987 was determined through Spanish language (LA) and mathematics (MA) tests (verbal and non-verbal). Content validity was based on the fact that the test was especially designed by experts in these disciplines that are obligatory, taking into consideration the objectives pursued by the curricular programmes of the Ministry of Education(Reference Chile Ministerio de Educación Pública61). The number of items was similar for LA (sixteen) and MA (sixteen). A pilot test was carried out in fifty-five school-age children, during which its reliability was determined applying the Spearman–Brown correlation, comparing paired and unpaired items scoring 0·92 and 0·97 for LA and MA, respectively(Reference Guilford and Fruchter48). Item-test consistency for each item was measured by the Pearson correlation scoring values above 0·35 in all of them(Reference Guilford and Fruchter48). Results were expressed as percentage of achievement in overall results (SA) (LA+MA) as well as LA and MA.
Socio-economic stratum, socio-cultural, family and mass media exposure variables
SES in 1987 was measured using Graffar's modified scale which includes schooling and occupation of the head of household and characteristics of housing (building materials, ownership, water supply and ownership of durable goods), which has been validated for the Chilean urban and rural population(Reference Alvarez, Muzzo and Ivanovic62). This scale classifies the population sample into six socio-economic strata: 1, high; 2, medium-high; 3, medium; 4, medium-low; 5, low; 6, extreme poverty. In the present study, SES was grouped into three levels: high (1+2), medium (3) and low (4+5+6). Family characteristics such as the number of members and siblings, place among siblings, crowding, and history of family alcoholism and recreation were also registered. Mass media exposure in 1987 was assessed by applying a questionnaire based on open and closed questions that was previously tested(Reference Ivanovic and Sepúlveda63). The purpose was to know the preferences and magnitude of the exposure to radio, cinema, television, newspapers, magazines and books other than school books.
Statistical analysis
Data were processed using the SAS package (SAS Institute, Inc., Cary, NC, USA)(Reference Guilford and Fruchter48, 64). Statistical analysis included variance tests (PROC ANOVA), Scheffé's test for the comparison of means, correlation (PROC CORR) and multiple regression (general linear models procedure, PROC GLM error type III). To determine significant differences between the categorical variables, χ2 and Fisher's tests (PROC FREQ) were used.
Results
Of the 632 school-age children enrolled in the first grade of elementary school in 1987 and located, 351 graduated from high school in 1998 but only 260 children (74 % of the students who graduated) took the AAT. As regards the ninety-one children (26 % of the graduated students) who did not take the AAT, 53 % had not interest in taking the test, 20 % of them would be working in the next year, 10 % became pregnant, 10 % had economic problems that would prevent them from paying the registration fee to take the AAT and 7 % had a low SA. Even more, 18·1 and 50 % of children who did not take the AAT belonged to high and low SES, respectively, compared with their graduated peers who took the AAT (35·6 and 19·2 % respectively) (![]() (df 2) 40·291>
(df 2) 40·291>![]() (df 2) 13·815; P < 0·001). This means that those children who did not take the AAT had parents whose schooling and occupational levels (P < 0·001), quality of housing (P < 0·001) and sewerage (P < 0·001) were significantly lower compared than those children who took the test. Most of the children belonging to this latter group lived in urban area (93·5 %) compared with those who did not take the AAT (85 %) (
(df 2) 13·815; P < 0·001). This means that those children who did not take the AAT had parents whose schooling and occupational levels (P < 0·001), quality of housing (P < 0·001) and sewerage (P < 0·001) were significantly lower compared than those children who took the test. Most of the children belonging to this latter group lived in urban area (93·5 %) compared with those who did not take the AAT (85 %) (![]() (df 1) 7·453>
(df 1) 7·453>![]() (df 1) 6·635; P < 0·01). The type of school attended was different when comparing these school-age children who took and those who did not take the AAT: 34·6 and 32·3 % attended public (state) schools, 31·9 and 56·4 % private subsidised schools and 33·5 and 11·3 % private non-subsidised schools, respectively (
(df 1) 6·635; P < 0·01). The type of school attended was different when comparing these school-age children who took and those who did not take the AAT: 34·6 and 32·3 % attended public (state) schools, 31·9 and 56·4 % private subsidised schools and 33·5 and 11·3 % private non-subsidised schools, respectively (![]() (df 2) 29·922>
(df 2) 29·922>![]() (df 2) 13·815; P < 0·001). Undernutrition at an early age was significantly more prevalent in school-age children who did not take the AAT (13 %) compared with their peers who took the AAT (3·3 %) (
(df 2) 13·815; P < 0·001). Undernutrition at an early age was significantly more prevalent in school-age children who did not take the AAT (13 %) compared with their peers who took the AAT (3·3 %) (![]() (df 1) = 9·458>
(df 1) = 9·458>![]() (df 1) 6·635; P < 0·01).
(df 1) 6·635; P < 0·01).
The nutritional status of the 1987 sample, at the onset of elementary school, in relation to their AAT scores in 1998 is expressed in Table 2. Q1 school-age children had a postnatal nutritional background in 1987 significantly more deteriorated than their peers from Q4, since they had significantly lower values for Z-W (P < 0·01), Z-H (P < 0·001) and Z-HC (P < 0·001) without significant differences for prenatal, current nutritional status and arm parameters. As stated previously, only 3·3 % of school-age children who took the AAT had been undernourished at an early age; however, no significant differences were observed in the AAT scores (Fisher P = 0·682).
(Mean values and standard deviations)

F, variance; Z-W, weight-for-age z-score; Z-H, height-for-age z-score; Z-HC, head circumference-for-age z-score; Z-W/H, weight-for-height z-score; AC/A, arm circumference-for-age; TS/A, triceps skinfold-for-age; AMA/A, arm muscle area-for-age; AFA/A, arm fat area-for-age.
a,b,c Mean values within a row with unlike superscript letters were significantly different (P < 0·05; Scheffé's test).
Figure 1 shows Z-W at the onset of elementary school in 1987 classified according to AAT 1998 scores expressed in quartiles. Although the prevalence of undernutrition was 13·1 and 4·6 %, normal nutritional status 68·9 and 56·9 %, overweight 11·5 and 29·2 % and obesity 6·6 and 9·2 % in Q1 and Q4, respectively, differences were not significant. Z-H at the onset of elementary school in 1987 classified by AAT 1998 scores and expressed in quartiles is shown in Fig. 2. Although height was normal in most of the children in 1987 (75·4 %), severe growth failure decreased from 3·3 to 0 % from Q1 to Q4, and moderate growth failure from 27·9 to 9·2 %, respectively; on the contrary, students considered tall increased from 4·9 % in Q1 to 15·4 % in Q4 (P < 0·05). Figure 3 illustrates nutritional status expressed as Z-HC for school-age children enrolled in elementary first grade in 1987 in relation to their AAT scores in 1998 divided in quartiles; 41·9 and 21·6 % of Q1 and Q4 school-age children had Z-HC values in 1987 below the mean. In this respect, 4·8 and 0 % of children from Q1 and Q4 had Z-HC values in 1987 < − 2 sd, respectively. Students with Z-HC values in 1987 >2 sd represented 1·6 and 12·3 % of Q1 and Q4. School-age children with Z-HC values in 1987 >2 sd increased approximately eight times from the lowest (Q1) to the highest (Q4) AAT scores (P < 0·02). As defined by Z-W/H values in 1987, 1·2 % of school-age children were undernourished, 66·4 % well-nourished, 23·8 % were overweight and 8·6 % were obese, without significant differences by AAT score in 1998.
Nutritional status expressed as weight-for-age z-score (Z-W) of Chilean school-age children at the onset of elementary school in 1987 by academic aptitude test (AAT) score in 1998 divided into quartiles (Q). (■), Undernourished, Z-W < − 1 sd; ![]() , well-nourished, Z-W between − 1 sd and +1 sd; (□), overweight, Z-W between >+1 sd and +2 sd; (
, well-nourished, Z-W between − 1 sd and +1 sd; (□), overweight, Z-W between >+1 sd and +2 sd; (![]() ), obesity, Z-W >+2 sd. The χ2 test was calculated joining the categories of Q1+Q2 and Q3+Q4 (
), obesity, Z-W >+2 sd. The χ2 test was calculated joining the categories of Q1+Q2 and Q3+Q4 (![]() (df 3) 6·025 <
(df 3) 6·025 < ![]() (df 3) 7·815; P < 0·05).
(df 3) 7·815; P < 0·05).

Nutritional status expressed as height-for-age z-score (Z-H) of Chilean school-age children at the onset of elementary school in 1987 by academic aptitude test (AAT) score in 1998 divided into quartiles (Q). (■), Severe growth failure, Z-H < − 2 sd; (![]() ), moderate growth failure, Z-H between < − 1 sd and − 2 sd; (□), normal height, Z-H between − 1 sd and +1 sd; (
), moderate growth failure, Z-H between < − 1 sd and − 2 sd; (□), normal height, Z-H between − 1 sd and +1 sd; (![]() ), tall, Z-H >+1 sd. The χ2 test was calculated joining the categories of severe and moderate growth failure (
), tall, Z-H >+1 sd. The χ2 test was calculated joining the categories of severe and moderate growth failure (![]() (df 6) 15·000>
(df 6) 15·000>![]() (df 6) 12·592; P < 0·05).
(df 6) 12·592; P < 0·05).

Nutritional status expressed as head circumference-for-age z-score (Z-HC) of Chilean school-age children enrolled in elementary first grade in 1987 by academic aptitude test (AAT) score in 1998 divided into quartiles (Q). (■), Z-HC < − 2 sd; (![]() ), Z-HC between < − 1 sd and − 2 sd; (
), Z-HC between < − 1 sd and − 2 sd; (![]() ), Z-HC between < mean and − 1 sd; (□), Z-HC between mean and +1 sd; (
), Z-HC between < mean and − 1 sd; (□), Z-HC between mean and +1 sd; (![]() ), Z-HC between >+1 sd to +2 sd; (
), Z-HC between >+1 sd to +2 sd; (![]() ), Z-HC >+2 sd. The χ2 test was calculated joining the categories of Q1+Q2 and Q3+Q4 (
), Z-HC >+2 sd. The χ2 test was calculated joining the categories of Q1+Q2 and Q3+Q4 (![]() (df 5) 14·323>
(df 5) 14·323>![]() (df 5) 13·388; P < 0·02).
(df 5) 13·388; P < 0·02).

Table 3 shows the intellectual, demographic and educational variables at the onset of elementary school in 1987 by AAT scores in 1998 divided into quartiles. IA in 1987 was positively and significantly associated with AAT scores in 1998. The highest values for AAT scores in 1998 were obtained by urban dwellers, males and by those attending private non-subsidised schools. At the beginning of elementary school Q1 children already presented SA levels significantly lower compared with the other groups in both LA and MA. The percentage of attendance in 1987 did not vary by AAT scores in 1998. Age in 1987 (mean 6·5 (sd 0·4) years) did not differ significantly by AAT scores in 1998.
Intellectual, demographic and educational variables of Chilean school-age children at the onset of elementary school in 1987 by academic aptitude test (AAT) score in 1998 expressed as quartiles (Q)

IA, intellectual ability; SA, scholastic achievement; F, variance; LA, Spanish language achievement; MA, mathematics achievement.
a,b,c Mean values within a row with unlike superscript letters were significantly different (P < 0·05; Scheffé's test).
* IA grades: grade I, superior; grade II, above average; grade III, average; grade IV, below average; grade V, intellectually defective. ![]() (df 12) 45·688>
(df 12) 45·688>![]() (df 12) 32·909 (P < 0·001).
(df 12) 32·909 (P < 0·001).
† ![]() (df 3) 11·879>
(df 3) 11·879>![]() (df 3) 11·341 (P < 0·01).
(df 3) 11·341 (P < 0·01).
‡ Fisher P = 0·0018. Fisher's test was calculated joining the categories (Q1+Q2) and (Q3+Q4).
§ ![]() (df 6) 42·654>
(df 6) 42·654>![]() (df 6) 22·457 (P < 0·001).
(df 6) 22·457 (P < 0·001).
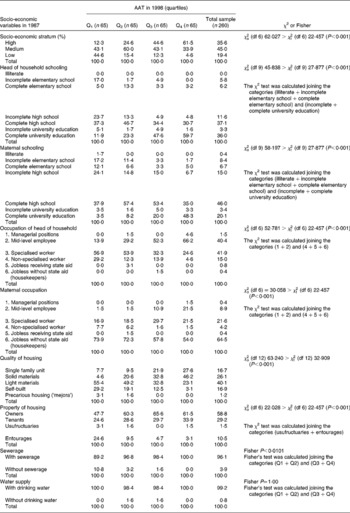
Most of the Q4 school-age children belonged to high or medium SES, had head of household and mother with higher schooling and occupational levels, with better characteristics of the quality of housing, higher proportion of ownership and better sanitation, especially sewerage (Table 4). As stated previously, mean maternal schooling and schooling of the head of the household in 1987 were significantly higher in school-age children from Q4 compared with their peers from Q1 (Table 5). An inverse relationship was found between the AAT scores in 1998 and the number of family members (r − 0·050; NS), number of siblings (r − 0·096; NS) and place among them (r − 0·089; NS) and crowding (r − 0·181; P < 0·01) (Table 5). Family alcoholism was significantly higher in school-age children from Q1 compared with Q4 (r − 0·228; P < 0·001). In fact, 31 % of school-age children from Q1 had an alcoholic parent (mainly the father) compared with those from Q4 (9·4 %). The father was the head of household in 91·9 % of school-age children, the mother in 5·4 % and another individual in 2·7 %, without significant differences by AAT scores in 1998.
Socio-economic variables of Chilean school-age children at the onset of elementary school in 1987 by academic aptitude test (AAT) score in 1998 expressed as quartiles (Q) (% of cases)
(Mean values and standard deviations)

F, variance.
a,b,c Mean values within a row with unlike superscript letters were significantly different (P < 0·05; Scheffé's test).
Non-written mass media exposure in 1987 by AAT scores in 1998 expressed as quartiles are shown in Table 6. Only television watching registered a slight but significant difference in relation to AAT scores, since school-age children from Q1 had significantly higher television exposure compared with those from Q4. Written mass media exposure in 1987, newspapers, magazines and books, did not show significant differences related to AAT scores in 1998.
(Mean values and standard deviations)

F, variance.
a,b Mean values within a row with unlike superscript letters were significantly different (P < 0·05; Scheffé's test).
Table 7 shows the Pearson correlation coefficients between AAT scores in 1998 and the most relevant parameters. All of them were significantly interrelated and were included in the multiple regression analysis. As a result, the multiple regression analysis between AAT scores in 1998 as a continuous variable (dependent variable) and the most relevant parameters entered in the statistical regression model (independent variables) (Table 8) confirms that SA in 1987 (r 2 0·220), maternal schooling in 1987 (r 2 0·118), IA in 1987 (r 2 0·047) and Z-HC in 1987 (r 2 0·017) were the independent variables with the greatest explanatory power for variance in AAT scores in 1998 (r 2 0·402).
Pearson correlation coefficients for the most relevant parameters associated with academic aptitude test (AAT) score in 1998 expressed as a continuous variable

SA, scholastic achievement; MS, maternal schooling; SES, socio-economic stratum; HS, head of household schooling; IA, intellectual ability; TS, type of school; Z-HC, head circumference-for-age z-score; Z-H, height-for-age z-score; Z-W, weight-for-age z-score; TV, television exposure.
*P < 0·05; **P < 0·01; ***P < 0·001; ****P < 0·0001.
Multiple regression analysis (PROC GLM error type III) between academic aptitude test (AAT) score in 1998 expressed as a continuous variable (dependent variable) and the most relevant parameters (independent variables)*

SA, scholastic achievement; IA, intellectual ability; Z-HC, head circumference-for-age z-score.
* PROC GLM general linear models procedure (SAS Institute, Inc., Cary, NC, USA). Root mean squared error (standard deviation of the dependent variable AAT) = 92·681704; model F value = 38·26 (P < 0·0001).
Discussion
The results of the present study reveal that 40·2 % of the variance in AAT achievement, the baccalaureate examination for university admission in Chile, could be explained by some variables at the onset of elementary school, such as SA, maternal schooling, IA and Z-HC. However, although most variation in the variance in AAT achievement is not predictable from the first-grade background characteristics, it is noticeable that these accounted for the 40 % of the variance in the AAT. AAT scores below 450 impeded students from applying to higher education and these scores were obtained mainly by those children from Q1 and Q2 who exhibited a more deprived nutritional, intellectual, socio-economic, socio-cultural, family and educational situation at the onset of elementary school.
SA in the first grade of elementary school in 1987 was the most important predictor of a successful achievement in the AAT in 1998 12 years later, since it attained first place in the statistical regression model. Previous results showed a high degree of correlation between AAT score and SA both for males and females(Reference Ivanovic, Almagia and Toro8). On the other hand, SA positively and significantly correlates with genetic and environmental factors, such as child IQ, maternal and parental IQ, birth weight, birth height, undernutrition in the first year of life, Z-HC and brain volume; however, the child's IQ is the most important variable that explains SA and AAT variances(Reference Ivanovic, Pérez and Olivares5, Reference Ivanovic, Pérez, Leiva and Dupri6, Reference Ivanovic, Almagia and Toro8–Reference Ivanovic, Leiva and Pérez10, Reference Ivanovic, Ivanovic and Truffello47). It is well known that SA is significantly higher in students attending private non-subsidised schools, originating from high SES and urban areas. This is logical since private non-subsidised schools offer the best quality of education, have adequate infrastructure, they hire teachers with a better academic background who apply methodologies based on best practices and, in addition, they enrol school-age children with superior IA from the high SES, whose parents have higher levels of income and schooling and live in better housing conditions; this probably creates environmental conditions more adequate for the learning process(Reference Ivanovic, Pérez and Olivares5, Reference Ivanovic, Forno and Ivanovic14, Reference Ivanovic, Ivanovic and Truffello47, Reference Ivanovic, Castro and Ivanovic65). In the present study, the inverse relationships between the number of family members and siblings, the place among siblings and crowding, and the AAT score in 1998 is similar to the findings of other investigators; this may be explained by the fact that more children in a household imply a dilution of resources as well as of the time available for appropriate care or stimulation(Reference Downey66).
Maternal schooling in 1987 occupied the second place in the statistical regression model and was the most important socio-economic and socio-cultural predictor that explains AAT scores in 1998. This confirms our previous results that maternal schooling is the most relevant socio-economic and socio-cultural variable that explains SA and IA(Reference Ivanovic, Pérez, Leiva and Dupri6, Reference Ivanovic, Almagia and Toro8, Reference Ivanovic, Leiva and Perez9, Reference Ivanovic, Forno and Castro13, Reference Ivanovic, Forno and Ivanovic14, Reference Ivanovic, Castro and Ivanovic65). Maternal schooling is probably related with a higher maternal IQ that may favour a more intensive stimulation of the child(Reference Agarwal, Awasthy and Upadilla67–Reference Smith, Landry and Swank69). On the other hand, the positive and significant impact of parental schooling, especially maternal schooling, on children's IQ has been described by several authors(Reference Nelson and Deutschberger38, Reference Carter, Resnick and Ariet70–Reference Sandiford, Cassel and Sanchez73). The impact on SA of the quality of housing may also be related to a more intensive stimulation of the child. The same explanation may be used for other socio-economic variables such as SES, maternal and paternal occupation, head of household (father), sewerage and water supply, which were found to be positively and significantly correlated with SA, results that are in agreement with those from other authors, although these did not contribute to explain SA variance(Reference Schiefelbein and Farrel11, Reference Schiefelbein and Simmons12, Reference Clifton74–Reference Vera Noriega, Mejia and Saucedo76). Other findings have revealed that the presence of the father in the household is associated with significant differences favouring the academic achievement of boys and girls(Reference Sciara77). Socio-economic conditions are also strongly correlated with the quality of stimulation at home, so that SA probably does not depend solely on the IQ, but also on environmental factors. The positive impact of parental (especially maternal) IQ has been underlined as one of the most important environmental factors affecting children's intelligence and may be related to the quality of the stimulation provided, which in conditions of poverty is strongly limited by lower schooling levels(Reference Ivanovic, Leiva and Pérez10, Reference Nelson and Deutschberger38, Reference Agarwal, Awasthy and Upadilla67–Reference Sandiford, Cassel and Sanchez73, Reference Crandell and Hobson78). Other findings reveal that, regardless of class or marital status, mothers have primary responsibility over school choice(Reference David79). A recent study suggests that parents who demonstrated more warmth and engaged in more discussions concerning academic and intellectual matters with their adolescent offspring also had higher school aspirations for their adolescents, and these had the better school grades. In contrast, in adolescents who were characterised by below-average ability, parental school involvement and capability beliefs demonstrated the worst school performance(Reference Juang and Silbereisen80).
IA in 1987 appears as the third predictor of AAT achievement in 1998 and is one of the most important determinant for SA in all grades and age-groups(Reference Ivanovic, Belleï and Fiabiane1, Reference Ivanovic, Pérez and Olivares5, Reference Ivanovic, Pérez, Leiva and Dupri6, Reference Ivanovic, Almagia and Toro8–Reference Ivanovic, Leiva and Pérez10, Reference Ivanovic, Ivanovic and Truffello47, Reference Cassidy and Lynn81, Reference Rostain82). Our previous findings revealed that in the sample of the present study, IA is the most important variable that explains SA at the onset of elementary school(Reference Ivanovic, Ivanovic and Truffello47); however, these results are not different from our recent studies in Chilean school-age children graduating from high school, since intelligence explains approximately 90 % of SA and AAT variances in both males and females(Reference Ivanovic, Almagia and Toro8–Reference Ivanovic, Leiva and Pérez10).
HC in 1987 is the fourth predictor of AAT achievement in 1998. HC is an indicator of both nutritional background and brain development; children with the lowest scores in the AAT in 1998 had the lowest Z-HC values. From this, we hypothesise that children with suboptimal HC have some degree of alteration of their brain development associated with the lower SA, IA and AAT scores and this was confirmed by our previous studies(Reference Ivanovic, Belleï and Fiabiane1, Reference Ivanovic, Leiva and Castro3–Reference Ivanovic, Pérez, Leiva and Dupri6, Reference Ivanovic, Almagia and Toro8–Reference Ivanovic, Leiva and Pérez10, Reference Ivanovic, Forno and Castro13, Reference Ivanovic, Ivanovic and Truffello47). The age-dependent HC:brain volume relationship, particularly in young children, is an accurate, rapid and inexpensive parameter of brain size and growth(Reference Bartholomeusz, Courchesne and Karns23). Results from several authors reported positive and significant correlations between SA, maternal schooling, maternal IQ, child IQ, HC and brain size(Reference Ivanovic, Belleï and Fiabiane1, Reference Ivanovic, Leiva and Castro3–Reference Ivanovic, Pérez, Leiva and Dupri6, Reference Ivanovic, Almagia and Toro8–Reference Ivanovic, Leiva and Pérez10, Reference Ivanovic, Forno and Castro13, Reference Ishikawa, Furuyama and Ishikawa21, Reference Bartholomeusz, Courchesne and Karns23, Reference Botting, Powls and Cooke27, Reference Emond, Lira and Lima31–Reference Ounsted, Moar and Scott39, Reference Willerman, Schultz and Rutledge45, Reference Casey, Whiteside-Mansell and Barrett46, Reference Andreasen, Flaum and Swayze83–Reference Reiss, Abrams and Singer85). As previously stated, educational desertion relates to HC but not to weight or height(Reference Ivanovic, Olivares and Castro22). This could explain that only Z-HC in 1987 entered in the statistical regression model, since undernourished children in 1987 did not achieve lower AAT scores in 1998 than their well-nourished peers in 1987. Children with growth failure in 1987 achieved slight but significantly lower results than their peers with normal or above-average height in 1987; however, the statistical significance for the association between AAT score in 1998 and HC was higher. Differences in HC (or brain size) at the onset of elementary school are relevant to explain differences in AAT score 12 years later. This fact is relevant since at age 6 years when children begin their elementary school, 90 % of adult Z-HC is already completed and emphasises the importance of an adequate nutrition in the prenatal life and during the first 2 years of life(53). The first 2 years of life represent the period of maximum brain growth and by the end of the first year of life, 70 % of the adult brain weight has been attained(Reference Ivanovic, Olivares and Castro22, Reference Stoch, Smythe and Moodie25). In a previous study comparing undernourished and well-nourished poor Chilean high-school graduates, the most relevant independent variables explaining IQ were, in decreasing order, maternal schooling, brain volume and undernutrition in the first year of life (r 2 0·714) and IQ explained most part of SA variance (r 2 0·860)(Reference Ivanovic, Leiva and Perez9). Findings from other authors revealed that late entry into secondary school was more frequent among the small-for-gestational-age than in the appropriate-for-gestational-age children after adjustments were made for maternal age and educational level, parental socio-economic status, family size, and sex. A significantly higher proportion of term, small-for-gestational-age adolescents failed to take or pass the baccalaureate examination than the appropriate-for-gestational-age adolescents. Small-for-gestational-age participants with a smaller HC entered secondary school later more often than their small-for-gestational-age peers with a larger HC, but the association was not significant after adjustment(Reference Larroque, Bertrais and Czernichow86).
School desertion has always been a permanent concern in Chile. During the decade of the 1980s, an important increase was observed in graduation from elementary and high schools and in the enrolment into university education when comparing with previous decades. In the 1990s, of those attending elementary and high schools, graduation increased to 79 and 53 %, respectively, and 42 % enrolled into higher education. These retention rates represent approximately those found in the present study, since 55·5 % of the located sample incorporated in 1987 graduated from high school in 1998, and 41 % took the AAT for university admission in 1999; however, this also means that 59 % of school-age children did not take the AAT and did not enrol into higher education.
Since 1990, a Quality of Education Improvement Program (MECE) has been implemented to improve the quality of the educational process, equity and efficiency of the conditions, processes and outcomes at all levels of the educational system, focusing efforts especially on the more deprived children(87, 88). This is relevant, since in the sample that was the object of the present study SES, IA, SA and Z-HC at the onset of elementary school in 1987 were the independent variables with the greatest explanatory power for the educational status of school-age children in 1998 and significantly affected school dropout rates(Reference Ivanovic, Rodríguez and Pérez7).
Despite all efforts through public policies to improve health and education focused on the most deprived children and starting from an early age(87, 88), 59 % of the sample of the located schoolchildren did not take the AAT. This means that most students do not take a pathway that, through attendance to a university, will lead to improvements of their living standards and will emphasise the extremity of socio-economic disparities in Chile. AAT scores below 450 bar students from applying to higher education and these scores were obtained mainly by children from Q1, who failed the AAT. They also exhibited a more deprived global situation at the onset of elementary school and were exposed from an early age to multiple risks. In consequence, they subsequently hold low-paying jobs that result in unfavourable conditions for their own children, thus contributing to the vicious circle of poverty(Reference Yaqub89, Reference Grantham-McGregor, Cheung and Cueto90). UNICEF has stated that the rates of high school desertion have been insufficiently studied, considering that more than a million and a half children between 15 and 24 years of age have not completed their high school(91, 92).
In conclusion, (i) the low proportion of high-school graduates and the low percentage of students who take the AAT are in agreement with the Chilean national school retention rates; (ii) however, a shortcoming of the present study is that 22·3 % of the original sample could not be located; it is probable that some of them graduated from high school in other parts of Chile(Reference Ivanovic, Rodríguez and Pérez7); (iii) considering the relevant impact of SA, maternal schooling, IA and Z-HC (an anthropometric indicator of nutritional background and brain development and the most sensitive physical index of undernutrition at an early age) as risk factors present at an early age that explain AAT scores 12 years later, the present results emphasise that children under the age of 3 years, and pregnant or breast-feeding mothers should be the centre of public policies of education and food and nutritional safety in order to protect their infants even before they are born(93).
The present results reveal that some developmental variables present in children at the onset of elementary school are relevant in explaining AAT scores and these risk factors could predict achievement 12 years later. These findings do not imply determinism and to some extent may be reversible. Along the school years, the nutritional, family, educational and socio-economic conditions of the more deprived children could be improved but the educational system, mainly in developing countries, does not constitute an adequate organisation geared to provide help to these students according to their individual differences. For example, schools lack multi-professional health teams including physicians, psychologists, nurses, or nutritionists who could support the pedagogical process. Providing opportunities remains vital throughout life for sustained socio-economic improvement in order to avoid poor children growing into poor adults(Reference Yaqub89). Taking into account these findings, a health and educational plan for school-age children with special needs at an early age could be a successful initiative.
Acknowledgements
The authors are very grateful to the Ministry of Education of Chile for all the facilities given to carry out this research, and to Oscar Brunser, MD, for helpful comments and suggestions.
The present study was supported in part by grants 1841167 and 1880818 from the National Fund for Scientific and Technologic Development (FONDECYT), grants S 2169-924 F and EO11-97/2 from the Research and Development Department (DID), University of Chile and grant 019/1997 from the University of Chile, Postgraduate Department.
The data for the present paper are part of two theses submitted by M. del P. N. R. and by A. L. C. in partial fulfilment of the requirements for the Master of Nutritional Sciences degree from the Institute of Nutrition and Food Technology (INTA), University of Chile and for the Master of Public Health (MPH) from the School of Public Health, Loma Linda University, respectively.
D. M. I. and R. M. I. are guarantors and participated in all the steps of the research. M. del P. N. R. and A. L. C. were responsible for the field study and conscript data. H. T. P., J. A. A., A. F. A. and T. D. T. contributed to writing and refining of the manuscript. M. S. C. U. was responsible for the intellectual assessment. Nora Díaz and Bárbara Leyton performed the statistical analysis.
The authors declare no conflict of interest.


