


Introduction
Many ecological factors have been suggested as influencing rates of speciation and extinction, including feeding type (Levinton Reference Levinton1974), population size (Boucot Reference Boucot1975), range of environmental tolerance (Jackson Reference Jackson1974), and dispersal ability (Lester et al. Reference Lester, Ruttenberg, Gaines and Kinlan2007). Marine gastropods in particular have been the subject of much study of the role of dispersal in speciation (Hansen Reference Hansen1978; Jablonski Reference Jablonski1987; Jablonski and Valentine Reference Jablonski and Valentine1990; McKinney Reference McKinney1997; Crampton et al. Reference Crampton, Cooper, Beu, Foote and Marshall2010). However, relatively few studies have been conducted placing larval modes in species-level phylogenetic context (Collin Reference Collin2004; Krug et al. Reference Krug, Vendetti, Ellingson, Trowbridge, Hirano, Trathen, Rodriguez, Swennen, Wilson and Valdés2015; Sang et al. Reference Sang, Friend, Allmon and Anderson2019). Those that have, have not incorporated fossil data, while landmark macroevolutionary studies on fossil clades (Jablonski and Lutz Reference Jablonski and Lutz1983; Jablonski Reference Jablonski1986; Hansen Reference Hansen1997) have not considered both phylogenetic context and net speciation (speciation–extinction) rates (Krug et al. Reference Krug, Vendetti, Ellingson, Trowbridge, Hirano, Trathen, Rodriguez, Swennen, Wilson and Valdés2015). Traits that lead to increasing rates of speciation might also lead to a proportionally greater increase in rates of extinction, resulting in lower net diversification of the clade possessing said trait (Goldberg et al. Reference Goldberg, Kohn, Lande, Robertson, Smith and Igić2010).
Gastropods are among the many marine invertebrates that undergo a two-stage life cycle. The adult gastropod body plan typically results in restricted mobility relative to the dispersal that occurs while in the larval form. Two larval types (or developmental modes) are generally recognized in the literature: planktotrophic and non-planktotrophic (Thorson Reference Thorson1950; Jablonski and Lutz Reference Jablonski and Lutz1983). Planktotrophs (PTs) feed on the plankton, meaning their dispersal potential is not nutrient limited (Thorson Reference Thorson1950), and the adults produce relatively larger numbers of eggs. Non-planktotrophs (NPTs) have a higher per-offspring investment, potentially increasing survival, but produce fewer eggs (Jablonski and Lutz Reference Jablonski, Lutz, Rhoads and Lutz1980). NPTs include species with both lecithotrophic (planktonic, but yolk-feeding) and direct-developing larvae. Because non-planktotrophic larvae lack the structures that facilitate feeding within the plankton, they are expected to have more restricted dispersal and consequently both lower population interconnectivity (potentially increasing speciation rates) and smaller geographic ranges (potentially increasing extinction risk; Jablonski and Lutz Reference Jablonski, Lutz, Rhoads and Lutz1980). The exact nature of the relationship between geographic range and speciation is paradoxical (Jablonski Reference Jablonski2017), as greater dispersal ability may lead to either increased chances of the formation of peripheral isolates or higher interpopulation connectivity, depressing speciation (Boucot Reference Boucot1975; Stanley Reference Stanley1986; Allmon and Martin Reference Allmon and Martin2014).
The consequences of larval ecology in macroevolutionary processes have long been discussed in the paleobiological literature. Jackson (Reference Jackson1974) and Scheltema (Reference Scheltema, Kauffman and Hazel1977, Reference Scheltema, Beardmore and Battaglia1978, Reference Scheltema1979) developed a model to think about the effect of larval dispersal ability (i.e., larval type) on speciation and extinction rates. In this model, species with planktotrophic larvae (and thus the potential to disperse over a large geographic area) can easily maintain gene flow between populations, because larvae from outside populations constantly “replenish” (Zelnik et al. Reference Zelnik, Solomon and Yaari2015) populations that are reduced by local disturbances (which are not likely to completely extinguish a widespread species from its whole geographic range). These conditions theoretically result in species with long durations, and lineages display low extinction rates. Species with non-planktotrophic larvae are likely to have more restricted geographic ranges, and extinction is more likely to occur due to local disturbances and randomly fluctuating populations. Consequently, NPTs are generally predicted to have a geologically short duration, and lineages are predicted to have higher extinction rates (Jablonski and Lutz Reference Jablonski and Lutz1983). Depending on the environmental or ecological mechanisms driving extinction, however, either planktotrophy or non-planktotrophy may be selectively advantageous for reasons unrelated to dispersal potential (Shuto Reference Shuto1974; Jablonski and Lutz Reference Jablonski, Lutz, Rhoads and Lutz1980); for example, non-planktotrophy may be favored when regional productivity declines (Sang et al. Reference Sang, Friend, Allmon and Anderson2019).
Dispersal ability also affects the rate of speciation. Wide dispersal of larvae effectively mixes genes from disjunct populations, suppressing genetic divergence required for speciation. This model hypothesizes, then, that planktotrophic lineages have relatively low speciation rates. In contrast, larvae with restricted dispersal ability form local populations that remain isolated after the initial colonization, meaning NPT lineages likely have higher speciation rates. The end result of this model is that planktotrophic species have relatively longer durations, lower extinction rates, and low speciation rates; while species with non-planktotrophic larvae have relatively shorter durations, higher extinction rates and higher speciation rates. Alternatively, planktotrophic lineages may have more opportunities to form peripheral isolates, leading to high speciation rates as well.
A primitive planktotrophic larval mode characterizes many gastropod clades, as determined by phylogenetic methods, for example, Turritellidae (Lieberman et al. Reference Lieberman, Allmon and Eldredge1993; Sang et al. Reference Sang, Friend, Allmon and Anderson2019), Kermia and Pseudodaphnella (Fedosov and Puillandre Reference Fedosov and Puillandre2012), Conus (Duda and Palumbi Reference Duda and Palumbi1999), and neogastropods (Hansen Reference Hansen1982). However, while planktotrophic species usually give rise to non-planktotrophic species, the reverse seems to be a rare exception (Reid Reference Reid1989). Of the groups mentioned, direct development has independently arisen at least two times, and there were no reversals back to planktotrophy. The lack of reversals can be attributed to the inability to redevelop the specialized feeding and swimming features that characterize planktotrophic larvae once they have been lost (e.g., Strathmann Reference Strathmann1974, Reference Strathmann1978). High rates of irreversible character change can result in the accumulation of distantly related NPTs in the fossil record, similar to state-dependent diversification (which is one aspect of species sorting) (Duda and Palumbi Reference Duda and Palumbi1999).
Exceptions are seen in Lacuninae (Littorinidae) (Reid Reference Reid1989) and Crepipatella (Calyptraeidae) (Collin et al. Reference Collin, Chaparro, Winkler and Veliz2007), for which reversals from non-planktotrophy to planktotrophy are inferred. In such cases, non-planktotrophic larvae retain the specialized feeding and swimming structures, making the transition from non-planktotrophy back to planktotrophy possible (Collin Reference Collin2004; Collin et al. Reference Collin, Chaparro, Winkler and Veliz2007; Collin and Miglietta Reference Collin and Miglietta2008).
Little empirical evidence has been produced regarding the macroevolutionary effects of larval mode in phylogenetic context (Krug et al. Reference Krug, Vendetti, Ellingson, Trowbridge, Hirano, Trathen, Rodriguez, Swennen, Wilson and Valdés2015). There are various reasonable macroevolutionary scenarios that may be governed by larval mode, if one considers transitions unidirectional from planktotrophy to non-planktotrophy:
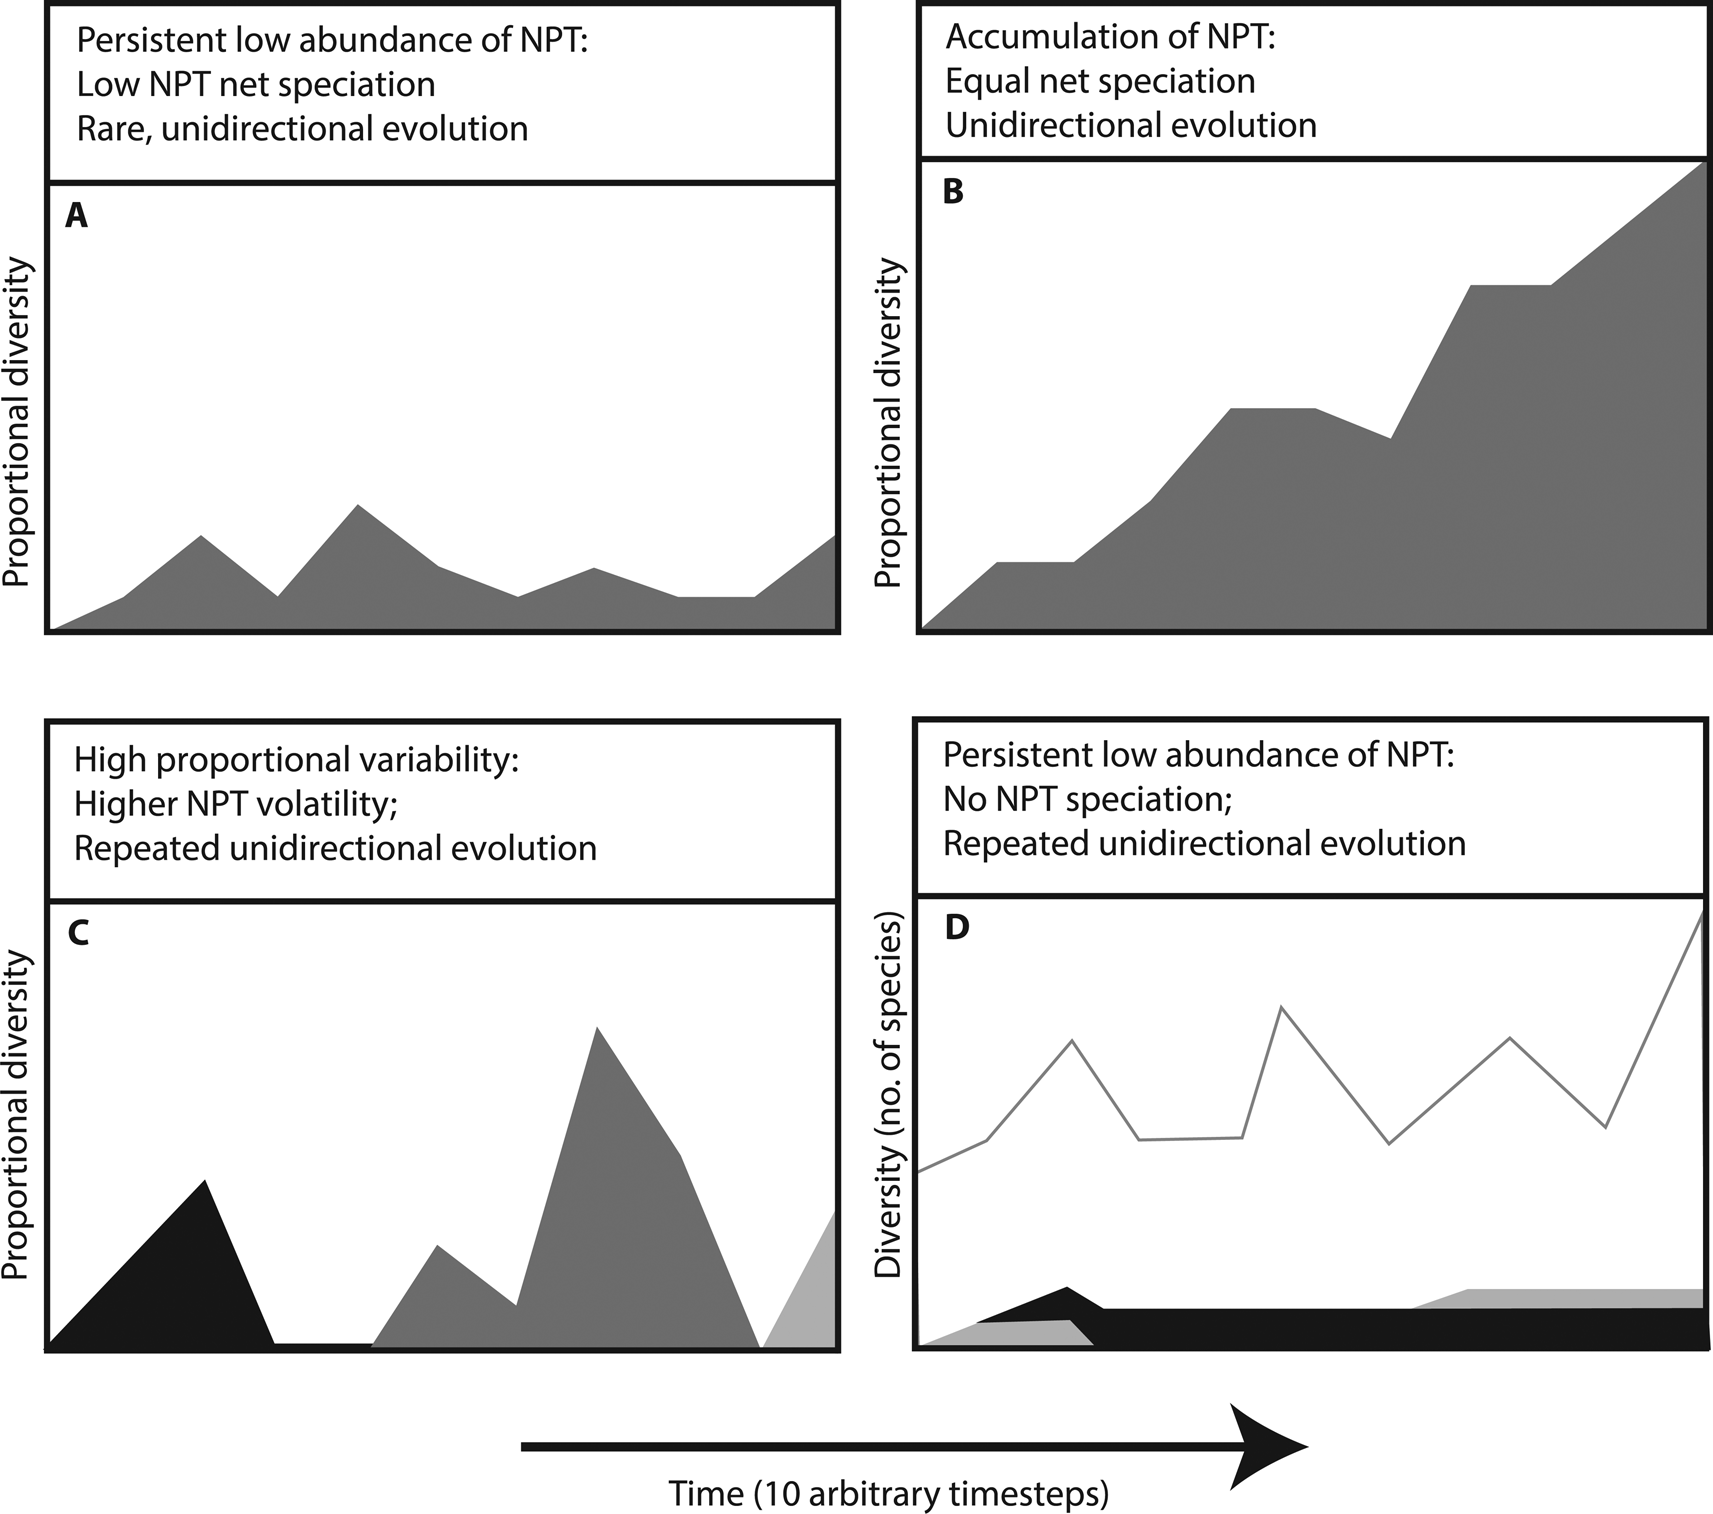
1. NPTs may have rare origins from PTs and lower speciation rates, leading to persistence at low relative diversity (Fig. 1A).
2. NPTs may have equal or higher net speciation (speciation–extinction) rates and accumulate passively due to the one-way nature of the transitions (Fig. 1B).
3. NPTs may have higher speciation and extinction rates due to their low population sizes and low connectivity. This high volatility (Gilinsky Reference Gilinsky1994; J. C. Lamsdell, personal communication) would result in strong fluctuations of relative diversity, but frequent extinction of non-planktotrophic lineages (Fig. 1C).
4. NPTs may have extremely low speciation rates. Under these conditions, the total diversity of NPTs is dictated by the frequency of transitions relative to extinction (Fig. 1D). It is possible to envision a scenario (however unlikely) in which NPTs never speciate but there is a higher than 50% production of NPTs during planktotrophic speciation events coinciding with larval mode transitions. This would eventually drive the clade to extinction through decreasing speciation rates without necessarily requiring increased extinction rates.
Proposed effects of non-planktotrophy on the proportion of planktotrophic (PT) taxa (white) to non-planktotrophic (NPT) taxa (filled) based on speciation and extinction rates in four theoretical models of macroevolution. A, Rare origins of new non-planktotrophic lineages from planktotrophic taxa coupled with low speciation rates lead to persistence at low relative diversity. B, Non-planktotrophic lineages of equal or higher net speciation than planktotrophic lineages accumulate passively due to the one-way nature of the transitions. C, Non-planktotrophic lineages with higher rates of both speciation and extinction due to their low population sizes and low connectivity would result in strong fluctuations of relative diversity, with frequent extinction of non-planktotrophic lineages. D, For non-planktotrophic lineages with extremely low speciation rates, the total diversity is dictated by the frequency of new non-planktotrophic lineages from planktotrophic taxa relative to extinction rate.
Larval type can often be confidently inferred from fossil gastropod shells, because the size and shape of the protoconch (larval shell) (Vendetti Reference Vendetti2007; Sang et al. Reference Sang, Friend, Allmon and Anderson2019) differ between the two modes. A large protoconch with few whorls (paucispiral) indicates a non-planktotrophic larval stage after hatching from a large yolked egg, whereas small, multispiral protoconchs generally indicate a longer planktonic period (PT).
Investigations into potential connections between larval type and evolutionary patterns in several neogastropod families (e.g., Hansen Reference Hansen1978, Reference Hansen1982) found that (consistent with the model outlined in Jackson [Reference Jackson1974] and Scheltema [Reference Scheltema, Kauffman and Hazel1977]) species with non-planktotrophic larvae had narrower geographic ranges than species with planktotrophic larvae. Crampton et al. (Reference Crampton, Cooper, Beu, Foote and Marshall2010) modeled the relationships between geographic range, species duration, size, and other traits in mollusks and found positive relationships between body size and geographic range as well as geographic range and species duration. Gastropod species duration displayed two-way associations between life mode (e.g., infaunal, epifaunal), and feeding type (e.g., deposit-feeder, grazer, carnivore). Planktotrophic larval type was associated with wide geographic range only via species duration (through a three-way interaction). Other authors found that geographic range and duration had a reciprocal relationship in marine invertebrates and microfossils. Foote et al. (Reference Foote, Crampton, Beu and Cooper2008) concluded that duration determines range as much as range determines duration.
While the studies cited have supplied an abundance of data on the associations between larval ecology and species-level traits (i.e., traits emergent at the species level; Jablonski Reference Jablonski2000, Reference Jablonski2017; Congreve et al. Reference Congreve, Falk and Lamsdell2018) of geographic range and population interconnectivity, they did not explicitly test the macroevolutionary outcomes (in terms of speciation and extinction). In other words, they did not test for species selection (Stanley Reference Stanley1975; Krug et al. Reference Krug, Vendetti, Ellingson, Trowbridge, Hirano, Trathen, Rodriguez, Swennen, Wilson and Valdés2015). While Krug et al. (Reference Krug, Vendetti, Ellingson, Trowbridge, Hirano, Trathen, Rodriguez, Swennen, Wilson and Valdés2015) examined larval mode selection in a phylogenetic context, their results are not comparable to other tests of species sorting and selection, because no sea slug fossil lineages were included when calculating net speciation. Other authors have noted the problems in inferring speciation and extinction rates using phylogenies constructed with only extant species (Quental and Marshall Reference Quental and Marshall2009; Liow et al. Reference Liow, Quental and Marshall2010; Rabosky Reference Rabosky2010; Marshall Reference Marshall2017).
Early investigators focused on differential survival of species based on organismal traits present in all members of a given species (Stanley Reference Stanley1975, Reference Stanley1979; Arnold and Fristrup Reference Arnold and Fristrup1982; Coyne and Orr Reference Coyne and Orr2004; Okasha Reference Okasha2006), more precisely termed “species sorting” (Vrba and Gould Reference Vrba and Gould1986; Lieberman and Vrba Reference Lieberman and Vrba1995). But in its strict sense, species selection refers to the emergent fitness (differential origination and extinction of species) within clades due to species-level emergent traits, while the observation of differential outcomes among species as a result of unexpected (emergent) higher-level consequences of traits possessed by all individuals of a species is more properly termed “species sorting” (Vrba and Gould Reference Vrba and Gould1986; Jablonski Reference Jablonski2000).
Hansen's (Reference Hansen1978) research on Paleogene Volutidae (Neogastropoda) found that the first appearance of non-planktotrophy resulted in more appearances of non-planktotrophic species, but in the absence of phylogenetic context, the frequency of larval mode transitions remains unknown, as do which lineages (PTs or NPTs) have higher speciation, extinction, or net-speciation rates. In his attempt to link larval mode with speciation, Hansen assumed that larval mode transitions were unidirectional and that the accumulation of NPTs is exponential (scenario shown in Fig. 1B). He concluded that increased speciation rates resulting from restricted dispersal ability (via larval mode transition) could have resulted in the strictly non-planktotrophic family of extant volutids (Darragh and Ponder Reference Darragh and Ponder1998; Penchaszadeh et al. Reference Penchaszadeh, Miloslavich, Lasta and Costa1999). Yet the prevalence of planktotrophic species in families other than Volutidae argues against the possibility that there is a universal advantage, independent of other traits and environmental circumstances, to having non-planktotrophic larvae.
Here we reexamine Hansen's conclusions on the effects of dispersal ability (via larval type) on speciation and evaluate several scenarios that could be responsible for the proportional increase in NPTs to PTs over geologic time in Volutidae. For larval mode switches to have produced the dominance of non-planktotrophy, several plausible scenarios are considered: (1) many unidirectional switches from planktotrophy to non-planktotrophy occurred in multiple different subclades; (2) only a few switches to the non-planktotrophic mode, along with the differential diversification of lineages with non-planktotrophic larvae; and finally (3), species selection could be implicated if the difference in net rate of speciation favoring NPTs is found to offset any differences in rate of extinction. These are not mutually exclusive scenarios, however, but rather independent hypotheses to test.
To minimize the effect of factors other than dispersal ability, a single genus within Volutidae, Volutospina, was chosen for detailed analysis. The taxonomy and systematics of this clade were recently analyzed (Friend Reference Friend2021), and a phylogeny produced therein provides the phylogenetic context for this study (Fig. 2). The Paleocene–Eocene outcrops of the U.S. Gulf Coastal Plain (GCP) and the Anglo-Parisian Basin (APB) provide an excellent framework for testing the effect of dispersal potential (larval mode). The stratigraphy of both regions has been extensively studied, and fossil mollusks are generally well preserved.
Phylogeny of Paleocene–Eocene Volutospina. PT, planktotrophic; NPT, non-planktotrophic; gray circle labels, U.S. species; white circle labels, U.K. species; white circles on phylogeny, larval mode change from planktotrophic to non-planktotrophic. Black arrows, west to east Atlantic larval dispersal; white arrows, east to west Atlantic larval dispersal.

Methods
For all but one (V. arangia) species, multiple specimens with complete protoconchs were studied under a microscope to determine larval mode. Larval inferences for rare taxa and worn, fragmented, or poorly preserved species were based on a single specimen, but larval type is largely thought to be species specific (Robertson Reference Robertson1974). None of the taxa with multiple protoconch-bearing specimens displayed intraspecific variation in larval type. Following the method outlined by Shuto (Reference Shuto1974), we used the ratio between maximum diameter (D) and number of volutions of the protoconch (Vol) to infer each species’ larval type (D/Vol). Planktotrophic larvae have D/Vol ratios of less than 0.3; at least 3 volutions; and a thin, acute apex. Non-planktotrophic larvae have D/Vol ratios 0.3 and above; fewer than 2.25 volutions; and a blunt, low apex. But when D/Vol ratio is between 0.3 and 1.0 and the protoconch more than 3 volutions, both planktotrophy and non-planktotrophy are possible, and qualitative characters like sculpture and shape help infer larval mode (Shuto Reference Shuto1974; Vendetti Reference Vendetti2007).
Following the methods of Hansen (Reference Hansen1980), maps of the GCP and the APB were divided into linear geographic units, each 75 km wide. Locality data for each species were collected from both published literature and museum specimens. Paleobiogeographic ranges of Volutospina species were calculated by mapping occurrences and counting the number of geographic units (Hansen Reference Hansen1980) between its most distant localities. To avoid giving species an anomalously wide distribution, geographic units were counted for only the stratigraphic unit during which the species occupied the most zones.
Species durations (stratigraphic ranges) were calculated by summing the durations of nanoplankton (NP) zones of the geologic formations in which each was present. NP ages were based on Papazzoni et al. Reference Papazzoni, Ćosović, Briguglio and Drobne2017 (Table 1). Mann-Whitney U-tests, calculated in PAST v. 3.24 (Hammer et al. Reference Hammer, Harper and Ryan2001) were used to assess the relationship between larval type and emergent traits (geographic range and species duration).
Nanoplankton (NP) boundary ages and duration. Number of planktotrophs (PTs) and non-planktotrophs (NPTs) present in each zone.

The potential interactive effect of geographic range and duration was explored using a multiple logistic regression analysis in the Quest Graph Logistic Regression Calculator (ATT Bioquest, Inc., 2019). Although this test is not without criticism, particularly because it assumes normality and treats dependent variables as independent, it does give some indication as to which variable is the strongest predictor of larval mode.
Larval mode was mapped onto Friend's (Reference Friend2021) phylogeny of Paleocene and Eocene Volutospina to assess the origin of NPTs and to determine the number of lineage originations and extinctions in each NP zone for both PTs and NPTs. Per-lineage speciation and extinction rates were calculated for each by observing the number of new species or the number of lineages ending at the base of each NP zone. The rates of per-lineage speciation and extinction were then calculated using the duration (in millions of years) of the NP zone immediately before the boundary where measurements were taken. Comparisons between NPTs and PTs across the entire history of the clade (as opposed to within an NP zone) included all time periods for which lineages existed representing the larval mode under consideration. An unequal variance t-test comparing per-lineage, per-million years net-speciation rates was also performed in PAST v. 3.24 (Hammer et al. Reference Hammer, Harper and Ryan2001).
Results
The larval modes of Eocene Volutospina are summarized in Table 2 (protoconchs were located for all species except V. arangia). Of the species included in this analysis, six definitively indicate non-planktotrophic larvae. These six include four GCP species and two APB species. The test results that follow treated V. arangia as an NPT (a reasonable inference as a member of NPT-only clade), but statistical analyses found that treating it as non-planktotrophic did not ultimately have an effect on final results.
Larval mode (PT, planktotroph; NPT, non-planktotroph), species duration, provenance (GCP, U.S. Gulf Coastal Plain; APB, Anglo-Parisian Basin), and maximum geographic-range size (in units of 75 km, as in Hansen [Reference Hansen1980]) of Volutospina species.

Patterns of species distribution reveal the differences in geographic ranges between species with presumably similar dispersal abilities. For example, some planktotrophic species exhibited restricted geographic ranges (e.g., V. depauperata, V. horrida, and V. luctator). Considering all taxa together, the difference of geographic range between PTs and NPTs is insignificant, as determined by Mann-Whitney U-tests (p = 0.350) (Table 3). The analysis here indicates that these volutids exhibited little difference in geographic range between different larval modes. Results of a Mann-Whitney U-test between GCP and APB species, however, shows GCP species had significantly larger geographic ranges (p = 0.046) and indicates a locality-specific component to maximum geographic-range size (Table 3).
Results of Mann-Whitney U-tests. **significant p-value. PT, planktotrophs; NPT, non-planktotrophs; GCP, U.S. Gulf Coastal Plain; APB, Anglo-Parisian Basin.

Species with non-planktotrophic larvae had a median duration of 4.7 Myr but 9.7 Myr for those with planktotrophic larvae. A Mann-Whitney U-test (Table 3) indicates that this difference between species durations of PTs and NPTs is significant (p = 0.017).
The interactive effect of both duration and geographic range, as measured by multiple logistic regression, revealed that duration had a closer correlation with larval modes than geographic-range size (Table 4). In other words, duration was a better predictor for larval mode than geographic-range size.
Results of the multiple logistic regression analysis.

The number of species in each NP zone grew modestly from NP 4 to 12, peaked in NP 16 (Table 1), and dropped quickly after NP 18. The results of this analysis indicate that non-planktotrophy was absent among the Volutospina species during the Paleocene and early Eocene. The relative proportions of NPTs increased in the early middle Eocene and was highest during NP 18 (20% of species). The late Eocene was characterized by disappearance of PTs, leaving only one presumed non-planktotrophic species (V. arangia) in NP 20.
When the larval modes of Volutospina are incorporated in the phylogeny, planktotrophy appears to be the plesiomorphic state, given the substantially higher frequency of PTs across the clade (Krug et al. Reference Krug, Vendetti, Ellingson, Trowbridge, Hirano, Trathen, Rodriguez, Swennen, Wilson and Valdés2015; Collin and Moran Reference Collin, Moran, Carrier, Reitzel and Heyland2018). Non-planktotrophy has independently arisen at least three times in this clade (Fig. 2, white circles), and there is no evidence that reversals of larval mode occurred (although the larval mode of V. arangia remains unknown, and therefore the possibility that one reversal took place cannot be definitively ruled out). Of the seven NPTs in this clade, four originated from a single mode change (V. dalli, V. arangia, V. haleana, and V. sayana). The other two originations (V. selseiensis and V. clayi) coincided with larval mode changes but did not give rise to any new species.
The pattern of observed lineage diversity shows an increasing preponderance of NPTs; however, this is clearly driven by a dramatic extinction of PTs between NP 17 and NP 19–20 (Table 1, Fig. 3). This extinction took place simultaneously in Europe and North America, but eliminated all APB species, leaving the single surviving American species, Volutospina arangia.
A, Number of planktotrophic and non-planktotrophic Volutospina. B, Relative abundance of planktotrophic and non-planktotrophic Volutospina. See zones noted in Table 1.

Comparing speciation between PTs and NPTs produces no statistically significant difference (Mann-Whitney U-test, p = 0.47), with a mean PT speciation rate of 0.252 per species, per million years, and mean NPT speciation rate 0.162 per species, per million years (Tables 3, 5). Extinction rate also did not differ significantly (Mann-Whitney U-test, p = 0.41), with a mean PT extinction rate of 0.09 per species, per million years and a mean NPT extinction rate of 0.16 per species, per million years (Tables 3, 5). PT net speciation rates had a mean of 0.164 from 12 time steps, while NPT net speciation rates had a mean of 0.01 from 8 time steps (Table 6). These differences were not statistically significant, including when time steps of 0 change were removed from the analysis.
Speciation and extinction rates (per species per million years) of planktotroph and non-planktotroph Volutospina.

Calculations of speciation and extinction rates. *Time-bin length based on Papazonni et al. (Reference Papazzoni, Ćosović, Briguglio and Drobne2017) until NP21. NP 21–23 based on Less and Ozcan (Reference Less and Özcan2012). PT, planktotroph; NPT, non-planktotroph; NP, nanoplankton.

Continued.

Discussion
Paleogeographic Range
Hansen's (Reference Hansen1980) study on fossil Volutidae (including Volutospina examined here) from the GCP supported predictions that planktotrophic species would have larger geographic ranges than non-planktotrophic species (PTs had a median geographic range of 5.5 units, while NPTs spanned an average of 1.0 unit). Our results show a different pattern; two considerations may explain the discrepancy.
The first consideration is potential preservation bias within the fossil deposits of the two regions (GCP and APB). The distribution of accessible fossiliferous outcrops in the APB may have underestimated the true extent of the geographic ranges. This, of course, is a ubiquitous problem in paleontology. The second consideration, which we view as a more relevant factor, is the relatively limited size of actual paleobiogeographic provinces in the APB during the late Paleocene and Eocene. Paleogeographic reconstructions of the Paleocene and Eocene vary with respect to the coastline of the United Kingdom and France, depending on the precise age of the sediments (King et al. Reference King, Gale and Barry2016). The North Sea was connected to the Atlantic Ocean during the Paleogene by a northern passage between current-day Scotland and Norway. In this case, the shared waters covering the present United Kingdom and France were bordered on three sides by land (Zacke et al. Reference Zacke, Voigt, Joachimski, Gale, Ward and Tütken2009). There is some uncertainty as to when the southern passage (i.e., current-day English Channel) formed, so it is possible that there were two routes by which larvae could enter or exit the Hampshire and Paris Basins (Zacke et al. Reference Zacke, Voigt, Joachimski, Gale, Ward and Tütken2009). The precise timing of open- or closed-access routes is a topic of recent interest, but there is currently no consensus (King et al. Reference King, Gale and Barry2016). In other words, the geographic ranges of Volutospina in the APB may have been smaller than those in North America because there was less habitable space in which mollusks could live. Results of a Mann-Whitney U-test of geographic range between GCP species and APB species (Table 3) is consistent with the hypothesis that the size of the biogeographic province may ultimately control the geographic range of all APB Volutospina. There is also some evidence to suggest that epeiric seas (such as the Hampshire and Paris Basins) may support a higher species-area relationship than open ocean–facing settings (such as the GCP) due to differences in physical conditions (Lagomarcino and Miller Reference Lagomarcino and Miller2012).
Species of similar dispersive potential still differed in geographic-range size, suggesting larval mode is not a predictor of realized geographic range. However, an alternate relationship is revealed when short-lived and long-lived species (regardless of larval mode) are compared. Short-lived species occupy smaller geographic ranges than do the longer-enduring species (Mann-Whitney U-test, p = 0.04). This result is similar to that of Hansen (Reference Hansen1980), who found that widespread species have the longest durations, while species that are narrowly distributed exhibit the shortest durations.
Our conclusions on the macroevolutionary consequences of paleogeographic range size are limited, because this study only encompasses APB and GCP. While collectively a large area, it is relatively small relative to the world's Eocene sedimentary record. Limiting the study to two basins might obscure larger-scale patterns, but a global study is beyond the scope of this study.
Changes in Larval Mode
A few general geographic trends in larval modes are known from studies of extant marine invertebrates. Jablonski and Lutz (Reference Jablonski, Lutz, Rhoads and Lutz1980) noted that the proportion of NPTs relative to PTs increased with water depth. But living volutids (all that are known are NPTs) occur in both shallow and deeper waters. And because early Cenozoic deposits do not show trends toward deeper water environments, water depth is unlikely to be causing observed switches and trends (Hansen Reference Hansen1978). Additionally, continental positions (reconstructed with paleomagnetic data) indicate only minor changes in the paleolatitude of both the GCP and the ABP (Hansen Reference Hansen1978; Torsvik et al. Reference Torsvik, Van der Voo, Preeden, Mac Niocaill, Steinberger, Doubrovine, Van Hinsbergen, Domeier, Gaina and Tohver2012) during the early Cenozoic; therefore, changes in developmental mode cannot be attributed to changes in latitude.
A steady trend of global cooling took place throughout most of the time period studied herein, beginning after the early Eocene climatic optimum, resulting in the onset of ephemeral (~36 Ma) and then permanent (~34 Ma) Antarctic ice sheets (Zachos et al. Reference Zachos, Pagani, Sloan, Thomas and Billups2001). If a relationship between larval development and latitude is mediated by temperature, a period of cooling might explain larger numbers of NPTs (due to less stratification, and increased potential for upwelling). However, it is doubtful that global temperature changes caused the developmental mode changes in Volutospina, as most diversification of PTs took place during the Lutetian, the same time period when most non-planktotrophic lineages originated.
Macroevolutionary Effects of Larval Mode
It is essential that we consider selection and sorting hierarchically if we are to understand macroevolutionary trends throughout life history (Gould Reference Gould1998; Congreve et al. Reference Congreve, Falk and Lamsdell2018). This in turn necessitates the integration of phylogenetic, ecological, and paleoenvironmental information into a coherent interpretation of evolution of a clade (Lamsdell et al. Reference Lamsdell, Congreve, Hopkins, Krug and Patzkowsky2017). For almost 50 years, studies of gastropods in the fossil record have reported that NPTs had high rates of both speciation and extinction, and at least some neogastropod clades accumulated more rapidly over time (Shuto Reference Shuto1974; Hansen Reference Hansen1978, Reference Hansen1980, Reference Hansen1982; Jablonski Reference Jablonski1982, Reference Jablonski1986; Jablonski and Lutz Reference Jablonski and Lutz1983). The results presented here indicate that, despite the multiple shifts to non-planktotrophy, this developmental mode change did not trigger increased cladogenesis, and indeed may have lowered speciation rates. Only one species was associated with each of two shifts to non-planktotrophy (33% of origins), while one additional shift resulted in the NPT clade containing only four species. This pattern does not support the commonly cited hypothesis that NPTs diversify at a higher rates and weakly supports the competing hypothesis that non-planktotrophy results in decreased speciation by limiting the potential for allopatry (with speciation rates of NPTs found to be lower, but not significantly so). Results from this study are more consistent with findings from recent phylogenetic studies, which have challenged non-phylogenetic interpretations of the fossil record, and reveal independent origins of non-planktotrophy are more common than might be expected and rarely precede bursts of cladogenesis (Lieberman et al. Reference Lieberman, Allmon and Eldredge1993; Hart et al. Reference Hart, Byrne and Smith1997; Hart Reference Hart2000; Jeffery et al. Reference Jeffery, Emlet and Littlewood2003; Meyer Reference Meyer2003; Collin Reference Collin2004; Hart and Podolsky Reference Hart and Podolsky2005; Krug Reference Krug2011). The hypothesis that non-planktotrophy increases extinction rates is only weakly supported, and the difference was not found to be statistically significant.
Gastropod dispersal ability (inferred via larval mode) has been repeatedly cited as a textbook example of how emergent traits can affect speciation rates (Jablonski and Lutz Reference Jablonski and Lutz1983; Jablonski Reference Jablonski1986; Bergstrom and Dugatkin Reference Bergstrom and Dugatkin2012). While some authors have invoked species selection, several widely cited paleontological studies did not actually calculate the emergent fitness of the clade (the net outcome of differential speciation and extinction rates), which is the crucial measure of species selection (Hansen Reference Hansen1980; Jablonski and Lutz Reference Jablonski and Lutz1983; Jablonski Reference Jablonski1986). For Paleogene Volutospina, results here show that planktotrophic lineages disappeared from the paleontological record in two ways: through extinction (16 instances) and through character change to non-planktotrophy (3 instances). Similarly, NPTs arose in two ways: speciation (3 instances) and character change in a planktotrophic ancestor (3 instances). Statistical comparison of speciation and extinction rates suggests diversification rate was only slightly higher for non-planktotrophic volutids. As the one clade of NPTs to diversify also was inferred to have arisen after a trans-Atlantic dispersal event (from a planktotrophic ancestor), the transition to non-planktotrophy may be only associated with speciation in a region with unoccupied volutid niche space, while non-planktotrophy may have supported persistence of the colonizing population. However, one example is insufficient to draw general conclusions.
Conclusions
The aim of this research was to examine larval mode change in Volutospina from the Paleocene–Eocene deposits of the GCP and APB. Larval modes were mapped onto a phylogeny to determine the plesiomorphic larval mode and to hypothesize causes of larval mode switches. Both phylogenetic and non-phylogenetic approaches were used to explore macroevolutionary trends attributable to different larval modes.
The results indicated that species with planktotrophic larvae are geologically longer lived than species with non-planktotrophic development. Yet there was not a clear-cut relationship between larval mode and geographic-range size. Biogeographic distribution is the result of many variables, including dispersal potential, presence or absence of geographic barriers, and environmental tolerance. In the case of this study, the two larval modes did not possess significantly different geographic-range sizes, but paleobiogeography of the APB is a factor that could potentially limit species ranges, including those of high dispersal capabilities (in contrast, on a global scale, Halder and Das [Reference Halder and Das2019] attributed the limited geographic distribution of most species within Indovolutinae to non-planktotrophic larval mode). The disparity in geographic-range size among taxa with similar dispersal potential may also be associated with their environmental tolerances, although no specific environmental changes were found to account for our observations.
Species sorting (Vrba and Gould Reference Vrba and Gould1986) can occur when the net diversification rate of a lineage is character-state dependent and is termed “species selection” for emergent traits (Stanley Reference Stanley1975; Vrba and Gould Reference Vrba and Gould1986; Jablonski Reference Jablonski2008; Congreve et al. Reference Congreve, Falk and Lamsdell2018). Despite comparative studies of species selection currently capturing moderate interest, confident identification of traits linked to diversification rates is exceedingly rare (Rabosky and McCune Reference Rabosky and McCune2010; Rabosky and Goldberg Reference Rabosky and Goldberg2015). In the case of larval mode, the organism-level trait of larval mode may have nonlinear (emergent) impacts on species duration and speciation rate through the mediating species-level traits’ interpopulation connectivity (presumed to dampen speciation rate) and geographic range (presumed to impact extinction risk). Despite the seemingly substantial and likely irreversible transformation required, shifts to non-planktotrophy have occurred in most clades, providing paleontologists with copious potential study subjects with which to evaluate the evolutionary origins and the resulting effects of reduced dispersal. Across the Volutospina clade, non-planktotrophy appears to have both dampened speciation and increased extinction risk and should presumably have been disfavored by species selection, ceteris paribus. However, while three independent planktotrophic lineages produced non-planktotrophic lineages, no reversals were observed. This directionality may have led to a pattern resembling Figure 1C. However, examining the stratigraphic and geographic pattern of the extinction makes it clear that this natural experiment did not continue to an independent conclusion, but rather was truncated by a severe extinction event associated with global cooling and European shallow shelf area loss. When studied in proper phylogenetic and geographic context, Hansen's (Reference Hansen1978) conclusions that non-planktotrophy (in species of Volutidae) was favored by species selection appear incorrect on two counts: (1) non-planktotrophy is not selectively favored, and (2) NPTs only “dominate” the clade after a major extinction leaves a single surviving species. This suggests that in the instance of Paleogene Volutospina, species selection does not appear to have driven the trend toward non-planktotrophy, but rather the clade follows the pattern proposed in Jablonski (Reference Jablonski2017), in which a chance shift in composition of the clade alters evolutionary dynamics.
The dominance of NPTs in extant Volutidae may similarly have been the result of contingency, either in extinction or through stochastic accumulation of irreversible transitions (therefore the result of biased origination of, rather than differences in, net speciation rates between NPTs and PTs) and is a suitable area for future research in phylogenetic context. While the differences in net diversification rates between non-planktotrophic and planktotrophic Volutospina species were not found to be statistically significant in the present analysis, it is nevertheless possible that increased sample sizes may detect statistically distinguishable speciation and extinction rates or volatility. If increased sampling does suggest a statistically significant difference, then non-planktotrophic lineages, having potentially originated due to organism-level selection, are at greater risk of clade extinction due to macroevolutionary dynamics (Wagner et al. Reference Wagner, Plotnick and Lyons2018); that is, living dead clades walking (Jablonski Reference Jablonski2002; Sang et al. Reference Sang, Friend, Allmon and Anderson2019). Only by examining the fossil and extant members of living clades in phylogenetic context can we properly answer these and other questions of evolutionary ecology (Lamsdell et al. Reference Lamsdell, Congreve, Hopkins, Krug and Patzkowsky2017).
Acknowledgments
The authors extend their gratitude to G. Dietl and W. Bemis for their guidance and L. Skibinski and J. Todd for assistance in using collections. We also would like to thank J. C. Lamsdell and S. Tybout for discussions of volatility. Our appreciation also goes to our reviewers, who greatly helped us improve the article and suggested additional appropriate statistical methods.


 Open access