


1. Introduction
Social epistemologists sometimes use computational models to study how social phenomena affect epistemic performance. Two of the most commonly used modelling paradigms are landscape models and two-armed bandit models. In landscape models, the goal is to find the global maximum in the solution space. The task can be understood abstractly as searching for the maximal value of a function, or as looking for the highest point of a single- or multi-dimensional landscape. In two-armed bandit models, there are two coins with varying biases toward heads, and the agents flip the coins with the goal of getting as many heads as possible. Footnote 1 To determine which coin to toss, they try to find out which coin has a higher bias by sampling from one of the coins at each time step, and sometimes by exchanging information with other members of the group. Landscape models have been used to study functional diversity (Hong and Page Reference Hong and Page2004; Grim et al. Reference Grim, Singer, Bramson, Holman, McGeehan and Berger2019; Singer Reference Singer2019; Thoma Reference Thoma2015; Weisberg and Muldoon Reference Weisberg and Muldoon2009), which concerns variations in cognitive strategies and skills, whereas bandit problems have been used to study demographic diversity (Fazelpour and Steel Reference Fazelpour and Steel2022; Steel et al. Reference Steel, Fazelpour, Crewe and Gillette2019), which concerns variations in identity categories, such as gender and race.
In this paper, I argue that these two paradigms can be understood within a single modelling framework, and I use that framework to study the effects of functional and demographic diversity at the same time. In section 2, I introduce the two paradigms in more detail, using two different models of diversity as the primary examples. Section 3 motivates and develops a unified model. The unified model combines landscape search with noisy signals and trust dynamics. In section 4, I present three key results. First, noise from the environment often improves epistemic performance in a search task by promoting exploration. Second, the “diversity trumps expertise” result in previous work (Hong and Page Reference Hong and Page2004; Grim et al. Reference Grim, Singer, Bramson, Holman, McGeehan and Berger2019; Singer Reference Singer2019) is strengthened with the increase of noise. Third, the epistemic benefits of functional and demographic diversity, as they are construed in the literature, are non-additive. Section 5 concludes.
2. Two modelling paradigms
I begin by explaining landscape search and two-armed bandit models. In particular, I focus on models of diversity in the two paradigms.
2.1 Landscape search
In a landscape model, each location in the search space has a value, and the goal for agents is to find the global maximum. Footnote 2 The task becomes difficult when, in addition to the highest hill, there are other smaller hills in the landscape. When there are local maxima, agents tend to get stuck and fail to realize that if they keep searching, by first descending, they might then ascend and find even more fruitful epistemic ground.
To get a better grasp of how landscape models work, we can look at a specific example of a landscape model developed to investigate the epistemic effect of diversity. In Grim et al. (Reference Grim, Singer, Bramson, Holman, McGeehan and Berger2019),the search task takes place on a landscape with varying degrees of smoothness. Footnote 3 The smoother the landscape, the stronger the correlation between location and value. In other words, on a smoother landscape, the values of nearby points are more likely to be similar.
Each agent in the model is equipped with a “heuristic,” which comprises an ordered list of three step sizes. These step sizes together determine the locations of the search space that the agent can visit. One way to interpret this aspect of the model is that people sometimes start with one possible solution to a problem, and then come up with alternatives by changing the original solution in one or more ways. The agents in this model operate as hill climbers, meaning they advance to the next position only if it has a higher value than their current location.
For instance, let’s assume that an agent is currently at position $x$
and has the heuristic
$x$
and has the heuristic $\left( {1,{\rm{\;}}6,{\rm{\;}}3} \right)$
. The agent begins by examining position
$\left( {1,{\rm{\;}}6,{\rm{\;}}3} \right)$
. The agent begins by examining position $\left( {x + 1} \right)$
. If the value at
$\left( {x + 1} \right)$
. If the value at $\left( {x + 1} \right)$
is lower, the agent remains at
$\left( {x + 1} \right)$
is lower, the agent remains at $x$
and proceeds to evaluate position
$x$
and proceeds to evaluate position $\left( {x + 6} \right)$
. Suppose
$\left( {x + 6} \right)$
. Suppose $\left( {x + 6} \right)$
has a higher value. The agent moves to
$\left( {x + 6} \right)$
has a higher value. The agent moves to $\left( {x + 6} \right)$
. This iterative process continues, with the agent now employing a step size of
$\left( {x + 6} \right)$
. This iterative process continues, with the agent now employing a step size of $3$
. They check
$3$
. They check $\left( {x + 6 + 3} \right)$
to assess whether to move forward. Afterward, the agent cycles back to using a step size of
$\left( {x + 6 + 3} \right)$
to assess whether to move forward. Afterward, the agent cycles back to using a step size of $1$
. This algorithm continues until the agent can no longer discover a higher value by employing the three step sizes in its heuristic.
$1$
. This algorithm continues until the agent can no longer discover a higher value by employing the three step sizes in its heuristic.
This search task model is simple yet powerful. Hill climbing algorithms underlie many machine learning techniques and capture a wide range of real-world problem solving. For instance, consider a team trying to come up with the design of a rocket that can send a human to the moon. Modelled as a search task, each location of the solution space is a possible design, and the engineers collectively explore the space by trying different designs and modifying existing designs. Sometimes they make small changes (take small steps). Sometimes they take risks and make more drastic modifications (take large steps). Sometimes these changes yield improvement (move). Sometimes they do not (stay).
Diversity in this model is understood as variation in the heuristics used by agents in the group. If agents in the group have search heuristics that widely differ from one another, the group is considered diverse.
Two groups of agents are compared: a diverse group and an expert group. The diverse group consists of randomly chosen agents, whereas the expert group consists of agents with the best-performing heuristics according to prior testing. Each group conducts their search either by relay or by tournaments. (More on this later.) Footnote 4 The two groups are then compared based on the highest value they can find.
Grim et al. (Reference Grim, Singer, Bramson, Holman, McGeehan and Berger2019) find that diverse groups outperform expert groups on rugged landscapes, whereas experts outperform diverse groups on smooth landscapes. Their explanation is that randomly chosen groups have a higher cover-diversity (Singer Reference Singer2019), measured by the number of distinct step sizes in their collective heuristics. For example, the cover diversity of a two-member group with heuristics (1, 6, 3) and (6, 8, 9) is 5. By contrast, the expert groups consisting of individually best-performing agents cover a smaller set of step sizes. On rugged landscapes, cover-diversity is an advantage because it allows the group to explore a larger number of potential solutions. On smoother landscapes, having specific step sizes enables agents to find the global maximum and not get stuck at local maxima.
This model captures the notion of cognitive diversity or functional diversity, the kind of diversity that concerns variations in problem-solving methods, knowledge, ways of reasoning, and experiences, as opposed to variations in social identity groups such as race and gender.
There are important shortcomings in this and similar landscape models of functional diversity, however. There is no communication between agents beyond reporting individual findings, and nothing is gained or lost by revisiting the same location that has already been explored by a teammate. An agent will search the same location that a teammate has already searched and will get identical results when they do so. There is no cost to doing redundant work, since there is no limit to how many searches they are able to conduct, unlike in reality where time and resources are limited. There is also no benefit to double-checking a potential solution that a teammate proposes, since no one is ever mistaken about the value of each location. However, for most problems that may be modelled as a search task, e.g., designing a product, there are clear benefits for multiple functionally similar individuals to work on the same potential solution. It saves time and increases our certainty in the actual value of the solution. The model therefore misses important aspects of real cooperation and thereby fails to express some of the advantages that homogeneity might bring.
We will return to these issues later on in the paper, as the unified model I develop will solve many of them.
2.2. Two-armed bandit
In a two-armed bandit problem, agents aim to maximize the number of heads without knowing which of the two coins is more likely to land heads. Each agent selects the coin they think has a higher chance of heads, and then updates their credences based on the outcome of the toss. Variations of the two-armed bandit task, in combination with network models of communication, are often used to investigate social epistemic phenomena. Footnote 5 In social versions of the two-armed bandit task, agents are connected to some or all of the other agents in the group, and may also update their credences on the tosses observed by those they are connected to.
This captures an interesting class of scientific inquiries. For example, suppose there are two medical interventions available to a doctor, but she is uncertain which is more effective. Each time she prescribes one of them, she observes the outcome and updates her beliefs about the effectiveness of the method accordingly. She can also observe what happens when other doctors use these interventions. Her main goal is to maximize the number of patients cured, so she will always choose the intervention she believes to be more effective.
Fazelpour and Steel (Reference Fazelpour and Steel2022) use a two-armed bandit model to study the epistemic effect of diversity by adding in-group/out-group dynamics. The underlying assumption is that there is less trust and less pressure to conform between people from different social identity categories. If this assumption holds, then we can learn about the epistemic benefits of diversity by manipulating dynamics of trust and conformity. The notion of diversity that this model captures is demographic diversity, which concerns variations in social identity categories such as gender, race, and age. These demographic categories need not correlate with differences in cognitive traits.
Functional diversity is usually thought to be the only type of diversity that makes an epistemic difference, whereas demographic diversity is usually thought to be epistemically relevant only insofar as it correlates with functional diversity. (See Steel et al. (Reference Steel, Fazelpour, Crewe and Gillette2019) for a review.) This assumption is understandable. Since my skin color has nothing to do with my skills in engineering, intuitively, the distribution of race within a team of engineers should not influence its problem-solving ability. But if race correlates with educational background and style of reasoning, then picking a racially diverse group can likely increase functional diversity. Therefore, if functional diversity is epistemically beneficial and there is a correlation between functional and demographic diversity, then we have indirect epistemic reason to prefer demographically diverse groups over homogeneous ones.
Fazelpour and Steel’s (Reference Fazelpour and Steel2022) model is meant to challenge this assumption by showing that demographic diversity can also benefit an epistemic group without being correlated with functional diversity, by creating in-group/out-group dynamics within the team that reduce the negative epistemic impact of trust and conformity. There is no functional diversity in their model—all agents are ideal Bayesians, ensuring that the epistemic benefits cannot be due to a correlation between functional and demographic diversity.
The benefit of demographic diversity is thus established via two links. The first link is the empirical claim that demographic diversity reduces trust and the pressure to conform. The second link is the computational result that reducing trust and conformity can increase the group’s chance of converging on the truth.
The latter link builds on two results previously presented in Zollman (Reference Zollman2007) and O’Connor and Weatherall (Reference O’Connor and Owen Weatherall2020). While we might expect high connectivity within an epistemic network to be beneficial thanks to wide sharing of evidence, Zollman (Reference Zollman2007) finds that a highly connected community is less likely to converge on the truth than a sparsely connected one. This is because too much information sharing can lead to premature convergence on the wrong answer. Using a similar computational model, O’Connor and Weatherall (Reference O’Connor and Owen Weatherall2020) find that the pressure to conform (i.e., flip the same coin as one’s peers, even when the other coin has a higher expected payoff) can be harmful to the epistemic performance of the group in various aspects.
Building on these models, Fazelpour and Steel (Reference Fazelpour and Steel2022) show that demographic diversity can reduce the aforementioned negative effects if it creates subgroups within the epistemic group. Assigning subgroup identities to agents in the network, they find that, under certain conditions, group epistemic performance improves when agents do not fully trust the evidence observed by an out-grouper, and when they have less pressure to conform with the opinions of out-groupers. They conclude that demographic diversity can bring benefits through such in-group/out-group dynamics.
3. Unification
In this section, I motivate and develop a unified framework that combines the two paradigms discussed in sections 2.1 and 2.2. I start by making some general observations about the two types of models and explaining why they can be understood in a single framework (section 3.1). Then I develop a unified model that represents functional and demographic diversity at the same time, by combining important aspects of the landscape and two-armed bandit paradigms (section 3.2).
3.1. The possibility of unification
At first sight, agents in landscape search models and two-armed bandit problems seem to face very different learning tasks. In the former, they go through a massive landscape to find the most epistemically fruitful location. In the latter, they have to determine which of the two coins has a higher expected payoff. Despite these differences, the two types of tasks can actually be understood within a single framework: the former as problems with a large and noiseless solution space, and the latter with a small but noisy solution space. In both cases, agents are trying to find the best solution among multiple options.
Most applications of these modelling paradigms in epistemology concern epistemic communities, as opposed to an individual agent. What makes these tasks suitable for modelling group tasks? The answer lies in the contrast between limited individual capacity and the scale of the task. In the former, the landscape is extremely large ( $2000$
potential solutions organized in a ring structure in Grim et al. (Reference Grim, Singer, Bramson, Holman, McGeehan and Berger2019), for example) compared to what each agent can search (
$2000$
potential solutions organized in a ring structure in Grim et al. (Reference Grim, Singer, Bramson, Holman, McGeehan and Berger2019), for example) compared to what each agent can search ( $3$
different locations ahead of the current local maximum). In the latter, the difference between the biases of the two coins is so small (
$3$
different locations ahead of the current local maximum). In the latter, the difference between the biases of the two coins is so small ( $0.5$
vs.
$0.5$
vs. $0.501$
in Fazelpour and Steel (Reference Fazelpour and Steel2022), for example) that the amount of data required to make a correct judgment is beyond what an individual agent can collect alone within a time limit.
$0.501$
in Fazelpour and Steel (Reference Fazelpour and Steel2022), for example) that the amount of data required to make a correct judgment is beyond what an individual agent can collect alone within a time limit.
In a landscape search, no group can exhaust the space, but each time an agent reaches a location, they know the value of that location with certainty, so there is no point in revisiting a potential solution that has already been explored. By contrast, in two-armed bandit models, everyone can easily exhaust the solution space, which contains only two “locations.” However, each time they explore a potential solution (i.e., flip one of the coins), they get very little information compared to the number of tosses required to tell the extremely small difference in value between the two coins. To confidently choose one coin over the other, they have to explore the options over and over again to collect enough data.
Seeing the two tasks as instances of a more general problem structure, the range of possible problem designs expands. We can adjust two parameters—the noise level and the size of the solution space—to create a multiplicity of problems. The noise level determines how many times a solution needs to be explored to accurately estimate its true value. The size of the environment determines how many distinct solutions agents must explore to cover all the possibilities.
The problem-solving strategies employed in the two original paradigms are also compatible, and relevant aspects of each strategy can be preserved in the unified framework. While the algorithms used differ, in both landscape and bandit models, decision rules are myopic—agents consistently opt for the choice with the higher expected immediate payoff. Myopic decision rules underlie the exploitation/exploration tradeoff—the choice between exploiting existing information to maximize short-term payoff and exploring less familiar options to gain information that can potentially increase long-term payoff.
In a two-armed bandit problem, agents follow a simple decision rule—choose the coin with higher probability of heads given current information. Footnote 6 In doing so, the agent maximizes expected immediate payoff, at the risk of under-exploring the alternative. As a result, they might never find out that the under-explored option actually has a higher chance of success.
In landscape search models, agents are hill climbers. For instance, in Grim et al. (Reference Grim, Singer, Bramson, Holman, McGeehan and Berger2019), agents follow a single decision rule—if the next location is better, move and start from there; otherwise, stay at the current best location and keep trying other step sizes, if any are available. The landscape search algorithm is not expected-value-greedy in the strict sense, since we do not model agents as having credences. But there is an important parallel. The agents could have had a different strategy of exploration. For instance, suppose my step sizes are $\left( {5,9} \right)$
and my current location is
$\left( {5,9} \right)$
and my current location is $c$
. Even if the
$c$
. Even if the $\left( {c + 5} \right)$
location is worse than
$\left( {c + 5} \right)$
location is worse than $c$
, I could have chosen to still move to
$c$
, I could have chosen to still move to $\left( {c + 5} \right)$
and explore
$\left( {c + 5} \right)$
and explore $\left( {c + 5 + 5} \right)$
and
$\left( {c + 5 + 5} \right)$
and $\left( {c + 5 + 9} \right)$
from there. In a myopic algorithm, agents do not descend. They always go to the best location they can currently see. This is similar to the greedy algorithm in two-armed bandit models where an agent always flips the coin with the highest expected immediate payoff. Given that the landscape consists of hills, if the next step forward ascends, this indicates that I am climbing up a hill, so I expect that if I keep moving forward, I should get better results. If the next step forward descends, then I assume there is no reason to go forward.
$\left( {c + 5 + 9} \right)$
from there. In a myopic algorithm, agents do not descend. They always go to the best location they can currently see. This is similar to the greedy algorithm in two-armed bandit models where an agent always flips the coin with the highest expected immediate payoff. Given that the landscape consists of hills, if the next step forward ascends, this indicates that I am climbing up a hill, so I expect that if I keep moving forward, I should get better results. If the next step forward descends, then I assume there is no reason to go forward.
A purely myopic agent can still explore by observing other agents’ data. For instance, in a bandit model, if another agent chooses to toss a different coin, then the first agent obtains information about the coin that they believe is less likely to land heads, and gains certainty about the other option without missing out on the chance to maximize their expected short-term payoff. In a landscape model, the agent can exploit the information they receive from others and move to locations known to have high epistemic values. Or, they can explore uncharted territory, and potentially discover a location of even higher value than previously known ones. The interesting question, then, is what kind of group configuration maintains a good balance between exploitation and exploration.
As a result of the exploitation/exploration dynamics in both modelling paradigms, some interesting qualitative results—notably, the phenomenon nowadays called the “Zollman effect”—replicate in both types of models. Zollman (Reference Zollman2007, Reference Zollman2010) finds that too much communication within an epistemic network can lead the scientific community to prematurely converge on the worse option in a two-armed bandit problem. This is due to the myopic agents’ lack of exploration. Lazer and Friedman (Reference Lazer and Friedman2007) find similar results using a landscape model with myopic agents. (See Wu and O’Connor (Reference Wu and O’Connor2023) for an extensive survey on landscape and bandit models used to study this phenomenon, and potential remedies.)
Despite the apparent differences then, there are many important similarities. Landscape search and two-armed bandit problems can be understood within a single framework that includes a multiplicity of different learning tasks for myopic agents, determined mainly by two parameters—the size of the solution space and the level of noise. The unified model can be seen as either a noisy landscape model or a bandit model with many arms, whose payoffs are the values of each location. Footnote 7
In the next section, I develop a unified model with a solution space that is both large and noisy, and I use the model to study the interaction between functional and demographic diversity.
3.2. Unifying two types of diversity
This unified model combines key features of the landscape model in Grim et al. (Reference Grim, Singer, Bramson, Holman, McGeehan and Berger2019) and key features of the two-armed bandit model in Fazelpour and Steel (Reference Fazelpour and Steel2022), focusing on distrust. Footnote 8
As in Grim et al. (Reference Grim, Singer, Bramson, Holman, McGeehan and Berger2019), there is a landscape consisting of $2000$
locations arranged in a loop. Every location is assigned a value in
$2000$
locations arranged in a loop. Every location is assigned a value in $\left[ {1,100} \right]$
, and nearby locations may have more or less similar values depending on how smooth the landscape is. Following the original search model, each group consists of
$\left[ {1,100} \right]$
, and nearby locations may have more or less similar values depending on how smooth the landscape is. Following the original search model, each group consists of $9$
agents, each with a heuristic, an ordered list of three distinct step sizes between 1 and 12. To conduct a search, an agent checks a number of steps ahead of their current location, and moves forward to a new location if the value of the new location is higher than the current one. They continue doing so until no higher value can be found at any of the locations reachable using their heuristic.
$9$
agents, each with a heuristic, an ordered list of three distinct step sizes between 1 and 12. To conduct a search, an agent checks a number of steps ahead of their current location, and moves forward to a new location if the value of the new location is higher than the current one. They continue doing so until no higher value can be found at any of the locations reachable using their heuristic.
In addition to the large solution space from the landscape paradigm, the unified model incorporates the uncertainty of two-armed bandit models. When an agent reaches a location, they cannot simply know the value of that location. Instead, they receive noisy signals drawn from a normal distribution centered at the true value. Suppose an agent reaches a location with value $\mu $
. Instead of simply knowing that the value is
$\mu $
. Instead of simply knowing that the value is $\mu $
, the agent sees a number randomly drawn from a Normal
$\mu $
, the agent sees a number randomly drawn from a Normal $\left( {\mu, \sigma } \right)$
distribution, where
$\left( {\mu, \sigma } \right)$
distribution, where $\sigma $
is the standard deviation. The larger
$\sigma $
is the standard deviation. The larger $\sigma $
is, the more likely that the agent is mistaken about which location to move to.
$\sigma $
is, the more likely that the agent is mistaken about which location to move to.
All the possible configurations of heuristics are first tested on each landscape to identify the best-performing individual agents relative to that landscape.
Footnote 9
Then, the top $9$
individuals are selected to be in the expert group. The functionally diverse group is selected randomly. Overall, the median expert group covers around
$9$
individuals are selected to be in the expert group. The functionally diverse group is selected randomly. Overall, the median expert group covers around $6$
of the
$6$
of the $12$
step sizes, whereas the median diverse group covers around
$12$
step sizes, whereas the median diverse group covers around $11$
of the
$11$
of the $12$
step sizes. This verifies that the labels “diverse group” and “homogeneous expert group” are warranted.
$12$
step sizes. This verifies that the labels “diverse group” and “homogeneous expert group” are warranted.
Group search proceeds by tournaments. All agents simultaneously conduct their searches. Once all $9$
agents terminate their search, they all move to the location with the highest value based on their combined search results. Then, they begin again, all starting from the best location found in the previous round. They continue until no better location can be found.
$9$
agents terminate their search, they all move to the location with the highest value based on their combined search results. Then, they begin again, all starting from the best location found in the previous round. They continue until no better location can be found.
Since the environment gives noisy information, there will often be a discrepancy between what the group believes to be the value of each location and the true values of those locations. Moreover, each agent may believe the same location to have different values given the noisy signals they receive. Decisions are made based on the believed values as opposed to the true values, which are unknown to agents. Epistemic success is evaluated by the true value of the solution that the group decides on based on their noisy information. When a location is visited multiple times, the group belief about the value of that location is the mean of their individual beliefs. For example, if a location is visited twice by two members of the group, and they respectively believe the value to be $45$
and
$45$
and $49$
, then the group believes the value of the location to be
$49$
, then the group believes the value of the location to be $47$
.
$47$
.
To integrate the dynamics of trust, we can implement an additional strategy for individual searches. The rule is simple. If someone I trust has already searched a location, I will directly take the trusted team member’s search result to be my own search result. On the other hand, if the location has not been searched, or has been searched but only by those I do not trust, then I will search it again and obtain my own reading of the value of that location. When there is no noise, as is the case in Grim et al. (Reference Grim, Singer, Bramson, Holman, McGeehan and Berger2019), trust level is irrelevant, since repeated readings will all produce identical outcomes.
In Fazelpour and Steel’s (Reference Fazelpour and Steel2022) model, the agent assigns less weight to the data collected by an out-group agent. A simple way to put it is that there is a parameter that determines how much out-group data is “discounted.” For example, given a parameter value $0.5$
, when an out-grouper observes 100 heads, the agent will only update as if 50 heads have been observed. On the other hand, in the unified model, the agent simply takes the data collected by an in-grouper as their own. If the data is observed by an out-grouper, they make new observations.
$0.5$
, when an out-grouper observes 100 heads, the agent will only update as if 50 heads have been observed. On the other hand, in the unified model, the agent simply takes the data collected by an in-grouper as their own. If the data is observed by an out-grouper, they make new observations.
Despite the apparent differences, these two ways of implementing distrust are similar in two significant ways. First, while distrust in the unified model does not involve directly assigning weights to the data of an out-grouper, the result of making a new observation which later on gets aggregated with the out-grouper’s data is similar—the out-grouper’s data now has a lower weight because it is averaged with the agent’s new observation. Second, and more importantly, they both indirectly influence the exploitation/exploration dynamics. In the two-armed bandit model, distrust is beneficial because it slows down convergence. When there is complete trust, all agents quickly end up updating their beliefs on similar observations and choosing to toss the same coin. Reduced trust helps maintain the range of different beliefs that exist within the epistemic community in earlier stages of the inquiry. In the unified model, distrust encourages different observed values of the same location, potentially leading agents to move to different locations even when they have similar step sizes available to them. Both implementations of distrust promote exploration indirectly, by maintaining a range of differing actions that agents take.
One might wonder whether we can just aggregate the beliefs of group members who do not trust each other to form the group belief. There are different possible ways to address this. Without modifying the model, we might interpret the aggregation as being enforced by a neutral outsider rather than the agents themselves, such as an unbiased director of a laboratory who takes into account all the available information collected by the group when making decisions about the future direction of research. We can also interpret distrust not as complete unwillingness to take into account the data collected by an out-grouper, but rather as believing that the out-grouper is less competent in finding out the precise value of a potential solution, and therefore giving less weight to the opinion of the out-grouper.
If we interpret the level of distrust as reflecting demographic diversity, as Fazelpour and Steel (Reference Fazelpour and Steel2022) do, then the subgroups are divided along demographic lines. This is not the only way to interpret the subgroups. After all, what Fazelpour and Steel (Reference Fazelpour and Steel2022) really show is that groups with members that do not fully trust each other may perform better than groups with fully trusting members. The connection from trust to demographic diversity needs to be established empirically, and might depend on each individual case. Therefore, for the remainder of this paper, when I speak of modelling “demographic diversity” I mean it in a loose sense, as a placeholder for communities with in-group/out-group trust dynamics like the above.
Studying the two types of diversity models under a unified framework has various advantages. First, it allows us to investigate how functional and demographic diversity interact. An epistemic group can be diverse in many different ways. If a hiring manager wants to increase diversity in her team for its epistemic benefits, should she look for someone from a different social background, or someone who studied different subjects in university, or maybe both? Understanding the interaction between these two kinds of diversity helps us make progress on practical questions about diversity.
Second, the unified model solves the problems I discussed at the end of section 2.1. The original landscape-based functional diversity models are all noiseless, which is unrealistic. Adding noise makes room for homogeneous groups to benefit from having multiple agents working on the same potential solution—they will get a better read of the value of that solution. In contrast to the original model, where there is no benefit to repeating the same work, there is now a tradeoff between diversity and homogeneity. The former has the advantage of coverage, whereas the latter has the advantage of more accurate estimations.
4. Results
With details of the unified model laid out, in this section we look at some results from simulations.
Footnote 10
For each level of smoothness from $1$
to
$1$
to $10$
, each noise level (
$10$
, each noise level ( $\sigma = 0,2,4, \ldots, 12$
), and each kind of trust dynamic,
$\sigma = 0,2,4, \ldots, 12$
), and each kind of trust dynamic, $100$
landscapes are randomly generated, and
$100$
landscapes are randomly generated, and $2000$
trials are done starting at each point of the landscape.
Footnote 11
The diverse and expert groups are compared based on the true value of the location they choose at the end of each simulation, averaged over all simulations.
Footnote 12
$2000$
trials are done starting at each point of the landscape.
Footnote 11
The diverse and expert groups are compared based on the true value of the location they choose at the end of each simulation, averaged over all simulations.
Footnote 12
Four levels of intra-group trust ( $0,{\rm{\;}}0.33,{\rm{\;}}0.5,1$
) are compared. The trust parameter corresponds to the size of subgroups (by percentage), with the exception of level
$0,{\rm{\;}}0.33,{\rm{\;}}0.5,1$
) are compared. The trust parameter corresponds to the size of subgroups (by percentage), with the exception of level $0$
. When trust =
$0$
. When trust = $0$
, agents only trust themselves, and will always revisit a location unless they have themselves already done so. When trust =
$0$
, agents only trust themselves, and will always revisit a location unless they have themselves already done so. When trust = $0.33$
, there are three randomly assigned subgroups of
$0.33$
, there are three randomly assigned subgroups of $3$
agents. When trust =
$3$
agents. When trust = $0.5$
, there are two random subgroups of sizes
$0.5$
, there are two random subgroups of sizes $4$
and
$4$
and $5$
. In the two intermediate cases, agents do not revisit locations already explored by an in-grouper, but do so when it is done by an out-grouper. When trust =
$5$
. In the two intermediate cases, agents do not revisit locations already explored by an in-grouper, but do so when it is done by an out-grouper. When trust = $1$
, no one revisits a location that has been explored.
$1$
, no one revisits a location that has been explored.
Interpreted as reflecting demographic division, trust = $1$
corresponds to a completely homogeneous group, trust =
$1$
corresponds to a completely homogeneous group, trust = $0.33$
or
$0.33$
or $5$
represent groups with members from two or three different social identity categories, and trust =
$5$
represent groups with members from two or three different social identity categories, and trust = $0$
corresponds to a group that is diverse enough that there is no clear conception of in-groups.
$0$
corresponds to a group that is diverse enough that there is no clear conception of in-groups.
The main findings are as follows. When functional diversity is implemented by variation of search strategies, and demographic diversity is implemented by distrust:
-
(1) Noise often increases epistemic performance by promoting exploration (section 4.1).
-
(2) The presence of noise extends the range of landscapes in which “diversity trumps expertise” holds (section 4.2).
-
(3) Demographic diversity is more beneficial in a functionally homogeneous group than in a functionally diverse group (section 4.3).
4.1. Noise-driven exploration
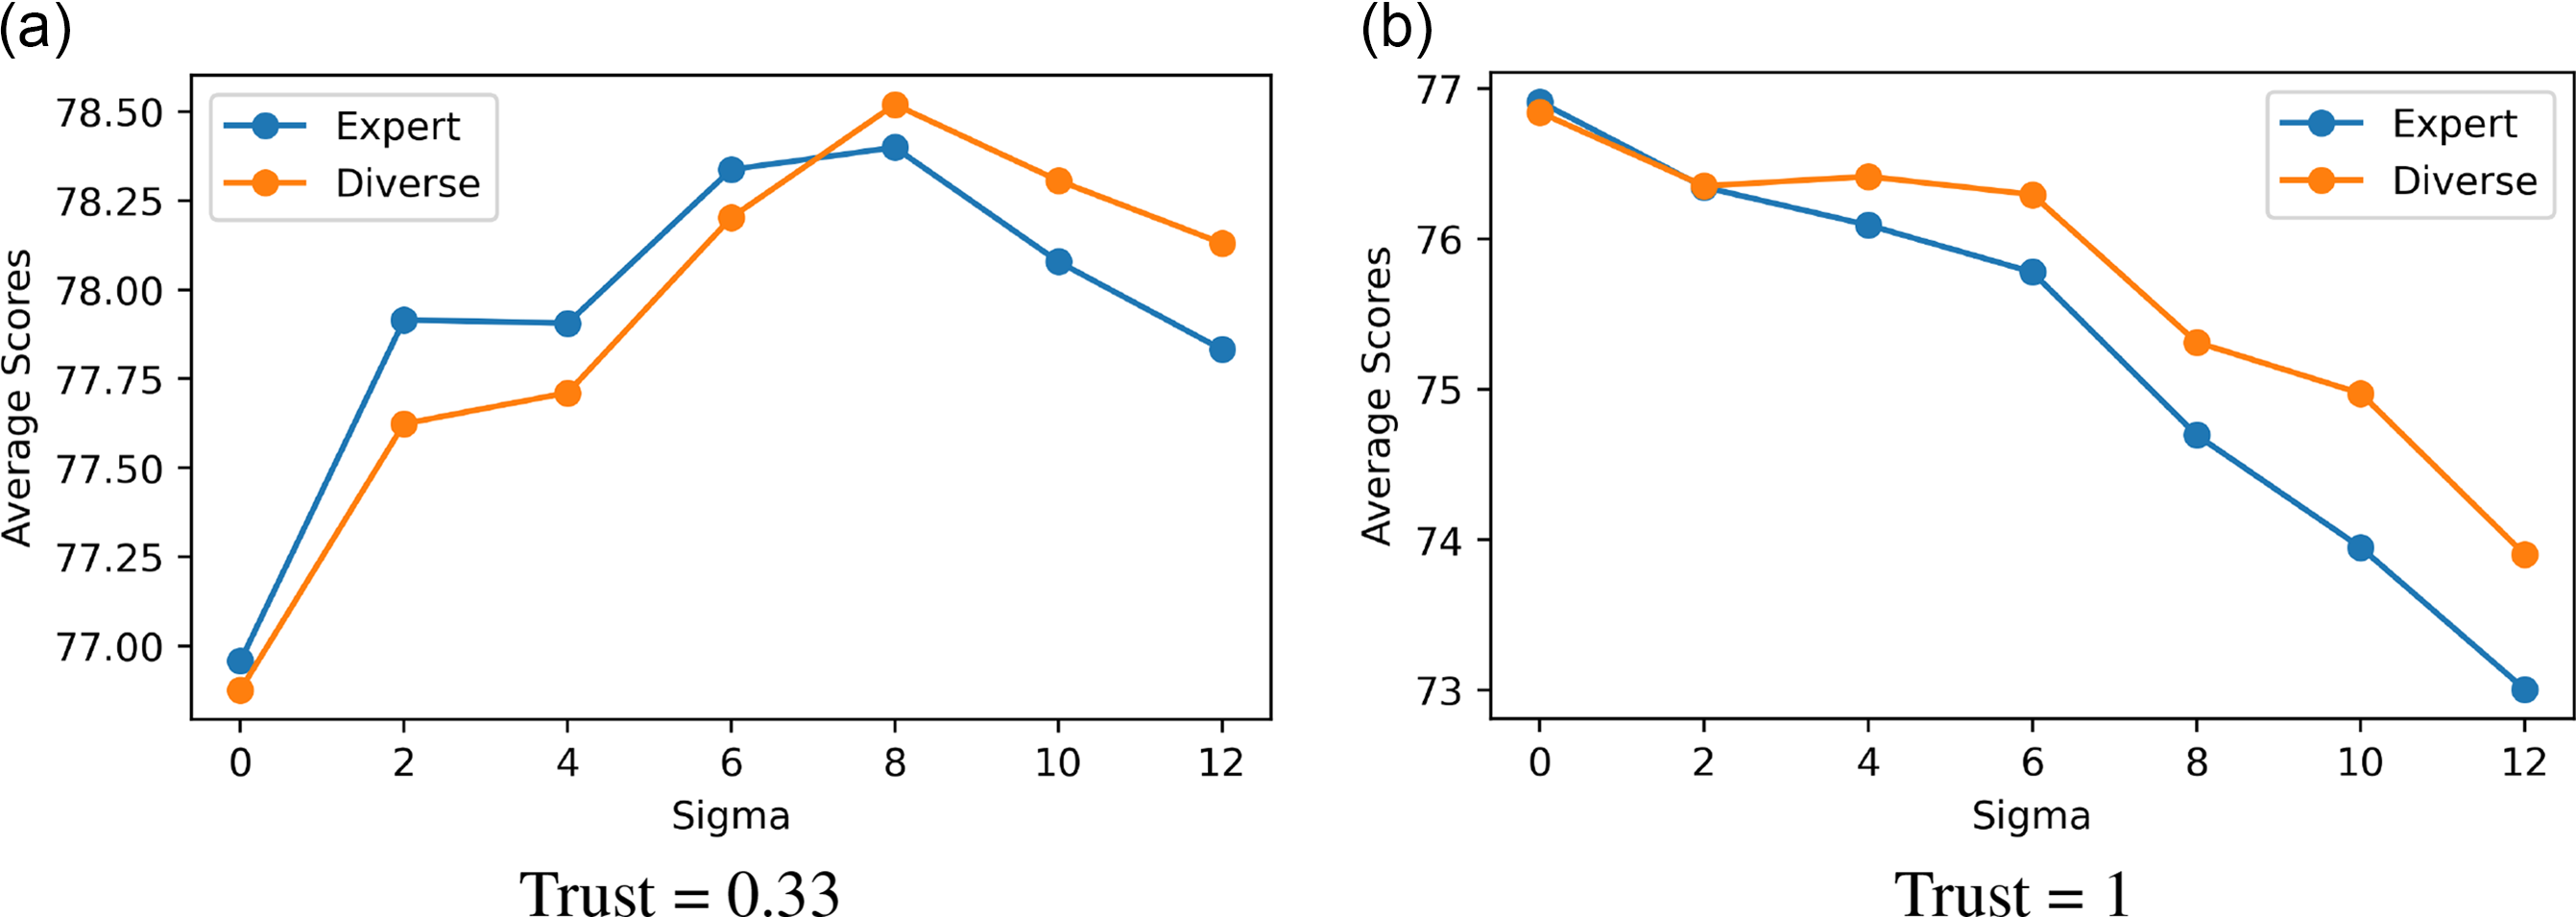
While we might expect noise to negatively affect epistemic performance globally, both the diverse and expert groups actually perform better when there is some noise. This can be explained by the exploitation/exploration dynamic. With distrust, agents will sometimes visit the same locations, and with noise, agents who visit the same location could end up taking different actions because the signals they receive from the environment differ. So noisy signals can drive exploration, even when agents make decisions following a simple myopic algorithm.
Figure 1 shows the mean scores of both diverse and expert groups across different noise levels at smoothness = 8. When there is some distrust (left panel, trust level = 0.33), the mean score first gradually increases with $\sigma $
until it reaches the peak at
$\sigma $
until it reaches the peak at $\sigma = 8$
, then decreases. An epistemic group performs best when there is enough noise to make agents explore, but not so much noise that the signals become uninformative or completely misleading. The peak is where this balance is reached. (The same qualitative result holds for all levels of smoothness and distrust, although the
$\sigma = 8$
, then decreases. An epistemic group performs best when there is enough noise to make agents explore, but not so much noise that the signals become uninformative or completely misleading. The peak is where this balance is reached. (The same qualitative result holds for all levels of smoothness and distrust, although the $\sigma $
at which the mean score peaks differs.)
Footnote 13
When there is no distrust at all (right panel, trust =
$\sigma $
at which the mean score peaks differs.)
Footnote 13
When there is no distrust at all (right panel, trust = $1$
), noise does not promote exploration since agents never visit the same locations, and therefore never receive diverging signals. In this case, the effect of noise is only negative. As we can see in figure 1(b), the mean score decreases as
$1$
), noise does not promote exploration since agents never visit the same locations, and therefore never receive diverging signals. In this case, the effect of noise is only negative. As we can see in figure 1(b), the mean score decreases as $\sigma $
increases. This observation supports the explanation that noise improves epistemic performance by encouraging exploration.
$\sigma $
increases. This observation supports the explanation that noise improves epistemic performance by encouraging exploration.
Mean score of diverse and expert groups by level of noise. Smoothness = 8.
It is not clear how the fact that both groups perform better with some noise in the environment should inform practical decisions, though, since noise from the environment is usually not within our control. What could be practically relevant, on the other hand, is understanding the advantage of cognitive diversity and expertise relative to each other with the presence of noise, to which we now turn.
4.2. Diversity trumps expertise
Figure 2 shows the difference in average score between the diverse and expert groups by noise level and smoothness. Noise level varies along the vertical axis and smoothness varies along the horizontal axis. Red tiles of the mosaic indicate more advantage brought by cognitive diversity, and blue indicates that homogeneous experts perform better. The trust level is fixed at $0.33$
in figure 2. No qualitative difference is observed at different levels of distrust.
$0.33$
in figure 2. No qualitative difference is observed at different levels of distrust.
Difference in average score between the diverse and expert groups by noise level and smoothness. Trust = 0.33.
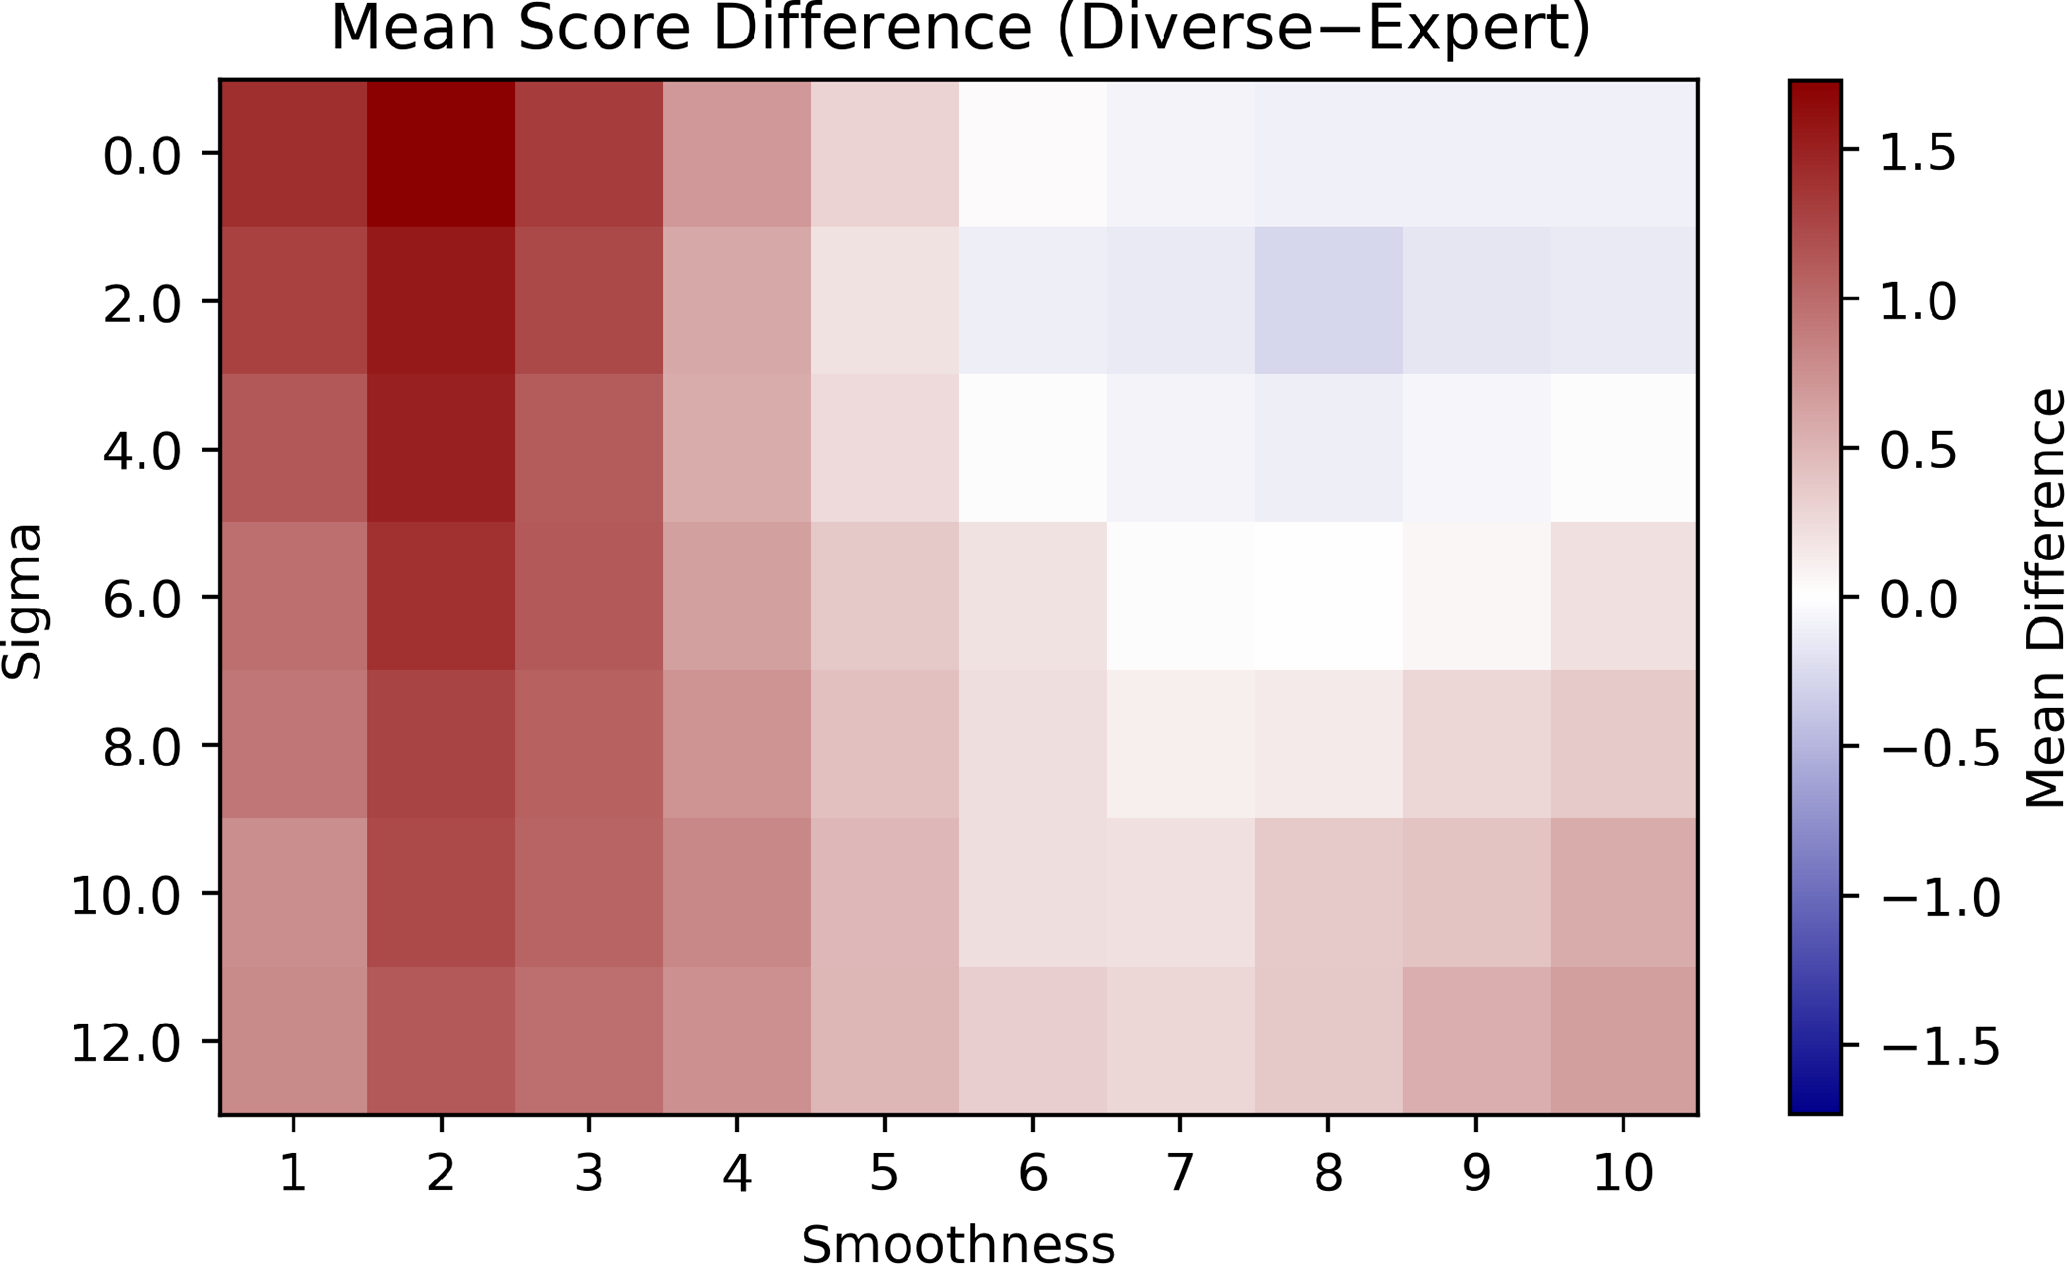
When there is no noise ( $\sigma = 0$
) in the environment, the model is equivalent to the tournament model in Grim et al. (Reference Grim, Singer, Bramson, Holman, McGeehan and Berger2019), and their simulation results replicate. In the top row of figure 2 we see that smoothness favors expertise, whereas ruggedness favors cognitive diversity. Moreover, when the cognitively diverse group outperforms the homogeneous experts, the difference in mean score is much higher than the difference when the homogeneous experts outperform the diverse group. (Red tiles tend to be darker than blue tiles.)
$\sigma = 0$
) in the environment, the model is equivalent to the tournament model in Grim et al. (Reference Grim, Singer, Bramson, Holman, McGeehan and Berger2019), and their simulation results replicate. In the top row of figure 2 we see that smoothness favors expertise, whereas ruggedness favors cognitive diversity. Moreover, when the cognitively diverse group outperforms the homogeneous experts, the difference in mean score is much higher than the difference when the homogeneous experts outperform the diverse group. (Red tiles tend to be darker than blue tiles.)
This same trend roughly holds across different levels of noise. However, as noise increases, it is no longer the case that the smoother the landscape, the more advantage the experts have. Instead, the relative advantage of experts increases up until smoothness = 7 or 8, and then begins to decrease. When landscapes are only characterized by smoothness, the story is simple: expertise is more beneficial on smoother search spaces. Once noise enters the picture, the story is complicated, and the range of landscapes where expertise trumps cognitive diversity becomes more restricted—expertise trumps diversity only when the landscape is smooth, but not too smooth, and there is some, but not too much, noise.
Noise thus strengthens the “diversity trumps expertise” result from previous models (Hong and Page Reference Hong and Page2004; Grim et al. Reference Grim, Singer, Bramson, Holman, McGeehan and Berger2019; Singer Reference Singer2019). When faced with a problem where it is difficult to determine the value of a solution, cognitive diversity is likely more beneficial.
4.3. Distrust
Another question of practical relevance is how the level of demographic diversity (distrust) affects epistemic performance. In particular, how does the effect of demographic diversity interact with functional diversity?
The tradeoff between functional diversity and expertise in previous models (Hong and Page Reference Hong and Page2004; Grim et al. Reference Grim, Singer, Bramson, Holman, McGeehan and Berger2019) is understood as follows: experts tend to be similar, and homogeneity negatively affects epistemic performance. So we should sometimes prefer a diverse group over a group of experts. However, as I have argued, these models fail to account for uncertainty about the value of a solution, and social dynamics between agents. Therefore, they cannot express some advantages of homogeneity.
Noisy signals make room for repeated work to be beneficial, so with noise and trust dynamics added, there is a new tradeoff—the coverage–precision tradeoff between diversity and homogeneity. The diverse groups cover a lot of ground, which increases the chance of hitting a location with a high value. However, due to the lack of overlapping step sizes, they are more likely to be misled by noisy signals. The homogeneous expert group, on the contrary, does not cover as much ground, but collects more evidence about the value of each location they visit, hence are more likely to have accurate beliefs about the value of a solution.
But trust diminishes the advantage of homogeneous expert groups in this tradeoff. It reduces repetition, and therefore decreases the homogeneous expert group’s advantage in accurately assessing solutions. On the other hand, distrust does not create as much advantage for the functionally diverse group as it does for the homogeneous experts, since there is less functional overlap to begin with. Increasing distrust therefore decreases the relative advantage that functionally diverse groups have over the homogeneous experts. Figure 3 confirms this analysis. When there is full trust, cognitively diverse groups outperform homogeneous experts by a large margin. As distrust increases, the relative advantage of experts increases.
The $x$
-axis is the level of distrust. In (a), the
$x$
-axis is the level of distrust. In (a), the $y$
-axis is the percentage of trials where the functionally diverse group outperforms the homogeneous expert group. In (b), the
$y$
-axis is the percentage of trials where the functionally diverse group outperforms the homogeneous expert group. In (b), the $y$
-axis shows the mean score of homogeneous expert groups subtracted from the mean score of diverse groups. There is no qualitative difference found between the different
$y$
-axis shows the mean score of homogeneous expert groups subtracted from the mean score of diverse groups. There is no qualitative difference found between the different $\sigma $
and smoothness levels, so only trials with
$\sigma $
and smoothness levels, so only trials with $\sigma = 4$
and smoothness = 6 are shown in the graph.
$\sigma = 4$
and smoothness = 6 are shown in the graph.
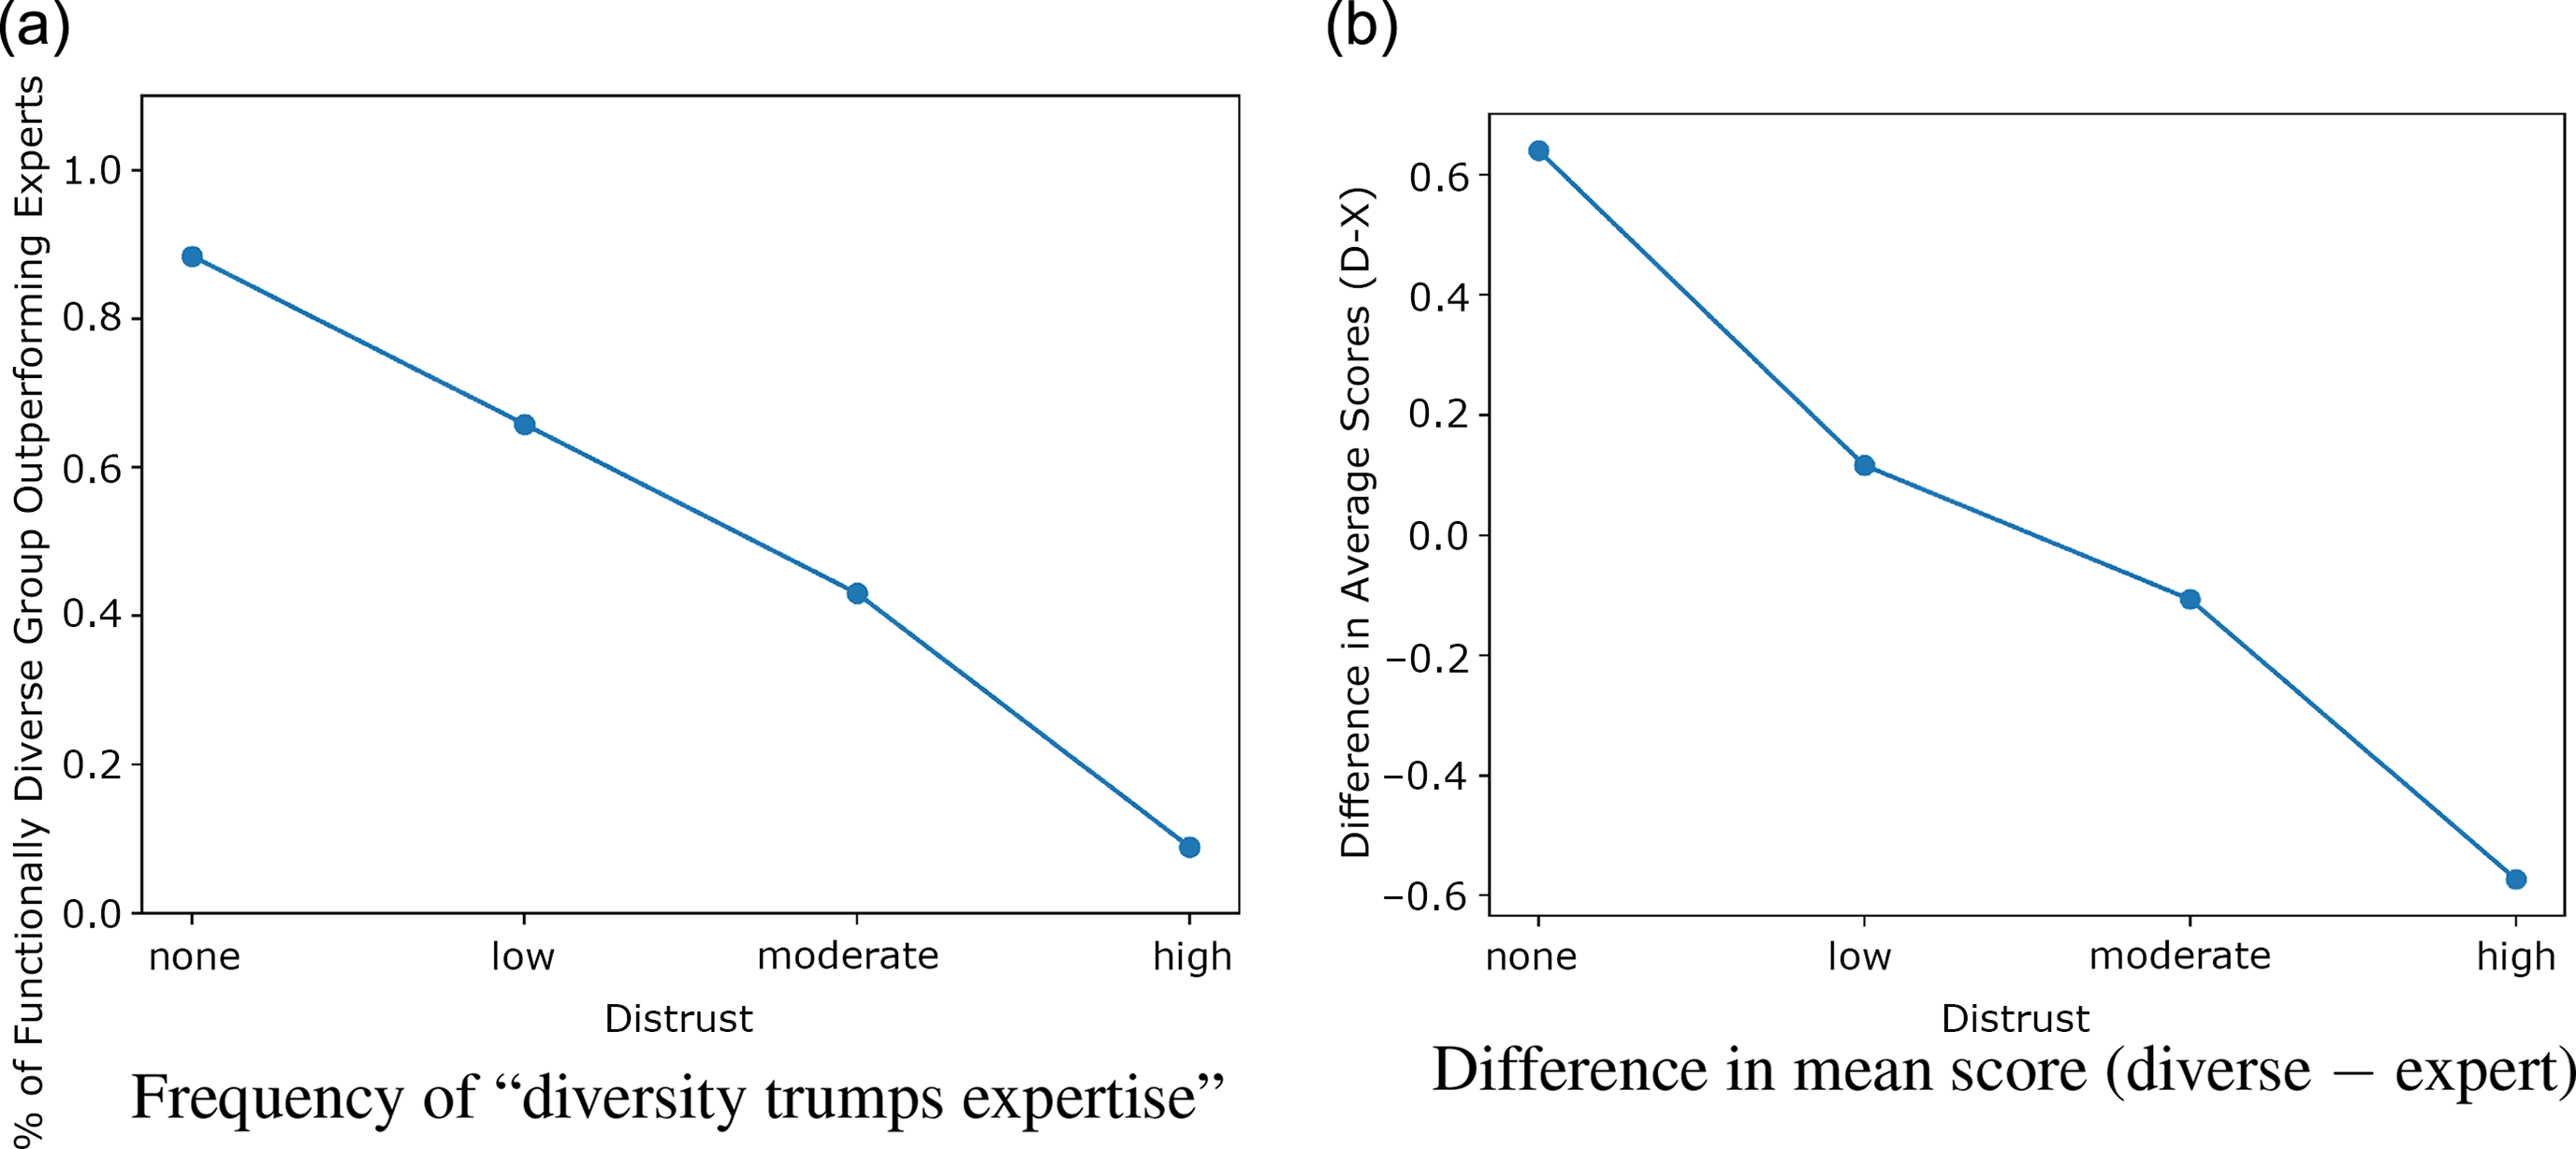
The epistemic benefits of functional and demographic diversity, at least as they are construed in the literature, are non-additive. Distrust is especially important in a functionally homogeneous group, but has no benefit without functional overlap between group members.
One general lesson that we can draw is that different notions of diversity should not be considered in isolation when we try to understand how they affect epistemic performance. Fazelpour and Steel’s (Reference Fazelpour and Steel2022) project is to identify demographic diversity’s direct epistemic contribution, as opposed to via a contingent correlation with functional diversity. It turns out their argument is partially contingent on functional diversity after all, albeit in an unexpected manner—demographic division does not need to correlate with functional diversity to be epistemically beneficial, but its benefit through distrust is more pronounced when the group is functionally homogeneous.
5. Conclusion
Models of epistemic communities used in social epistemology currently come in two main kinds—noiseless landscape search tasks and two-armed bandit problems. I have argued that these two types of models can be seen as instances of a more general class of learning tasks determined by two parameters: the size of the solution space and the noise level of signals. They also share exploitation/exploration dynamics thanks to agents employing myopic decision rules. Against the backdrop of this unified framework, I develop a model of diversity that allows us to study the effects of functional and demographic diversity at the same time.
By adding noise to the environment and trust dynamics between agents, the present model is more realistic than previous models. However, as always, there are limitations to the expressive power of a computational model. Below I name a few.
First, while distrust can epistemically benefit a group by encouraging more diligent data collection, there are other costs to distrust, such as communications barriers and other operational cost. Although the benefit of demographic diversity diminishes with the increase of functional diversity, its effect is never negative in the current model, because costs of demographic diversity are not captured.
Second, the observations from the previous section do not directly translate to conclusions about real-world diversity, since there might be other ways in which the two notions of diversity bring epistemic benefits that are not captured by existing models.
Finally, to bring the model one more step closer to reality, future work could limit how many searches agents can conduct, either individually or across the entire group, since there are always limits to time and resources in problem-solving.
Acknowledgments
I would like to thank two anonymous reviewers, Jonathan Weisberg, Jennifer Nagel, Boris Babic, and Richard Pettigrew for their valuable comments and discussions on various drafts of this paper. I would also like to thank the Pronovost-Morgan Family Foundation for Ethical AI and Schwartz Reisman Institute for Technology and Society for their support.


 Open access