


1. Introduction
1.1. Vocabulary and socio-economic status
Students from lower socio-economic status (SES) backgrounds often exhibit poorer academic outcomes than their higher SES peers (Schoon et al., Reference Schoon, Jones, Cheng and Maughan2012). This has been related to limited language exposure and lower academic attainments in low-income families (Hoff, Reference Hoff2006; Nag, Reference Nag, Perfetti, Pugh, Verhoeven and Nag2023; Neuman et al., Reference Neuman, Kaefer and Pinkham2018). Indeed, children from low-SES backgrounds hear fewer, less diverse, and less complex vocabulary than higher SES peers (Hart & Risley, Reference Hart and Risley2003; Hoff, Reference Hoff2003).
Such lack of exposure to rich vocabulary limits knowledge building and literacy development (Hoff, Reference Hoff2006, Reference Hoff2013), leading to impoverished language-related capacities (Rakesh et al., Reference Rakesh, Lee, Gaikwad and McLaughlin2024), including vocabulary itself (Cain et al., Reference Cain, Oakhill and Elbro2003). The vocabulary–literacy inter-connection and the role of SES in vocabulary development are well documented and their relationship has been studied to understand the underlying mechanisms. For example, Buckingham et al. (Reference Buckingham, Wheldall and Beaman-Wheldall2013) highlight school and individual factors contributing to the SES–vocabulary growth relationship in English-speaking countries. Individual factors include environmental interactions and early literacy abilities. At school, they identify differences in teaching practices and instructional quality (see also Neuman et al., Reference Neuman, Kaefer and Pinkham2018). Further studies have detailed the mediation of different variables in the SES–literacy relationship, such as parenting styles (Hoff & Laursen, Reference Hoff and Laursen2019; Pungello et al., Reference Pungello, Iruka, Dotterer, Mills-Koonce and Reznick2009), cognitive capacities (Lervåg et al., Reference Lervåg, Dolean, Tincas and Melby-Lervåg2019), language-related abilities (Von Stumm et al., Reference Von Stumm, Rimfeld, Dale and Plomin2020), and the type of vocabulary assessed (Van Der Kleij et al., Reference Van Der Kleij, Burgess, Ricketts and Shapiro2023).
Concerning the impact of children’s environments on vocabulary development, Hoff (Reference Hoff2003) demonstrated that the growth of children’s productive vocabulary varies as a function of maternal speech that, in turn, differs according to the SES. Similarly, Ma et al. (Reference Ma, Fan and Chen2024) claim that differences in vocabulary development across SES groups can be explained by the learning environment that parents are able to provide. If we consider linguistic interactions, families with greater economic and educational resources may have more opportunities to offer access to academic vocabulary than low-SES parents that might be at a disadvantage in providing this type of linguistic input, which would lead to differences in school performance.
According to the lexical legacy hypothesis (K. Nation, Reference Nation2017), both reading and spoken language offer opportunities for encountering words in diverse and meaningful contexts. Such exposure contributes to word acquisition. Perfetti’s Lexical Quality Hypothesis posits that knowing a word involves having robust representations of its orthographic, phonological, and semantic features, as well as strong connections between these dimensions (Perfetti & Hart, Reference Perfetti, Hart, Verhoeven, Elbro and Reitsma2002). Therefore, someone may have heard the word serendipity and know how to write it but not fully grasp its meaning. The distinction between having a formal representation of a word but not the full meaning can be accounted by the description of two features of vocabulary, namely, vocabulary breadth and depth. In the example earlier, serendipity may be part of the lexical repertoire, contributing to vocabulary breadth but not depth.
1.2. Breadth and depth of vocabulary
Studies reporting vocabulary measures often focus on the number of lexical items or the vocabulary growth rate (Schmitt, Reference Schmitt2014; Webb, Reference Webb and Chapelle2012; Yanagisawa & Webb, Reference Yanagisawa, Webb and Webb2019). They assess basically the links between form and word meaning, but not the detailed knowledge of the existing vocabulary. For example, Neuman et al. (Reference Neuman, Kaefer and Pinkham2018) reported that children from low-income families were exposed to poorer language in content and quantity, both in families and schools, compared to higher income peers, leading to lower performance in vocabulary tests. The differences were remarkable in the Peabody Picture Vocabulary Test-IV (PPVT-IV; Dunn & Dunn, Reference Dunn and Dunn2007), and the Woodcock–Johnson III–Picture Vocabulary sub-test (WJIII-PV; Woodcock et al., Reference Woodcock, McGrew and Mather2007). These tests require matching images to words, that is, they measure essentially, vocabulary breadth, but not vocabulary depth.
Vocabulary breadth refers to the number of words known by someone while vocabulary depth refers to detailed word knowledge that someone could have of their vocabulary. Initially, this distinction accounted for differences in word knowledge (P. Nation, Reference Nation2019) and aided vocabulary measurement (Anderson & Freebody, Reference Anderson and Freebody1981) as well as curriculum design. Lately, it has contributed to studies on L1 and L2 word learning (Read, Reference Read, Bogaards and Laufer2004; Yanagisawa & Webb, Reference Yanagisawa, Webb and Webb2019) and has been supported by the unique predictive values that both breadth and depth provide in reading assessment (Ouellette, Reference Ouellette2006; Tong & Tong, Reference Tong and Tong2022). Alternatively, some authors argue against separating breadth and depth, given their strong correlation (Vermeer, Reference Vermeer2001), with some studies providing mixed results on their distinct contribution to reading comprehension (Lawrence, Reference Lawrence2018). This debate is relevant, but beyond the scope of this study (for a review, see Webb, Reference Webb2020). We were interested in the impact of SES on vocabulary and its features rather than their relationship to other linguistic skills.
1.3. Measuring breadth and depth
Vocabulary breadth proves easier to assess than depth. According to Schmitt (Reference Schmitt2014), linking a word form with its meaning reflects vocabulary breadth since this allows to infer the number of words for which there exists a referent in someone’s lexicon. Thus, vocabulary-size tests that reflect the capacity of an individual to link word forms to their referents are generally considered measures of breadth (Schmitt, Reference Schmitt2014). Classic examples include the PPVT (Dunn & Dunn, Reference Dunn and Dunn2007) and the WJIII-PV (Woodcock et al., Reference Woodcock, McGrew and Mather2007), where participants are required to match a picture with a word presented orally. The resulting score indicates how many words are known by the person taking the test, though the reliability of these scores depends on the quality of test standardization and the comparability of the populations on which the norms were based. This is important to consider, especially in bilingual and low-SES populations, as these kinds of tests are highly decontextualized. They typically require to produce responses for vocabulary that is not common or not related to their experience (see Gibson et al., Reference Gibson, Oller and Jarmulowicz2018; Peets & Bialystok, Reference Peets and Bialystok2015, for discussions).
In contrast, measuring vocabulary depth has proven more difficult to conceptualize. Nation (Reference Nation2001) proposes that assessing knowledge of word-specific features (e.g., grammar, syntax, collocations, and register) is a good way to account for vocabulary depth. However, Meara and Wolter (Reference Meara and Wolter2009) argue that evaluating different aspects of word knowledge does not necessarily capture overall vocabulary knowledge; instead, it is necessary to evaluate the relationship that exists between words within the lexicon. Thus, measures of depth should consider both the ability to connect words to one another and identify detailed intra-word information.
The synonyms sub-test from the Test of Word Knowledge (Wiig & Secord, Reference Wiig and Secord2012) evaluates the ability to retrieve words related to each other, focusing on the connections among words. The Word Associates Test (WAT; Read, Reference Read1998) requires participants to link a target word to its meaning and identify relevant word associations (both synonyms and collocates). Another task that could refine such assessment is the attributes sub-test from the Language Processing Test–Revised (LPT-R; Richard & Hanner, Reference Richard and Hanner1995), because it measures the capacity to identify intra-word information. This task requires describing objects and providing information such as colour, size, shape, or category, thereby enabling a more detailed assessment of the extent to which the word is known. The Vocabulary Knowledge Scale (VKS; Wesche & Paribakht, Reference Wesche and Paribakht1996) allows individuals to rate their knowledge of individual words on a five-point scale. Originally developed to measure vocabulary gains from reading, the test is now a general measure of vocabulary depth (Schmitt, Reference Schmitt2014). However, because the VKS provides a subjective judgement of knowledge about individual words, it is insufficient on its own to completely capture vocabulary depth. In fact, the more unfamiliar a word is, the more challenging it will be to evaluate the knowledge of it.
All in all, these tasks go beyond the form–meaning association to capture the detailed knowledge of the words already known. Furthermore, some standardized tests blur not only the line between breadth and depth by demanding to recall individual word meanings, but also the articulation of nuanced definitions (e.g., WISC-V; Wechsler, Reference Wechsler2014). Such overlap may help explain the strong correlations often observed between breadth and depth, as a larger vocabulary facilitates the acquisition of richer meanings and the establishment of relationships among words (Cain et al., Reference Cain, Oakhill and Elbro2003).
1.4. Research question
Children from low-SES backgrounds might be at a disadvantage in building quality lexical representations, as they typically receive less linguistic input than their higher SES peers. While research consistently shows that SES negatively affects vocabulary, the tasks used in these studies most often tap on vocabulary size. Given the distinction between knowing a word (i.e., breadth) and knowing it well (i.e., depth), it remains unclear whether SES affects vocabulary depth to the same extent that it has been shown to impact vocabulary breadth (Neuman et al., Reference Neuman, Kaefer and Pinkham2018). Our study addresses this question in fourth and fifth graders. More precisely, we wondered whether the SES relationship to vocabulary depth, if it exists, is direct or is mediated by vocabulary breadth. We measured breadth through picture designation, while depth was measured as attributes task and a self-assessment task designed for this study as well as a class-adapted synonyms task.
This design was chosen because most SES-related vocabulary studies have been conducted in English and have focused on academic vocabulary or clinical populations (Deane et al., Reference Deane, Lawless, Li, Sabatini, Bejar and O’Reilly2014; Schmitt, Reference Schmitt2014; Webb, Reference Webb and Chapelle2012) and because commonly used standardized tests provide information about vocabulary size while measuring vocabulary depth remains challenging. Moreover, standardized tests may amplify SES differences because they often emphasize academic vocabulary that is less familiar to children from low-SES backgrounds (Marulis & Neuman, Reference Marulis and Neuman2010; Van Der Kleij et al., Reference Van Der Kleij, Burgess, Ricketts and Shapiro2023). As a result, children from low-SES backgrounds may appear to know fewer words not because their vocabularies are smaller, but because the words they do know are under-represented in this kind of assessments.
2. Method
2.1. Participants
Participants were 219 fourth and fifth graders (9–11 years old) from five low- and average-SES schools in France, all of whom spoke French as their primary language. Due to missing data, analyses were conducted on 212 participants (M = 10 years, SD = 0.62).
In France, schools are designated based on the IPS (Social Position Index; Dauphant et al., Reference Dauphant, Evain, Guillerm, Simon and Rocher2023), a composite indicator derived from the socio-economic and cultural background of students’ families (parents’ profession and level of education, number of books at home, etc.), which reflects the socio-economic status of children attending the school.Footnote 1 Schools with a low IPS serve areas with significant socio-economic challenges and are designated as REP (Priority Education Network in French).Footnote 2 Since the participating schools in this study differed in IPS values and there was a different number of children per school, it was not appropriate to use IPS as a continuous grouping factor. Instead, the REP classification was used to define the two student groups. Three schools in the REP category comprised the low SES group (IPS = 63.4, 71.2, 77.8; n = 132, coded as 0), while two schools outside this category comprised the average SES group (IPS = 104, 126; n = 80, coded as 1).
Informed consent was obtained from the children’s legal guardians, and oral assent was secured before the assessment, with the option to withdraw at any time. Teachers confirmed that participants had no learning, cognitive, sensory (e.g., uncorrected visual or hearing impairments), or psychiatric disorders, based on their access to student records and regular interactions. This study was approved by the Ethical Committee (Ref. 2023-730-S120) and complied with the EU General Data Protection Regulation (GDPR) under the supervision of the Data Protection Official (DPO, reference 2025-028) at [Lille] University. It adheres to the ethical principles outlined in the Declaration of Helsinki.
2.2. Vocabulary assessment
Children completed tasks measuring breadth and depth:
-
1. Attributes. Adapted from the Lexical Processing Test–Revised (Richard & Hanner, Reference Richard and Hanner1995). Children had to read a list of descriptions, including function, colour, size, shape, category, and composition that could correspond or not to words presented in writing. Their task was to indicate the descriptions that corresponded to each word. The words were the same as in the self-assessment task.
-
2. Synonyms. Based on the synonyms sub-test of the Test of Word Knowledge (Wiig & Secord, Reference Wiig and Secord2012), children read a text with underlined words. For each underlined word, they had to select a synonym from a list of three possibilities.
-
3. Self-assessment of vocabulary knowledge. Adapted from Wesche and Paribakht (Reference Wesche and Paribakht1996), children used a 0–15 scale to indicate how well they believed they knew certain words they heard. The stimuli included 20 words drawn from the Manulex database (Lété et al., Reference Lété, Sprenger-Charolles and Colé2004). Word frequencies ranged from 3.03 to 493.3 occurrences per million, based on data for 8- to 11-year-olds (Annex 1).
-
4. Picture designation task. Taken from the battery to assess written and oral language (EVALEO 6–15, Launay et al., Reference Launay, Maeder, Roustit and Touzin2018). Children heard a word and had to select the corresponding image from four options.
One minute word recognition task. Children had to cross the words out of a mixed list of words and pseudo-words within a minute. This task was intended to control potential reading-related differences between children.
2.3. Procedure
The session took place in the children’s usual classroom. The main researcher introduced himself, obtained consent from the children to participate in the study and distributed the booklet containing all the tasks. They were administered in a fixed order in pencil-and-paper format to the entire class in a single 45 minutes session.
Self-assessment of vocabulary was the first task, followed by the picture designation task. Next, participants completed the attributes task, and finally, the synonyms task. Once all children had finished, the researcher carefully explained the word recognition task and started the timer. At the end, the researcher collected the booklets and concluded the session.
3. Results
The raw data on which these analyses were carried out will be available on demand at the next address: https://doi.org/10.57745/LPOH2R. Descriptive statistics are reported in Table 1. Reliability estimates were good for the attributes task (ω = .874), and acceptable for picture designation (ω = .739) and self-assessment (ω = .785). Internal consistency was not applicable to the synonyms task as scoring was based on the total performance rather than individual item responses. Nonetheless, previous research on similar sub-tests reports reliability coefficients ranging from .84 to .93 (Wiig & Secord, Reference Wiig and Secord2012).
Descriptive statistics for average- and low-SES groups’ performance on vocabulary breadth and depth measures and word recognition

Note: Picture designation has a maximum score of 42; attributes, 44; self-assessment, 15; synonyms, 7; word recognition has no fixed maximum.
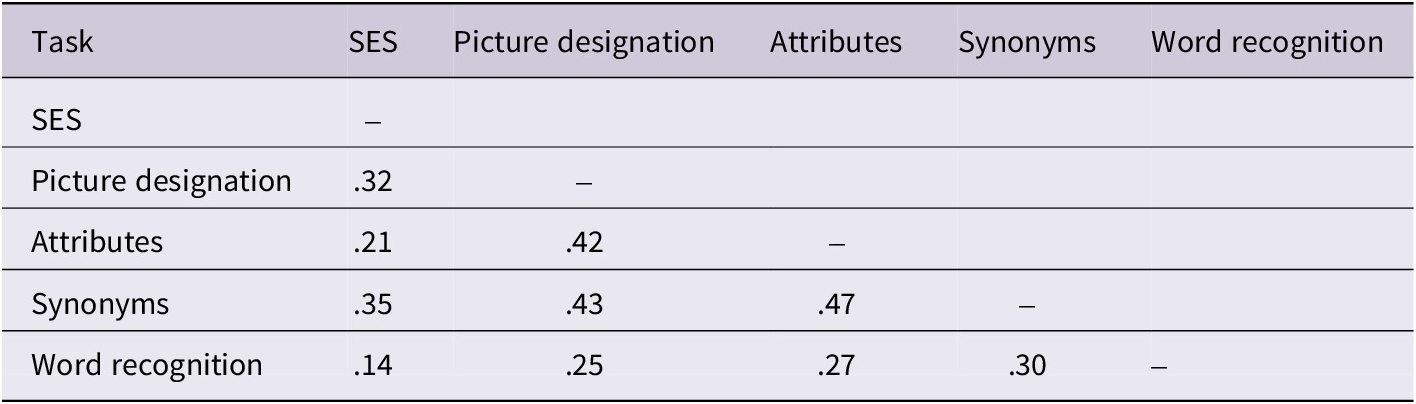
The subsequent analyses were conducted using STATA release 16 (Stata Statistical Software, 2019) software. The distribution of the data for the synonyms task did not deviate significantly from normality. Applying log transformations corrected skewness in the attributes, picture designation, and word recognition tasks, with the transformed data meeting the assumption of normality (Shapiro–Wilk, p > .05). Self-assessment scores remained highly skewed, suggesting a near-ceiling effect, and were therefore excluded from further analyses. The remaining scores were standardized (M = 0, SD = 1) to facilitate interpretation of regression analyses results. Table 2 reports the correlations between SES and the test scores, all of which were significant at α < .05.
Correlation of the standardized variables and SES

Note: All variables were standardized. Correlations are Pearson’s r coefficients, all of which were significant at α < .05.
Model comparisons were conducted to assess the fit of linear, quadratic, and cubic regressions for each pair of variables. Of the 30 comparisons performed (10 relationships × 3 models), only two yielded statistically significant improvements. However, the additional variance explained by the more complex models was minimal. Thus, to avoid unnecessary statistical complexity, subsequent analyses were conducted within a linear framework (Cohen et al., Reference Cohen, Cohen, West and Aiken2003, pp. 225–227). Hierarchical regression analyses, presented in Table 3, were conducted to examine the effect of SES on both vocabulary breadth and vocabulary depth, as measured by the attributes and synonyms tasks. In addition, we assessed the extent to which each vocabulary dimension predicted variance in the other. In each model, performance on the word-recognition task was entered as a covariate to control for individual differences in reading.
Hierarchical regression analyses of breadth and depth variables

Note: CI = confidence interval; LL = lower limit; UL = upper limit; bootstrapped R2 based on 1000 bootstrap re-samples ΔR 2 = change in R 2. Step 3a adds depth as measured by the attributes task; Step 3b adds depth as measured by the synonyms task.
To evaluate the assumptions underlying the regression analyses, residual diagnostics were systematically conducted. Visual inspection of standardized residuals, together with statistical tests, indicated that residuals did not significantly deviate from normality, revealed no severe outliers, and showed no evidence of heteroscedasticity. The variance inflation factors (VIFs) and condition numbers for all predictors were less than 1.16 and 2.30, respectively, indicating no problematic multi-collinearity across analyses. Finally, non-significant results on both the Breusch–Godfrey and Durbin’s alternative tests suggested the absence of residual autocorrelation in all analyses.
As expected, SES significantly predicted vocabulary breadth, F(1, 210) = 25.18, p < .001. Importantly, it also significantly predicted vocabulary depth, F(1, 210) = 9.74, p = .002 for attributes and F(1, 210) = 30.22, p < .001 for synonyms. Adding breadth improved depth models, ΔR 2 = .109 for attributes, ΔR 2 = .078 for synonyms, while reducing SES effects which, for the attributes task, became non-significant. This suggested a possible mediation effect. For this reason, mediation analyses were conducted using the “Mediate” algorithm with 1000 bootstrap re-samples to ensure robust confidence intervals (see Hayes, Reference Hayes2017, for a discussion of the advantages of this method over the normal theory approach for making statistical inferences about indirect effects).
When assessed by the attributes task, the direct effect of socio-economic status (SES) on vocabulary depth was no longer significant, indicating that the effect of SES was fully mediated by breadth (Table 4). In contrast, when assessed by the synonyms task, SES remained a significant direct predictor of depth, with a weaker mediation effect by breadth (Table 5). Overall, breadth mediates the relationship between SES and vocabulary depth, with a stronger direct effect of SES on the synonyms task compared to the attributes task.
Mediation analysis for vocabulary depth as measured by the attributes task

Note: The upper limit of the 95% confidence interval for the proportion mediated here exceeds 100%, a result that stems from the way this index is computed – as the ratio of the indirect effect to the total effect. When the total effect, used as the denominator, is small or unstable in bootstrap samples, the proportion mediated can surpass 100%. This instability limits the interpretability of the proportion of total effect mediated, making the indirect effect (ACME) a more reliable and interesting indicator (Hayes, Reference Hayes2009).
Mediation analysis for vocabulary depth as measured by the synonyms task

4. Discussion
Our analysis revealed that SES predicts vocabulary breadth, in line with previous research (Hart & Risley, Reference Hart and Risley2003; Hoff, Reference Hoff2006; Lervåg et al., Reference Lervåg, Dolean, Tincas and Melby-Lervåg2019). Critically, it also predicted performance on measures of depth, even after controlling for breadth in the synonyms task, which had not been previously investigated. This suggests that socio-economic disparities extend beyond vocabulary size to include vocabulary depth.
According to the Lexical Legacy Hypothesis (K. Nation, Reference Nation2017), frequent and diverse encounters with words in meaningful contexts help form robust lexical representations and strengthen their connections. The Lexical Quality Hypothesis (Perfetti & Hart, Reference Perfetti, Hart, Verhoeven, Elbro and Reitsma2002) further suggests that strong lexical representations are crucial for effective reading and language processing which in turn enhance word knowledge, that is, the depth of vocabulary. Children from lower SES backgrounds may therefore struggle to create stable, inter-connected lexical representations, which is impacting vocabulary depth. One likely explanation is that these children are exposed to less rich and varied language both at home (Hart & Risley, Reference Hart and Risley2003; Hoff, Reference Hoff2006; Nag, Reference Nag, Perfetti, Pugh, Verhoeven and Nag2023) and at school (Buckingham et al., Reference Buckingham, Wheldall and Beaman-Wheldall2013; Neuman et al., Reference Neuman, Kaefer and Pinkham2018).
The variability in mediation outcomes across depth tasks highlights the complexity of the construct itself. In accordance with previous frameworks, we assessed both the depth of intra-word knowledge and the capacity to relate words between them (Meara & Wolter, Reference Meara and Wolter2009; Webb, Reference Webb and Chapelle2012).While a wider breadth of vocabulary can facilitate performance on measures relying on reading, SES continues to yield a direct influence on vocabulary depth when tasks require more inter-lexical processing, such as retrieving semantic links between words. The different patterns observed across tasks may therefore be explained by their specific demands and the capacities they solicit. In this study, the attributes task required reading and understanding descriptions to determine whether they matched a word, whereas the synonyms tasks requested identifying related words.
It is noteworthy, however, that SES played a significant role in performance on the attributes task before accounting for breadth. Once breadth was included in the model, the impact of SES disappeared, suggesting that general vocabulary knowledge explained children’s ability to identify more word characteristics. That is, knowing more words likely improved their understanding of the descriptions used in the task. This underscores the importance of carefully selecting and precising what each task assesses when measuring vocabulary depth. Otherwise, the linguistic challenges faced by children from at-risk populations may be under-represented, which may guide to misleading conclusions about their vocabulary knowledge.
The differential impact of SES on denomination and performance on the synonyms task suggests that breadth and depth remain distinct dimensions of vocabulary knowledge, consistent with studies demonstrating their independent contribution to reading (Ouellette, Reference Ouellette2006; Tong & Tong, Reference Tong and Tong2022). However, the finding that breadth mediated the SES effect on the attributes task reinforces the idea of carefully selecting measures of depth. Tasks that require producing or recognizing more words than a child actually knows may blur the distinction between these two domains of vocabulary. As Vermeer (Reference Vermeer2001) argues, they are inherently inter-related, making it difficult to isolate one without engaging the other. Hence, further research on additional facets of vocabulary depth in which SES may have a role might be beneficial.
The present findings also highlight the potential value of interventions that address both vocabulary breadth and depth, particularly for children from low-SES backgrounds. Although many vocabulary-building programmes focus on expanding the number of words children know (Marulis & Neuman, Reference Marulis and Neuman2010), our results suggest that supporting richer semantic representations and strengthening connections among words may also be important. For instance, strategies that encourage children to explore the meanings, usage, and semantic relationships of words in different contexts could be more effective in fostering deep, long-lasting vocabulary learning (Beck et al., Reference Beck, McKeown and Kucan2013).
Some limitations of this study should be acknowledged. First, the measures of vocabulary depth were tailored for this study and, while they showed acceptable reliability, further validation is needed. Nonetheless, to our knowledge, this is the first attempt to measure breadth and depth separately to analyse the impact of SES. Second, in this study, we could not assess socio-economic status at the individual level. SES was linked to schools rather than to each child, which prevents us from disentangling the effects of children’s own SES from potential effects of school-level characteristics. This limitation is relevant because school quality could partly account for the observed differences, as shown in previous work in English-speaking contexts demonstrating SES-related variability in instructional quality (Buckingham et al., Reference Buckingham, Wheldall and Beaman-Wheldall2013; Neuman et al., Reference Neuman, Kaefer and Pinkham2018). Note, however, that in France, every school follows the same national curriculum, and teachers in the low-SES areas are generally experimented. However, one cannot rule out other unmeasured school-level influences. Finally, while we controlled for word recognition in our analyses, other cognitive or environmental variables, such as working memory (Rakesh et al., Reference Rakesh, Lee, Gaikwad and McLaughlin2024) or home literacy practices (Neuman et al., Reference Neuman, Kaefer and Pinkham2018), could also influence the relationship between SES and vocabulary development.
Future research may benefit from using different tasks aiming to measure depth in order to identify where the line blurs with breadth. It would also be worthy to evaluate whether interventions that target vocabulary depth in addition to breadth can mitigate SES-related vocabulary gaps. Clarifying how both domains of vocabulary distinguish could inform more precise vocabulary research and educational practices.
5. Conclusion
In summary, our study highlights SES’s impact on both breadth and depth of children’s vocabulary. The distinction between breadth and depth of vocabulary may help to design effective educational interventions to reduce the vocabulary gap between children from low- and high-SES backgrounds. In short, efforts to improve children’s vocabulary knowledge must focus not only on the number of words they know, but also on the quality and depth of their understanding.
Acknowledgements
The authors acknowledge the schools that participated in this study, as well as the parents and children who generously agreed to take part in the research. Special thanks to the teachers who very kindly facilitated the data collection process. This work was supported by PIA 3 100% IDT Inclusion: un defi, un territoire, which funded the first author’s doctoral contract.
Statement of ethical approval
Lille University Behavioral Science Ethics Committee.
Ethics Committee Reference for the Study: 2023-730-S120.
Type of consent: informed written consent from the parents.
Note that a simplified version was provided for parents who might have experienced difficulty understanding the original.
Furthermore, the participating children were informed that they could opt out of the experiment at any time prior to its start.
Annexes
List of words used in the attributes and the self-assessment tasks

Note: GRAM: grammatical category; ORTHO: orthographic form; NBLET: number of letters; FREQ: word frequency.


 Open access