Providing optimal nutrition to extremely preterm infants is a continual clinical challenge. Rapid growth is desirable for the best possible neurodevelopment( Reference Ehrenkranz, Dusick and Vohr 1 ). Historically, commercial formula was provided to preterm infants to ensure that rapid growth occurred and that nutrient intake was well defined( Reference Klein 2 ). However, preterm infants are susceptible to inflammatory diseases such as necrotising enterocolitis (NEC)( Reference Lin and Stoll 3 ). A change in policy to the preferential provision of mother’s own milk (MOM) as the major nutrient source for preterm infants was associated with a decrease in the rates of NEC( Reference Quigley and McGuire 4 ), and a recent consensus summary paper recommended that pasteurised donor human milk (PDHM) be offered as the second choice if MOM is unavailable( Reference Kumar, Singhal and Vaidya 5 ). The establishment of an adequate maternal milk supply can be difficult after preterm delivery( Reference Underwood 6 ). Where available, PDHM is provided in preference to formula, and this contributed to decreasing rates of NEC( Reference Quigley and McGuire 4 ). However, the rate of growth achieved by preterm infants fed predominantly PDHM can be suboptimal, potentially due to the later stage of lactation of many mothers donating breast milk or through nutrient losses during the pasteurisation process( Reference Boyd, Quigley and Brocklehurst 7 , Reference Montjaux-Régis, Cristini and Arnaud 8 ).
Therefore, it is important that preterm infants receiving the majority of their nutrition from PDHM should be assessed to ensure well-established clinical growth targets are being met( Reference de Halleux, Pieltain and Senterre 9 ). The majority of studies assessing the benefits of feeding preterm infants with donor milk have not assessed nutrient-fortified milk( Reference Quigley and McGuire 4 ). Nutrient fortification of breast milk is the standard for preterm infant nutrition in many neonatal intensive care units (NICU) and should be included when evaluating growth. We report here a retrospective clinical audit of the growth of preterm infants (<30 weeks’ gestational age) receiving either a majority of PDHM or a majority of MOM up to 34+1 weeks postmenstrual age (PMA), with fortification being supplied to preterm infants in both groups as per hospital nutritional policy.
Methods
Ethics statement
This retrospective clinical audit was approved by the King Edward Memorial Hospital (KEMH) Ethics committee under the Governance, Evidence, Knowledge and Outcome (GEKO) quality improvement framework (GEKO 8302). This research was conducted according to the Declaration of Helsinki.
Database
The data were collected and managed using Research Electronic Data Capture (REDCap), a secure, web-based application hosted at the National Health and Medical Research Council Preterm Infants Centre of Research Excellence to store de-identified data retrieved from individual infant medical records.
Subjects
Group 1 included all preterm infants consecutively born ≤30 weeks of gestation at KEMH between 1 January 2012 and 13 April 2013, and who had been dispensed PDHM on ≥28 d (n 53). Preterm infants dispensed PDHM preferentially receive MOM if it is available. Of the 116 preterm infants of eligible gestational age born in 2012, forty-seven received ≥28 d PDHM and records were available for forty-two subjects. One preterm infant was born in late December 2011 but was dispensed ≥28 d of PDHM in 2012 and was included in this study. One infant was 30 weeks’ gestational age (0 d) at birth. Ten subjects in this group were born between 1 January 2013 and 13 April 2013, thus resulting in a total number of fifty-three subjects, henceforth referred to as the PDHM group.
Group 2 preterm infants were born ≤30 weeks of gestation at KEMH between 1 January 2012 and 31 December 2012, and were matched by gestational age with subjects from the PDHM group. Preterm infants in group 2 received ≥28 d of their MOM (n 43), henceforth, referred to as the MOM group.
Eligible subjects were only excluded when medical records were not available from the Medical Records Department during the term of the audit.
Nutrient intake
The nutrient sources provided to infants were recorded on the same day every week (week PMA+1) for all subjects during admission from 24+1 weeks’ PMA to 40+1 weeks’ PMA: PDHM, MOM, level 1 (L1) fortification, level 2 (L2) fortification, preterm formula, term formula, yes/no only. Total nutrient intake volume (ml/d) and nutrient source (PDHM, MOM, L1 supplementation, L2 fortification, preterm formula, term formula) were also collected for all infants from the 1st day of regain of birth weight for 28 d. Where mixed feeding was provided, volumes of individual components fed to infants were often not recorded, but the total volume fed was clearly reported for all infants.
Perron Rotary Express Milk bank
The Perron Rotary Express Milk (PREM) bank situated at KEMH was the first modern milk bank established in Australia and began providing milk to preterm infants in 2007. Policies underpinning the management of the milk bank have been previously described( Reference Hartmann, Pang and Keil 10 ). Donors are selected when they have a natural oversupply (many of these are the mothers of preterm infants themselves) and an infant aged <12 months. Hence, batches were provided at different stages of lactation. Donors are screened using an interview, medical survey and serological testing which is repeated every 3 months during the donation period. Composition screening of individual milk batches (batches are pooled donations from a single donor) is not routinely performed. Batched analyses performed during the first years of operation estimated a mean fat content of the donor milk as 3·4 g/100 ml and the mean protein content as 1·1 g/100 ml, and these values are routinely used when calculating daily energy intake for preterm infants. This strategy has been shown by others to reduce variability for some nutrients( Reference Valentine, Morrow and Reisinger 11 ).
Pasteurised donor human milk feeding strategy
At KEMH, preterm infants ≤32 weeks’ PMA are fed with breast milk only. All donor milk are pasteurised but MOM is not pasteurised. PDHM is provided to supplement expressed milk or as a substitute if no maternal milk is available. Consent to receive PDHM is obtained by lactation consultants who provide daily lactation support to the mothers of preterm infants while the infants are admitted to the neonatal care unit. In 2012, infants were transitioned from PDHM to preterm infant formula at 33–34 weeks’ PMA. L1 fortification is introduced once full enteral feeds are tolerated and is a commercially available multinutrient supplement with added protein that is estimated to increase the total protein concentration to 3·0–3·2 g protein/100 ml breast milk. L2 fortification is provided to infants who are fluid restricted (<150 ml/kg per d) or who are not growing well (at the discretion of the medical team) and is estimated to increase the total protein concentration to 3·4–3·6 g protein/100 ml breast milk.
Growth velocity
All weight, length and head circumference measurements were performed by nurses using standard procedures. The day of life to regain birth weight (RBW, the first of three successive days that the weight was greater than or equal to the birth weight) was identified for each infant from daily records( Reference Patel, Engstrom and Meier 12 ). Weights were collected weekly from the time of admission (day 1 of each admission week, for example, for a baby born at gestational age=23 weeks+5 d, the first value would be collected at 24+1 PMA, the second value at 25+1 PMA) until discharge or 40+1 weeks’ PMA. z Scores were calculated at birth and 34+1 weeks using the revised Fenton preterm growth charts( Reference Fenton and Kim 13 ) using the clinical actual age percentile and z score calculator available at http://www.ucalgary.ca/fenton/2013chart (calculator written with assistance of Timothy P. Stevens, MD, MPH, University of Rochester).
Weight growth velocity (GV) was estimated using the exponential model developed and validated in very-low-birth-weight infants by Patel et al.( Reference Patel, Engstrom and Meier 12 ), from RBW until the end of the time interval. The rate was calculated as follows:
 $${\rm GV}{\equals}{{\left( {1000{\times}\ln \left( {{{W_{n} } \over {W_{1} }}} \right)} \right)} \over {\left( {D_{n} {\minus}D_{1} } \right)}}$$
W n denotes the weight at the end of the time interval, W 1 is the RBW, while D 1 is the age at RBW and D n is a day at the end of time interval.
Predetermined subgroup analyses
Two separate subgroup analyses were planned: (1) removal of preterm infants from both groups that were intra-uterine growth restricted (IUGR) defined as <10th percentile at delivery (PDHM group, n 5, MOM group, n 8) and (2) removal of infants from the PDHM group that had received more MOM than PDHM. This confounder existed because the pre-determined criterion for inclusion was ≥28 d PDHM dispensed, with the relative volume of PDHM and MOM not assessed before data collection. The contribution of MOM was assessed for all PDHM group preterm infants by evaluating the daily milk intake over 28 d of admission from the 1st day of regained birth weight (≥50 % MOM on ≥14 d were the exclusion criteria). In total, fourteen preterm infants were excluded from the PDHM group, including one subject that received preterm formula from day 20 of the 28-day data collection period (n 39).
Statistical analysis
The mean weight GV of preterm infants receiving mostly PDHM was postulated to be less than that of preterm infants receiving their mothers own milk at 34 weeks’ PMA. The hypothesised effect size was 1·5 g/kg per d using the exponential model( Reference Patel, Engstrom and Meier 12 ) and preliminary data estimates from discharge weights in the KEMH NICU. The statistical power was calculated using an anticipated mean of 15·0 (SD2·5) g/kg per d (group 1) compared with the group 2 mean of 16·5 g/kg per d, with a statistical power of 80 % and a two-sided significance level of 0·05. Descriptive statistics were used to summarise the main characteristics of the two groups at 34+1 weeks’ PMA. Means and confidence intervals were calculated for continuous data and percentages for categorical data. t Tests were performed on all normally distributed data and two-sided P values were used throughout to assess significance. Data that were not normally distributed was analysed by Mann–Whitney testing. All data were normally distributed unless otherwise indicated. A P value <0·05 was considered to be statistically significant. Data were analysed using SAS version 9.4 (SAS Institute).
Results
Baseline and enteral feed characteristics
The medical records from ninety-six preterm infants were used in this retrospective audit. The mean birth weight and mean gestational age at birth were not statistically different between the two groups (Table 1). Of the preterm infants, 43 % were from multiple births in the PDHM group compared with 19 % in the MOM group (P=0·009). Nine (17 %) subjects in the PDHM group and eleven (28 %) in the MOM group were diagnosed with sepsis (P=0·31).
Population characteristics of preterm infants who received either pasteurised donor human milk (PDHM) or mother’s own milk (MOM) as the dominant nutrient source from birth to 34 weeks’ postmenstrual age (Mean values and 95 % confidence intervals; percentages; medians)
IUGR, intra-uterine growth restriction.
* IUGR, <10th percentile birth weight for gestational age at delivery.
† Days to birth weight regain was not available for one infant in the PDHM group and the MOM group.
‡ Data were not normally distributed and have been analysed using the Mann–Whitney test.
§ Days to full enteral feed was not available for one infant in the PDHM group.
Source of nutrition from birth to discharge
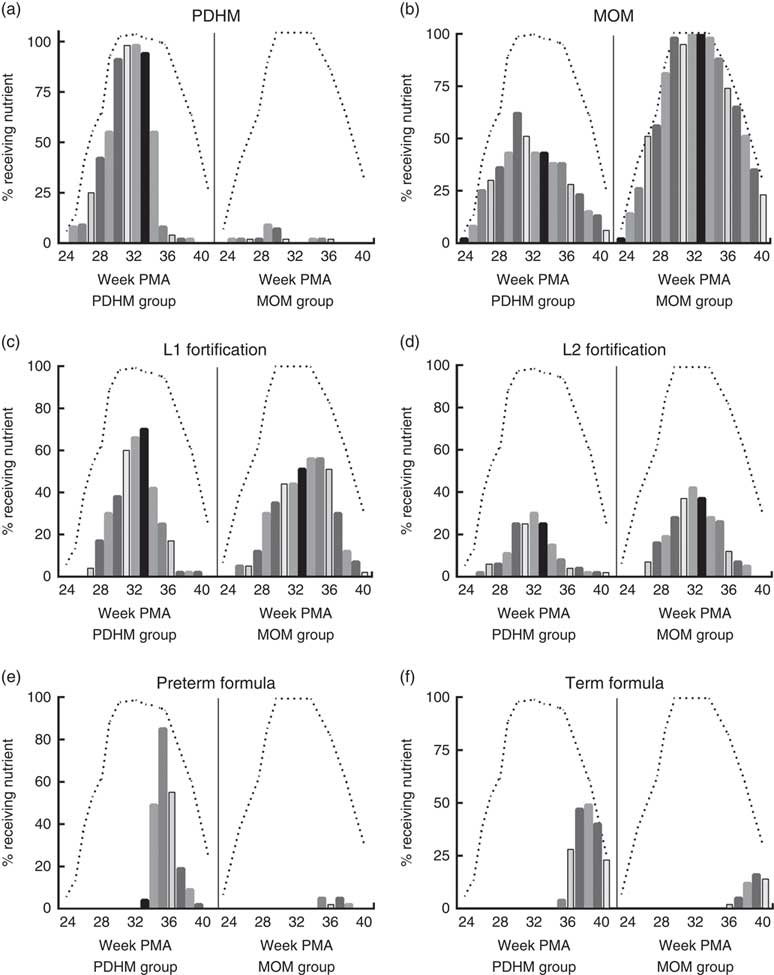
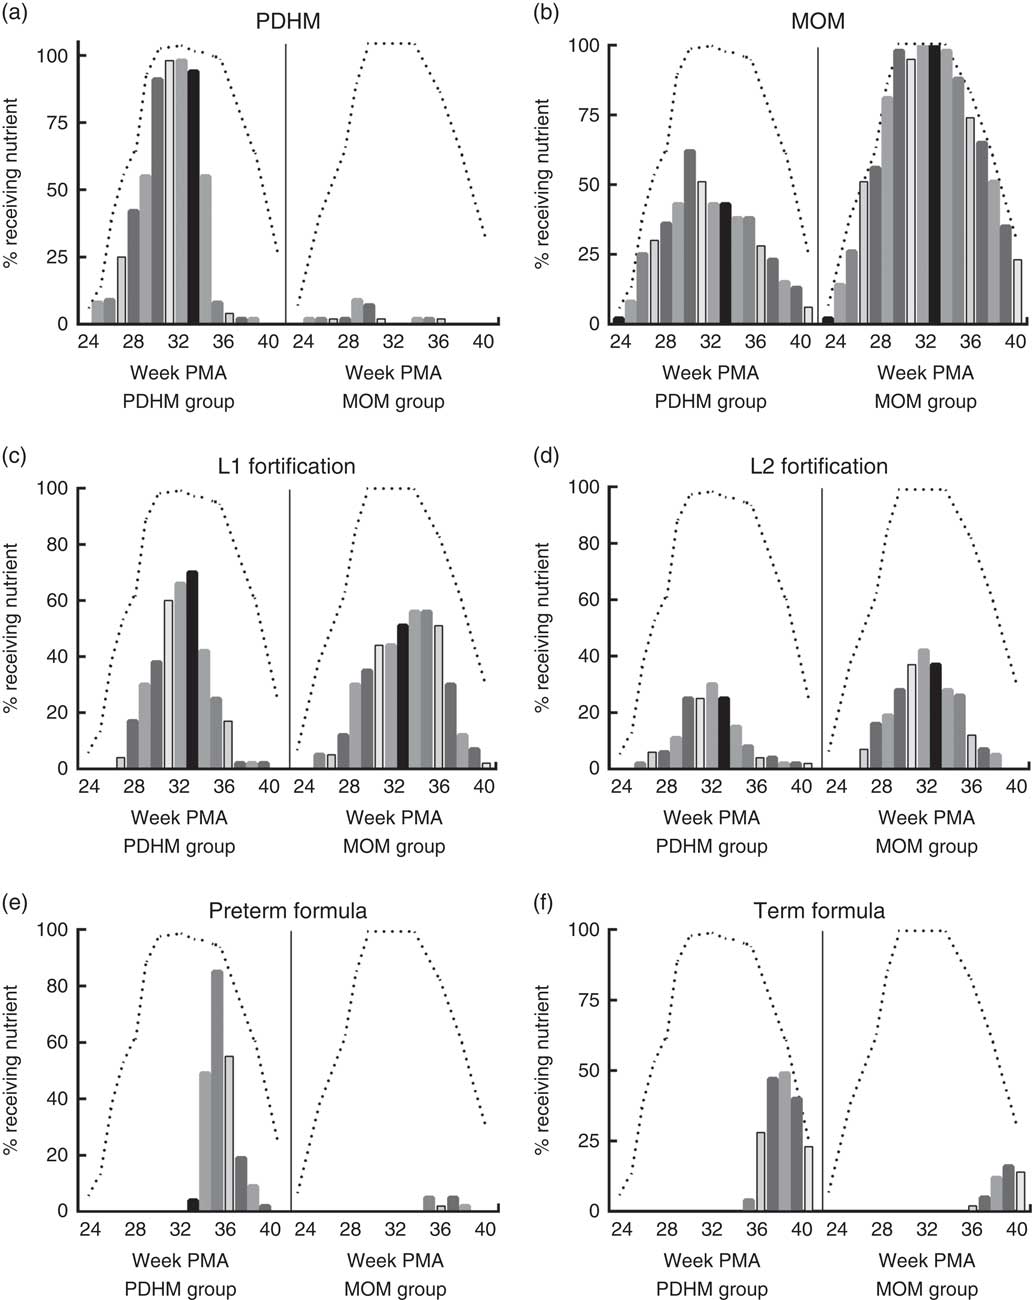
Using the weekly nutrient intake data, the nutrient sources for all infants were determined for each week of admission (Fig. 1). These data show that infants in the PDHM group received a proportion of their nutrient intake from MOM (e.g. 62 % of the PDHM group received some MOM on week 30+1 PMA, MOM is not pasteurised). Some infants from the MOM group received PDHM (e.g. 9 % of the MOM group preterm infants received PDHM at week 29 PMA). Of the PDHM group, 13 % did not receive any MOM during their admission. The PDHM group received more L1 fortification until week 33 PMA, after which time, they were transitioned to preterm formula. In contrast, the proportion of preterm infants receiving L2 fortification was generally lower in the PDHM group subjects.
Nutrition source for pasteurised donor human milk (PDHM) group and mother’s own milk (MOM) group from 24+1 to 40+1 weeks’ postmenstrual age (PMA). The nutrient sources provided ((a) PDHM, (b) MOM, (c) level 1 (L1) fortification, (d) level 2 (L2) fortification, (e) preterm formula, (f) term formula) to infants were recorded on the same day every week of admission (week PMA+1) (yes/no) for the PDHM group (n 53) and MOM group 2 (n 43) from 24+1 weeks’ PMA to 40+1 weeks’ PMA. The bars show the percentage of each group fed a specific type of nutrient each week (each bar designates 1 week). The dashed line (- - -) shows the percentage of each group that was an inpatient in hospital each week (data could only be collected from inpatients). The number of babies admitted each week changed due to the age of delivery (increasing as babies were born from weeks 24 to 30) and the time of discharge (decreasing as babies were discharged either to another hospital or home, from week 33 PMA).
Milk intake on day 28 of life
To establish whether the volume of nutrient (MOM or PDHM) provided to the two groups differed, the enteral intake in millilitres was recorded on day 28 of life. The gestational age at birth was not taken into account when assessing this variable. There was no significant difference between the mean intake for the PDHM group (196·4 (SD 9·95) ml) compared with that of the MOM group (183·1 (SD12·01) ml, P=0·391), suggesting that there was no gross difference in the volume of nutrient consumed.
Weight growth velocity at 34+1 weeks’ postmenstrual age
At 34+1 weeks’ PMA, the weight GV (calculated from birth weight regained) was significantly different between the PDHM group and the MOM group, P=0·007 (Table 2). There was no significant difference in the z score or the weight of the two groups. However, the change in z score between birth and 34+1 weeks’ PMA was significantly different between the groups.
Weight of preterm infants from regain of birth weight to 34+1 weeks’ postmenstrual age (PMA) (Mean values and 95 % confidence intervals; percentages)
PDHM, pasteurised donor human milk; MOM, mother’s own milk; EUGR, extra-uterine growth restriction.
* No accurate weight regained value was available for two subjects in the PDHM group, n 51 and one subject in the MOM group, n 42.
† Two subjects in the PDHM group and one subject in the MOM group were born too early for calculation of z score.
‡ EUGR=weight <10th percentile PMA.
Weight growth velocity from birth to discharge
No significant difference was observed in the length of hospital stay between the PDHM group and the MOM group (Table 1) nor in the weight at discharge (Table 3). The weight GV (from regain of birth weight to discharge) and z score change (from birth to discharge) during the hospital admission were not significantly different.
Growth of preterm infants from regain of birth weight to discharge (Mean values and 95 % confidence intervals; percentages)
PDHM, pasteurised donor human milk; MOM, mother’s own milk; EUGR, extra-uterine growth restriction.
* Data were not normally distributed and have been analysed using the Mann–Whitney test.
† No accurate weight regained value was available for one subject in the MOM group.
‡ Two subjects in the PDHM group and one subject in the MOM group were born too early for calculation of z score.
§ EUGR=weight <10th percentile PMA.
‖ Only available for sixty-one infants. PDHM group, n 26; MOM group, n 35.
Outcomes for preterm infants at the 12-month corrected age review
Some subjects were lost to follow-up at 12 months corrected age (CA, PDHM group, n 17, MOM group, n 7). Reasons for this included moving to another state/country and an inability to contact caregivers (some infants live in remote communities).
At 12 months CA, no significant differences were observed in the weight, length or head circumference between the two groups (Table 4).
Anthropometric outcomes for preterm infants at 12 months corrected age (CA): weight, length and head circumference (Mean values and 95 % confidence intervals)
PDHM, pasteurised donor human milk; MOM, mother’s own milk.
* In the PDHM group, one baby had the length reported, but not weight or head circumference.
Subgroup analysis 1: (removal of preterm infants from both groups that were intra-uterine growth restricted at delivery)
Removing IUGR infants (PDHM group: n 5, MOM group: n 8) slightly increased the anthropometric measurements at birth with no significant differences (data not shown). The only significant change in population characteristics between the two groups (when compared with Table 1) was the number of hours on ventilation, which decreased to 108·3, (95 % CI 45·3, 171·3) for the PDHM group and increased to 259·5 for the MOM group (95 % CI 139·5, 379·5, P=0·038).
At 12 months CA, there was a difference in weight of borderline significance between the two groups, and no significant difference in the head circumference or length (Table 5).
Anthropometric outcomes for preterm infants at 12 months corrected age (CA) with intra-uterine growth restriction infants excluded: weight, head circumference and length (Mean values and 95 % confidence intervals)
PDHM, pasteurised donor human milk; MOM, mother’s own milk.
* P=0·05.
† In the PDHM group, one baby had the length reported, but not weight or head circumference.
Subgroup analysis 2: removal of preterm infants that had received predominantly mother’s own milk (relative volume) from pasteurised donor human milk group
Daily nutrient intake data collected from the 1st day of regain of birth weight for twenty-eight consecutive days were used to evaluate the overall proportion of PDHM and MOM provided to preterm infants in the PDHM group. A total of fourteen subjects were removed from the PDHM group. The remaining PDHM group subjects (n 39) were analysed separately in a subgroup analysis (majority PDHM subgroup). As the MOM group was already narrowly defined by the requirement to have been fed for at least 28 d on MOM and <5 d on PDHM, no subjects were removed from this group.
The only significant changes in the baseline and enteral feed characteristics were the hours on ventilation (majority PDHM subgroup: 87·4, 95 % CI 20·4, 154·4 v. MOM group, 226·0 95 % CI 126·0, 326·0, P=0·03) and the mean head circumference at birth: majority PDHM subgroup 25·0 cm (95 % CI 24·3, 25·7), MOM group 24·0 cm (95 % CI 23·4, 24·6, P=0·05).
No change was observed in the significance of differences between the groups at 34+1 weeks’ PMA or at discharge after the subgroup analysis.
The subgroup analysis for the 12-month PMA review demonstrated a significant difference in the weight of the majority PDHM subgroup (10·1 kg, 95 % CI 9·4, 10·6) compared with the MOM group (9·2 kg, 95 % CI 8·8, 9·7, P=0·02), but all other values were similar (results not shown).
Discussion
This clinical audit was designed to assess the growth of preterm infants at KEMH for women. We demonstrated that although there was no significant difference in the weight of infants at 34+1 weeks’ PMA, there was a significant difference in the weight GV, g/kg per d( Reference Patel, Engstrom and Meier 12 ). By discharge, the difference in weight GV was no longer statistically significant, and no significant difference was noted in the weight of the two groups at the 12-month review. This suggests that any small deficit in growth over the period in which the preterm infant receives PDHM is transient, and catch-up growth is evident by discharge. The growth of preterm infants receiving PDHM is important because suboptimal growth may lead to impaired development( Reference Hintz, Kendrick and Stoll 14 ).
The major limitation of this study is that the number of subjects in each group was small due to the fact that it was a clinical audit and not a prospective trial. Subjects were included based on the number of days of PDHM dispensed during admission in the neonatal care unit, using PREM bank dispensing records. Preterm infants that were eligible for the PDHM group (≥28 d PDHM dispensed) were only excluded where the complete medical record was not available for data collection. MOM group preterm infants (≤5 d of PDHM dispensed and ≥28 d MOM) were chosen based on their gestational age, and subjects from multiple births were included for each group. However, the number of subjects from multiple births was significantly greater for the PDHM group, and this may have influenced the results. Many preterm infants born in the neonatal care unit at ≤32 weeks’ gestational age are provided with several days of PDHM if there is insufficient MOM when they are first introduced to enteral feeding, meaning that PDHM makes up a minor component of their overall nutrient intake (Fig. 1). No preterm infants in this study were provided with commercial formula before 32 weeks’ PMA, so this was not a major confounder.
Subjects were not excluded based on IUGR, and the subgroup analysis excluding these subjects suggests that there may have been global differences in health demonstrated by the significant difference in the hours of ventilation (higher for the MOM group). Future research should include more subjects per group, which will require combining several years of data. IUGR subjects should probably be excluded from the main analysis, but the growth of these preterm infants should be evaluated, as they are an important population within the NICU.
It is difficult to accurately group preterm infants on the basis of majority nutrition source, as the available nutrition source can change throughout admission due to the availability of MOM. It would be useful to collect data about the relative volumes of PDHM and MOM fed to preterm infants. However, this information was not always recorded on the daily charts and obtaining accurate values were not possible for this retrospective study. Future prospective studies could address this issue and provide accurate volumes of PDHM/MOM consumed daily.
In this observational study, it was surprising that a higher proportion of preterm infants in the MOM group was provided with L2 fortification compared with those in the PDHM group (Fig. 1), although some subjects in the PDHM group received L2 fortification at week 26 PMA. This may suggest that there was poorer feed tolerance in the PDHM group infants; but given the weekly nature of the data, this was difficult to assess. After week 34 PMA, the majority of the PDHM group were transitioned to preterm and term infant formula, and by discharge the weight GV was similar to the MOM group. A minor confounder to the discharge weight is the supplementation of some subjects in the MOM group with commercial formula in addition to or instead of MOM (Fig. 1).
Our data suggest that the transient deficit seen at 34 weeks’ PMA could be avoided by grading preterm infants receiving PDHM onto L2 fortification more rapidly, though feed tolerance will need to be carefully monitored and it is noted that there were no significant differences in weight recorded between the groups at any time. Another possibility is that PDHM could be fortified to a standardised composition in the milk bank before being dispensed to infants( Reference de Halleux and Rigo 15 ). This has been trialled by Rochow et al. ( Reference Rochow, Fusch and Choi 16 ), with limited success and is unlikely to be a cost-effective strategy. However, the ready availability of breast milk composition analysers suggests that bulk fortification may be possible. Many of our donor mothers are themselves the mothers of preterm infants and the strategy of dispensing milk from a variety of batches is likely to lead to a relatively stable nutrient composition overall.
One potential confounder is the denaturing effect of pasteurisation on bile salt stimulated lipase, an enzyme that is important for milk lipid digestion( Reference Fredrikzon, Hernell and Bläckberg 17 ). Although the lack of this lipase may have reduced lipid digestion activity, a recent double-blind, placebo controlled trial assessing the impact of the addition of recombinant human bile salt stimulated lipase in milk fed to preterm infants found no significant improvements in growth, except in a subset of small-for-gestational-age infants. Adverse effects were higher in the treatment group( Reference Casper, Hascoet and Ertl 18 ).
One of the major difficulties with carrying out a study assessing growth in preterm infants receiving PDHM was that the volume per subject can alter daily depending on the availability of maternal milk. This study attempted to address this by separately analysing a majority PDHM subgroup (excluding thirteen infants that had received more MOM than PDHM in the 28 d from the first date of regain of birth weight and one infant that received formula during this time) and comparing this with the MOM group. This showed that the majority PDHM subgroup had a significantly increased weight compared with MOM group infants by the 12-month PMA review. The increase in weight is attributed to the majority PDHM subgroup receiving more commercial formula than the excluded subjects. These infants were more likely to still be receiving MOM past discharge and may have had reduced weight gain compared with infants receiving formula. Whilst the weight gain is likely to be appropriate in most subjects, it is important that excessive weight gain is avoided. It is becoming clear that the risk of developing chronic lifestyle diseases such as type 2 diabetes and CVD may be increased in former preterm infants as they approach adulthood( Reference Lapillonne and Griffin 19 ).
Achieving optimal neurodevelopment for preterm infants whilst minimising the risk for later disease development both in the neonate and during the longer term is an important challenge for clinicians. We have demonstrated that the provision of PDHM to extremely preterm infants does result in lower weight GV at 34 weeks’ PMA than in those receiving MOM, but this is a transient feature of infant growth. Future studies should assess the developmental outcomes of children who were born preterm and compare the type of milk feed provided in the early post-natal period.
Acknowledgements
The authors would like to acknowledge Damber Shrestha, Judith McMichael and Noel French at KEMH for assistance with data and Nausheen Khan for assistance with REDcap database development. Study data were collected and managed using REDCap electronic data capture tools hosted at the National Health and Medical Research Council Preterm Infants Centre of Research Excellence( Reference Harris, Taylor and Thielke 20 ). REDCap is a secure, web-based application designed to support data capture for research studies, providing (1) an intuitive interface for validated data entry, (2) audit trails for tracking data manipulation and export procedures, (3) automated export procedures for seamless data downloads to common statistical packages and (4) procedures for importing data from external sources.
This study was funded by Telethon grant SF700. Funding for this study was received from the Channel 7 Telethon Trust, Grant ID SF700. The Channel 7 Telethon Trust had no role in the design, analysis or writing of this article.
M. L. L., E. M., B. H. and K. S. designed the research; M. L. L. conducted research; essential materials were provided by B. H. and K. S.; data were analysed by E. M. and M. L. L.; M. L. L., E. M. and K. S. wrote the paper; M. L. L. has primary responsibility for final content. All authors approved the final manuscript as submitted and agree to be accountable for all aspects of the work.
Supplementary material
For supplementary material/s referred to in this article, please visit https://doi.org/10.1017/S0007114519000357