


INTRODUCTION
Extant theories of authoritarian survival maintain that dictators target private goods to supporting elites (Bueno de Mesquita et al. Reference Bueno, Alastair Smith, Siverson and Morrow2003; Gandhi and Przeworski Reference Gandhi and Przeworski2006; Svolik Reference Svolik2012). Distribution to military officers, businessmen, or prestigious families enables dictators to co-opt potential rivals and dismantle threats to the regime. Crucially, in electoral autocracies, these elites mediate the contentious relationship between the dictator and the masses (Blaydes Reference Blaydes2010; Gandhi and Lust-Okar Reference Gandhi and Lust-Okar2009; Magaloni Reference Magaloni2006; Mattingly Reference Mattingly2019).Footnote 1 Dictators allocate spoils, and in return, elites exercise social control by rewarding loyalists and suppressing dissidents at the local level.
Despite the importance of pro-elite distribution in autocracies, there is no consensus on how dictators select beneficiary cliques and deploy scarce resources. In this article, we explain authoritarian distribution to elites by focusing on a basic locus of social organization: the family (e.g., Cruz, Larreguy, and Marshall Reference Cruz, Larreguy, Marshall, Suhay, Grofman and Trechsel2020; Mattingly Reference Mattingly2019; Migdal Reference Migdal2001). We argue that in relatively homogeneous and traditional societies, where relations of authority revolve around kinship and not ethnicity or other group-based characteristics, the family’s relative position in the local social network can be a primary criterion for targeting rents to cronies. Families centrally placed in the network are more connected with other well-connected community members, thus conferring a comparative advantage in practicing social control. Central families can better exploit family ties to elicit loyalty and reciprocity, sanction uncooperative behavior, and monitor and report dissidents. Co-opting central families should be more consequential in electoral autocracies, where dictators use influential local intermediaries to build a support base for the regime.
Conversely, central families should be less relevant in democracies. Greater political contestation and accountability under democracy give voice to previously marginalized groups and raise the cost of coercive practices. These changes constrain elites’ means of social control, allow for new vehicles of interest intermediation, and reduce the discretionary allocation of government largesse to cronies (e.g., Baland and Robinson Reference Baland and Robinson2012; Fox Reference Fox1994; Nalepa Reference Nalepa2010; Ziblatt Reference Ziblatt2009). Therefore, more centrally located families should be more likely to receive special privileges under autocracy, which should dissipate after democratization.
To test our argument, we estimate the effect of local family network centrality on authoritarian distribution to elites by using a difference-in-differences in reverse (DDR) research design (Kim and Lee Reference Kim and Lee2019) and novel data from Paraguay, which experienced a long-established autocracy under Alfredo Stroessner (1954–1988) and a rapid democratic transition. In particular, we examine how the illegal targeting of public lands, dubbed “ill-gotten lands” (Hetherington Reference Hetherington2011), between more and less central families—that is, family names with higher and lower network centrality—differs before and after the 1989 coup against Stroessner and the subsequent democratization. To measure ill-gotten lands, we use the Paraguayan Truth and Justice Commission’s lists of the thousands of public land grants illegally delivered to cronies of the autocratic Colorado Party from 1954 to 2007 (CVJ Reference y Justicia2008). These land grants should have been delivered to landless peasants, yet they were fraudulently given to non-eligible elite families.
To compute local network centrality for each family, we use an original genealogical database of web-scraped family trees for over 265,000 individuals. Records include individual subjects, their spouses, parents, and the municipality where a life event—birth, marriage, or death—occurred. Following Padgett and Ansell (Reference Padgett and Ansell1993), we consider a family tie to exist whenever there is an intermarriage tie between two family names—including both fathers’ and mothers’ names—in a municipality. By establishing all the different dyadic combinations of family names within a municipality, we can gauge all families’ relative position in each locality using network centrality measures.
Using a dataset with observations at the family-municipality-year level, we find causal evidence consistent with our argument. Using our most demanding specifications, we find that a one standard deviation increase in our centrality measures increases the hectares of ill-gotten land received by 2.7%–5.6% during Stroessner’s dictatorship, and the distribution of at least one land grant to more central families increases by approximately 0.3 percentage points (pp), a large effect considering the sample mean of 0.3%. These results are robust to using different outcome measures, samples, and weighting strategies. We also dismiss that our results are driven by the fact that locally central families simply obtained more land under autocracy by considering legitimate public lands given to eligible landless peasants as an outcome.
We also provide evidence of the social control mechanism at the municipality level. Because local elites in electoral autocracies exert social control by pushing citizens to support the dictator’s ruling party (Svolik Reference Svolik2012), we first test whether family network centrality increases membership to the ruling Colorado Party, the clearest indicator of mobilization in favor of the Stroessner regime (Hanratty and Meditz Reference Hanratty and Meditz1990). We find that municipalities where local families are more central experienced more Colorado affiliations before the 1989 democratic transition. Second, as social networks can work as information-gathering devices to identify dissidents (Cruz, Labonne, and Querubin Reference Cruz, Larreguy, Marshall, Suhay, Grofman and Trechsel2020) and target state violence (Klor, Saiegh, and Satyanath Reference Klor, Saiegh and Satyanath2021), we also test whether family network centrality facilitates targeted repression against opponents of the Stroessner regime. The results show a positive correlation between family network centrality and incidents of repression between 1954 and 1988. We complement these findings with histories of prominent Paraguayan families to show how social control materialized.
Paraguay is a suitable case for evaluating our argument for various reasons. First, Paraguayan elites have been intertwined by ties of blood and marriage, and the family in Paraguay has been the foundation of an individual’s allegiance and identity (Hanratty and Meditz Reference Hanratty and Meditz1990). Second, Paraguay is among Latin America’s smallest nations. The War of the Triple Alliance (1864–1870) killed 70% of the population and left a handful of surviving elite families. Paraguay’s small population and rich genealogical data allowed us to construct a comprehensive set of local family networks. Third, Alfredo Stroessner’s dictatorship was only second to Mexico as the region’s longest autocracy, allowing us to estimate the effect of local family network centrality on pro-elite distribution for a long autocratic spell, and how that effect differs after democratization.
Our argument and findings make several contributions. First, we contribute to the literature on pro-elite distribution, especially in electoral autocracies. Dictators face the challenge of allocating scarce resources across a small set of privileged individuals to ensure social control. An important question is how dictators choose these beneficiaries. A co-optation literature asserts that, in electoral autocracies, dictators allocate spoils to elites who can contribute to their survival by buying off, intimidating, and coercing the masses (e.g., Blaydes Reference Blaydes2010; Gandhi and Przeworski Reference Gandhi and Przeworski2006; Svolik Reference Svolik2012). However, it is unclear which elite members are the most capable of contributing to regime endurance. We complement this literature by focusing on local family ties as a mechanism to build authoritarian ruling coalitions.
We also contribute to the literature on autocratic governance in traditional societies, where informal organizations hold authority. Historical accounts suggest that, lacking ethnic divisions, autocrats often co-opt elites based on kinship ties (e.g., Blaydes Reference Blaydes2010; Collins Reference Collins2002; McCoy Reference McCoy2009; Vilas Reference Vilas1992). Clans, lineages, and other family-based hierarchical groups get regime privileges in exchange for controlling society. Nevertheless, the evidence about family driving pro-elite distribution is anecdotal, lacking systematic analyses of how family ties facilitate the co-optation of non-state elites.
Additionally, we complement a burgeoning scholarship on social networks and distributive politics (Arias et al. Reference Arias, Balán, Larreguy, Marshall and Querubín2019; Balán, Dodyk, and Puente Reference Balán, Dodyk and PuenteForthcoming; Cruz, Labonne, and Querubin Reference Cruz, Labonne and Querubin2017; Ravanilla, Davidson, and Hicken Reference Ravanilla, Davidson and Hicken2022). The role of personal connections in distribution has been widely investigated in developing democracies with weak programmatic parties, where relatives, friendships, and neighbors shape the allocation of handouts to poor voters and campaign donations. These ties aid in diffusing political information, securing followers, selecting candidates for office, and pooling resources for political campaigns. Our work shows how local family networks shape the distribution of lucrative deals to elites in autocracies. Dictators use family networks to benefit an exclusive group of cronies capable of amassing pro-regime support and monitoring and exposing dissidents.
We are not the first to study social networks in autocracies. Extant research focuses on how different social connections constrain dictators and encourage selective credible commitments (Razo Reference Razo2008). Recent studies show that family networks in nondemocratic contexts explain elites’ participation in coups (Naidu, Robinson, and Young Reference Naidu, Robinson and Young2021) and support for state-building efforts (Wang Reference Wang2022). Our work, however, focuses on how local family networks shape a dictator’s distributive choices. Family ties in towns or villages bestow a low-cost governance structure that dictators can leverage to control populations. Thus, dictators offer lucrative deals to well-connected families who can be intermediaries in their communities.
ELITES, FAMILIES, AND AUTHORITARIAN DISTRIBUTION
Dictators perpetuate themselves in office by distributing to elites. The selectorate theory maintains that dictators distribute to elites because the size of the winning coalition relative to that of the selectorate is small in nondemocracies (Bueno de Mesquita et al. Reference Bueno, Alastair Smith, Siverson and Morrow2003). Others postulate that dictators distribute to co-opt special interest groups who can credibly contribute to their survival (Gandhi and Przeworski Reference Gandhi and Przeworski2006; Svolik Reference Svolik2012). Thus, targeting coveted rents secures the loyalty or acquiescence of elites.
In addition to bringing elites into the ruling coalition and neutralizing their opposition, distribution to elites contributes to authoritarian survival by allowing the dictator to exert social control over the masses. Elites, Blaydes (Reference Blaydes2010, 9) writes, are “a critically important base of support for the ruling regime because the elites mediate the potentially contentious relationship between the regime and the society.” This is particularly important in electoral autocracies where elites operate as intermediaries in patron-client exchanges, persuading poorer voters to support the regime (Gandhi and Lust-Okar Reference Gandhi and Lust-Okar2009; Magaloni Reference Magaloni2006). Moreover, elites mediate by acting as the dictator’s coercive agents: through private militias or the police, elites monitor, intimidate, and employ violence against anti-regime citizens (Baland and Robinson Reference Baland and Robinson2012; Frye, Reuter, and Szakonyi Reference Frye, Reuter and Szakonyi2019).
An important yet overlooked aspect of pro-elite distribution is how dictators select beneficiary cliques. What distinctive, observable features of elites are appealing to the dictator such that they contribute to regime endurance? In electoral autocracies, where elites emerge as intermediaries, elections and parties are mechanisms for channeling spoils to elites (Blaydes Reference Blaydes2010; Gandhi and Lust-Okar Reference Gandhi and Lust-Okar2009; Magaloni Reference Magaloni2006; Svolik Reference Svolik2012). Those local elites who get the largest number of votes, mobilize citizens to the ruling party’s rallies, and prevent social turmoil get the dictator’s benefits. However, what enables elites to effectively build relations of loyalty and reciprocity and sanction citizens in their districts? Which elite members are best at controlling the masses?
We argue that an elite’s family can be a useful informational cue for dictators. In particular, we focus on the relative position of a family name in the local family network. Following a large strand of research on social networks as mechanisms of persuasion (see, e.g., Cruz, Larreguy, and Marshall Reference Cruz, Labonne and Querubin2020), we argue that elites centrally placed in their locality’s family network enjoy greater influence and monitoring abilities, being more likely to be co-opted as regime intermediaries through the distribution of rents.Footnote 2 Greater local family network centrality means that an elite’s family name has more ties with other well-connected families in a given locality. Intuitively, the more central an elite is in the local family network, the more control they will have over the actions of their extended relatives and other community members.
Concretely, family network centrality enables social control at the local level in two ways. First, family relationships evoke loyalty and reciprocity due to the close proximity of blood and marriage ties. These cooperative norms are essential for mobilizing supporters and building lasting patron-client exchanges (Arias et al. Reference Arias, Balán, Larreguy, Marshall and Querubín2019; Cruz, Labonne, and Querubin Reference Cruz, Labonne and Querubin2017; Duarte et al. Reference Duarte, Finan, Larreguy and Schechter2023; Ravanilla, Davidson, and Hicken Reference Ravanilla, Davidson and Hicken2022). Well-connected family heads deliver money, jobs, or land, whereas family norms encourage recipients to support the party of the family head’s choosing. Unlike individual clientelistic transactions, the loyalties built around family units last longer because they can be transferable across generations (Fegan Reference Fegan and McCoy2009). Furthermore, the cohesion and hierarchy that define family structures provide a cost-effective way of mobilizing large groups of supporters. This implies that “the exchange of goods and services for political support can be made directly with family heads who commit to delivering all the votes of their relatives” (Cruz, Labonne, and Querubin Reference Cruz, Labonne and Querubin2017, 3012–3).
Second, by providing information about relatives and their connections, family network centrality facilitates sanctions and reduces monitoring costs (Fearon and Laitin Reference Fearon and Laitin1996). Well-connected families can credibly threaten to withdraw the favors, respect, and moral support kinspersons provide, thus dissuading uncooperative behavior (e.g., Campbell Reference Campbell1964; Collins Reference Collins2002; Mattingly Reference Mattingly2019). Members who fail to obey family heads or honor family-related obligations may suffer shame and could be cast out of their community. More importantly, because “regimes leverage network relationships to gather dissent information and punish political opponents” (Liu Reference Liu2022, 1293), family ties can be particularly useful for exposing regime dissidents. Social relationships function as network-based devices to monitor defection (Cruz, Labonne, and Querubin Reference Cruz, Larreguy, Marshall, Suhay, Grofman and Trechsel2020). As a result, elite connections aid autocracies in targeting state repression against dissidents (Klor, Saiegh, and Satyanath Reference Klor, Saiegh and Satyanath2021).
Relevant to our empirical strategy is that differences in the distribution of rents across more and less central families should dissipate after a democratic transition.Footnote 3 Autocracies apportion private goods to local elites due to their comparative advantage in social control. However, democracy’s civil and political rights curb coercive routes of control based on paternalism, threats, and the use of force (Baland and Robinson Reference Baland and Robinson2012; Ziblatt Reference Ziblatt2009). Moreover, democracy gives rise to new autonomous forms of state-society intermediation (e.g., social movements) that can challenge the influence of local elites (Fox Reference Fox1994). These changes undermine elites’ role as local intermediaries, making their co-optation via distribution inefficient. Finally, dictators usually benefit elites through graft or corruption (Blaydes Reference Blaydes2010, 124–5). Thus, by promoting limited government and the rule of law, democracy should block the unlawful appropriation of public assets and hold elites accountable (Nalepa Reference Nalepa2010).
Three scope conditions delimit our argument on family network centrality and authoritarian distribution to elites. First, it applies to electoral autocracies known to co-opt cliques mediating between the regime and the masses (Blaydes Reference Blaydes2010; Gandhi and Lust-Okar Reference Gandhi and Lust-Okar2009; Magaloni Reference Magaloni2006). These regimes are characterized by party-based co-optation, channeling significant spoils through the party to cronies who, in turn, ensure compliance, stability, and turnout at regime events (Svolik Reference Svolik2012, 164–8). In contrast, non-electoral autocracies with narrower support, such as some military dictatorships, may prefer eliminating or stripping elites of privileges rather than expending resources to co-opt them (see see Albertus Reference Albertus2015).
Another scope condition is traditional societies, where policymakers govern alongside local strongmen (e.g., caudillos, chiefs, elders, or clerics) that have informal authority over people’s behavior and, consequently, can exercise social control (Migdal Reference Migdal2001). Developing state-backed control mechanisms is costly for most autocracies (Liu Reference Liu2019, 1293), and drawing exclusively on the state’s coercive agencies risks making the regime unpopular and weakening the dictator (e.g., Magaloni Reference Magaloni2006; Mattingly Reference Mattingly2019; Svolik Reference Svolik2012). Thus, in traditional societies, survival-seeking dictators find it more efficient to co-opt nonstate elites and leverage their authority.Footnote 4
Finally, cultural homogeneity ensures that family, and not ethnicity, is the primary criterion for co-opting elites. Dictators can distribute rents to elites according to language, tribe, and other affinities different from kinship or shared genealogies (Bueno de Mesquita et al. Reference Bueno, Alastair Smith, Siverson and Morrow2003, 61). In autocracies featured by ethnic cleavages, for instance, distribution to elites can resemble an “ethnocracy” where dictators benefit co-ethnic elites (Albertus, Fenner, and Slater Reference Albertus, Fenner and Slater2018). However, as Collins (Reference Collins2002) and Schatz (Reference Schatz2005) stress, kinship is sub-ethnic and structures societies within an identifiable cultural community. Therefore, hierarchical groups based on blood and marriage ties, such as clans, lineages, or dynasties, are more salient in culturally homogeneous polities.
BACKGROUND ON PARAGUAY
Paraguay has historically been underdeveloped.Footnote 5 The defeat at the War of the Triple Alliance (1864–1870) reconfigured the country’s social fabric, leaving a relatively homogeneous population of mestizo rural dwellers that embrace Catholicism and speak a mix of Spanish and Guaraní. The power vacuum resulting from the overthrow of the central government also sparked a longstanding tradition of caudillismo—that is, local political bosses that upkeep order in the countryside through violence and relationships of dependence. Crucially, the family became the keystone of caudillismo and people’s identities and allegiances (e.g., Reed Reference Reed1995; Service and Service Reference Elman and Service1954; Turner Reference Turner1993). Paraguayans looked at those who could not claim familial relationships with distrust, especially in rural areas where large and close-knit families were usual. The family included members of the nuclear and extended family and marriage.
The family was the basis of local elites’ political clout (Hanratty and Meditz Reference Hanratty and Meditz1990, 65–9). Elites were interconnected by kinship and marriage and advanced their privileges through far-reaching family ties. Family and political loyalties overlapped. Family members receiving material assistance from an affluent relative were expected to support their political ambitions and show deference. Elman and Helen Service’s (Reference Elman and Service1954, 149–50, 162) seminal anthropological research in rural Paraguay indicates that “[i]t is $ \dots \hskip0.3em $
very common for individuals to help relatives in sporadic, minor ways such as
$ \dots \hskip0.3em $
very common for individuals to help relatives in sporadic, minor ways such as $ \dots \hskip0.3em $
giving work to a poorer relative whenever possible,” and that “kinship obligations are to be regarded next to sacred.” Similarly, Reed (Reference Reed1995, 88) finds that disobeying the “advice” of the kin leadership is seen as an “insubordination [and] represents a disavowal of the influential position of the leaders,” and it “does not assure that all members will remain with the kin group.”
$ \dots \hskip0.3em $
giving work to a poorer relative whenever possible,” and that “kinship obligations are to be regarded next to sacred.” Similarly, Reed (Reference Reed1995, 88) finds that disobeying the “advice” of the kin leadership is seen as an “insubordination [and] represents a disavowal of the influential position of the leaders,” and it “does not assure that all members will remain with the kin group.”
After years of political turmoil and economic busts, General Alfredo Stroessner led a successful coup in 1954. With the backing of the military, Stroessner seized the dominant Colorado Party, subordinating it to his leadership. This consolidation of power enabled him to amass significant state resources, govern broad sectors of Paraguayan society, and establish a hegemonic party autocracy that endured for 35 years (Galván Reference Galván2013, 82; Lewis Reference Lewis1980, 72). Stroessner leveraged the Colorado machinery to exhaust the opposition via clientelism and electoral fraud while resting upon the armed forces to crush dissidents. The Colorado coterie was made of elite families of the interior—descendants of the post-1870 caudillos, landowners but also bureaucrats, military officers, and merchants.
The heads of these families were local bosses in charge of seccionales, the Colorado Party’s local branches. In rural areas, seccionales served to elicit loyalty and solidify relations of material dependence (Reed Reference Reed1995, 65; Setrini Reference Setrini, Masi and Borda2011, 14). Peasants getting jobs and favors from seccionales were expected to register as party affiliates and attend the annual Colorado rallies. Critically, family heads were functional to Stroessner. As Hanratty and Meditz (Reference Hanratty and Meditz1990, 69) write, “[i]t was through such traditional kin-like ties that landholders from the ruling $ \dots \hskip0.3em $
Colorado Party
$ \dots \hskip0.3em $
Colorado Party $ \dots \hskip0.3em $
could mobilize support among the peasantry.” In effect, the Colorado Party exploited “kinship relations between elites and peasants [to] delegitimize peasant class identity and enforce vertical and segmentary relations” (Turner Reference Turner1993, 365–6). Furthermore, family heads assisted the regime’s repressive apparatus with community informants that identified and reported dissidents (Ekemar Reference Ekemar2015; Hetherington Reference Hetherington2011).
$ \dots \hskip0.3em $
could mobilize support among the peasantry.” In effect, the Colorado Party exploited “kinship relations between elites and peasants [to] delegitimize peasant class identity and enforce vertical and segmentary relations” (Turner Reference Turner1993, 365–6). Furthermore, family heads assisted the regime’s repressive apparatus with community informants that identified and reported dissidents (Ekemar Reference Ekemar2015; Hetherington Reference Hetherington2011).
Stroessner cemented an alliance with Colorado bosses by offering profitable deals to them and their families, such as illegal public lands through the land reform bureau, the Instituto de Bienestar Rural (IBR) (Hetherington Reference Hetherington2011; Miranda Reference Miranda2002). Only landless peasants could receive a parcel in IBR’s peasant colonies. Yet, Stroessner diverted millions of land hectares administered by the IBR and transferred them to cronies in the Colorado Party to buy off their allegiance (Rojas and Areco Reference Rojas and Areco2017, 26). These lands became known as tierras malhabidas or “ill-gotten lands” (Hetherington Reference Hetherington2011, 66).
According to the Comisión de Verdad y Justicia (CVJ), Paraguay’s truth and justice commission, the IBR fraudulently benefited 3,336 non-eligible persons with 4,241 land grants in 1954–1988—a total of 6.74 million hectares, 64.1% of all the IBR lands (CVJ Reference y Justicia2008, 25). The CVJ reports on these non-eligible beneficiaries led to several investigations (e.g., Cáceres Reference Cáceres2021a), which shed light on Stroessner’s strategies behind the distribution of ill-gotten lands. Many beneficiaries were family heads known for being mediators in their communities: they aided dwellers in need, arbitrated disputes, led militias, and suppressed anti-regime activities (e.g., Cáceres Reference Cáceres2021a; Miranda Reference Miranda2002; Reed Reference Reed1995; Turner Reference Turner1993).
To illustrate the distribution of ill-gotten lands, Figure 1 shows the family network of San Juan Nepomuceno in the Cazaapá department, based on our genealogical database of web-scraped family trees and the CVJ data on ill-gotten lands. Nodes are local families, and edges represent intermarriage ties. Squared nodes have above-the-median eigenvector centrality, while circled nodes are below. Red nodes are the families awarded an ill-gotten land grant during Stroessner’s dictatorship. The figure suggests that being a central family is strongly correlated with receiving ill-gotten land grants during Stroessner’s dictatorship. One of the beneficiary central families in the figure is Vera. The family head was Juan Pablo Vera, a Colorado boss that peasants nicknamed “maximum leader” (Reed Reference Reed1995, 179–80).
Family Network of San Juan Nepomuceno, Caazapá
Note: Each node is a local family. Edges are intermarriage ties between local families. Dark red nodes are the families who received at least one ill-gotten land grant during Stroessner’s dictatorship (1954–1988). Squares are nodes that have eigenvector centrality nodes above the median.

Stroessner fell on February 3, 1989. General Andrés Rodríguez Pedotti, Stroessner’s second in command, launched a coup by surprise with the support of the army. Mounting tensions within the Colorado Party over succession had severely weakened Stroessner. Yet, few expected a coup (see Hanratty and Meditz Reference Hanratty and Meditz1990, xxiv-vi; Hetherington Reference Hetherington2011, 30). Unlike their predecessor, the triumphant Colorado faction, the “traditionalists,” sought openness and paved the way for democratization. They repealed bans on opposition parties, dissolved the Congress, called for free general elections, and lifted media censorship. A new democratic constitution in 1992 guaranteed civil and political rights, limited presidents to one term, and established more equitable electoral rules.
More importantly, a democratic transition that was neither negotiated nor anticipated abruptly transformed Paraguay’s balance of power. Growing infighting between Colorado factions eroded the party’s old monopoly over public resources (Setrini Reference Setrini, Masi and Borda2011, 26). Opposition parties such as the Liberal Party would increasingly win congressional seats and municipal governments (Arditi Reference Arditi1992; Duarte Recalde Reference Duarte Recalde2013), further eroding the Colorado Party’s hegemony. After decades of fear and persecution, peasant federations—capable of mobilizing independently from the Colorado Party—sprang up to make demands and organize landless peasants. They staged land occupations, pushing for land reform and audits on ill-gotten lands (Duarte Recalde et al. Reference Duarte, Liliana, Germán, Jorge and María2025; Hetherington Reference Hetherington2011; Rojas and Areco Reference Rojas and Areco2017).Footnote 6 The role of local Colorado bosses as intermediaries was diminished. Opposition parties began to compete for the rural poor’s votes and new middlemen—party brokers, peasant leaders, and neighborhood associations—became the key “political operatives” at the expense of the seccionales (Dosek Reference Dosek2023, 617–8; Morínigo Reference Morínigo2008, 18–9).
These changes had nontrivial implications for the distribution of public lands in Paraguay. The fraudulent allocation of ill-gotten lands, used to co-opt local elites, fell considerably after 1989 (CVJ Reference y Justicia2008, 25–6). By contrast, the legitimate distribution of public lands to eligible landless peasants in 1989–1999 increased (Rojas and Areco Reference Rojas and Areco2017, 45). The question of ill-gotten lands also became a priority in the new democratic leadership’s agenda, which sought justice against dictatorial abuses of power (Hetherington Reference Hetherington2011; Duarte Recalde Reference Duarte Recalde2013). A 2003 law voted in congress created the CVJ to investigate human rights violations and acts of corruption committed in the 1954–1988 era, including IBR lands. The Paraguayan government has openly recognized the issue of ill-gotten lands and sued the IBR and dozens of Colorado bosses in court (Cáceres Reference Cáceres2021b; CVJ Reference y Justicia2008, 31–9). Recently, a congressional committee delineated the procedures for annulling fraudulent IBR titles (Congress of Paraguay 2022).
DATA AND RESEARCH DESIGN
Data
To empirically examine our argument, we rely on genealogical data dating back to 1870 and administrative data from Paraguay’s land reform program. This section describes the operationalization of our two main variables: ill-gotten public lands and local family network centrality. Section A the Supplementary Material describes the data construction process in detail; replication data are available at Bandiera, Larreguy, and Mangonnet (Reference Bandiera, Horacio and Jorge2025).Footnote 7
Ill-Gotten Public Lands. The data on ill-gotten lands to elites come from CVJ (Reference y Justicia2008, Vol. IV), which published lists of non-eligible individuals who fraudulently received land grants as beneficiaries of the IBR’s land reform program in 1954–2007. Land grants were small parcels reserved for landless peasants. Yet, the CVJ found that some beneficiaries were already landowners or had received more than one grant, making them ineligible.
We first retrieve the rolls of non-eligible beneficiaries from the CVJ final report to compile a database of non-eligible beneficiaries. These rolls provide critical information such as beneficiary names, size of granted parcels (in hectares), department and municipality where parcels are located, and year of allocation. We identify 1,810 non-eligible local families—unique family-municipality combinations of 875 distinct family names in 56 municipalities—received ill-gotten land between 1954 and 2007.Footnote 8
We create two measures of ill-gotten land distribution by family-municipality-year: the (log) number of granted hectares and a binary indicator for whether a local family received a land grant. Figure 2 shows the annual allocation of lands to non-eligible beneficiaries, both as the number of hectares in panel (a) and the number of local beneficiary families that received at least one land grant in panel (b). Ill-gotten land grants provided local elites with immediate benefits and a likely continuous flow of related advantages (e.g., credit, subsidies, social status) that persisted after the initial acquisition. However, the fact that 31% of the recipients were allocated multiple plots at different points in time suggests the distribution of these benefits needed to be somewhat regular over time.
Public Lands to Non-Eligible Beneficiaries, 1954–2007
Note: The dashed lines are placed on 1989, the year of Stroessner’s downfall, and the beginning of the democratic period.

Family Network Centrality. To build the measures of local family network centrality, we draw on family trees from MyHeritage, one of the largest online genealogical platforms. First, we scrape all the records from Paraguayan family trees between 1870, when the War of the Triple Alliance ended, and 1950. Scraped records generally include a person’s name, the municipality of birth, marriage, or death, the parents’ names, and their spouse’s name.Footnote 9 Scraped records included 265,468 individuals. Next, we extract the family names from these records to build intermarriage ties by municipality. Paraguayans typically have two family names: a paternal name passed on by their father and a maternal name passed on by their mother. Depending on the available information, we can build as many as 11 intermarriage ties from a single record: between the person’s and their spouse’s names, between the father’s names and the mother’s maiden names, and within each of the spouse’s, father’s, and mother’s own names. This set of intermarriage ties covers most of the relationships that are relevant to define local family networks and each family’s centrality.
A limitation of our data is that we cannot measure godparenthood, or compadrazgo, a politically relevant family linkage in Paraguay. Unfortunately, scraped family trees do not include godparents. Other ties that we cannot measure include extra-marital relationships. However, we expect such ties to play a limited role in social control and, thus, consider them outside of the scope of this study. Cleaned records yield 184,109 intermarriage ties pairing two different family names from 5,357 unique family names.
As an illustration of how we build intermarriage ties, Figure 3 shows the family network of Roque Sarubbi—a powerful Colorado boss from Caazapá (see Turner Reference Turner1993) whose family history we provide below. The family tree record indicates that Roque Sarubbi Ciencio, born in Caazapá in 1904, married Estelia Lepretti. We can draw two ties between his names and his spouse’s only available name (Sarubbi-Lepretti and Ciancio-Lepretti). Sarubbi’s father and mother were Franceso Sarubbi Rossi and Maria Ciancio Donnadia. We can draw four more ties between the father’s and the mother’s names (Sarubbi-Ciancio, Sarubbi-Donnadia, Rossi-Ciancio, and Rossi-Donnadia), one between the father’s own names (Sarubbi-Rossi), and one between the mother’s own names (Ciancio-Donnadia).
Roque Sarubbi’s Family Network

Using the intermarriage ties, we compute measures of family network centrality for 16,735 unique local families. Our main network centrality measure is eigenvector centrality, which accounts for a node’s number of ties and, recursively, their centrality. We focus on this measure because it better conceptualizes the type of global influence that facilitates social control over community members—that is, whether an individual is well-connected to other well-connected individuals (Jackson Reference Jackson2010, 238–9). We also use alternate network centrality measures that conceptualize influence differently, including in-degree centrality (a node’s number of ties), which reflects local prominence, and betweenness centrality (a node’s share of times it lies on the shortest path between other nodes), which focuses on a node’s position in being central—defined as being in the shortest path—to facilitate indirect connection between other nodes in the network.
These measures capture different dimensions of influence in the network, which is reflected in the correlation coefficients in Table A2 in the Supplementary Material. While eigenvector centrality accounts for both the number of direct family ties and how well-connected they are, degree centrality solely focuses on the number of direct ties. Betweenness centrality captures a distinct structural position—how often a family serves as a bridge between otherwise unconnected families. Eigenvector and degree centrality are relatively highly correlated (0.58), while betweenness has lower correlations with both (0.19 with eigenvector, 0.45 with degree).
Crucially, our family network centrality measures are constructed from historical genealogical data spanning 1870–1950, predating Stroessner’s dictatorship and the subsequent transition. These measures capture family ties formed through marriages rather than political relationships subject to regime change. Although the transition reduced the regime’s reliance on central families for social control, it likely did not alter the enduring historical bonds forged between families.
Research Design
Our empirical strategy exploits the timing of the 1989 coup that deposed Stroessner and ended the autocratic period, and the cross-sectional variation in Paraguayan families’ relative local network centrality. Formally, we test the hypothesis that more locally central families are more likely to obtain ill-gotten lands under autocracy with the following DDR model:
 $$ \begin{array}{l}{y}_{fmt}\hskip-0.1em ={\hskip-0.1em \alpha}_{fm}\hskip-0.1em +\hskip-0.1em {\delta}_t\hskip-0.1em +\hskip-0.1em \beta ({\hskip-0.1em \mathrm{Autocracy}}_t\hskip-0.1em \times \hskip-0.1em {\mathrm{Network}\ \mathrm{Centrality}}_{fm}\hskip-0.1em )\\ {}\hskip2.6em +{\epsilon}_{fmt},& \end{array} $$
where $ {y}_{fmt} $
denotes the (log) number of land hectares received, or whether a land grant is received, by family f in municipality m at year t.
$ {y}_{fmt} $
denotes the (log) number of land hectares received, or whether a land grant is received, by family f in municipality m at year t. $ {\mathrm{Autocracy}}_t $
takes the value of one for all years before 1989 and zero otherwise,Footnote
10 and
$ {\mathrm{Autocracy}}_t $
takes the value of one for all years before 1989 and zero otherwise,Footnote
10 and $ {\mathrm{Network}\ \mathrm{Centrality}}_{fm} $
is one of our three (standardized) measures of local family network centrality described above. The family-municipality fixed effects,
$ {\mathrm{Network}\ \mathrm{Centrality}}_{fm} $
is one of our three (standardized) measures of local family network centrality described above. The family-municipality fixed effects, $ {\alpha}_{fm} $
, control for any observed and unobserved time-invariant heterogeneity at the level of the family-municipality, and the time fixed effects,
$ {\alpha}_{fm} $
, control for any observed and unobserved time-invariant heterogeneity at the level of the family-municipality, and the time fixed effects, $ {\delta}_t $
, control for any year-specific shock that simultaneously affects all families in all municipalities. Standard errors are clustered at the family-municipality level, and observations are weighted by the inverse of the share of families with the same name over the population of names.Footnote
11 Additional specifications also control for department-year trends, municipality-year fixed effects, and family-year fixed effects.
$ {\delta}_t $
, control for any year-specific shock that simultaneously affects all families in all municipalities. Standard errors are clustered at the family-municipality level, and observations are weighted by the inverse of the share of families with the same name over the population of names.Footnote
11 Additional specifications also control for department-year trends, municipality-year fixed effects, and family-year fixed effects. $ \beta $
captures how family network centrality moderates the effect of autocracy on the distribution of ill-gotten lands. We theorize that in the autocratic period, there should be a greater distribution of ill-gotten lands to local families with higher network centrality, which should dissipate after democratization. Given that more central families should benefit more from these lands under autocracy, we then expect that
$ \beta $
captures how family network centrality moderates the effect of autocracy on the distribution of ill-gotten lands. We theorize that in the autocratic period, there should be a greater distribution of ill-gotten lands to local families with higher network centrality, which should dissipate after democratization. Given that more central families should benefit more from these lands under autocracy, we then expect that $ \beta >0 $
. We expect this relationship to hold across our various measures of family network centrality, as each represents valuable forms of influence that the regime seeks to co-opt.
$ \beta >0 $
. We expect this relationship to hold across our various measures of family network centrality, as each represents valuable forms of influence that the regime seeks to co-opt.
The identification assumptions of the DDR differ from a standard difference-in-differences (Kim and Lee Reference Kim and Lee2019). Unlike the standard approach where all the units start untreated, a DDR identifies past (not future) treatment effects—that is, all units are treated in pre-intervention periods, and then those assigned to treatment switch to untreated after the intervention.Footnote
12 Thus, two assumptions must hold to enhance the plausibility that $ \beta $
identifies the causal impact of autocracy across local families with varying network centrality on ill-gotten lands. First, we expect no differential trends in the years leading to the end of the autocratic period and the democratic transition. Second, given that the treatment switches off after the transition, differences in ill-gotten lands between high-centrality and low-centrality local families should dissipate under democracy. Kim and Lee (Reference Kim and Lee2019, 711) define this assumption as the “future parallel trends.” While untestable, we can partially assess the validity of these assumptions by estimating the following regression model:
$ \beta $
identifies the causal impact of autocracy across local families with varying network centrality on ill-gotten lands. First, we expect no differential trends in the years leading to the end of the autocratic period and the democratic transition. Second, given that the treatment switches off after the transition, differences in ill-gotten lands between high-centrality and low-centrality local families should dissipate under democracy. Kim and Lee (Reference Kim and Lee2019, 711) define this assumption as the “future parallel trends.” While untestable, we can partially assess the validity of these assumptions by estimating the following regression model:
 $$ \begin{array}{l}{y}_{fmt}={\alpha}_{fm}+{\delta}_t+{\displaystyle \sum_{j\in J}}{\hskip0.15em \beta}_j({\mathrm{Network}\ \mathrm{Centrality}}_{fm}\times {\delta}_j)\\ {}\hskip2.8em +{\epsilon}_{fmt},& \end{array} $$
where J includes all years in the sample except for 1989, the year the autocratic period ended. Thus, the set of parameters $ {\beta}_j $
is the differential in ill-gotten lands for local families with a higher network centrality relative to local families with a lower network centrality in year j relative to the year Stroessner’s dictatorship ended, which we hypothesize to be significantly positive.
$ {\beta}_j $
is the differential in ill-gotten lands for local families with a higher network centrality relative to local families with a lower network centrality in year j relative to the year Stroessner’s dictatorship ended, which we hypothesize to be significantly positive.
MAIN RESULTS
Authoritarian Distribution to Elites
Figure 4 provides initial supporting evidence for our hypothesis. It plots the proportion of local families who received at least an ill-gotten land grant under autocracy and democracy, broken down into ten equally sized deciles of eigenvector centrality. Panel a shows that 1.7% of local elite families in the lowest centrality decile fraudulently benefited from a land grant during Stroessner’s dictatorship, compared with 6% in the highest. By contrast, panel b shows no clear correlation in the democratic period, with smaller proportions of beneficiary families.
Proportion of Local Families with Ill-Gotten Land Grants
Note: The figure shows the proportion of local families in the family network database that appear in the CVJ (Reference y Justicia2008) report on ill-gotten lands.

Table 1 presents our estimates from Equation 1. Columns 1–4 use the logged number of ill-gotten hectares received by a given local family in a given year as an outcome,Footnote 13 whereas columns 5–8 use a dummy equal to one if a given local family received at least one ill-gotten grant in a given year. All columns include family-municipality and year fixed effects. Columns 2 and 6 include department-year fixed effects, columns 3, 4, 7, and 8 include municipality-year fixed effects, and columns 4 and 6 also include family-year fixed effects. As expected, higher network centrality is associated with a significantly positive effect on the amount of distributed ill-gotten land and on whether a local family receives ill-gotten land in the autocratic period.
Ill-Gotten Lands and Family Network Centrality

Note: See Equation 1 for specification. Hectares (log) measures the logged number of ill-gotten land hectares received by a local family in a given year, and Land Grant (binary) is an indicator equal to 1 if the local family received an ill-gotten land grant in a given year. The sample covers the period 1954–2007. All models include family-municipality and year fixed effects. All centrality measures are standardized. The unit of analysis is the family-municipality-year. Observations are weighted by the inverse of the share of the families with the same name out of the population of names. Clustered standard errors at the family-municipality level in parentheses.
* $ p<0.10 $
, **
$ p<0.10 $
, ** $ p<0.05 $
, ***
$ p<0.05 $
, *** $ p<0.01 $
.
$ p<0.01 $
.
We focus on our main measure of family network centrality—eigenvector centrality. The estimates suggest that during Stroessner’s dictatorship, a local family with one standard deviation higher in eigenvector centrality experiences an increase in the number of ill-gotten hectares received of about 2.6% (panel a, column 1), and in the likelihood of getting an ill-gotten grant by 0.35 (panel a, column 5), a large effect with respect to the mean of 0.31 (112.9%).Footnote 14 Results are of a similar magnitude and statistical significance when we add department-year trends (column 2), and when we control for municipality-year fixed effects (column 3). The most demanding specification, which includes family-year fixed effects (column 4), controls for any characteristics that could vary at the year and family level and shows that the effect is still positive and statistically significant, although somewhat smaller in magnitude.
Turning to our alternate network centrality, we find similar results. Focusing on degree centrality we observe that during Stroessner’s dictatorship, local families with one standard deviation higher in degree receive about 5.6% more land hectares (panel b, column 1), and their likelihood of receiving at least one land grant increases by 0.81 (panel b, column 5), a substantial increase with respect to the mean of 0.31. Focusing on betweenness centrality, a local family with one standard deviation higher in betweenness centrality experienced an increase in the number of hectares received during the dictatorship of about 3.6% (panel c, column 1), and in the likelihood of receiving at least one land grant by about 0.56 (panel c, column 5).
To assess the validity of the empirical strategy, Figure 5 reports the coefficients that result from estimating Equation 2 on our two main outcomes, using eigenvector centrality.Footnote 15 Both panels show no differential trend in outcomes across local families with varying centrality in the last years of the Stroessner regime and no differences in outcomes after the democratic transition. Moreover, during the Stroessner regime, the distribution of ill-gotten lands was systematically higher for local families with higher eigenvector centrality. Figure A2 in the Supplementary Material presents the plots with similar patterns for the other network centrality measures.
Evidence of “Future Parallel Trends” for Ill-Gotten Lands and Eigenvector Centrality
Note: The results show point estimates and 95% confidence intervals from the specification presented in Equation 2. Full table of the results presented in Table A9 in the Supplementary Material. The sample covers the period 1954–2007, but only point estimates from 1971–2007 are shown.

Robustness Checks
We also assess the robustness of our results. First, we conduct a placebo test to address the concern that there are alternate mechanisms driving our results. For example, family network centrality could reflect clientelistic targeting by the government, as more connected local families can better coordinate aggregate support for the incumbent (e.g., Cruz, Labonne, and Querubin Reference Cruz, Larreguy, Marshall, Suhay, Grofman and Trechsel2020; Ravanilla, Davidson, and Hicken Reference Ravanilla, Davidson and Hicken2022). This could benefit the rural poor, as autocracies also distribute land to peasants to build popular support in the countryside (Albertus Reference Albertus2015). Thus, family networks could help elites and non-elites secure land from the dictator.
We re-run our main analysis specified in Equation 1 but using lands distributed to eligible, legitimate beneficiaries-that is public lands lawfully allocated to landless peasants as an outcome instead. Due to data availability issues, we could only obtain the IBR beneficiary rolls for the Concepción and San Pedro departments. For comparison, we also re-run our main analysis, which focuses on ill-gotten lands, in the same two departments. If family networks coordinate clientelistic targeting, we should also observe a positive and statistically significant effect of family network centrality on the distribution of legitimate lands to landless peasants in the autocratic period.
Table 2 presents the estimates using our main centrality measure. The results using the allocation of legitimate lands to landless peasants as an outcome contrasts with our main findings on ill-gotten lands to elites. Results in panel a indicate that eigenvector centrality has no consistent differential effect on either the number of hectares of legitimate land received or the probability of receiving such land during autocracy. Results in panel b of our main analysis on ill-gotten lands for the same two departments are similar to those found in the entire sample in Table 1, suggesting that the null effect is not the consequence of the restricted sample and that clientelistic targeting is not driving our results. Results using our alternate measures of family network centrality lead to the same conclusion (see Table A3 in the Supplementary Material).
Legitimate and Ill-Gotten Lands and Family Network Centrality

Note: See Equation 1 for specification. Hectares (log) measures the logged number of ill-gotten or legitimate land hectares received by a local family in a given year, and Land Grant (binary) is an indicator equal to 1 if the local family received an ill-gotten or legitimate land grant in a given year. The sample covers the period 1954–2007 and observations from Concepción and San Pedro, the two departments for which the data on legitimate lands were available. All models include family-municipality and year fixed effects. All centrality measures are standardized. The unit of analysis is the family-municipality-year. Observations are weighted by the inverse of the share of the families with the same name out of the population of names. Clustered standard errors at the family-municipality level in parentheses.
* $ p<0.10 $
, **
$ p<0.10 $
, ** $ p<0.05 $
, ***
$ p<0.05 $
, *** $ p<0.01 $
.
$ p<0.01 $
.
Our main results are also robust when using different measures of the outcome variables and family network centrality, as well as different samples and specifications. We first test whether the results hold using alternate measures of ill-gotten lands: the number of land hectares (as opposed to the logged number) and the number of allocated land grants (as opposed to receiving any land grant). Table A4 in the Supplementary Material shows that the results are robust to these alternate measures. An increase of one standard deviation in our measures of family network centrality induces a differential increase of between 13–27 hectares and 0.006–0.01 grants during autocracy. Second, we re-run our main specification using a modified sample. Because some observations may have extremely large values of family network centrality, we check whether the results are robust to dropping outlier observations whose absolute value of network centrality exceeds one standard deviation. Table A5 in the Supplementary Material shows that all the estimates remain in place.
Furthermore, our main specification weights observations to avoid overestimating more numerous central families. Table A6 in the Supplementary Material shows that our results are of a similar magnitude and significance when we remove those weights. Lastly, since our sample includes thousands of local families who never received ill-gotten lands, we re-run our specification keeping only those families who ever received plots. Table A7 in the Supplementary Material shows that all the results remain in place, with substantially larger estimates considering the decrease in the sample means due to the removal of non-beneficiaries.
EVIDENCE OF SOCIAL CONTROL
Locally central elites should be attractive to the dictator because of their comparative advantage in exerting social control. In this section, we provide extensive quantitative and qualitative evidence of this mechanism. Specifically, we estimate the effect of family network centrality on two common forms of social control in autocracies: explicit support for the dictator’s ruling party in the form of party membership (Svolik Reference Svolik2012) and the selective repression of dissidents (Klor, Saiegh, and Satyanath Reference Klor, Saiegh and Satyanath2021). We complement these results with historical accounts of Colorado families that illustrate how social control operates on the ground.
Notably, we expect our measures of family network centrality to have nuanced effects on party membership and targeted repression, as they represent different means of influence. Eigenvector and degree centrality, which capture local prominence through direct ties to other well-connected families, may be particularly effective for activities requiring more immediate, personal influence, including evoking loyalty and mobilizing political support for the regime within communities. In contrast, betweenness centrality, which gauges a family’s position as a bridge between otherwise unconnected families, can be more valuable for monitoring and information-gathering activities (e.g., identifying dissidents) since these tasks require coordination across distinct, separate groups.
While our main findings suggest co-optation for social control purposes, an alternative explanation is that central families may leverage their influential network positions to extract rents from the regime through some form of systemic state capture such as lobbying. Nevertheless, this explanation is implausible for various reasons. First, as the literature on Paraguay highlights (e.g., Galván Reference Galván2013; Hanratty and Meditz Reference Hanratty and Meditz1990; Lewis Reference Lewis1980), Stroessner commandeered the military, the Colorado Party, and a disproportionate amount of the state’s coveted resources, allowing him to rule with relative insulation from society’s bottom-up pressures and demands. Additionally, we focus on ties operating at the local level (i.e., family-municipality) rather than at the national level. It is unlikely that a local family head could manipulate a dictator and procure favorable distributions of benefits for them or their relatives by simply exploiting family ties within their community. Coordinating elite families from numerous municipalities across the country to sway the dictator would also be an exceedingly challenging task. Authoritarian distribution through capture by special interests, as Razo (Reference Razo2008) implies, would be more characteristic of nepotism or other network structures involving privileged, direct connections between elites and the dictator.
Finally, the evidence in Table 1 and this section supports deliberate top-down co-optation rather than bottom-up rent-seeking. Paraguayan elites received more ill-gotten lands and controlled local populations through Colorado affiliations—activities that, according to our results, declined after the 1989 democratization. This decline occurred despite increased electoral competition and the emergence of new channels for participating in policymaking (e.g., campaign finance or media access) that may have otherwise intensified lobbying efforts to secure additional government rents.Footnote 16
Party Membership
Membership to the Colorado Party was the most significant expression of loyalty to the Stroessner regime in the countryside (Galván Reference Galván2013, 86; Hanratty and Meditz Reference Hanratty and Meditz1990, 173). Townspeople who needed jobs or favors from a Colorado boss were expected to show loyalty by joining the party at their seccional. Party membership was a prerequisite for professional opportunities—municipal clerks, teachers, hospital workers, and police officers were recruited from within the party’s ranks, and party dues were deducted from their wages. In turn, failure to become a party member was a sign of defiance and could result in constant harassment by Colorado bosses. Therefore, if well-connected local elites could leverage family ties to exert social control, then we should expect more citizens to join the Colorado Party in places with higher family network centrality.
We evaluate this mechanism by implementing a DDR approach similar to Equation 1 but at the municipality level, assessing how Colorado membership differs in the autocratic and democratic periods across municipalities with varying aggregate levels of family network centrality. The outcome variable is the logged number of individuals who joined the Colorado Party in a given municipality during a five-year period. We aggregate the outcome at the municipality and five-year period level as electoral autocracies engage in mobilization, coercion, and intimidation in the pre-election years (Hafner-Burton, Hyde, and Jablonski Reference Hafner-Burton, Hyde and Jablonski2018). The data come from the 2003 voter rolls of Colorado Party affiliates we retrieved at the party’s headquarters in Asunción. We construct three (standardized) aggregate measures of municipal family network centrality. Our primary measure is the largest eigenvalue of the adjacency matrix that describes the network, which is associated with families’ eigenvector centrality. The largest eigenvalue captures the over-centrality of local families in a given municipality. The other two measures are average degree and average betweenness. We include municipality, period, and department-period fixed effects. Standard errors are clustered at the municipality level.
Table 3 reports a differential positive effect of family network centrality on the number of Colorado affiliates under autocracy. These estimates are positive and statistically significant only for the largest eigenvalue and average degree. Results in columns 1 and 2 indicate that during Stroessner’s dictatorship, a one standard deviation increase in the largest eigenvalue and average degree increases the number of Colorado affiliations by 4% and 7%, respectively. However, the differential effect of betweenness in column 3 is small and indistinguishable from zero. These estimates suggest that local elites in municipalities with higher eigenvector and degree centrality may leverage their close local ties to boost Colorado affiliations, while betweenness centrality appears less relevant for partisan recruitment within one’s social circle.
Colorado Party Affiliations and Municipal Family Network Centrality

Note: Colorado party affiliations (log) measures the logged number of new Colorado affiliates in a given five-year period. The sample covers the period 1959–2003. All models include municipality, period, and department-period fixed effects. All centrality measures are standardized. The unit of analysis is the municipality-period. Clustered standard errors at the municipality level in parentheses.
* $ p<0.10 $
, **
$ p<0.10 $
, ** $ p<0.05 $
, ***
$ p<0.05 $
, *** $ p<0.01 $
.
$ p<0.01 $
.
Figure 6 presents the coefficients from Equation 2, using the largest eigenvalue to measure family network centrality at the municipality level.Footnote 17 It shows no significant difference in the number of Colorado affiliations in municipalities with a higher overall family centrality in democracy, thus supporting the “future parallel trends” assumption. In turn, along the lines of results in Table 3 and further supporting the mechanism of social control, it shows more affiliations in those municipalities before 1989.
Evidence of “Future Parallel Trends” for Colorado Party Affiliations and Largest Eigenvalue
Note: The results show point estimates and 95% confidence intervals from the specification presented in Equation 2 at the municipality level. Full table of the results presented in Table A12 in the Supplementary Material. The sample covers the period 1959–2003.

Targeted Repression
Stroessner’s repressive apparatus dealt with social discontent in a calculated fashion (e.g., Ekemar Reference Ekemar2015; Galván Reference Galván2013; Hetherington Reference Hetherington2011). In the countryside, repression was made possible through an informal system of grassroots informants known as pyragues. These informants were ordinary community members at the orders of Colorado bosses who identified, surveilled, and reported on anti-regime activities to the seccional and the local police. Hence, if family networks can expose dissidents and help to target state violence—and more so when network structures disseminate information—then we should expect more episodes of repression in places with higher family network centrality.
By drawing on victim testimonies, archives, and human rights organizations, the CVJ produced lists recording all the citizens who were victims of illegal detentions, tortures, extrajudicial killings, and/or abductions by the Stroessner regime between 1954 and 1988. The CVJ’s final lists (Reference y Justicia2008, Vol. VIII) includes 9,460 episodes of human rights violations, detailing information such as the date and precise location of the incident. We use the logged number of episodes of human rights violations, which we aggregate annually and by municipality. Because the CVJ only recorded human rights violations during Stroessner’s rule, we cannot implement a DDR empirical strategy. Thus, we estimate whether there is a positive correlation between the average measures of family network centrality and human rights violations.
Table 4 shows how the level of repression responds to average family network centrality at the municipality level. According to our most demanding specification, an increase of one standard deviation in the largest eigenvalue at the municipality level increases the total cases of repression by 9% (column 3), while an increase of one standard deviation in average betweenness at the municipality level increases the total cases of repression by 16% (column 9). These stronger effects associated with average betweenness centrality suggest that local elites positioned as bridges between distant families effectively gathered information to monitor and suppress potential dissidents. Figure 7 presents the marginal effects by five-year periods, with the first period as the omitted category. The plots for the other centrality measures can be found in the Section F of the Supplementary Material.
Human Rights Violations and Municipal Family Network Centrality

Note: Human rights violations (log) measures the logged numbers of incidents involving illegal detentions, tortures, extrajudicial killings, and/or abductions in a given period. The sample covers the period 1954–1988. All centrality measures are standardized. Robust standard errors in parentheses in cross-sectional specifications. Clustered standard errors at the municipality level in parentheses in time-varying specifications.
* $ p<0.10 $
, **
$ p<0.10 $
, ** $ p<0.05 $
, ***
$ p<0.05 $
, *** $ p<0.01 $
.
$ p<0.01 $
.
Human Rights Violations and Largest Eigenvalue
Note: Full table of the results presented in Table A15 in the Supplementary Material. The sample covers the period 1954–1988.

Family Histories
Social control in the context of kinship relationships evoke paternalism, shame, or fear, which are subtle and often occur in private spaces (Horwitz Reference Horwitz1990). Based on anthropological and historical works, the following histories of three Colorado bosses—whose families received ill-gotten lands and had high family network centrality—shed light on these behavioral dimensions of social control.
Roque Sarubbi. Since the 1940s, rural life in the Caazapá and Boquerón departments was dominated by the Sarubbis, a powerful family of ranchers. The local caudillo, Roque Sarubbi, was the president of a seccional in Caazapá for 25 years and a Colorado senator for 17 years. Until Stroessner’s downfall, he was known for being a successful mediator of peasant requests and the arbiter of all disputes across Caazapá. Roque was a generous but commanding leader. Turner (Reference Turner1993, 300) writes that “[w]ithout his protection and permission, any political activity could prove dangerous.” Roque’s daughter married Manuel Burró Díaz, from a prestigious Caazapá family of textile and tobacco producers.
Roque supported poorer cousins and in-laws, like Ramón, who got a job at the seccional and a plot of land through his wife’s ties with the Sarubbis. Ramón was tasked with managing public works and was always on the lookout for leftist activists. However, Ramón was a troubling relative. One day, he knowingly disrespected Roque by buying and butchering one of Roque’s stolen cows. Roque humiliated Ramón by stripping him of his position at the seccional but decided not to press charges against him. According to the CVJ (Reference y Justicia2008), in 1958–1981 the IBR gave about 23,000 ill-gotten hectares to Roque Sarubbi and his father, mother, brother, brother-in-law, uncles, and cousins.
Ignacio González. Reed (Reference Reed1995) provides the account of Ignacio González, a foreman that rose through the ranks of peasants working in yerba mate plantations to become a boss in the Itapúa department by the 1950s. He was the adoptive son of a respected landlord, Marciano Iturbe, developing the skills of a mediator in the yerbales early on aided by his extensive family ties with fellow peasants. Thanks to these ties, he could easily line up small work crews for the yerbales. His sons, sisters, and nephews worked under his tutelage. For the peasants, Ignacio was a cacique that could voice concerns on their behalf to government bureaucrats—in particular, access to land.
Due to the military’s need to increase surveillance in rural areas in the 1970s, Ignacio’s skills as a mediator were recognized. He became a “political sergeant” ever since, acting harshly and punishing peasants who misbehaved and made him look bad in front of the local military post. Reed (Reference Reed1995, 177) narrates how he brought peasants “accused of thievery or other malfeasance to the local police station. After miscreants had been thoroughly beaten and forced to work in the mayor’s garden, González would escort them back $ \dots \hskip0.3em $
assuring the leaders that they would create no further disturbance.” The CVJ (Reference y Justicia2008) indicates that the local González family received 614 ill-gotten hectares between 1975 and 1984.
$ \dots \hskip0.3em $
assuring the leaders that they would create no further disturbance.” The CVJ (Reference y Justicia2008) indicates that the local González family received 614 ill-gotten hectares between 1975 and 1984.
Pastor Coronel. A sinister caudillo was Pastor Coronel, Stroessner’s chief police inspector and one of the architects of the regime’s repression. Pastor was from a renowned family of military men and priests from the San Pedro department. Pastor and his brothers, who were also intelligence officials, instilled fear through the militias of armed peasants they commanded—the infamous “machete men.” His cruelty earned him the nickname “the pastor of death” among peasants. Although Pastor was an obscure character, anecdotal evidence suggests he recruited militiamen from his own relatives in San Pedro (e.g., Ekemar Reference Ekemar2015; Ibarra Reference Ibarra2009). “Don Pastor” was revered by his militiamen.
The machete men were Pastor’s personal enforcers. They terrorized townspeople by marching across San Pedro, holding machetes aloft and hitting them against the ground. They showed up during national holidays or Colorado festivities to intimidate the local population and dissuade any anti-Stoessner activities. When such activities cropped up, Pastor would order his thugs to use outright violence. A 1986 report, for instance, recounts an unauthorized Liberal Party’s rally that went awry when Liberal demonstrators were mugged and “roughed up” in the streets by the machete men (Latin American Newsletters Reference Newsletters1986, 6). The Comisión de Verdad y Justicia (CVJ) (Reference y Justicia2008) indicates that Pastor received over 1,500 ill-gotten hectares in 1975–1976.
CONCLUSION
Why and how autocracies engage in distribution is a persistent puzzle in comparative politics (Albertus, Fenner, and Slater Reference Albertus, Fenner and Slater2018). Survival-seeking dictators distribute scarce resources to elites capable of contributing to authoritarian stability. Yet, the question of how dictators pick beneficiary elites remains understudied. In this article, we focus on local family network centrality to explain authoritarian distribution to elites. Tightly networked elites are appealing to dictators as they can operate as regime intermediaries and control the behavior of their communities through loyalty, monitoring, and sanctions. Thus, we hypothesize that autocracies are more likely to reward elites who are more central in their locality’s family network.
Using a unique dataset of Paraguayan local families in the 1954–2007 period, we find that the fraudulent allocation of public lands to local families with higher network centrality was greater during the autocratic period, before the 1989 democratic transition. In support of the social control mechanism, we find that membership to the autocratic Colorado Party is larger in the autocratic period in municipalities with more central families. We also find more incidents of state repression in municipalities with more central families before 1989. Qualitative accounts of prominent Colorado families complement these findings. Together, this evidence suggests that local elite family ties can be a driving force of coalition building and stability in autocracies.
Our scope conditions—electoral autocracies, traditional societies, and cultural homogeneity—make our argument generalizable to other settings. For example, Nicaragua’s Somoza regime channeled government posts to landed oligarchies and their relatives via the Nationalist Liberal Party. The existing kin ties between landlords and Sandinista rebels aided Somoza in attenuating class tensions in rural areas (Vilas Reference Vilas1992). In the Philippines, dictator Ferdinand Marcos co-opted clans—the real source of authority in villages—aligned with the ruling party, New Movement Society. He gave them loans, licenses, and monopolies, creating an alliance of dominant families (McCoy Reference McCoy2009). Similarly, in Egypt under Mubarak’s rule, Blaydes (Reference Blaydes2010, 6–8) notes that “core membership in the regime elite is based on family ties” and includes “influential family heads.” These heads received spoils while leveraging family relationships to mobilize support for the National Democratic Party (NDP). None of these countries have major ethnic divisions.
Following Mattingly’s (Reference Mattingly2019) work, our argument also applies to some regions of China. After de-collectivization and the state’s retreat from rural villages in 1979, the Chinese Communist Party (CCP) distributed government positions, development projects, and financial resources to local lineage elites from the imperial epoch who could act as regime intermediaries. Lineages were of interest to the CCP because their heads wielded moral authority in villages, compelling poorer kinfolk to show deference, obedience, and loyal cooperation. Mattingly (Reference Mattingly2019, 136) notes that “co-opted lineage elites use their authority to requisition land, enforce birth quotas, and tamp down on protest.”
While the family may play a consequential role in authoritarian survival in Paraguay and Nicaragua, its impact on larger polities like China, Egypt, or the Philippines is less straightforward. Although relatively homogeneous, these societies often maintain ties to informal authorities that can facilitate social control locally, making them appealing to dictators. For example, the CCP has also co-opted leaders of folk religious clubs and temple associations—who promoted obedience and state legitimacy—due to the high number of believers in some villages (Mattingly Reference Mattingly2019, 16). Similarly, Egypt’s NDP leveraged the influence of imams at popular mosques to persuade citizens to support the party so as not to offend Allah (Blaydes Reference Blaydes2010, 112). Ideological factors could also be relevant. Co-opting lineage heads or clerics—who embraced Confucian values—would have been impossible before 1979, given Mao Zedong’s staunch anti-Confucian stance. As Mattingly (Reference Mattingly2019) suggests, in this context, the CCP often opted to infiltrate local elites rather than co-opt them. Overall, these variations in larger and more complex societies may lead to temporal and subnational patterns in which dictators alternate their strategies: infiltrating local elites or co-opting them based on family structures in some regions while relying on alternative ties in others.
A limitation in the literature is the lack of historical data on blood and marriage relationships to measure (and test the impact of) elite family networks. Fine-grained data on families are still rare in developing countries. Recent research like Naidu, Robinson, and Young (Reference Naidu, Robinson and Young2021) and Wang (Reference Wang2022) draws on digitized dictionaries of families or novel archaeological sources to code family ties. Others, like Balán, Dodyk, and Puente (Reference Balán, Dodyk and PuenteForthcoming), use datasets from listed firms. Nevertheless, the increasing availability of historical family trees on genealogical websites represents an extraordinary opportunity for political science research. Prestigious elites use family trees as portraits of their family’s wealth, power, and status (Weil Reference Weil2013, 19), and they offer scholars a unique resource for empirically assessing the political consequences of elite social structure across different contexts. Despite the usefulness of this resource, political scientists have not yet embraced it (Kasakoff Reference Kasakoff2019). This study is an early effort that draws on family tree data to understand how elite connectedness at the local level shapes the distribution of privileges in autocracies.
SUPPLEMENTARY MATERIAL
To view supplementary material for this article, please visit https://doi.org/10.1017/S0003055425000231.
DATA AVAILABILITY STATEMENT
Research documentation and data that support the findings of this study are openly available at the American Political Science Review Dataverse: https://doi.org/10.7910/DVN/AP4IIC.
Acknowledgements
We thank Valentín Figueroa, Francisco Garfias, Carl Müller-Crepon, Tine Paulsen, Josef Woldense, as well as seminar participants at the Oxford Meeting in Historical Political Economy, the Universidad del Rosario Political Economy Workshop, the Latin American PolMeth, the Virtual Workshop in Historical Political Economy, the Universidad de San Andrés, and the IPERG-Universidad de Barcelona for their helpful comments. Macarena Michienzi and José Luis Pérez Castellanos provided valuable research assistance. We also thank Felipe González and Mounu Prem for sharing their scraped data on human rights violations from the Comisión de Verdad y Justicia. Larreguy gratefully acknowledges funding from the French Agence Nationale de la Recherche under the Investissement d’Avenir program ANR-17-EURE-0010. Mangonnet gratefully acknowledges funding from Nuffield College, University of Oxford, and Columbia University’s Department of Political Science.
CONFLICT OF INTEREST
The authors declare no ethical issues or conflicts of interest in this research.
ETHICAL STANDARDS
The authors affirm this research did not involve human participants.

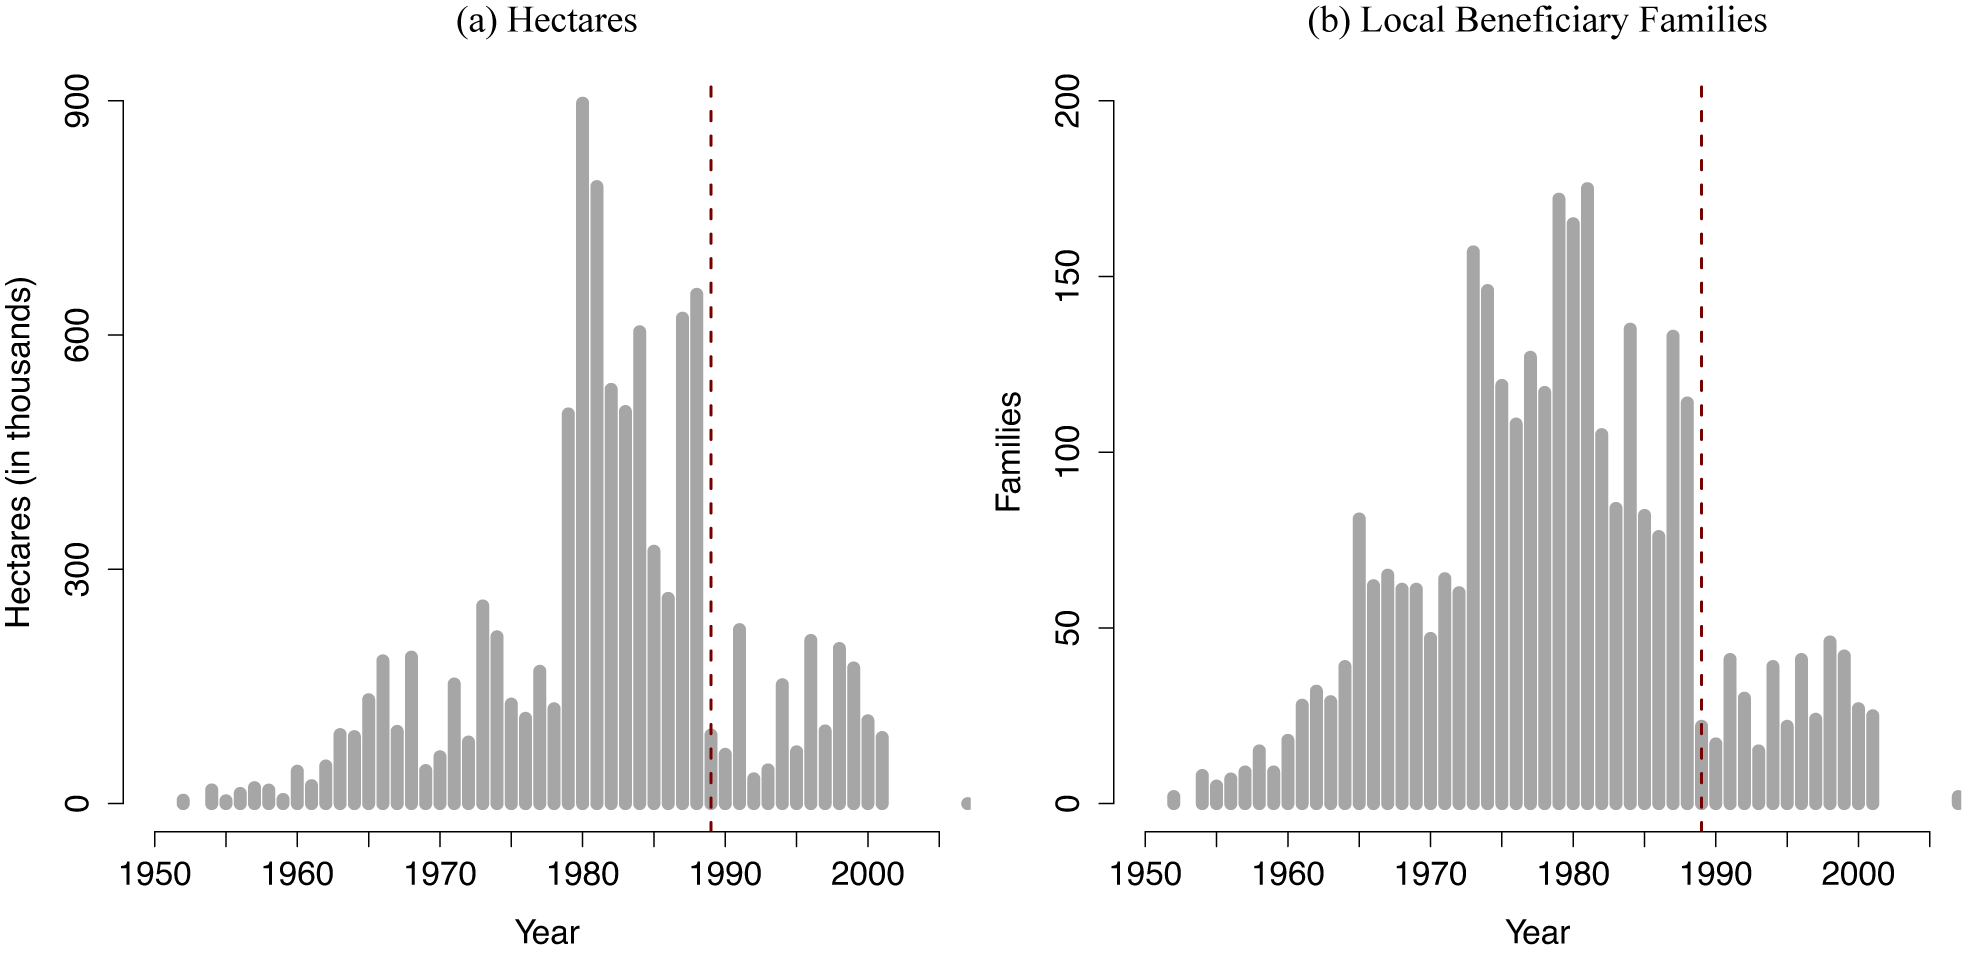
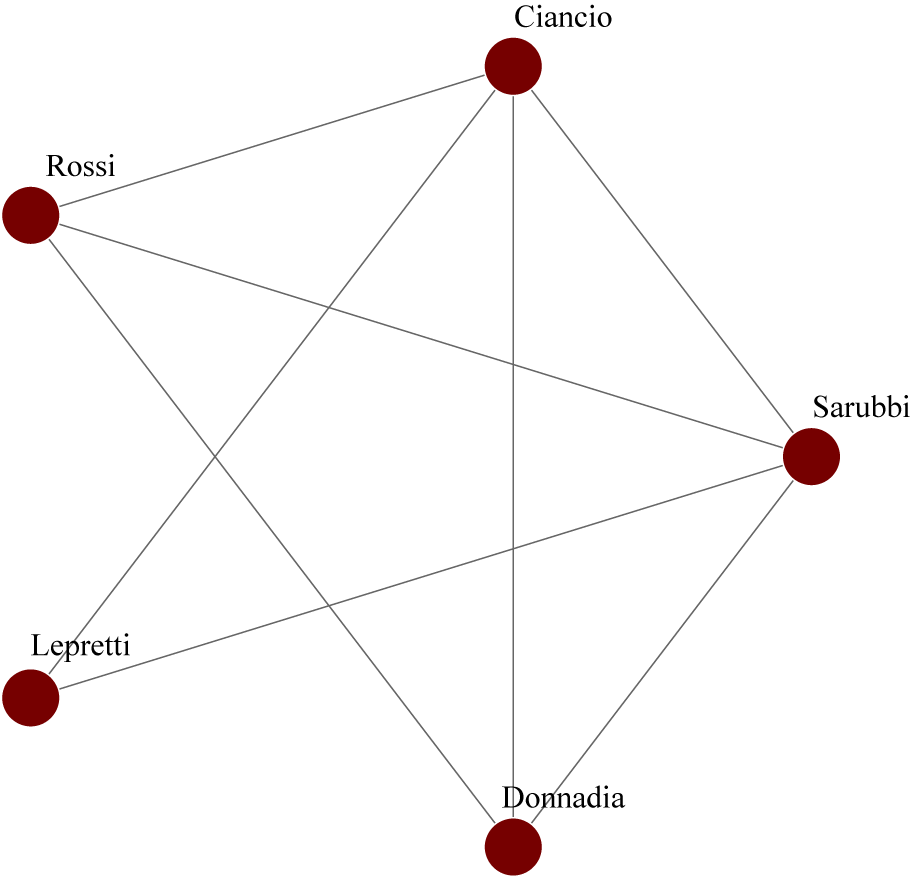
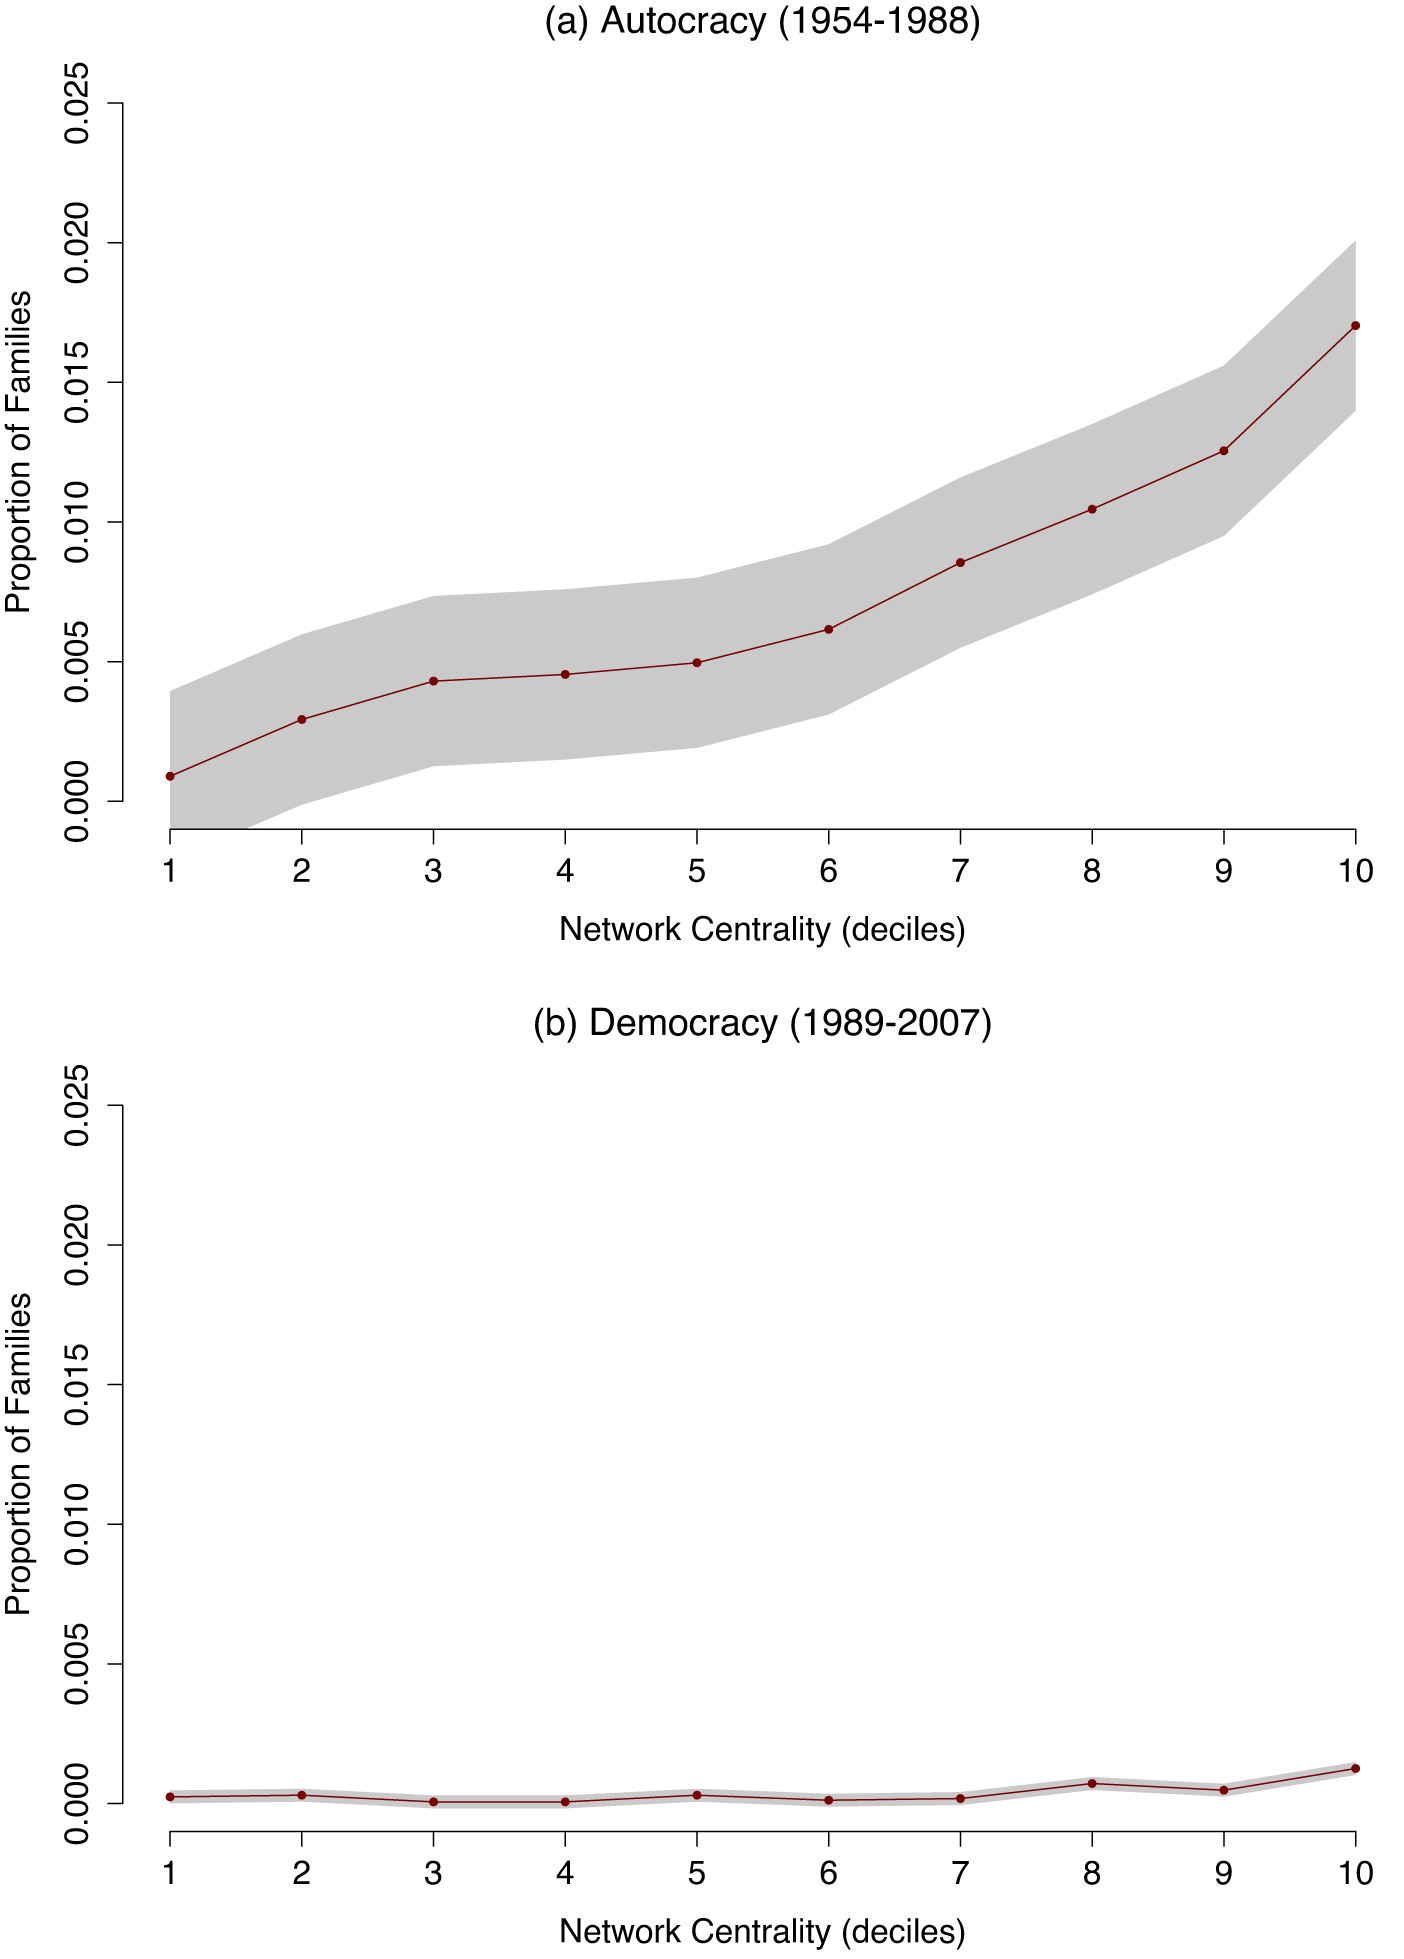

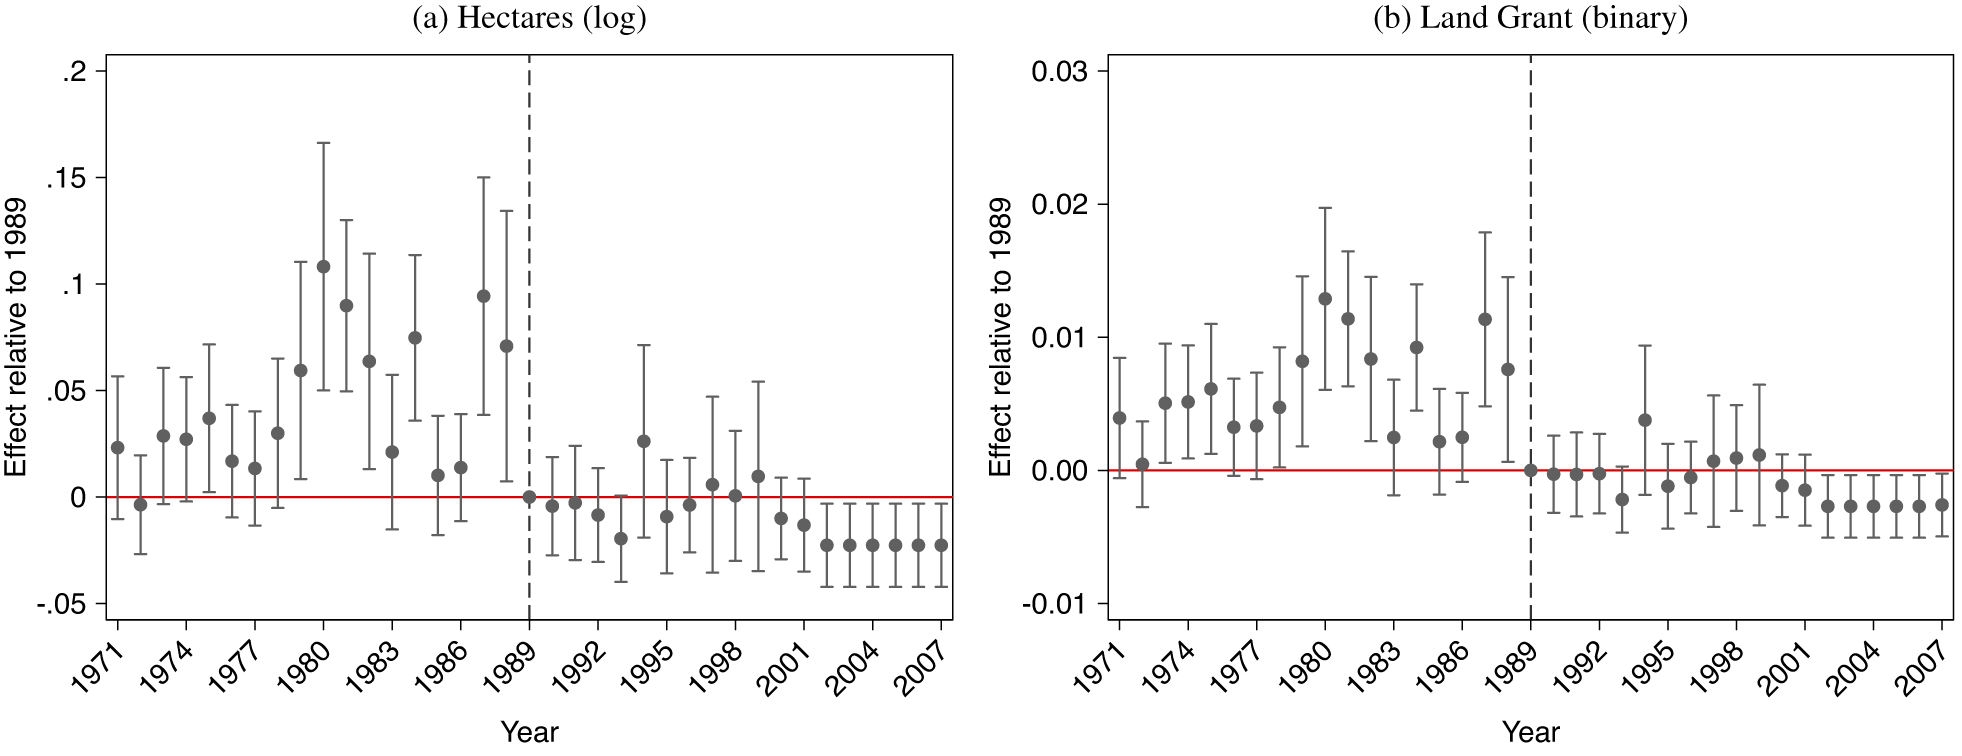

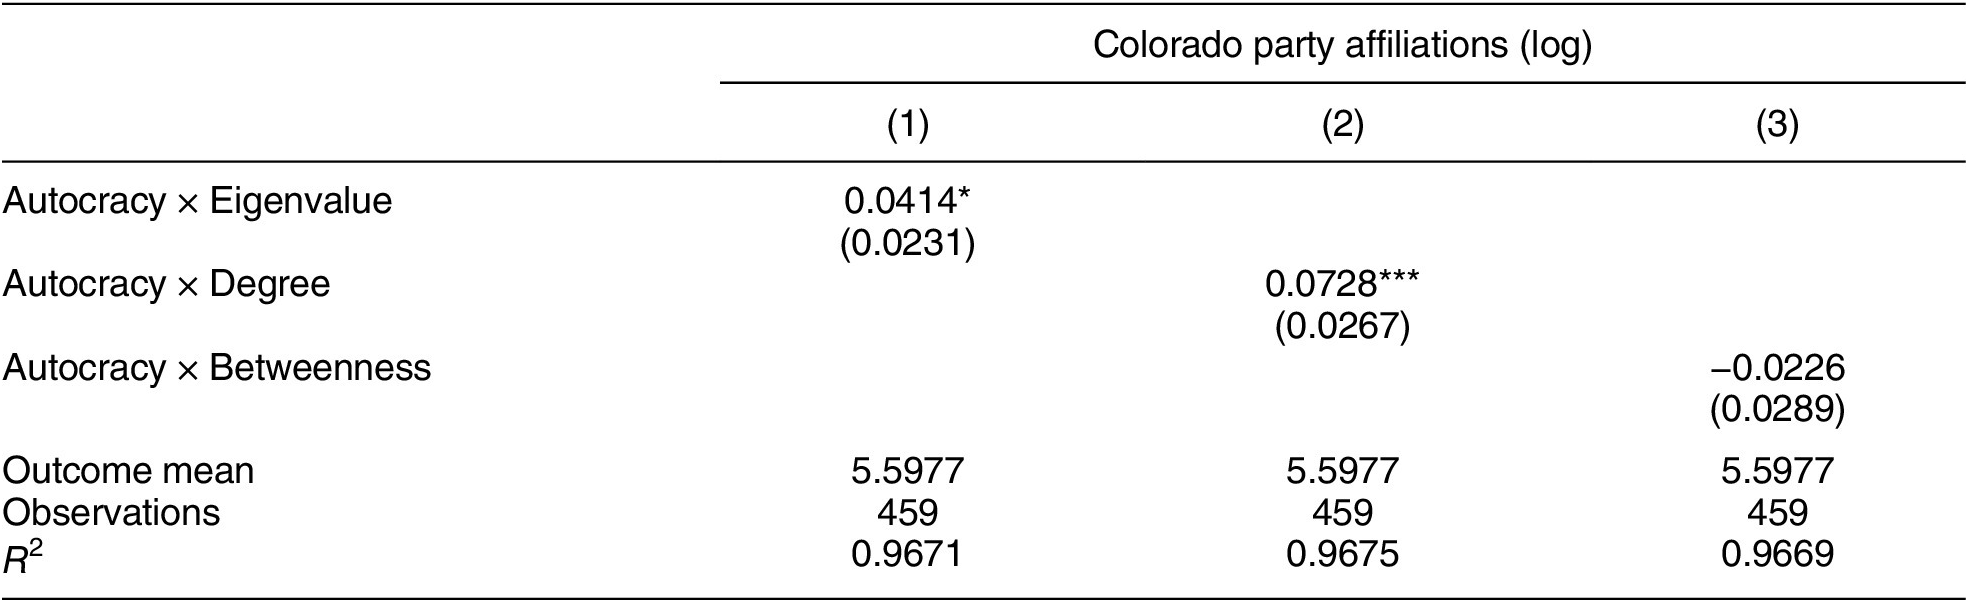
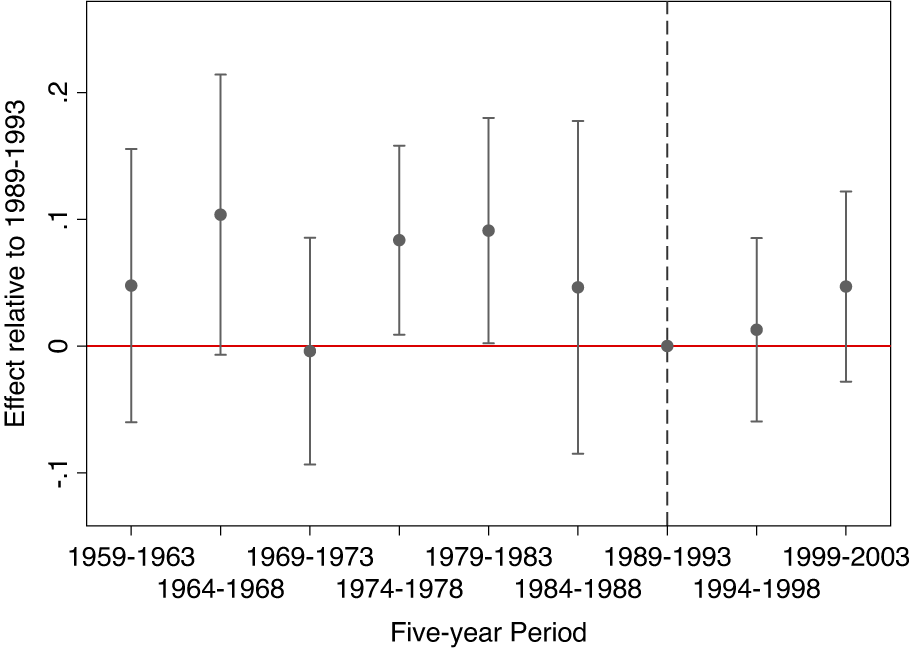
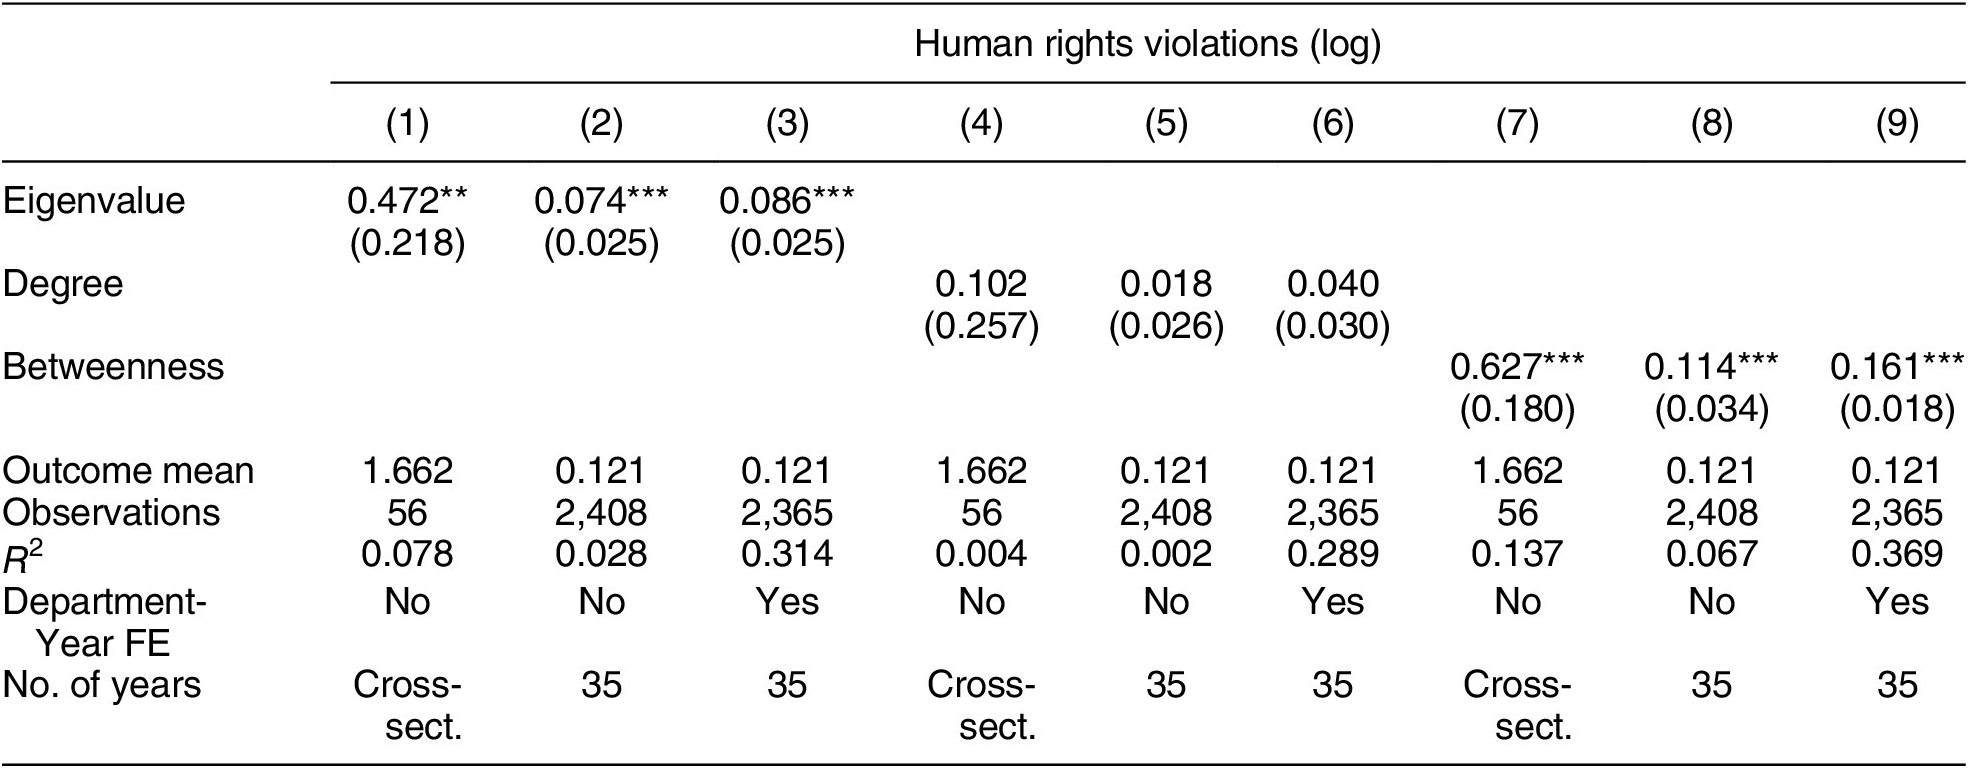
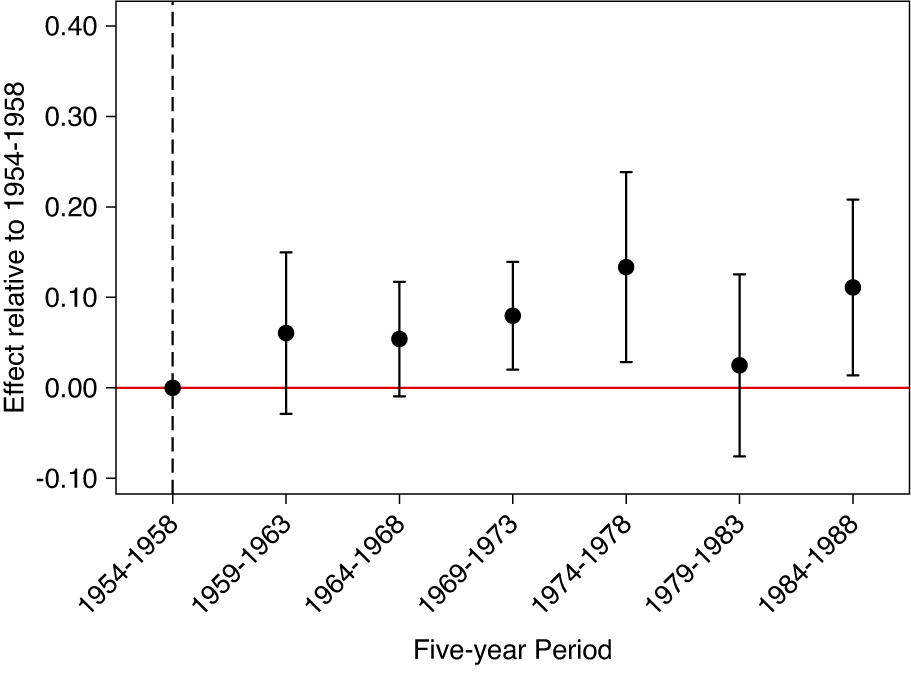


 Open access


Comments
No Comments have been published for this article.