


1. Introduction
There is widespread concern about the effect of climate change (Reference SolomonSolomon and others, 2007) on glaciers in connection with rising sea level and changes in high mountain ecosystems. The ice volume of the European Alps is only a small fraction of all the ice in the world, and the retreat of its glaciers cannot have any significant effect on global sea level. However, we are well justified in studying Alpine glaciers because the Alpine region has the best data coverage of all high mountain regions. (Note that we use the term ‘Alpine glacier’ throughout this paper to refer to glaciers in the European Alps rather than referring to alpine-type glaciers.) The challenge is to develop robust methods from studying Alpine glaciers that can be applied to other areas with more glaciers and fewer data. For example, this guided our decision to use simple temperature anomalies in the present study, rather than the high-resolution temperature and precipitation datasets that are probably only available for the Alps.
2. Temperature Sensitivity of Modelled Mass Balance
A key concept in understanding glacier–climate relations is the sensitivity of glacier mass balance to variations in various climate elements. Several workers have used models to assess the climate sensitivity of glacier mass balance. This can be achieved simply by correlating mass-balance data with climate variables such as summer temperature and annual precipitation, as done by Reference LiestølLiestøl (1967), Reference MartinMartin (1974), Reference YoungYoung (1977), Reference Gunther and WidlewskiGunther and Widlewski (1986), Reference Laumann and TvedeLaumann and Tvede (1989), Reference Chen and FunkChen and Funk (1990), Reference Vallon, Vincent and ReynaudVallon and others (1998) and Reference Braithwaite and ZhangBraithwaite and Zhang (2000). The mass-balance sensitivity to a particular variable is then given by the relevant regression coefficient.
Other workers have ‘tuned’ a mass-balance model to fit observed data and then ‘tweaked’ the model by changing one of the input variables to assess the sensitivity of mass balance to that variable. Reference Oerlemans and FortuinOerlemans and Fortuin (1992), Reference Fleming, Dowdeswell and OerlemansFleming and others (1997) and Reference PaulPaul (2010) used energy-balance models to assess the temperature sensitivity of mass balance, while Reference Laumann and ReehLaumann and Reeh (1993), Reference Jóhannesson, Laumann and KennettJ&óhannesson and others (1995), Reference JóhannessonJ&óhannesson (1997), Reference Braithwaite and ZhangBraithwaite and Zhang (1999a, Reference Braithwaite and Zhang2000), Reference KuhnKuhn (2000), Reference Braithwaite, Zhang and RaperBraithwaite and others (2002), Reference Schneeberger, Blatter, Abe-Ouchi and WildSchneeberger and others (2003), Reference De Woul and HockDe Woul and Hock (2005), Reference Braithwaite and RaperBraithwaite and Raper (2007), Reference Shea, Moore and StahlShea and others (2009), Reference AndersonAnderson and others (2010) and Reference Wu, Li and WangWu and others (2011) used temperature-index models.
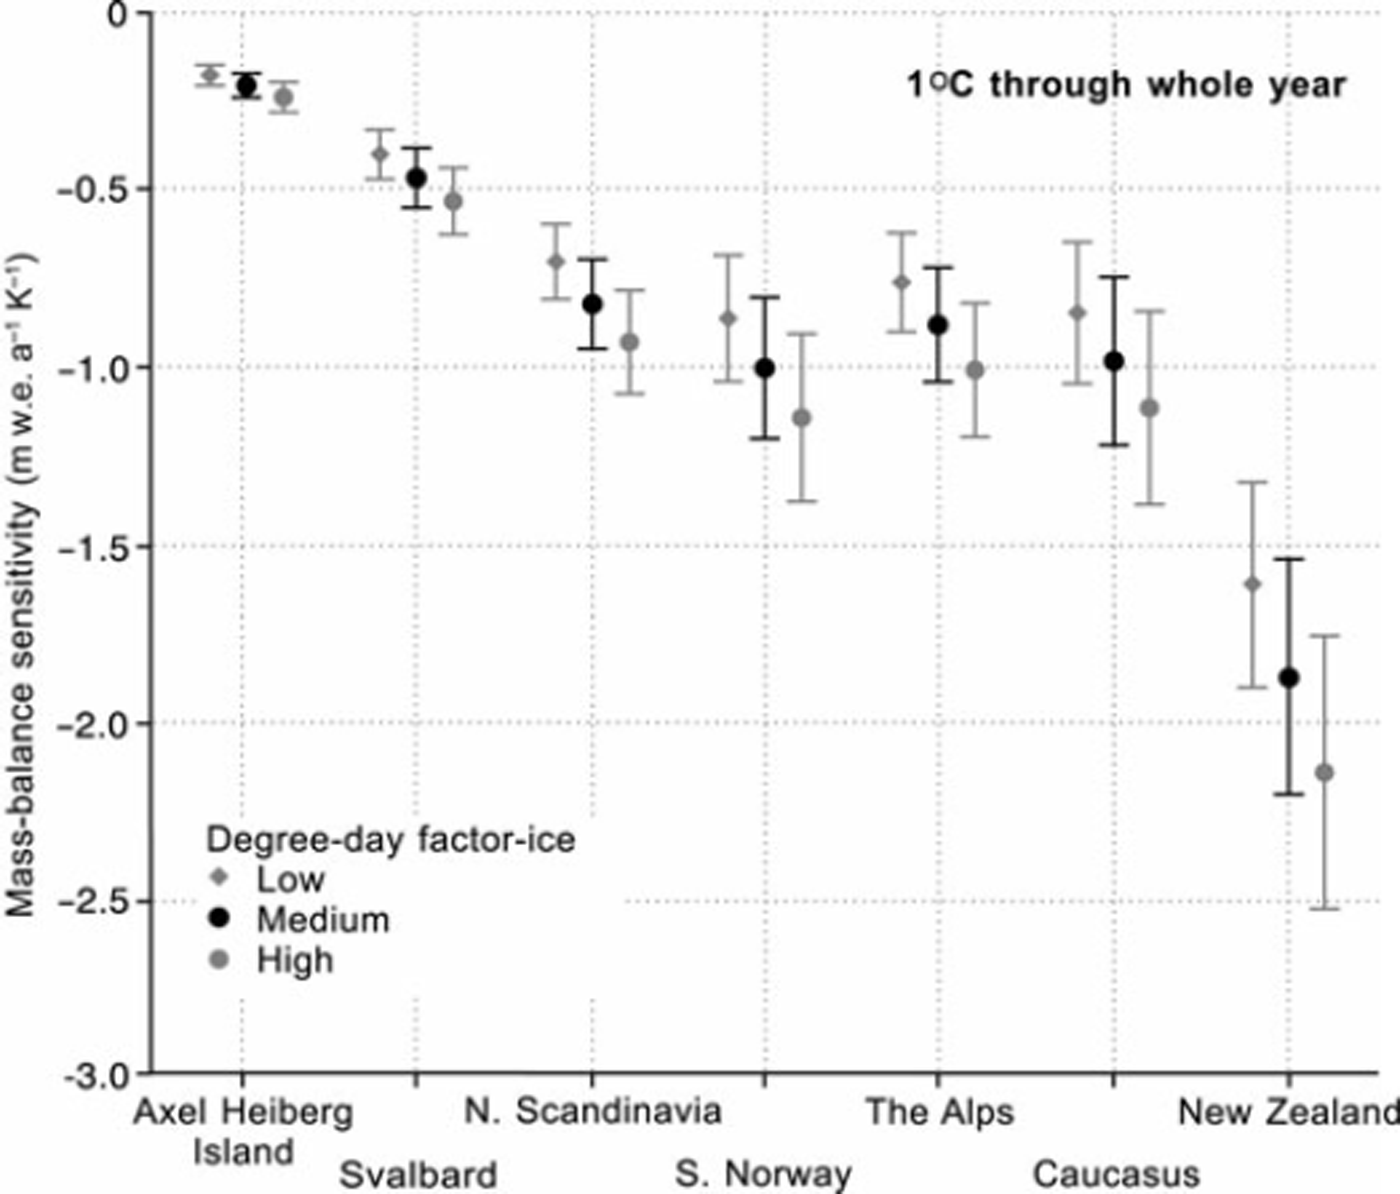
Figure 1 shows model results from Reference Braithwaite and RaperBraithwaite and Raper (2007) who applied a degree-day model to seven glacial regions. The balanced-budget equilibrium-line altitude (ELA) for each half-degree latitude/longitude grid square within each region is estimated from the median elevations of glaciers within the square (Reference Braithwaite and MullerBraithwaite and Muller, 1980; Reference Braithwaite and RaperBraithwaite and Raper, 2009), and air temperature data are extrapolated from the gridded climatology of the Climatic Research Unit, University of East Anglia, UK (CRU/UEA) (Reference New, Hulme and JonesNew and others, 1999). The annual accumulation at the ELA is equal to the ablation at the ELA that is calculated from the degree-day model. This represents a kind of ‘self-calibration’ where the degree-day model calculates the accumulation values that are appropriate for the region in question. The model is then perturbed by +1K to calculate temperature sensitivity of modelled mass balance using a plausible range of values for the degree-day factor for melting ice, i.e. 6, 7 and 8 mm d – 1 K–1. These degree-day factors were suggested for Greenland glaciers (Reference BraithwaiteBraithwaite, 1995) and may or may not be appropriate for the seven regions in Figure 1 (for a list of degree-day factors from various regions, see Reference HockHock, 2003), although they are very well constrained for Greenland and cover many hundreds of days of ice melting. Figure 1 is best regarded as a hypothesis for testing where possible.
Mass-balance sensitivities for seven glacial regions computed with adegree-day model applied to estimated balanced-budget ELAs within each region. Low, medium and high degree-day factors are 6, 7 and 8mmd– 1 K–1. Modified from Reference Braithwaite and RaperBraithwaite and Raper (2007) with permission of the International Glaciological Society.
The temperature sensitivity of mass balance at the estimated balanced-budget ELA (Fig. 1) should be a near approximation to the sensitivity for the whole glacier (Reference Braithwaite and KnightBraithwaite, 2006). For any glaciological variable that varies linearly with altitude, the value at the area-weighted mean altitude of the glacier is identical to the area-average value of the variable over the whole glacier (Reference LliboutryLliboutry, 1965). The mean specific balance of the whole glacier is therefore approximately equal to the specific balance at the mean altitude of the glacier. This means that the mean specific balance of the whole glacier is zero when the ELA is at the mean altitude of the glacier (the ELA in this case is termed the balanced-budget ELA). Modelled values of temperature sensitivity of mass balance are roughly linear with altitude (Reference Vallon, Vincent and ReynaudVallon and others, 1998; Reference Braithwaite and ZhangBraithwaite and Zhang, 1999a), so the whole-glacier sensitivity is highly correlated with the sensitivity at the mean altitude (see fig. 83.5 in Reference Braithwaite and KnightBraithwaite, 2006).
The temperature sensitivities in Figure 1 were calculated in connection with modelling the effects of melting glaciers on global sea level (Reference Raper and BraithwaiteRaper and Braithwaite, 2006). The temperature sensitivity shows a wide range across different climate settings, with lower sensitivity for dry–cold (continental) and higher sensitivity for wet–warm (maritime) settings. Aside from variations between regions, there is considerable variability within each region, represented by the standard deviation bars in Figure 1 .
For Alpine glaciers in Figure 1, average temperature sensitivities for modelled mass balance are approximately –0.7 to –1.0 mw.e. a–1 K–1, depending upon the degree-day factor assumed for melting ice. Alpine glaciers have had increasingly negative mass balance over recent decades, and summer air temperature has also risen. Both these effects are well known, but in this paper we compare recent changes in mass balance and temperature to estimate the temperature sensitivity of observed mass balance for Alpine glaciers. Despite numerous modelling studies (cited above), ours is the first temperature-sensitivity estimate for observed mass balance.
We calculate temperature sensitivity for observed mass balance in several stages: (1) compile all available data for mass balance in the Alps and select those glaciers with the longest record; (2) calculate year-to-year fluctuations in average mass balance for the chosen glaciers; (3) calculate year-to-year fluctuations in summer mean temperature anomalies for weather stations in and around the Alps; and (4) compare mass-balance changes and temperature anomalies to estimate the temperature sensitivity of mass balance. We analyse the data with relatively simple techniques of classical climatology because we want to demonstrate temperature sensitivity in a model-free way, i.e. to compare temperature sensitivity for observed mass balance with the modelled sensitivity shown in Figure 1 . The purpose of this comparison is not to claim a ‘better’ mass-balance model for Alpine glaciers but to test the Alpine part of the global model of Reference Raper and BraithwaiteRaper and Braithwaite (2006).
3. Observed Glacier Mass Balance
We compiled observed glacier mass-balance data from all over the world for the period 1961–2010 together with relevant metadata (see https://www.escholar.manchester.ac.uk/uk-ac-man-scw:160805 for details). The data refer to measurements of winter, summer and annual balance using stakes and snow pits, i.e. by the so-called direct or glaciological method (Cogley and others, 2011), which are then area-averaged over the whole glacier to give mean specific balances.
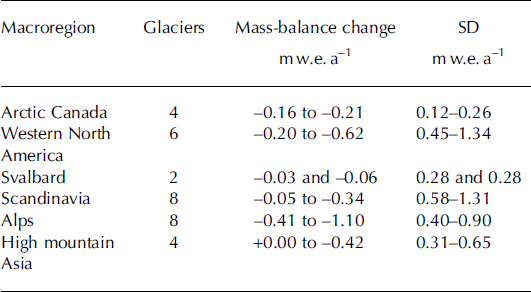
For the present purposes, the best glaciers to use are those where balance is measured every year so that statistics for different periods refer to the same glaciers. The longest mass-balance series in the whole world, continuing to the present, are shown in Table 1. We treat 1961–90 as our reference period and compare mass balance for 1991–2010 with this reference period. The mass-balance changes in Table 1 refer to the differences in mean mass balance for these two periods, while the standard deviations refer to the 1961–90 period. The regions in Table 1 are broadly defined and should not be taken as objectively defined to contain glaciers with the same or similar patterns of mass-balance variation. It is also notable that many glacierized regions of the world are not represented in this list of glaciers with long records. All regions show more negative balances for the recent 1991–2010 period, with relatively small changes at high latitude (Arctic Canada and Svalbard) in agreement with the lower year-to-year variability in mass balance (standard deviation) as first pointed out by Reference Braithwaite and ZhangBraithwaite and Zhang (1999b).
Mass-balance changes from 1961–90 to 1991–2010 for 32 glaciers in six macroregions. For sources of data see http://www.escholar.manchester.ac.uk/uk-ac-man-scw:160805. Standard deviations (SD) refer to the period 1961–90
In the present paper we concentrate on analysing the mass-balance changes shown for the eight Alpine glaciers and leave other regions for a later paper. The Alpine glacier data include revisions of previously published data from Griesgletscherand Silvrettagletscher(Reference Huss, Bauder and FunkHuss and other 2009a). There are several other glaciers (Reference Muller-Lemans, Funk, Aellen and KappenbergerMuller-Lemans and others, 1994; Reference AellenAellen, 1995; Reference Huss and BauderHuss and Bauder, 2009) with longer series of ‘index’ measurements, for example from single locations on glaciers, but we do not use these in our analysis. The very negative mass balance for the recent period (19912010) is not unprecedented as there is evidence (Reference AellenAellen, 1995; Reference Huss and BauderHuss and Bauder, 2009) of highly negative mass balance in the first half of the 20th century, with the highest melt rate in the balance year 1946/47 (just before the period covered by Table 1). Strong glacier melting in the 1940s may have been due to enhanced solar radiation (Reference Huss, Funk and OhmuraHuss and others, 2009b), while century-scale variations may reflect the Atlantic multi-decadal oscillation (Reference Huss, Hock, Bauder and FunkHuss and others, 2010) combined with a recent and growing enhancement of the greenhouse effect (Reference Philipona, Durr, Marty, Ohmura and WildPhilipona and others, 2004).
Records for six of the eight glaciers start before 1961 and continue to 2010 (Glacier de Saint-Sorlin, Glacier de Sarennes, Silvrettagletscher, Hintereisferner, Kesselwandfer-ner and Sonnblickkees). Measurements on a further two glaciers (Griesgletscher and Vernagtferner) start in the early 1960s, i.e. they miss only 1 or 4 years of the 30 year period 1961-90, and we include them in our eight-glacier dataset for the 50 year period 1961-2010. Although we study mass-balance variations of the same eight glaciers through the whole period, the records are not completely homogeneous from a statistical point of view. This is because mean specific balance is averaged over the whole glacier area (Anonymous, 1969) and, as the glacier hypsometry varies over time, the sampling space of the data changes. The response time (e-folding time) is of the order of 102 years for Alpine glaciers (Reference Raper and BraithwaiteRaper and Braithwaite, 2009), but some degree of area adjustment must already occur on the decadal scale. For example, ∼ 1 2% of the ice volume of Switzerland in 1999 was lost in the period 1999-2008, with a loss of ∼ 3 . 5% just in the warm summer of 2003 (Reference Farinotti, Huss, Bauder, Funk and TrufferFarinotti and others, 2009).
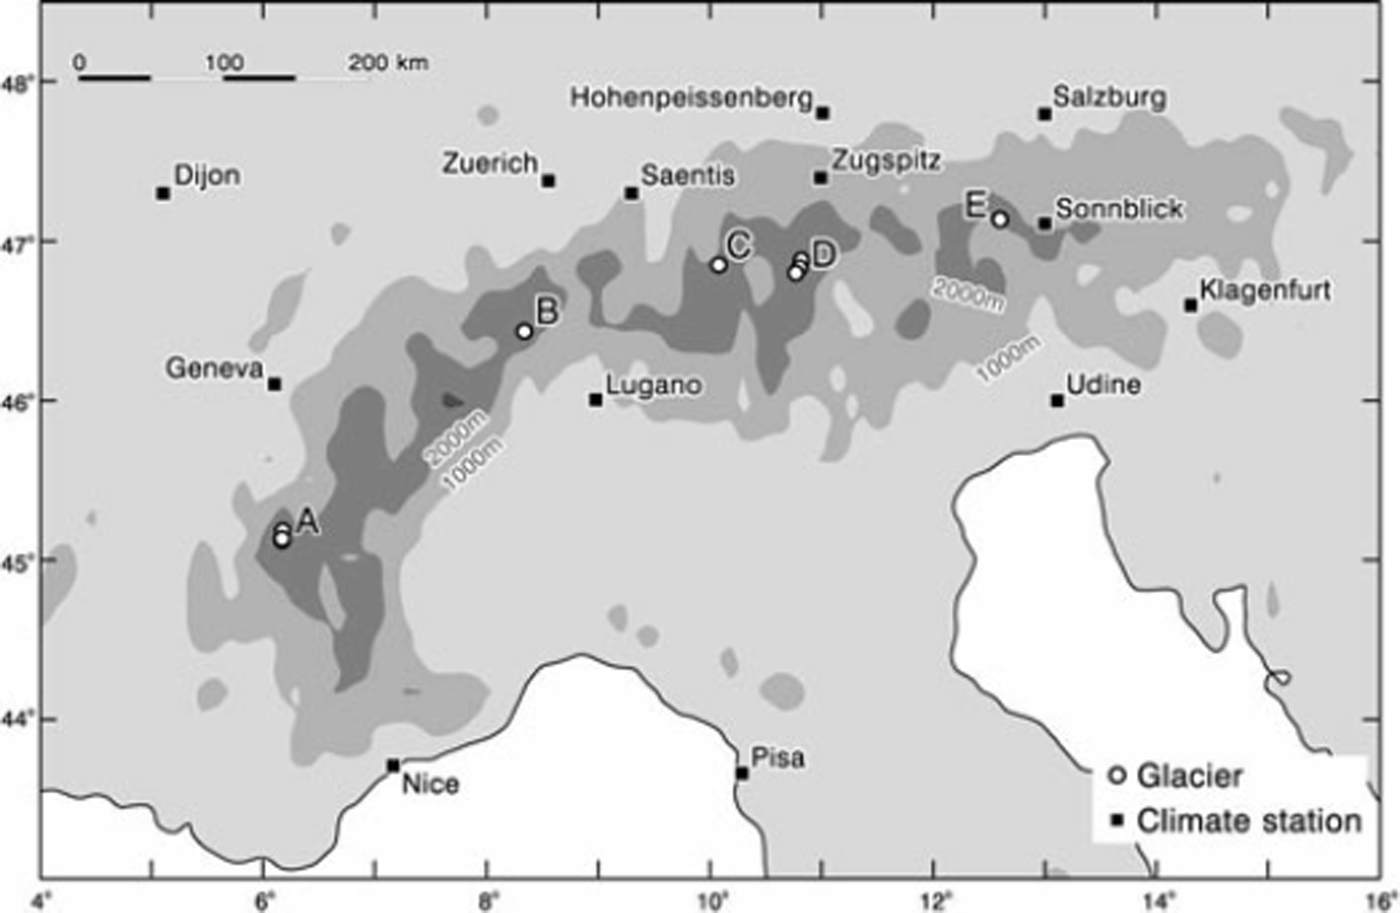
The locations of the eight glaciers are shown in Figure 2 (together with the locations of the 13 weather stations discussed in Section 4). Year-to-year variations in mean mass balance for the eight glaciers are shown in Figure 3 by the black line and values for the eight individual glaciers are shown in grey. The eight glaciers appear to have similar but not identical year-to-year variations. Mean mass balances on Hintereisferner and its close neighbour Kesselwandferner are known to be different (Reference Kuhn, Markl, Kaser, Nickus, Obleitner and SchneiderKuhn and others, 1985), but their time variations are quite similar in pattern if not in amplitude.
Locations of glaciers and weather stations in the Alps with long records. A: Glacier de Sarennes and Glacier de Saint-Sorlin; B: Griesgletscher; C: Silvrettagletscher; D: Hintereisferner, Kessel-wandferner and Vernagtferner; E: Sonnblikkees.
Mass-balance variations 1961–2010 for eight glaciers in the Alps. The black line shows the mean balance for the eight glaciers while the grey curves are for individual glaciers.

Mean mass balance fluctuates around a roughly constant base from 1961 to ∼1985 and then becomes more negative in later years (Fig. 3). For the eight-glacier mean balance, positive values occur in just under half the years (46% of cases) from 1961 to 1984 and then become very rare, with positive balances only in 1995 and 2001 (10% of cases). The highly negative balance for all eight glaciers in 2003 is noteworthy as most of Europe suffered from a heatwave in the summer of 2003 (Reference ScharSchar and others, 2004). If we interpret the balance variations in Figure 3 as mainly due to variations in melting, it is obvious that glacier melting has increased markedly in recent years.
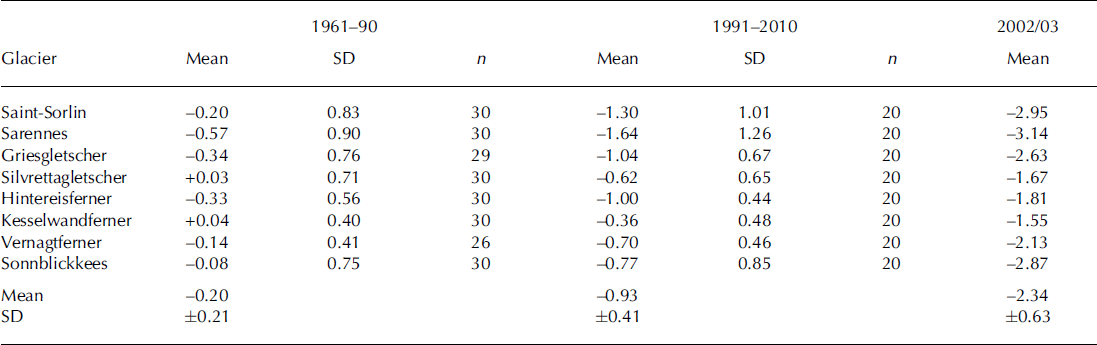
Mean and standard deviation of mass balance for the eight Alpine glaciers are listed in Table 2 for the reference period (1961-90), recent period (1991-2010) and the exceptional year 2002/03. The mean balances in Table 2 are used to estimate the temperature sensitivity of mass balance after the appropriate temperature anomalies have been established for the different periods (see Section 4).
Mean and standard deviation of mass balance for eight glaciers for the reference period 1961–90, the recent period 1991–2010 and the very warm year 2002/03. Mass-balance units are mw.e. a–1
4. Temperature Anomalies
The NASA Goddard Institute for Space Studies website (http://data.giss.nasa.gov/gistemp/station_data) is a convenient source of temperature data from established weather stations. In and around the Alps, we can identify 13 weather stations (Fig. 2) covering long periods of record, including the period of interest (1961-2010). Several of the weather stations (Geneva, Zurich, Hohenpeissen and Klagenfurt) also have records extending back to the 19th century or even earlier. Three stations are located at high altitude (Santis, Zugspitz and Sonnblick) and may therefore better reflect conditions near the glacier ELA, i.e. ∼25003000 ma.s.l. for the Alps. If we express temperatures at each station as deviations (or anomalies) from their 1961-90 averages, the year-to-year variations in anomalies at the different stations are remarkably similar.
It has long been recognized that air temperature variations are only relevant to glacier melting at temperatures close to, or above, the melting point of ice. This effect can be expressed in terms of the degree-day approach, which is well justified from the point of view of the glacier energy balance (Reference BraithwaiteBraithwaite, 1995). However, annual degree-day totals are a function of summer mean temperature (Reference ReehReeh, 1991), and because summer mean temperatures are marginally easier to use than degree-day totals we prefer here to compare variations of glacier mass balance with variations in ‘summer’ temperature, however defined. The standard climate definition of ‘summer’ is June-August in northern mid-latitudes (Meteorological Office, 1991), but Alpine glaciers generally have a longer melt season than the 3 months (92 days) of June-August. For example, degree-day modelling by Reference Braithwaite and RaperBraithwaite and Raper (2007) suggests a melt season of 1 0 6 ± 1 6 days at the balanced-budget ELA, i.e. 3-4 months in duration, while Reference Vincent, Kappenberger, Valla, Bauder, Funk and Le MeurVincent and others (2004) suggest an ablation season from June to September or October, i.e. 4-5 months. We calculate temperature anomalies for summers of several different durations to determine whether this is a critical issue (Table 3).
The mean temperature anomalies in Table 3 for 1961-90 are obviously zero by definition of ‘anomaly’, but the mean anomalies for the 20 year period 1991-2010 and for the very hot summer of 2003 are much warmer than for the reference period. For any sensible choice of summer duration, i.e. 4-5 months according to Reference Vincent, Kappenberger, Valla, Bauder, Funk and Le MeurVincent and others (2004), the period 1991-2010 is on average 1.02-1.108C warmer than the base period 1961-90, or +1.05 K for a 4.5 month melt season (average of anomalies for June-September and June-October). The 2003 summer was also exceptionally warm, with a temperature anomaly of +3.03 K for a 4.5 month summer. In addition to the 13-station anomalies (Table 3), we also calculate mean anomalies for the three high-altitude stations to see if they are significantly different from the full set of 13-station anomalies. The high-altitude anomalies (mean = 0.97 ± 0.82 K for a 4.5 month anomaly) are slightly lower than the 13-station anomalies (mean = 1.06 ± 0.93 K), but the differences are not statistically significant at 5% probability level according to the t test.
Mean and standard deviation of temperature anomalies (K) for 1991–2010 and for summer 2003 compared with the reference period 1961–90. Anomalies refer to June–August (3 months), June–September (4 months) and May–September (5 months). The 4.5 month anomaly is the average of 4 and 5 month anomalies
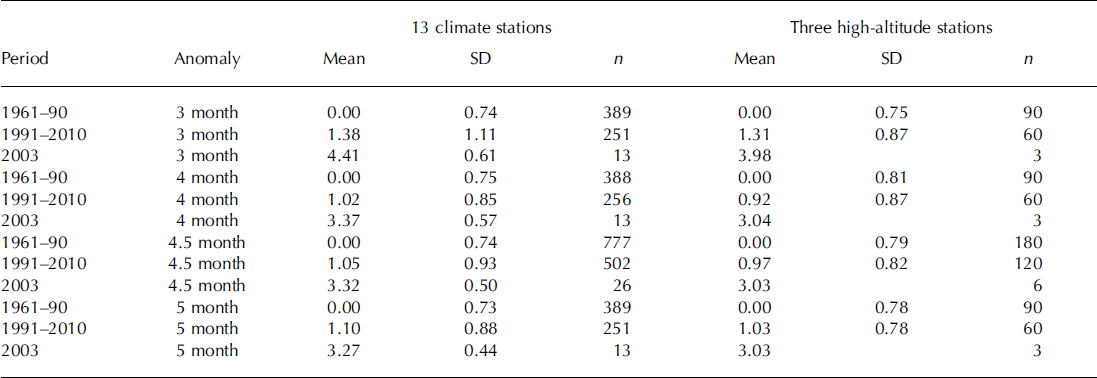
Year-to-year variations in summer temperature (4.5 month anomaly) are shown in Figure 4 for the full 50 years of record. The thick black line refers to the mean of the 13 stations, while grey lines refer to individual stations. The warmer summers in recent years (Fig. 4) appear to coincide with the recent trend to increasingly negative mass balances (Fig. 3) and we discuss this in quantitative terms in Section 5.
Summer temperature (4.5month anomaly) variations 1961– 2010 for weather stations in and around the Alps. The black line is an average for 13 climate stations while the grey lines are for individual glaciers.

5. Temperature Sensitivity of Observed Mass Balance
We estimate temperature sensitivity of mass balance by comparing observed mass-balance changes for 1991–2010 and 2003 (relative to the reference period) with the corresponding temperature anomalies. The sensitivities (Ab/AT) in Table 4 are based on a 4.5 month temperature anomaly (AT) for all 13 stations. The sensitivity varies greatly between glaciers, with higher values for the western glaciers (Glacier de Saint-Sorlin and Glacier de Sarennes) and lower values for the eastern glaciers (Hintereisferner, Kesselwand-ferner and Vernagtferner). This same pattern is shown by the standard deviation of the observed mass balance, suggesting that mean changes in balance and year-to-year fluctuations in balance have the same underlying climatic cause. Winter balance data are only available for four of the glaciers (Table 4), but there is a hint that the inter-glacier variations are controlled by winter balance in agreement with Reference Braithwaite and ZhangBraithwaite and Zhang (1999b).
Changes in observed mass balance and temperature for the period 1991-2010 compared with the reference period 1961-90. A b is the change in mass balance, ATis the change in average temperature for a 4.5 month anomaly for all 13 climate stations, Ab/ATis the temperature sensitivity of observed mass balance, SD is the standard deviation of observed mass balance and bw is the mean winter balance, which is only available for four of the eight glaciers. The latter two are for the reference period
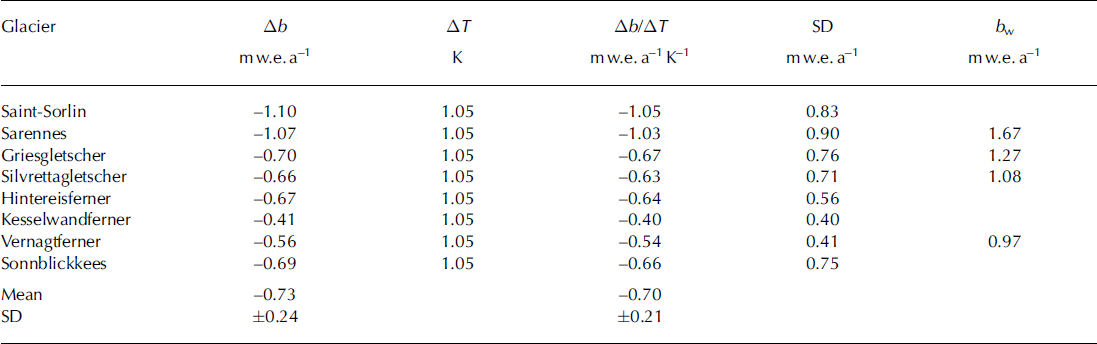
The sensitivity values in Table 4 obviously depend upon the specific choice of temperature anomaly, in this case a 4.5 month anomaly. To see if this choice is crucial, we calculated mean sensitivity for different choices of temperature anomaly, i.e. for 3.0, 4.0, 4.5 and 5.0 months, for 19912010 and 2003 changes, and for all 13 climate stations and only the three high-altitude stations. As noted earlier, a 3 month anomaly is too short to represent the true melting season. For all other choices of temperature anomaly in Table 5, a rounded-off value of -0.7 m w.e. a-1 K–1 (with standard deviation ±0.2 m w.e. a-1 K–1) is a robust estimate of the temperature sensitivity of observed mass balance for Alpine glaciers. The inter-glacier patterns of variation for the different anomalies are similar to that in Table 4.
Mean and standard deviation of temperature sensitivity of observed mass balance for eight Alpine glaciers depending upon different choices of temperature anomaly. Units are m w.e. a–1 K–1

6. Discussion
Our temperature sensitivity for observed mass balance is similar to the low estimate for modelled sensitivity in Figure 1 , i.e. for a degree-day factor of 6mmd– 1 K–1 for melting ice. For example the observed sensitivity (mean = –7, SD (standard deviation)= 0.2, n = 8) is not significantly different from the modelled sensitivity (mean= –0.75, SD= 0.14, n = 141) at 5% probability level according to the standard t test. Observed sensitivity is, however, significantly lower (at 5% probability) than the two higher modelled sensitivities in Figure 1 . We might therefore conclude that our observed sensitivity is consistent with the degree-day model using a low value of degree-day factor, but simple comparison is difficult because there may be several other factors affecting observed sensitivity, as outlined below:
-
1. The modelled temperature sensitivity in Figure 1 is the result of a sudden change in temperature applied to a balanced-budget glacier with its area held constant. This is not exactly what happens in reality where the temperature anomaly is applied over two decades and glacier area starts to adjust to temperature anomaly.
-
2. We attribute the whole change in observed mass balance to changing temperature, but precipitation changes could also cause greater or smaller changes in mass balance although model studies suggest that relatively large precipitation increases of 30–40% are needed to offset the effects of a +1 K temperature change (Reference Braithwaite, Zhang and RaperBraithwaite and others 2002; Reference Braithwaite and RaperBraithwaite and Raper, 2007).
-
3. The melt–temperature relation may itself change due to long-term variations in global radiation. For example, Reference Huss, Funk and OhmuraHuss and others (2009b) suggest that the degree-day factor for melting snow was relatively high in the 1940s and low in recent years, so recent glacier melt may be 10–15% lower than it would otherwise be.
-
4. Reference Oerlemans, Giesen and Van den BroekeOerlemans and others (2009) suggest lower albedo may increase the melt rate on retreating glaciers, implying increasingly negative temperature sensitivity.
-
5. Recent changes in glacier hypsometry, involving changes in total area and ice thickness (Reference Farinotti, Huss, Bauder, Funk and TrufferFarinotti and others, 2009), affect observed mass balance while hypsometry is held constant in models to calculate temperature sensitivities as in Figure 1 . In the terminology of Reference Elsberg, Harrison, Echelmeyer and KrimmelElsberg and others (2001), results in Tables 4 and 5 refer to ‘conventional’ mass balance, while those in Figure 1 refer to ‘reference surface’ mass balance. Reference Huss, Hock, Bauder and FunkHuss and others (2012) suggest that two opposing feedbacks operate: (a) loss of area at lower elevations, making the observed change in mass balance less negative than it would otherwise have been; and (b) surface lowering of the whole glacier resulting in greater negative observed change in mass balance.
From the above, observed mass-balance change may not be a linear function of temperature change as we assume and there is a simple way to test this using double-mass analysis, which is a common technique in hydrology for comparing the relative consistency of time series (Reference Bruce and ClarkBruce and Clark, 1966). Figure 5 shows double-mass curves for cumulative mass-balance anomaly versus cumulative summer temperature anomaly for 1990–2010 (mass-balance anomaly in a particular year is equal to that year’s balance minus the mean balance for 1961–90).
Cumulative mass-balance anomaly for eight glaciers 1991– 2010 plotted against cumulative mean summer temperature anomaly for 13 climate stations. The eight glaciers are Glacier de Sarennes (SAR), Glacier de Saint-Sorlin (SOS), Griesgletscher (GRI), Silvrettagletscher (SIL), Hintereisferner (HIN), Kesselwandferner (KES), Vernagtferner (VER) and Sonnblickkees (SON).

The double-mass plot in Figure 5 would show a single straight line for 1990–2010 if (1) temperature changes were the only relevant factor and (2) all glaciers had the same sensitivity. Clearly, different glaciers have different sensitivity, as we have already seen, and curves for individual glaciers are not perfectly straight. For example, several glaciers show small jumps to less negative balances just after 1996 and 2001 that cannot be explained by temperature changes. There are also several apparent changes in gradient (e.g. in 2003) which might be due to large changes in glacier hypsometry. The change in gradient in 2003 is particularly marked for the glaciers with greater than average mass-balance change (Glacier de Saint-Sorlin and Glacier de Sarennes), and their double-mass curves can be approximated by two linear segments, 1990–2003 and 2003–10, denoting an increase in temperature sensitivity from –0.7 to –1.6 mw.e. a–1 K–1 (Glacier de Saint-Sorlin) and –0.5 to –1.9mw.e. a–1 K–1 (Glacier de Sarennes). The change in mean sensitivity for the eight glaciers for the same periods is only -0.6 to -0.9 mw.e. a- 1 K–1. This increased negative sensitivity around 2003 could be due to increased albedo under factor 4 or widespread surface lowering under factor 5(b) but not due to reduced global radiation under factor 3 or loss of area at low elevation under factor 5(a) as these would tend to reduce melting.
No doubt, factors 1-5 are all relevant but Figure 5 suggests that the important control on recent mass-balance change for Alpine glaciers is temperature change, with different sensitivity for different glaciers. The temperature sensitivity for observed mass-balance changes may have two components: (1) one representing direct response of the mass balance to temperature change, which can be compared to model sensitivity; and (2) one representing change in glacier hypsometry.
7. Conclusions
Average glacier mass balance for eight Alpine glaciers was slightly negative for the 30 year reference period (1961-90), more negative for the recent period (1991-2010) and highly negative for the balance year 2002/03. Air temperature at 13 weather stations in and around the Alps also rose during the recent period. The temperature sensitivity of observed mass balance is estimated by dividing balance changes by changes in temperature anomaly. For a plausible range of different durations of the summer temperature anomaly, the mean and standard deviation of temperature sensitivity for the eight glaciers is approximately -0.7 ± 0 . 2 m w.e. a- 1 K–1. Temperature sensitivities for individual glaciers are strongly correlated with the standard deviation of observed mass balance, with higher values in the western Alps and lower values in the eastern Alps. The temperature sensitivities found here for observed mass balance are in reasonable agreement with earlier results from degree-day modelling, although direct comparison is difficult. For example, changes in glacier hypsometry, particularly associated with the very warm summer of 2003, may have increased temperature sensitivity during the 1991-2010 period.
Acknowledgements
This paper is respectfully dedicated to the memory of Markus Aellen (1934-1999) who measured mass balance on many glaciers and wrote many data reports. Romain Candela was supported during 2007-10 by a PhD studentship from Manchester Metropolitan University. Preliminary results of this study were presented at the Alpine Glacier Meeting in Zurich, Switzerland, 2-3 February 2012. Comments by C. Vincent and an anonymous referee helped to improve the manuscript. The scientific editor was Matthias Huss.



