


Intake of n-3 long-chain PUFA (n-3 LC-PUFA), mainly EPA (20 : 5n-3) and DHA (22 : 6n-3), which are abundant in marine fish meat and oil, has many health benefits. These fatty acids (FA) can protect against CVD, and improve insulin sensitivity with protective effects against obesity(Reference Schmidt, Skou and Christensen1–Reference González-Périz, Horrillo and Ferré5).
The mechanisms behind the beneficial effects of n-3 LC-PUFA are numerous, including competitive inhibition with arachidonic acid (AA) conversion to pro-inflammatory eicosanoids, modification of the membrane enzyme activity(Reference al-Shurbaji, Larsson-Backström and Berglund6), modulation of gene expressions(Reference Flachs, Horakova and Brauner7, Reference Jump8) and change in the pattern of secreted adipocytokines. Adiponectin is an adipocyte secretory protein that exerts potent insulin-sensitising property in conjunction with anti-atherogenic and anti-inflammatory properties(Reference Díez and Iglesias9–Reference Shklyaev, Aslanidi and Tennant12). Serum concentrations of adiponectin decrease in patients with type 2 diabetes, insulin resistance and obesity(Reference Arita, Kihara and Ouchi10, Reference Hotta, Funahashi and Arita13–Reference Bruun, Lihn and Verdich15). n-3 LC-PUFA have been shown to stimulate the secretion of adiponectin in mice fed a high-fat diet for a period of 5 weeks(Reference Flachs, Mohamed-Ali and Horakova16). The induction of plasma adiponectin has also been observed in overweight human subjects in response to daily intake of n-3 LC-PUFA(Reference Krebs, Browning and McLean17). n-3 LC-PUFA intake could also modify the secretion of other adipokines. Among them, leptin is also thought to provide a link between inflammation, insulin resistance and obesity(Reference Ahima and Flier18, Reference Sader, Nian and Liu19), but in contrast to adiponectin, leptin has pro-inflammatory effects(Reference Janik, Curti and Considine20–Reference Francis, MohanKumar and MohanKumar22). Plasma leptin concentration has been shown to decline in mice fed fish oil diet for 15 d(Reference Neschen, Morino and Rossbacher23).
One concern is that most studies have used fish oil to examine the benefical effects of n-3 LC-PUFA. However, these oils usually consist mainly of EPA and DHA and smaller amounts of other n-3 and n-6 PUFA. One study has examined the effect of dietary DHA on adipocytokine secretion in mice(Reference Vemuri, Kelley and Mackey24). In this study, DHA, rather than EPA, was shown to have the most pronounced effect on adiponectin induction. However, the study was conducted over a relatively long period (8-week feeding period). Another concern is that it is not known whether the protective effects of DHA are maintained after the arrest of the DHA-rich diet feeding. Moreover, while intake of DHA has been recommended, its kinetics of incorporation remains largely unknown, especially during the early days of dietary enrichment, and we know that the beneficial effects of n-3 LC-PUFA depend on the duration of their administration. Hence, it is critical to have a better understanding of the accretion of DHA. The effects of n-3 LC-PUFA result also from their interactions with several organ systems. Therefore, one aim of the present study was to determine the kinetics of DHA incorporation in different mouse tissues, following dietary supplementation. Membrane phospholipid FA composition was examined in liver, heart and white adipose tissues (WAT). The investigation of the effects of this DHA supplementation on cytokine production, especially adiponectin and leptin secretion, was most relevant. The n-3 LC-PUFA and adipokine concentrations have also been measured in animals submitted to a washout period equal to the length of supplementation.
Experimental methods
Animals and diets
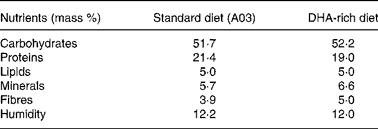
Experiments were granted approval by the French Ministry of Agriculture, Fishing and Alimentation, and the Departmental Veterinary Agency of Rhône, and conducted using 3-week-old male International Cancer Research mice (Harlan, Gannat, France). All mice were treated in accordance with the European Communities Council Guidelines (24 November 1986, 86/609/EEC). Twenty-eight mice were randomly assigned to a standard diet A03 (SAFE, Augy, France) containing 5 % lipids (control group), or to a DHA-enriched diet reconstituted with lipid-free powder (SAFE), 4·5 % sunflower oil (Lesieur, Asnières-sur-Seine, France) and 0·5 % 1,2,3-tridocosahexaenoylglycerol (Polaris, Pleuven, France) (experimental group). Both diets were nutritionally balanced. The complete nutrient and FA compositions of each of the diets are listed in Tables 1 and 2. Some mice were fed the DHA-enriched diet for 16 d, and were then maintained on the standard diet for 16 more days (washout group). The food was prepared daily to avoid DHA peroxidation. All mice were fed ad libitum. TAG have been used for the DHA supplementation as they are quantitatively the most important lipid compounds in the human diet, and as they cause a good intestinal absorption (with efficiency higher than 95 %).
Nutrient composition of standard (A03) and DHA-rich diets
Fatty acid composition of standard (A03) and DHA-rich diets
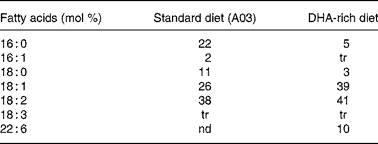
tr, trace; nd, non-detected.
Mice were killed on days 0, 4, 8, 16 and 32 by lethal intraperitoneal injection of pentobarbitone (1 μg/μl) and weighed. Blood samples were collected, and plasma was obtained from the blood samples after centrifugation. Tissues and organs were dissected and immediately flash frozen in liquid N2 and stored at − 80°C until they were analysed.
Lipids extraction and analyses
Total lipids were extracted twice from tissue homogenates with ethanol–chloroform (1:2, v/v). Before extraction, internal standards (1,2-diheptadecanoyl-sn-glycero-3-phosphocholine and 1,2-diheptadecanoyl-sn-glycero-3-phosphoethanolamine) were added. The organic phases were dried under N2, and the different phospholipid classes were then separated by TLC using the solvent mixture chloroform–methanol–aqueous methylamine solution (14 %) (61:19:5, v/v/v) as an eluent. Phosphatidylethanolamine (PE) and phosphatidylcholine (PC) were detected by spraying the silica gel plate with 0·2 % dichlorofluorescein in ethanol. Silica gel was scraped off, and PE and PC were extracted using a mixture of ethanol–chloroform (2:1, v/v). Each phospholipid was transmethylated, and the FA methyl esters were analysed by GC. Briefly, each fraction was treated separately with 500 μl of toluene–methanol (2:3, v/v) and 500 μl of 14 % boron trifluoride in methanol. Transmethylation was carried out at 100°C for 90 min in screw-capped tubes. The reaction was terminated by cooling the tubes to 0°C and by the addition of 1·5 ml K2CO3 in 10 % water. The resulting FA methyl esters were extracted by 2 ml of isooctane, and analysed by GC using a DELSI instrument model DI 200 equipped with a fused silica capillary SP-2380 column (60 × 0·22 mm). He gas was used as the vector gas. Temperatures of the Ross injector and the flame ionisation detector were set at 230 and 250°C, respectively.
Multiplex analysis
Concentrations of adipocytokines in sera were measured by the LINCOplex assay (LINCO Research, St Louis, MO, USA) following the manufacturer's instructions. In brief, the antibody-immobilised beads were incubated with standards, controls and samples in a ninety-six-well microtitre filter plate overnight at 2–4°C. After washing the plate to remove excess reagents, detection antibody was added. Incubation was carried out for 30 min at room temperature, and streptavidin–phycoerythrin was then added for an additional 30 min. After a final washing step, the beads were resuspended in a buffer, and were read using a laser-based detection instrument, the Luminex100, to determine the concentration of the cytokines of interest.
Adiponectin and leptin measurement in adipose tissues
Adipose tissues (AT) were homogenised in a buffer (10 mm-Tris–HCl, pH 7·4, and 250 mm-sucrose) containing a protease inhibitor cocktail. The mixture was then centrifuged at 10 000 g for 5 min. Adiponectin and leptin contents of the AT homogenates were measured by means of an ELISA (SpiBio, Montigny Le Bretonneux, France).
Statistics
Values are presented as means with their standard errors. The data were analysed using one-way ANOVA followed by Fisher's protected least significant difference (PLSD) post hoc tests, or using Student's paired t test when appropriate. Different superscripts designate differences between groups at P < 0·05.
Results
Body weight
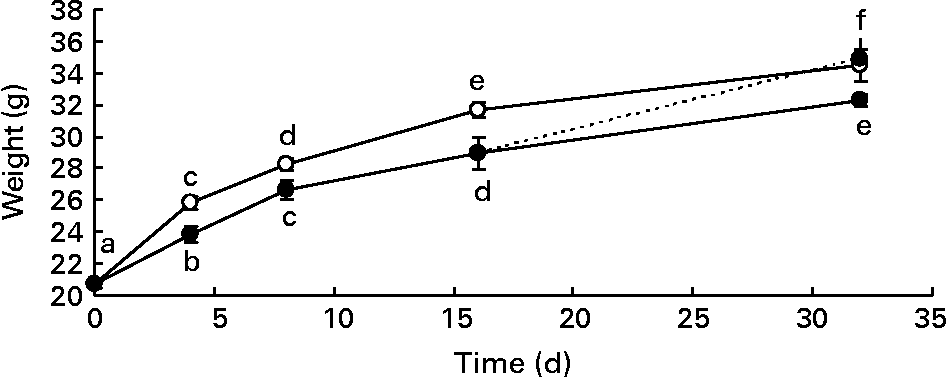
Male mice were divided into two groups, and were fed a standard diet (control) or a diet supplemented with DHA for different times. Body weight gain of mice fed the DHA-rich diet was significantly lower than that of mice fed the standard diet (Fig. 1). This difference in body weight gain became significant as early as 4 d after the initiation of the DHA-rich diet feeding. After a 16 d washout period (mice fed the DHA-rich diet for 16 d and the standard diet for two other weeks), body weight of high-DHA diet-fed mice no longer differed from that of the standard diet-fed mice.
Body weight gain (g) of mice fed a standard diet (control group –○–) and a DHA-rich diet (DHA group –●–) or mice fed a DHA-rich diet for the first 16 d and then the standard diet for the last 16 d (washout (WO) group - -●- -). Mice were killed on days 0, 4, 8, 16 and 32. Data are means with their standard errors (n 60, 28, 20, 20 and 8 on days 0, 4, 8, 16 and 32 for the control group; n 28, 24, 20 and 8 on days 0, 4, 8, 16 and 32 for the DHA group and n 4 for the WO group). a,b,c,d,e,f Mean values with unlike letters were significantly different (P < 0·05).
Incorporation of DHA in liver, heart and white adipose tissues
Figs. 2 and 3 show the DHA incorporation in PE and PC of liver, heart, subcutaneous, epididymal and retroperitoneal WAT. Proportions of DHA significantly increased in PE and PC of all tissues after only 4 d of DHA-enriched diet feeding.
22 : 6n-3 proportions in phosphatidylethanolamine from liver (A), heart (B) and subcutaneous (C), epididymal (D) and retroperitoneal adipose tissues (E) of mice fed a standard diet (control group –○–) and a DHA-rich diet (DHA group –●–) or mice fed a DHA-rich diet for the first 16 d and then the standard diet for the last 16 d (washout (WO) group - -●- -). Mice were killed on days 0, 4, 8, 16 and 32. Results are means with their standard errors (n 4). a,b,c,d Mean values with unlike letters were significantly different (P < 0·05). FA, fatty acids.

22 : 6n-3 proportions in phosphatidylcholine from liver (A), heart (B) and subcutaneous (C), epididymal (D) and retroperitoneal adipose tissues (E) of mice fed a standard diet (control group –○–) and a DHA-rich diet (DHA group –●–) or mice fed a DHA-rich diet for the first 16 d and then the standard diet for the last 16 d (washout (WO) group - -●- -). Mice were killed on days 0, 4, 8, 16 and 32. Results are means with their standard errors (n 4). a,b,c,d,e Mean values with unlike letters were significantly different (P < 0·05). FA, fatty acids.

In the liver (Figs. 2(A) and 3(A)), DHA proportions in PE did not get significantly higher beyond 4 d, whereas proportions of DHA in PC continued to increase significantly until 8 d of high-DHA diet feeding. In both cases, there was no significant difference in the proportions observed on day 8 and day 16. The increase in DHA proportions reached +116 % in PE (27·6 (sem 0·5) v. 12·8 (sem 0·3) mol %) and +118 % in PC (14·8 (sem 0·4) v. 6·8 (sem 0·2) mol %) after 4 and 8 d of DHA-rich diet feeding, respectively. After a 16 d washout period, DHA proportions in PE and PC no longer differed from those found in the control mice.
In the heart (Figs. 2(B) and 3(B)), DHA proportions in PE and PC increased as a function of feeding time during the 32 d of DHA-rich diet feeding, reaching +96 and +188 % in PE and PC, respectively, after 32 d of DHA-enriched feeding. In contrast to liver phospholipids, the proportions of DHA were still significantly higher in both phospholipids than those observed in mice fed the standard diet after the 16 d washout period.
In all three WAT, subcutaneous (Fig. 2(C)), epididymal (Figs. 2(D) and 3(D)) and retroperitoneal (Figs. 2(E) and 3(E)) tissues, DHA proportions in PE and PC were maximum on day 4 in mice fed the DHA-rich diet. Figs. 3(C)–(E) show that the proportions of DHA did not significantly differ between day 4 and day 16 in PC of WAT, and that they declined thereafter. The same observations can be made for the incorporation of DHA in PE of retroperioneal WAT (Fig. 2(E)). In subcutaneous and epididymal WAT, DHA proportion did not significantly differ in PE beyond 4 d (Fig. 2(C) and (D)). As observed in the liver, DHA proportions in PE and PC no longer differed from those found in the control mice after a 16 d washout period.
As shown in Figs. 2 and 3, proportions of DHA in both phospholipids of the control mice were lower in WAT than those observed in the liver and heart. The most important differences were observed for the heart and subcutaneous WAT, with more than six- and elevenfold DHA in heart PE and PC, respectively, compared with the subcutaneous WAT. In the DHA-fed mice, DHA proportions increased by 1·5- to 2·5-fold in the liver and heart PE and by 2·5- to 5-fold in WAT PE compared with the controls. Furthermore, the DHA proportions in WAT PC of the DHA-fed mice became fivefold higher than those found in the standard diet-fed mice, whereas DHA content in the liver and heart PC were two- and threefold higher than that found in the control mice, respectively.
The increase in DHA proportions in all tissue phospholipids in the DHA-fed mice was accompanied by decreased proportions of AA (Figs. 4 and 5). AA proportions were still significantly lower in PE and PC of retroperitoneal tissue than those observed in mice fed the standard diet after the 16 d washout period, although DHA was not increased any more.
20 : 4n-6 proportions in phosphatidylethanolamine from liver (A), heart (B) and subcutaneous (C), epididymal (D) and retroperitoneal adipose tissues (E) of mice fed a standard diet (control group –○–) and a DHA-rich diet (DHA group –●–) or mice fed a DHA-rich diet for the first 16 d and then the standard diet for the last 16 d (washout (WO) group - -●- -). Mice were killed on days 0, 4, 8, 16 and 32. Results are means with their standard errors (n 4). a,b,c,d,e,f,g,h Mean values with unlike letters were significantly different (P < 0·05). FA, fatty acids.

20 : 4n-6 proportions in phosphatidylcholine from liver (A), heart (B) and subcutaneous (C), epididymal (D) and retroperitoneal adipose tissues (E) of mice fed a standard diet (control group –○–) and a DHA-rich diet (DHA group –●–) or mice fed a DHA-rich diet for the first 16 d and then the standard diet for the last 16 d (washout (WO) group - -●- -). Mice were killed on days 0, 4, 8, 16 and 32. Results are means with their standard errors (n 4). a,b,c,d,e,g Mean values with unlike letters were significantly different (P < 0·05). FA, fatty acids.

EPA was not detected in the tissues of the control mice, but it was detectable in tissue phospholipids of the DHA-fed mice (Figs. 6 and 7).
20 : 5n-3 proportions in phosphatidylethanolamine from liver (A), heart (B) and subcutaneous (C), epididymal (D) and retroperitoneal adipose tissues (E) of mice fed a standard diet (control group –○–) and a DHA-rich diet (DHA group –●–) or mice fed a DHA-rich diet for the first 16 d and then the standard diet for the last 16 d (washout (WO) group - -●- -). Mice were killed on days 0, 4, 8, 16 and 32. Results are means with their standard errors (n 4). a,b Mean values with unlike letters are significantly different (P < 0·05). FA, fatty acids.

20 : 5n-3 proportions in phosphatidylcholine from liver (A), heart (B) and subcutaneous (C), epididymal (D) and retroperitoneal adipose tissues (E) of mice fed a standard diet (control group –○–) and a DHA-rich diet (DHA group –●–) or mice fed a DHA-rich diet for the first 16 d and then the standard diet for the last 16 d (washout (WO) group - -●- -). Mice were killed on days 0, 4, 8, 16 and 32. Results are means with their standard errors (n 4). a,b Mean values with unlike letters are significantly different (P < 0·05). FA, fatty acids.

Effects of dietary DHA on cytokines secretion, adipose tissue content and expression
We examined the effects of DHA on the production of adiponectin and leptin, which are two cytokines known to participate in the regulation of insulin sensitivity. As shown in Fig. 8(A), plasma level of adiponectin was significantly increased (by 2·4-fold) as early as 4 d after the initiation of the DHA-enriched diet feeding. These effects were long lasting in that the adiponectin secretion was still significantly higher than that observed in mice fed the standard diet after the 16 d washout period. On the contrary, blood leptin secretion was decreased by dietary DHA (Fig. 8(B)) by 1·6-fold after 4 d of high-DHA diet feeding. When the DHA-enriched diet was replaced with the standard diet for 16 d, the decrease in leptin secretion was still observed compared with the control mice.
Plasma levels of adiponectin (A) and leptin (B) of mice fed a standard diet (control group –○–) and a DHA-rich diet (DHA group –●–) or mice fed a DHA-rich diet for the first 16 d and then the standard diet for the last 16 d (washout (WO) group - -●- -). Plasma levels are expressed in ng/ml and pg/ml for adiponectin and leptin, respectively. Results are means with their standard errors (n 4). Mean values were significantly different compared with the control group: **P < 0·01 and ***P < 0·001.

We also directly measured the content of adiponectin and leptin in AT on day 4. In all three WAT, subcutaneous, epididymal and retroperitoneal tissues, the adipokine content was not significantly different between mice fed the DHA-rich diet and mice fed the standard diet (Fig. 9). However, the adiponectin content was dependent on AT depot, with the epididymal AT showing the highest content of adiponectin both in the control mice and in the DHA-fed mice. Adiponectin gene expression was significantly increased in the epididymal and subcutaneous tissues of the DHA-fed mice than in those of the control mice, with the increase of adiponectin gene expression being more pronounced in the epipidymal AT than in the subcutaneous AT (2·2- and 1·5-fold increase, respectively). In the case of leptin, no significant effect was found in all three WAT leptin gene expressions between mice fed the DHA-rich diet and mice fed the standard diet (unpublished results).
Adiponectin (A) and leptin (B) protein contents in epididymal, retroperitoneal and subcutaneous white adipose tissues (AT) of mice fed a standard diet (control group □) or mice fed a DHA-rich diet (DHA group ■) for 4 d. Adiponectin and leptin contents of AT are expressed in ng/mg AT and pg/mg AT for adiponectin and leptin, respectively. Results are means with their standard errors (n 8). Mean values were significantly different compared with the control group: *P < 0·05.

Discussion
In the present study, we demonstrated that DHA increased adiponectin secretion in mice fed the DHA-rich diet than in mice fed the standard diet. The only previous study that investigated the effect of DHA on adipocytokine secretion was conducted over an 8-week feeding period(Reference Vemuri, Kelley and Mackey24). The present results show that this increase was significant as early as 4 d after the initiation of the DHA-enriched diet feeding. In addition, the DHA-rich diet decreased serum leptin concentration. Interestingly, we have shown for the first time that these protective effects of DHA were maintained even after the arrest of the DHA-rich diet feeding, since plasma concentrations of adiponectin and leptin remained higher and lower, respectively, compared with the mice fed the control diet. Adiponectin is one of the most abundant plasma protein adipocytokines, essentially expressed in AT, able to protect against the development of atherosclerosis and insulin resistance. Indeed, it has been well documented that plasma adiponectin concentration is decreased in patients with coronary artery disease risks including type 2 diabetes and obesity(Reference Hotta, Funahashi and Arita13, Reference Ryan, Berman and Nicklas14, Reference Ouchi, Kihara and Arita25). We found these beneficial effects to be associated with increased incorporation of DHA in PE and PC of all analysed tissues, although the WAT showed the highest relative incorporation. These DHA proportion increases were observed after only 4 d of DHA-enriched diet feeding. In contrast to WAT and liver, DHA proportions were still significantly higher in both heart phospholipids than those observed in the control mice after the 16 d washout period, suggesting that the turnover of DHA in WAT is highest. DHA increase was also accompanied by EPA increase. Since the dietary supplement was free of EPA, this suggests that DHA was retroconverted to EPA as reported previously(Reference Von Schacky and Weber26–Reference Stark and Holub28). These modifications were accompanied by a decreased AA proportion in tissue phospholipids, which is consistent with previous studies that reported that DHA incorporation in cell phospholipids partly occurs at the expense of AA(Reference Lands, Libelt and Morris29–Reference Mebarek, Ermak and Benzaria31). The modification of the FA pattern of membrane phospholipids can, in turn, change the cell membrane fluidity, which may affect the three-dimensional structure of membrane proteins, thereby affecting their functions(Reference Holte, Separovic and Gawrisch32–Reference Yehuda, Rabinovitz and Mostofsky36). An altered pattern of eicosanoid production might also explain the modification of the cytokine profile. Indeed, the increase in phospholipid DHA content decreases the synthesis of AA-derived eicosanoids. In general, eicosanoids derived from n-3 LC-PUFA have anti-inflammatory effects, while those produced from n-6 PUFA have pro-inflammatory effects(Reference James, Gibson and Cleland37). Additionally, novel bioactive lipid mediators generated from n-3 LC-PUFA, named resolvins and protectins, have also been shown to possess potent anti-inflammatory effects mediating the beneficial actions of n-3 LC-PUFA(Reference González-Périz, Horrillo and Ferré5, Reference Serhan, Gotlinger and Hong38). The effect of n-3 LC-PUFA on adiponectin secretion may also be mediated through their action as ligands of PPARγ(Reference Neschen, Morino and Rossbacher23).
The results presented here also confirm the reports of previous studies that showed marked differences in relative concentrations of DHA between different tissues(Reference Charnock, Abeywardena and Poletti39), and clearly show their diverse responses after DHA intake. Phospholipids from heart had the highest basal DHA proportion than those from other organs, whereas AT phospholipids had the lowest. This may explain why AT showed the highest relative change in DHA proportion after the DHA-rich diet feeding. This is consistent with previous studies in rodents and human subjects which reported that despite the relatively small amount of DHA in AT(Reference Andersen, Solvoll and Johansson40–Reference Kopecky, Rossmeisl and Flachs42), they provide high capacity storage for n-3 LC-PUFA(Reference Kopecky, Rossmeisl and Flachs42). It may be noted that the AT containing the highest DHA proportion, the epididymal AT, is the one containing the highest adiponectin level both in mice fed a standard diet and in mice fed a DHA-rich diet. The present results also show that ingestion of DHA had no effect on tissue adiponectin and leptin contents. We also found clear different adiponectin gene expression responsiveness to DHA in the three AT, with adiponectin mRNA expression being stronger in the epididymal AT than in the retroperitoneal and subcutaneous tissues in accordance with previous studies(Reference Flachs, Mohamed-Ali and Horakova16, Reference Neschen, Morino and Rossbacher23, Reference Einstein, Atzmon and Yang43) (data not shown). This suggests that the stimulation of adiponectin gene expression, especially in epididymal AT, leads to increased adiponectin secretion. Conflicting data on the effects of n-3 LC-PUFA on adiponectin gene expression are found in the literature. This may be explained by the composition of the diet, the duration of treatment and the amount of n-3 LC-PUFA in the diet(Reference Bueno, Oyama and de Oliveira44).
The present study has also shown that the DHA-fed mice group had lower weight gain than the control group. This is consistent with previous studies that indicated that ingestion of fish oil or enrichment of the diet with EPA/DHA elicited significant reduction in mice body weight gain(Reference Mori, Kondo and Hase45, Reference Ruzickova, Rossmeisl and Prazak46). Additionally, in human studies, Kunesová et al. (Reference Kunesová, Braunerová and Hlavatý47) showed enhanced weight loss in response to n-3 LC-PUFA in obese women given a very low energetic diet. A previous study has also suggested a reduction of body fat mass after dietary fish oil intake in healthy adults(Reference Couet, Delarue and Ritz48). The effect of DHA on weight body loss may be caused by an increase in FA oxidation and by suppression of lipogenesis in several tissues. n-3 LC-PUFA have indeed been shown to reduce the expression of genes encoding lipogenic enzymes in hepatic cells or liver(Reference Xu, Nakamura and Cho49, Reference Yahagi, Shimano and Hasty50). DHA also down-regulates lipogenic genes in AT(Reference Raclot, Groscolas and Langin51–Reference Takahashi and Ide54). In addition, n-3 LC-PUFA play an important role in the regulation of genes involved in FA oxidation in muscle and liver(Reference Raclot, Groscolas and Langin51, Reference Lapillonne, Clarke and Heird53, Reference Reddy and Mannaerts55, Reference Nakatani, Tsuboyama-Kasaoka and Takahashi56). Interestingly, it was demonstrated that weight loss resulted in increased plasma concentrations of adiponectin(Reference Hotta, Funahashi and Arita13, Reference Yang, Lee and Funahashi57, Reference Bruun, Lihn and Verdich58).
In conclusion, the present results provide evidence to support a role of DHA in reducing weight gain associated with an improvement of the adipokine profile. The present results also show that DHA has beneficial effects on adipokine production as early as 4 d after the initiation of the DHA-rich diet feeding. The present study confirms that dietary intake of DHA may be beneficial for the prevention or treatment of CVD and obesity-associated disease. Few studies have been carried out on n-3 enrichment kinetics. The present results show that DHA enrichment and effects on adipokines are very fast. Furthermore, the beneficial effects of DHA-rich diet on adipokines lasted longer than the diet.
Acknowledgements
The present work was supported by INSERM and a grant from the French Artery and Heart Foundation (http://www.fondacoeur.com). We thank Dr J. P. Bastard for assistance with the cytokine measurements in adipose tissues. All the authors state that there are no conflicts of interest. The contribution of each author is as follows: J. L., A. G. and N. B.-H. performed the experiments; J. L. and N. B.-H. wrote the manuscript; A. G., H. V., M. L. and N. B.-H. designed the study.



