





1 Introduction
A supercontinuum (SC) spanning from the visible to mid-infrared (MIR) regions, characterized by a fully integrated all-fiber architecture and high-power delivery capability, represents a transformative platform for high-performance optical applications across diverse fields. In defense and national security, the unique spectral overlap of the SC with vibrational and rotational molecular resonances enables effective standoff detection of solid targets, including explosive materials and hazardous chemicals[ Reference Kumar, Islam, Terry, Freeman, Chan, Neelakandan and Manzur 1 ]. Similarly, in healthcare, the SC laser offers a versatile tool for diagnostics and therapeutics; for example, its application in atherosclerotic plaque detection provides preferential lipid damage due to its ability to selectively target these components[ Reference Ke, Xia, Isiam, Welsh and Freeman 2 ]. Furthermore, in optical coherence tomography (OCT), the integration of a high-power SC sources significantly enhances system capabilities, including detection sensitivity and axial resolution when used for material sampling and two-dimensional or three-dimensional imaging[ Reference Israelsen, Petersen, Barh, Jain, Jensen, Hannesschläger, Tidemand-Lichtenberg, Pedersen, Podoleanu and Bang 3 ]. This emerging technology promises to revolutionize OCT applications by enabling deeper and more precise structural analyses.
With regard to the aforementioned applications, silica-based microstructure fibers (MOFs)[ Reference Qi, Chen, Li, Liu, Ou, Wang and Hou 4 ] and multimode fibers (MMFs)[ Reference Zhang, Hu, Pan, Wang, Zhang, Guo, Feng, Wang and Zhao 5 ] have been extensively studied for SC generation, and are capable of producing SC spectra spanning from the visible to near-infrared (NIR) regions. However, limited by intrinsic absorption of silica material, the generated spectral long-wavelength edge (LWE) is typically restricted to around 2.4 μm[ Reference Swiderski 6 ]. To overcome this limitation, GeO2 fibers emerge as a promising alternative, offering the potential to extend the SC into the MIR region. This is mainly attributed to the lower phonon energy of GeO2 (~820 cm–1)[ Reference Zou and Izumitani 7 ], which facilitates handling higher wavelengths without significant absorption, as well as its high nonlinear refractive index (~4.97 × 10⁻²⁰ m2/W)[ Reference Yatsenko and Mavritsky 8 ], which enhances SC generation efficiency in the long-wavelength side. In addition, these fibers also exhibit mechanical durability[ Reference Aydin, Maes, Fortin, Bah, Vallée and Bernier 9 ] comparable to silica-based ones, making them suitable for practical applications where environmental stability is essential. Specifically, fibers with GeO2 content exceeding 90% (mole fraction) are classified as GeO2-core fiber (GCF), while those below this threshold are termed GeO2-doped fiber (GDF). Furthermore, in high-power MIR applications, GeO2 fibers have excellent deliquescence resistance, better thermal shock resistance and a higher damage threshold when compared with fluoride fiber[ Reference Wang, Yao, Li, Wu, Yang, Ren and Wang 10 ]. In SC source development, the decisive factors for achieving high-power SC generation predominantly involve the combination of optimized pump sources and suitable fiber materials.
Recent advancements in high-power GeO2 fiber-based SC generation were pumped at common fiber lasing wavelengths, such as 1.55 and 2 μm. Since the pulses in the 2 μm band fall within the anomalous dispersion region of GeO2 fibers, they favor Raman-related soliton effects[ Reference Alexander, Kulkarni, Kumar, Xia, Islam, Terry, Welsh, Ke, Freeman, Neelakandan and Chan 11 ], which dominate the nonlinear dynamics and effectively broaden the spectrum toward longer wavelengths. Until now, three primary pump schemes have been predominantly utilized for these systems: (1) chirped-pulse amplification (CPA) based on a picosecond pulse mode-locked (ML) oscillator with 2 μm operation; (2) a main-oscillator power amplifier (MOPA) using a multi-stage thulium-doped fiber amplifier (TDFA); and (3) high-power noise-like pulse (NLP) systems operating at 2 μm. Significant experimental results are as follows: Yin et al. [ Reference Yin, Zhang, Yang and Hou 12 ] demonstrated a 30.1 W, 1.95–3.0 μm SC in a 1 m-long GCF (100%-GeO2 fiber) in 2018; Wang et al. [ Reference Wang, Yao, Li, Yang, Ren, Wu and Wang 13 ] boosted the power to 33.6 W in a 16 cm-long GDF (64%-GeO2 fiber); Yang et al. [ Reference Yang, Yang, Zhang, Zhu, Zhao, Liu and Hou 14 ] advanced a 2 μm MOPA system, achieving a record-breaking 40 W-level SC with a spectral LWE extending to 3.5 μm and excellent power stability in a GCF (100%-GeO2 fiber). Moreover, in small-core GDF (50%-GeO2 fiber), Wang et al. [ Reference Wang, Gu, Yang, Ouyang, Chen, Zhao, Liu, Guo and Ruan 15 ] utilized a tunable NLP polarization-maintained Tm-doped fiber laser (PM-TDFL) as the pump source, successfully generating a 25.2 W SC with spectral coverage from 1.5 to 3.3 μm in 2024.
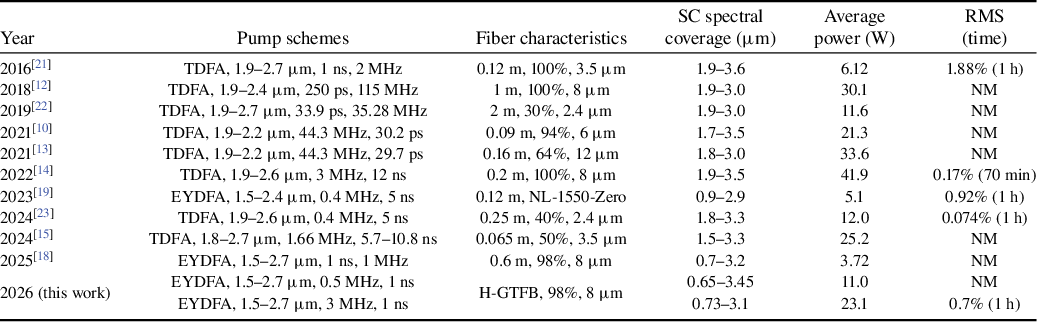
As shown in the aforementioned results, enhancing the spectral coverage toward the NIR and visible regions remains a significant challenge when using a 2 μm pump wavelength. In contrast, lasers operating at 1.55 μm wavelengths are more favorable for spectral SC extension due to their closeness to the zero-dispersion wavelength (ZDW) of GeO2 fibers[ Reference Dudley, Genty and Coen 16 ]. To date, several watt-level GeO2 fiber-based broadband SC sources have been reported using erbium-ytterbium co-doped fiber amplifier (EYDFA) systems pumped at 1.55 μm. For example, Jain et al. [ Reference Jain, Sidharthan, Moselund, Yoo, Ho and Bang 17 ] demonstrated a watt-level SC source covering the spectral range of 0.7–3.2 μm over a 0.9 m-long GDF (74%-GeO2 fiber) in 2016. More recently, our group achieved a flat SC with a power output of 3.72 W across the same wavelength range (0.7–3.2 μm) using a 0.6 m-long GCF (98%-GeO2 fiber)[ Reference Xia, Yu, Yang, Zhang, Wang, Huang, Xu, Dai and Nie 18 ]. Despite these advancements, obtaining GeO2 fiber that meets the required optical specifications remains challenging and costly. To address these challenges and reduce costs while improving average power output, Lei et al. [ Reference Lei, Xie, Wang, Wang, Luo and Li 19 ] utilized domestic highly nonlinear fiber (HNLF, NL-1550-Zero type, YOFC) to achieve a 5 W-level SC spanning 0.92–2.92 μm in 2023. In addition, Wang et al. [ Reference Wang, Niu, Lei, Zhao, Li, Li and Liu 20 ] used an NLP laser with rectangular-shaped pulses as the pump, obtained an SC ranging from 0.91 to 2.92 μm and achieved an average power of 2.08 W in HNLF (NL-1550-Zero type, YOFC). To better understand the research progress in GeO2 fiber-based SC generation pumped by fiber lasers, Table 1 summarizes the reported works. These results collectively suggest that SC output with a power exceeding 20 W in a single GeO2 fiber has become quite common, but achieving simultaneous output with a spectral range covering the visible to MIR regions remains a challenge through current pump-based mechanisms in GeO2 fibers. This is mainly due to the limited peak power tolerance of the single GCF, which restricts spectral broadening[ Reference Luo, Ma, Dong, Wang, Yan, Wang, Ruan and Guo 24 ]. In addition, no relevant long-term power stability characteristics have been demonstrated for these high-power SCs.
The progress of GeO2 fiber-based SC sources pumped by a fiber laser a .

a TDFA, thulium-doped fiber amplifier; EYDFA, erbium-ytterbium co-doped fiber amplifier; H-GTFB, high-power GeO2 tapered fiber bundle; RMS, root mean square; NM, not mentioned.
To address these challenges, we introduced a multi-fiber pumping mechanism, which significantly enhances the scalability of average power output and enables versatile output spectrum synthesis across diverse pump sources[ Reference Xia, Yu, Yang, Zhang, Wang, Huang, Xu, Dai and Nie 18 ]. Leveraging this scheme, we developed a novel high-power GCF-based tapered fiber bundle (H-GTFB), based on three-channel GCF combining. Furthermore, by integrating a multi-channel EYDFA system with the H-GTFB, we successfully achieved a 20-W-level broadband SC generation spanning from 0.73 to 3.1 μm. This advancement represents significant progress in producing high-power, wide-spectrum emissions using EYDFA-pumped GCF. The integration of precise temperature control across the seed, pump and all-fiber integrated systems ensured stable operation and laser output. Furthermore, our results demonstrate minimal power fluctuations with a root mean square (RMS) value of 0.7% at an average power level of 23.1 W during continuous operation for 1 hour, highlighting the system’s reliability and consistency. This achievement highlights the potential of the advanced systems in high-power SC generation across a broad spectral range in GeO2 fibers.
2 Experimental setup
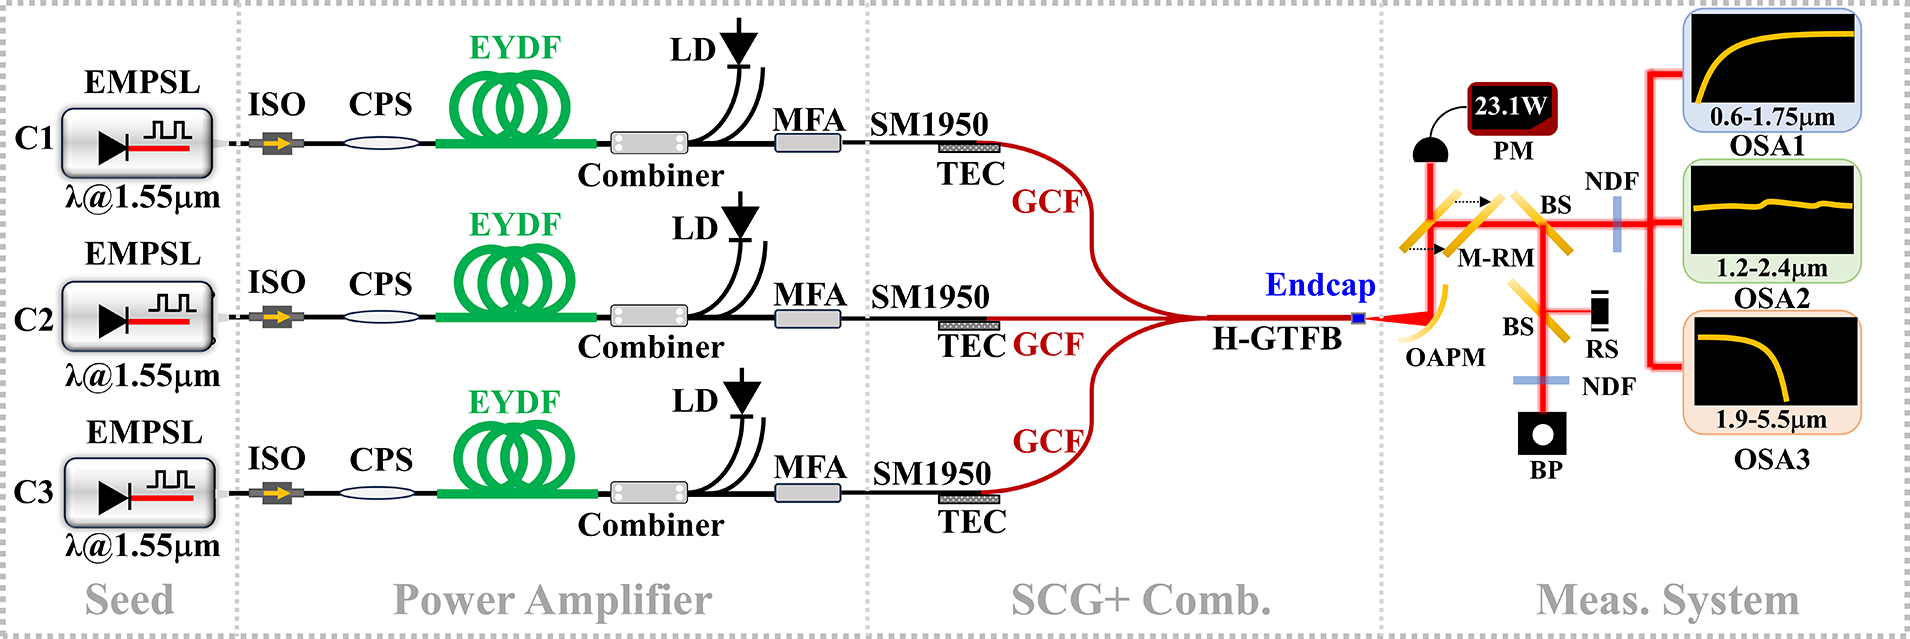
The experimental configuration for broadband SC generation is illustrated in Figure 1. The system architecture comprises a three-channel SC source, a home-made SC beam combiner and an SC optical parameter characterization platform. Each channel is independently formed by integrating a pulsed seed laser at 1.55 μm, an EYDFA and a piece of GCF. The seed laser system utilizes a watt-level commercial electrically modulated pulsed semiconductor laser (EMPSL, Connet) operating at 1.55 μm wavelength with adjustable repetition rates of 0.5–3 MHz and fixed pulse durations of 1 ns. The 1.55 μm signal continues to be amplified in an EYDFA, which contains a 27 W multimode fiber pigtailed laser diode (MM-LD) at 976 nm, a (2 + 1) × 1 combiner, a 2.5 m-long EYDF (IXF-2CF-EY-O-12-130, iXblue) and a cladding pump stripper (CPS). In the experiment, an isolator (ISO) is adopted to prevent a backward amplified signal in the system. For SC generation, 0.5 m-long GCF (98%-GeO2 fiber, GDF-MM-8/125-98, Forc-Photonics) is employed for nonlinear spectral broadening. Its detailed parameters will be given in the following sections. To ensure efficient light coupling between the EYDFA and the GCF, a mode field adaptor (MFA) with an output pigtail of SM1950 fiber is positioned between them. The splicing loss between the SM1950 fiber and GCF is approximately as low as 0.62 dB, and the fusion splicing point between the SM1950 and GCF was placed on the temperature-feedback controlled thermoelectric cooler (TEC) for heat dissipation in laser operation. To further enhance the SC power, the three-channel SC power is combined into a single beam through the H-GTFB. In addition, the large mode area (LMA)-AlF3 fiber (AMF-440/480-N-0.22, Fiberlabs) was fused at the end facet of the H-GTFB, featuring core/cladding diameters of 440/480 μm and a core numerical aperture (NA) of 0.22. This configuration effectively reduces power density under high-power conditions, with the end facet of the LMA-AlF3 endcap being angle cleaved to nearly 8° to minimize Fresnel reflection.
The experimental setup for high-power SC generation. C1–C3, channels 1–3; EMPSL, electrically modulated pulsed semiconductor laser; ISO, isolator; CPS, cladding pumping stripper; EYDF, erbium-ytterbium co-doped fiber; LD, laser diode; MFA, mode-field adapter; TEC, thermoelectric cooler; GCF, GeO2-core fiber; H-GTFB, high-power GCF-based tapered fiber bundle; OAPM, off-axis parabolic mirror; M-RM, movable reflection mirror; PM, power meter; BS, beam splitter; RS, residual signal; BP, beam profiler; NDF, neutral density filter; OSA, optical spectrum analyzer; SCG, SC generation; Comb., combination; Meas., measurement.

For SC characterization, the output light was collimated using a broadband off-axis parabolic mirror (OAPM, MPD229-P01, Thorlabs), with a movable reflection mirror (M-RM) arranged for facilitating simultaneous power monitoring, spectral measurement and beam analysis. To enable detailed SC beam profile characterization, a 50/50 beam splitter (BS) was employed to split the light into two identical replicas. The transmitted portion of the beam was used for the spectral measurement, while the reflected portion was employed for beam quality analysis. To ensure protection of critical measurement equipment such as the optical spectrum analyzer (OSA) and beam profiler (BP), two neutral density filters (NDFs) were strategically placed in the system to attenuate incident power entering the measurement setups. This arrangement effectively minimizes potential damage or signal degradation to the instruments, ensuring reliable data acquisition.
In the experiment, the SC spectra were comprehensively measured using three spectrometers (OSA1, AQ6317B; OSA2, AQ6375; OSA3, AQ6377; Yokogawa), with each spectrometer covering a distinct spectral range. The integration of optical fibers was achieved through fusion splicers; a single-mode fiber (SMF) fusion splicer (62C, Fujikura) and a double-cladding fiber (DCF) fusion splicer (FSM-100P, Fujikura) were employed. An advanced BP (ARTCAM-991SWIR, Artray) was utilized to assess the spatial energy distribution of the SC beam. The output power was measured using a thermal power sensor (S425-L, Thorlabs) and a precision power meter (PM100D, Thorlabs), ensuring accurate and reliable data acquisition.
3 Results and discussion
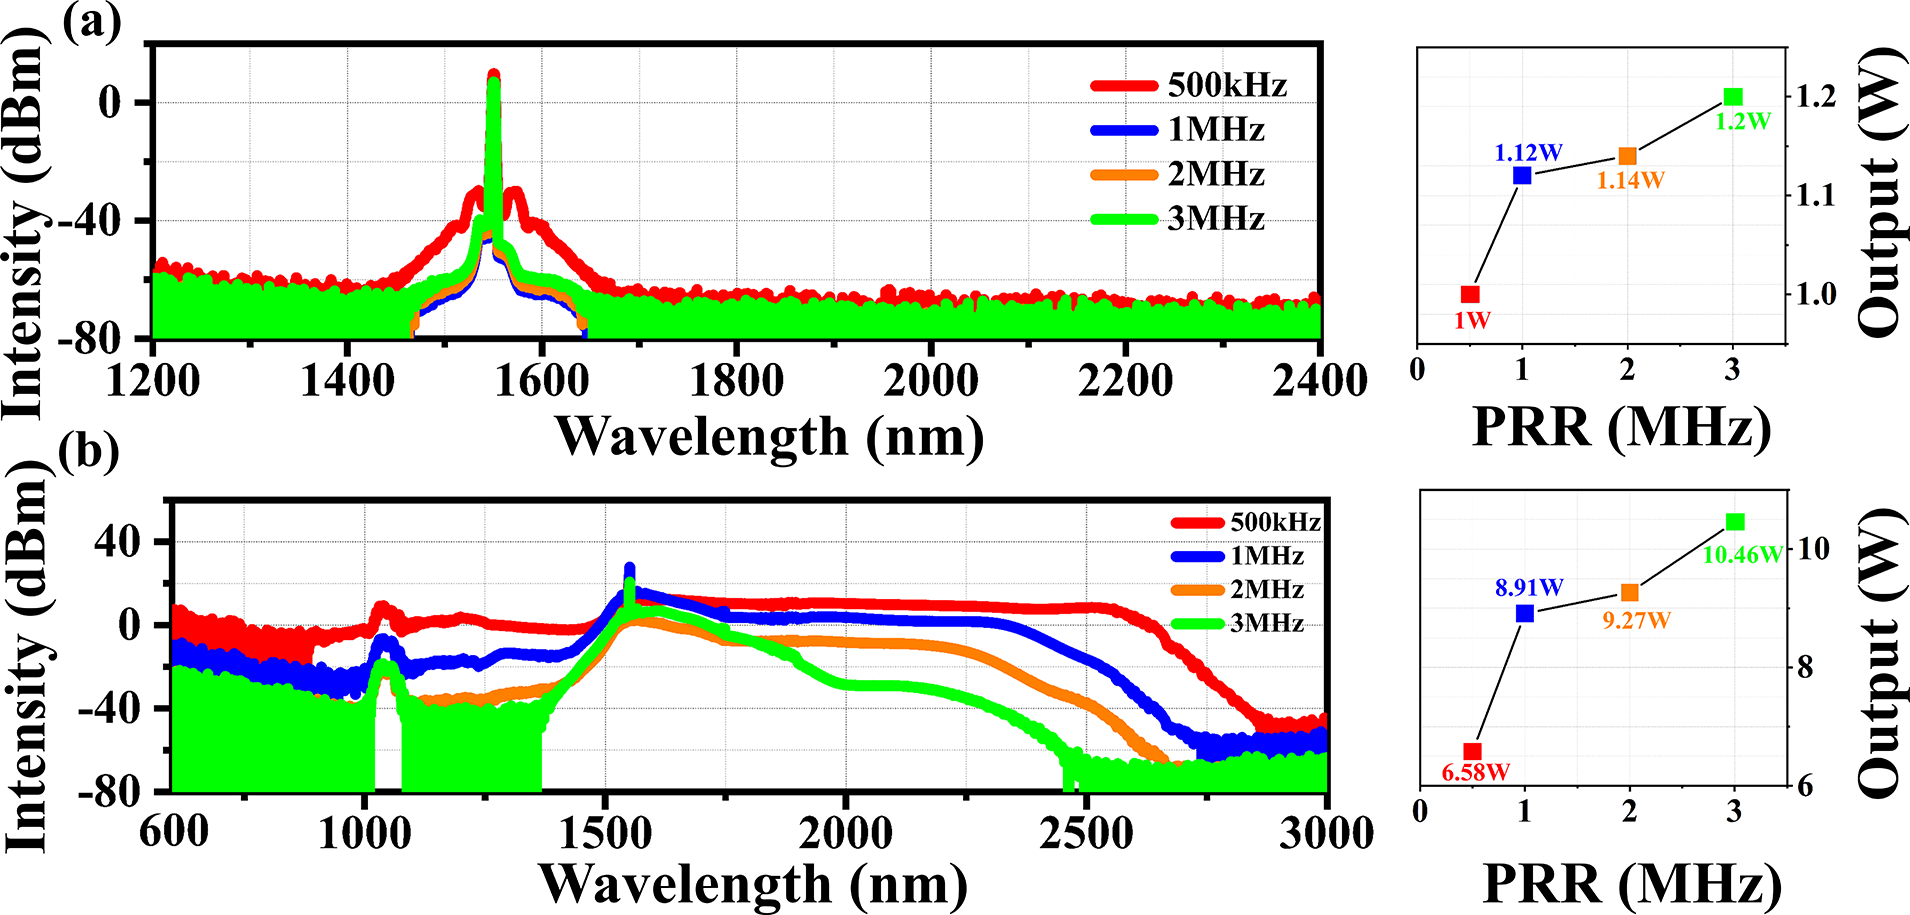
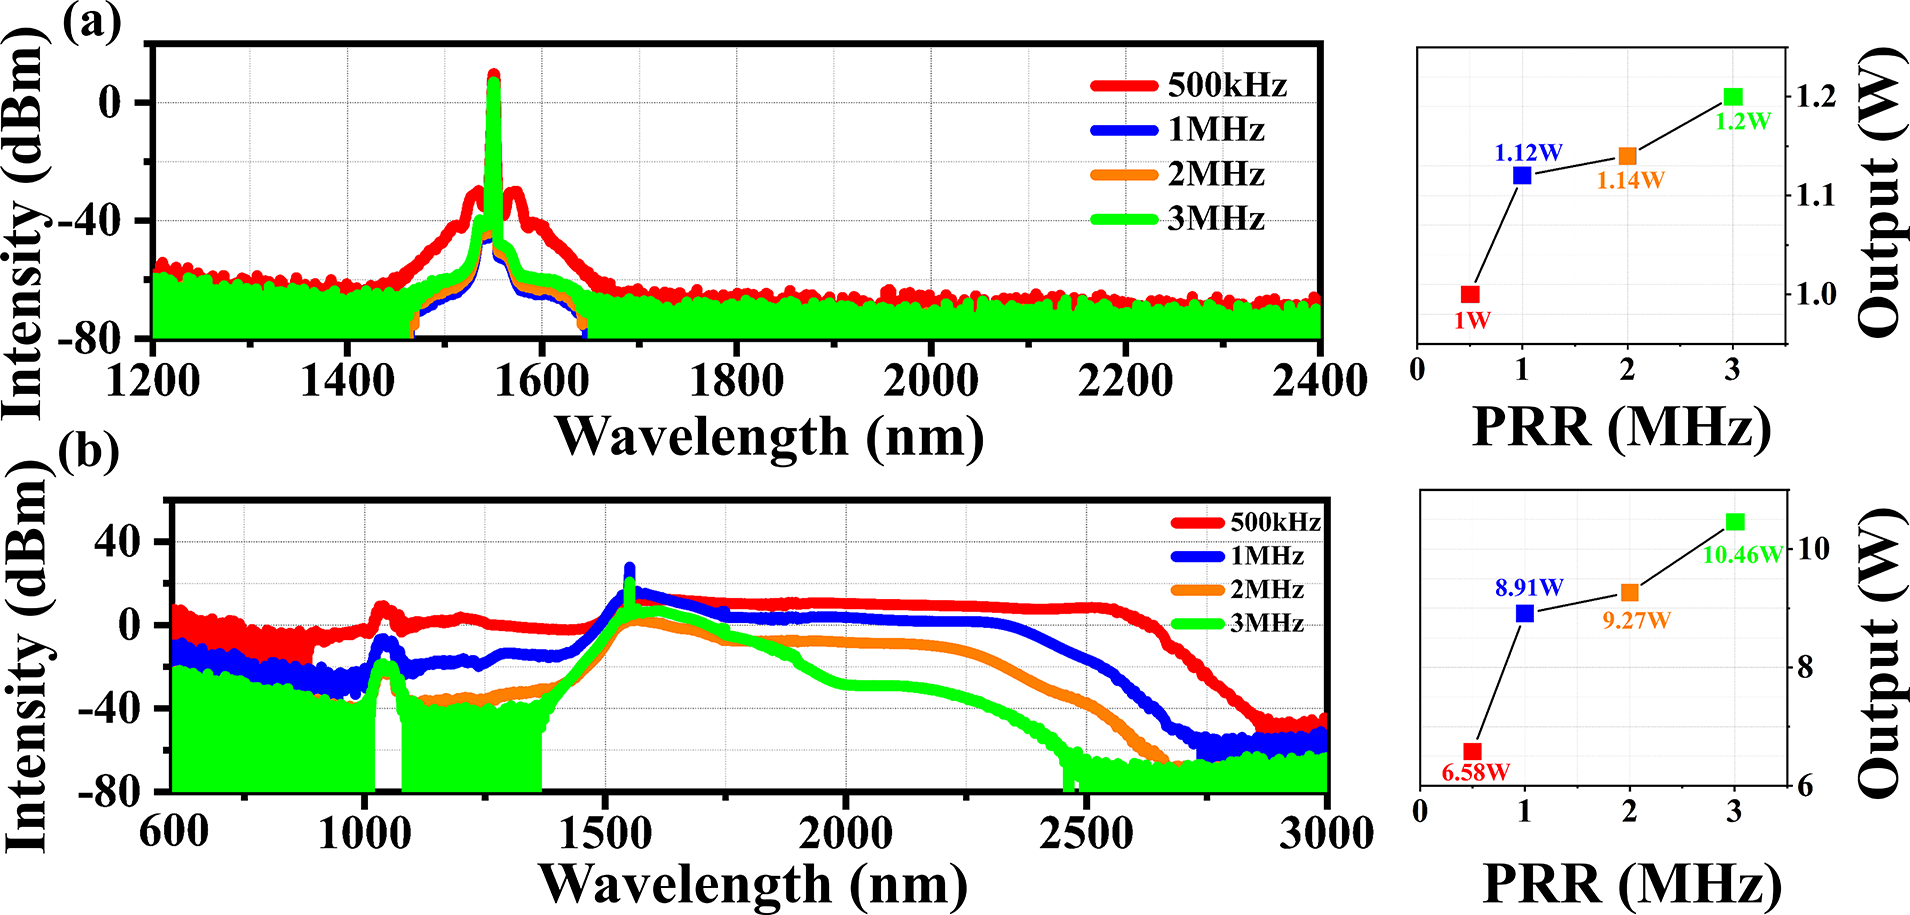
In each channel, the EMPSL is responsible for generating 1.55 μm pulses with 1 ns fixed duration and tunable repetition rates; the spectrum and power evolution are shown in Figure 2(a). The seed pulses subsequently propagate through the EYDFA system, where they experience spectral broadening and power amplification, as shown in Figure 2(b). This results in an SC with an average power of 6.58 W over a spectral range of 0.89–2.87 μm at a repetition rate of 500 kHz. The obtained SC provides an excellent pump capability for further efficient spectral broadening within the GCF system.
Spectral evolution of the pulses varies with power at different pulse repetition rates for (a) EMPSL and (b) EYDFA systems.
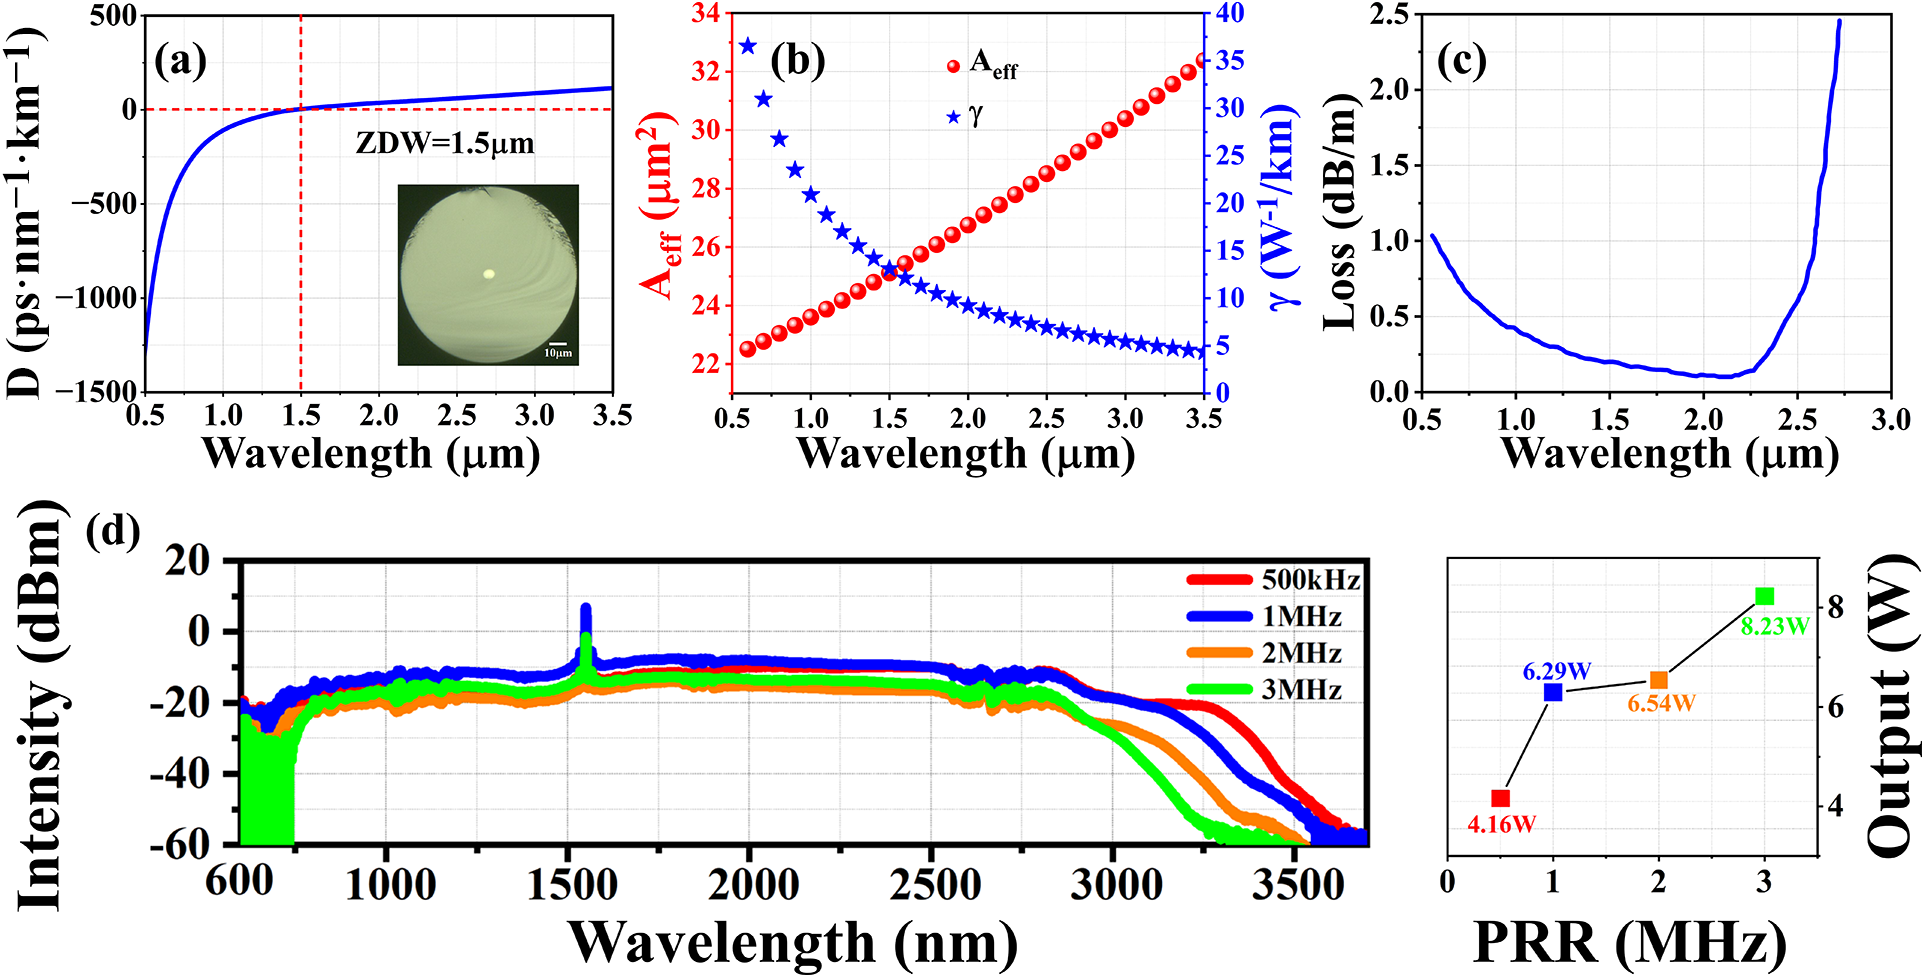
The core of GCF contains 98% (mole fraction) of GeO2, featuring an elliptical core with dimensions of 8 μm × 7 μm. Calculations reveal the dispersion curve (Figure 3(a)) for the fundamental LP01 mode, showing a ZDW at approximately 1.5 μm, accompanied by a microscope image of the cross-section in the inset. The simulated effective area (A eff) was found to be 25.3 μm2 at 1.55 μm, corresponding to the nonlinear coefficient (γ) of 12.6 W–1/km at 1.55 μm, as shown in Figure 3(b). Figure 3(c) presents the confinement loss distribution, indicating low losses in the visible region and a significant loss value of around 2.45 dB/m at 2.72 μm.
The optical properties of the GCF. (a) The calculated dispersion curve for the fundamental LP01 mode. Inset: microscope image of the GCF end facet. (b) The simulated effective area (A eff) and nonlinear coefficient (γ) curves. (c) Fiber loss. (d) Pulse spectral evolution and power variation with different pulse repetition rates in a single GCF.

To explore the performance of GCF pumped by the EYDFA system with different repetition rates, direct pumping of the GCF with an ultra-broadband pump spectrum was conducted. Figure 3(d) shows the spectral evolution with varying repetition rates in a single GCF, where the SC bandwidth gradually narrows as the pulse repetition rate increases. When the pulse repetition rate of laser is set to 500 kHz, the observed spectral expansion benefits from the ultra-broadband pump spectrum, which excites both normal and anomalous dispersion regions of the GCF, thereby enhancing nonlinear effects. The red-shifted portion of the spectrum can be attributed to a combination of modulation instability (MI) and soliton self-frequency shift (SSFS). The self-phase modulation (SPM)-induced spectral shortening contributes primarily to the short-wavelength side expansion[ Reference Dudley, Genty and Coen 16 , Reference Chenan, Kumar, Ming-Yuan, Kulkarni, Islam, Galvanauskas, Terry, Freeman, Nolan and Wood 25 ]. At a maximum average power of 4.16 W, the spectrum was broadened to cover 0.65–3.62 μm. As the pump repetition rate increases, the spectral broadening on the short-wavelength side is less affected, while the broadening on the LWE shows a strong decreasing trend. Therefore, the spectral coverage is reduced to 0.73–3.25 μm when pumped at 3 MHz, while the average power is surged to 8.23 W. Notably, the pump residue peak at 1.55 μm partially persisted and remained unchanged in the entire measured process. The spectral drop around 2.7 μm is mainly attributed to water vapor absorption due to the long propagation distance in the measurement setup[ Reference Gebhardt, Gaida, Stutzki, Hädrich, Jauregui, Limpert and Tünnermann 26 ].
In Figure 3(d), we present the generated ultra-broadband SC spanning from the visible to MIR regions in a single GCF. Despite this capability, the maximum average power remains limited to 8 W, imposing constraints on practical applications requiring higher power output. To overcome these limitations and achieve higher power output, an H-GTFB with an optimized combiner design is proposed. Specifically, compared with our previous work[ Reference Xia, Yu, Yang, Zhang, Wang, Huang, Xu, Dai and Nie 18 ], we abandoned the MMF and the number of input ports of the H-GTFB has been reduced from seven to three. These measures eliminate the efficiency differences among the three GCFs caused by different environments.
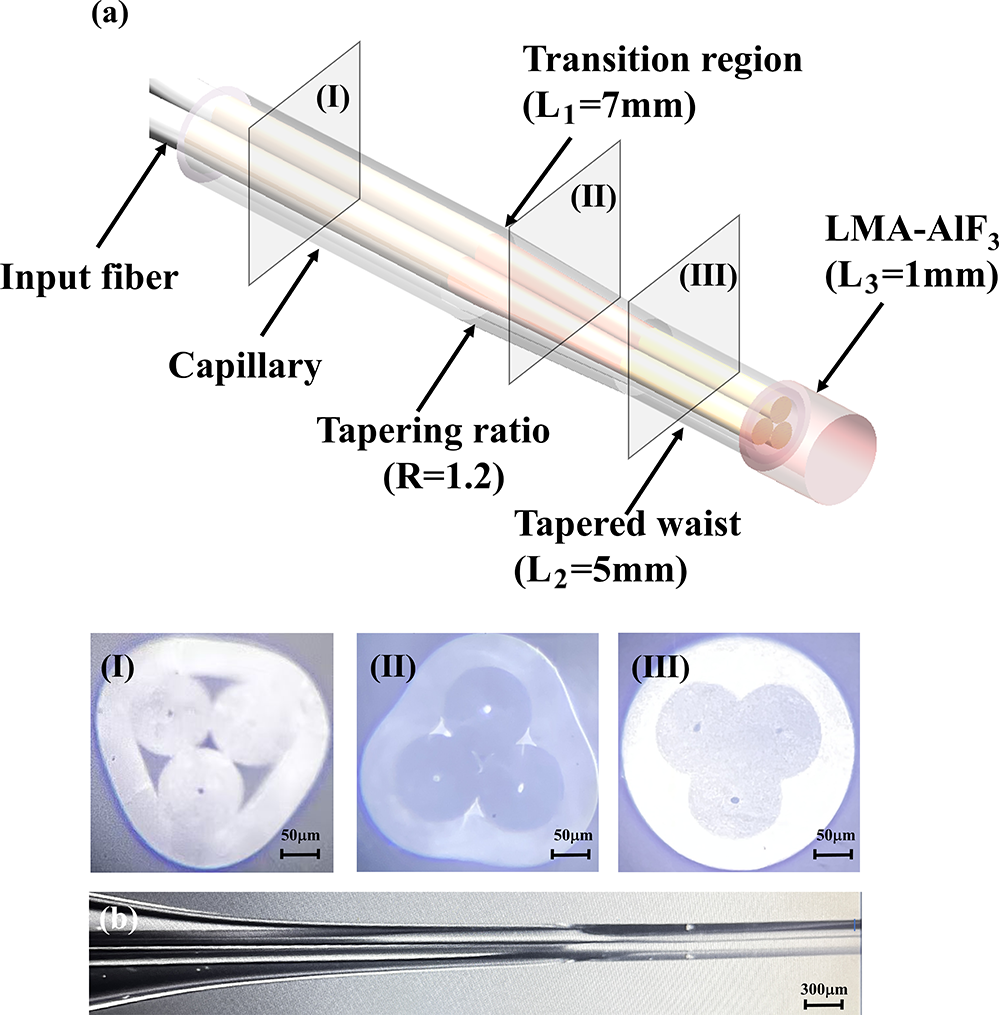
The fabrication process of the 3×1 H-GTFB comprises three critical steps. First, an arrayed GCF bundle is inserted into a low refractive index capillary followed by tapered processing. Second, the end facet of the H-GTFB undergoes flattened cutting and polishing for the following endcap fusion splicing operation. Third, the H-GTFB is integrated with an LMA-AlF3 endcap for high-power manipulation. The designed layout of the H-GTFB is illustrated in Figure 4(a), with key dimensions including a transition region length of 7 mm (L 1 = 7 mm), a tapering ratio (the ratio of the fiber diameter before tapering to that after tapering) of 1.2 (R = 1.2), a tapered waist length of 5 mm (L 2 = 5 mm), a fiber core diameter of the tapered waist of approximately 6.7 μm and an LMA-AlF3 endcap length of 1 mm (L 3 = 1 mm). Cross-sectional views are provided in panels (I)–(III) of Figure 4(a), which display the original fiber bundle, an arbitrary section within the transition region and the final end facet of the H-GTFB, respectively. In addition, Figure 4(b) presents an optical micrograph of the transition region and tapered waist, demonstrating the precision of the manufacturing process.
Detailed design of the 3×1 H-GTFB. (a) Overall structure: (I) the fabricated cross-section of the original bundle; (II) an arbitrary location in the transition region; (III) end facet geometry and surface quality of the tapered bundle. (b) Optical micrograph of the transition region and tapered waist.

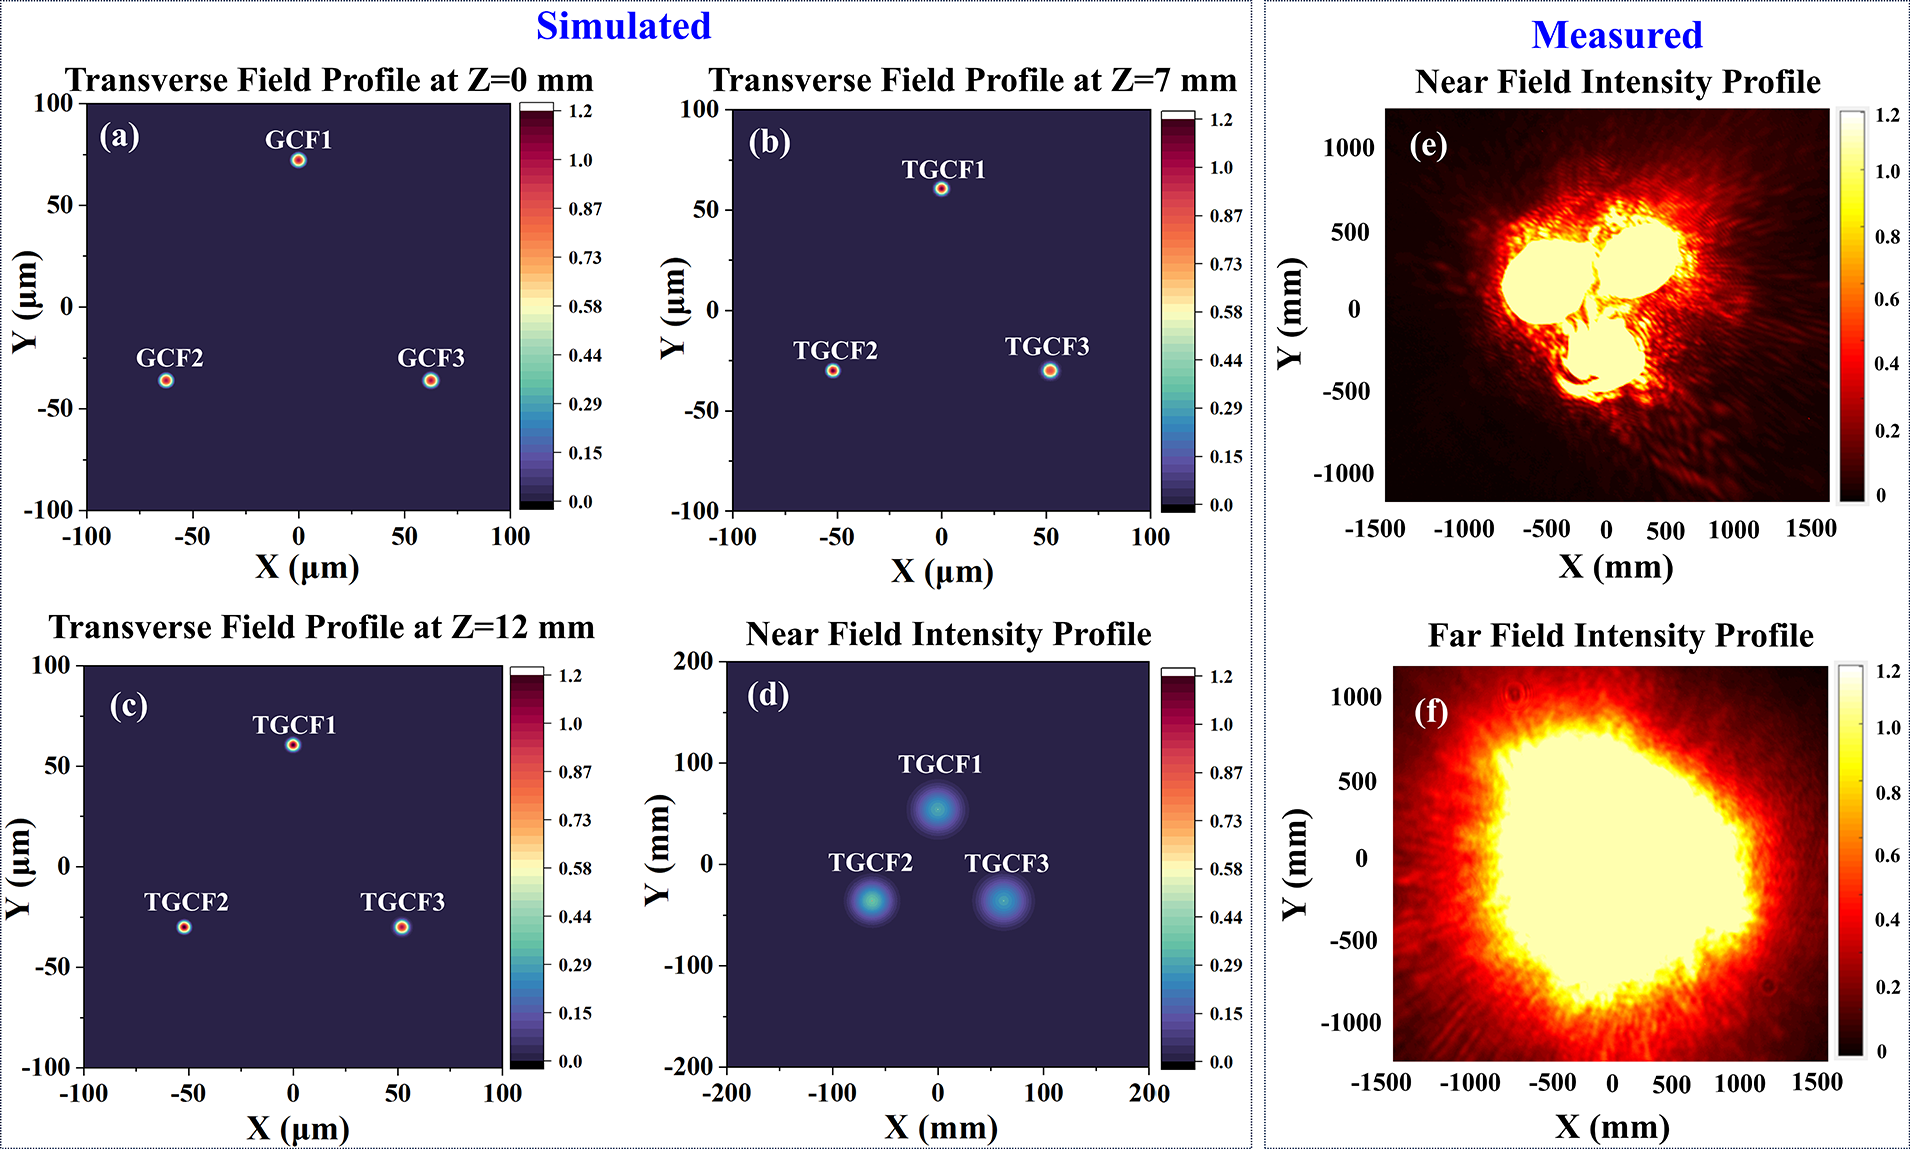
To estimate the pulse propagation and mode field distribution within the 3×1 H-GTFB, the beam propagation method (BPM) was employed for numerical simulation. In calculation, the transverse and longitudinal step sizes in the simulation setup were set to 0.3 and 0.5 μm, respectively. The core-cladding refractive indices of the GCF (provided by the fiber supplier), the tapering ratio, the length of the transition region and the tapered waist dimensions of the H-GTFB were precisely defined according to our measured results. The input beam comprises three fundamental modes with wavelengths λ1 = 1.55 μm, λ2 = 2 μm and λ3= 3 μm, each initialized into the GCF1, GCF2 and GCF3 channels, respectively, with equal power ratios. The simulated field intensity profiles at various longitudinal positions were analyzed and are presented in Figures 5(a)–5(d), encompassing the input fiber, transition region, end facet of the fiber bundle and near-field intensity distribution. As shown in Figure 5(a), at the receiving facet, the core-to-core distance of each input fiber is approximately 121 μm. Numerical results reveal that as the three beam fields propagate through the transition region, the core-to-core distances between the tapered GCFs (TGCFs) decrease to approximately 113 μm, as demonstrated in Figure 5(b). Within the tapered waist region, the beam profile exhibits a similar distribution to that observed in the transition region (as shown in Figure 5(c)). At the output port, the emission characteristics from the H-GTFB indicate that the near-field beam propagates with divergence after 10 cm propagation due to the ultra-high NA of the GCF, as simulated in Figure 5(d). To verify the reliability of the simulation, we measured the near-field profile of H-GTFB and employ two BSs and an NDF for power attenuation to protect the BP from damage under high-power conditions. Then the attenuated signal entered the BP at a certain angle; the captured beam profile is provided in Figure 5(e), showing that three channel beams with high intensity are clearly manifested. This is consistent with the simulation results in the Figure 5(d). Figure 5(f) presents the far-field beam of the H-GTFB, in which it can be seen that three channels’ distinct beams have merged into a single one.
Simulated transverse field intensity profiles at three key positions of the H-GTFB are presented: (a) at the receiving facet; (b) at the cross-section in the transition region; (c) at the output facet. A comparison between the simulated near-field beam profile (d) and the measured near-field beam profile (e), as well as the corresponding far-field beam profile (f), is included to validate the simulation accuracy against experimental results.

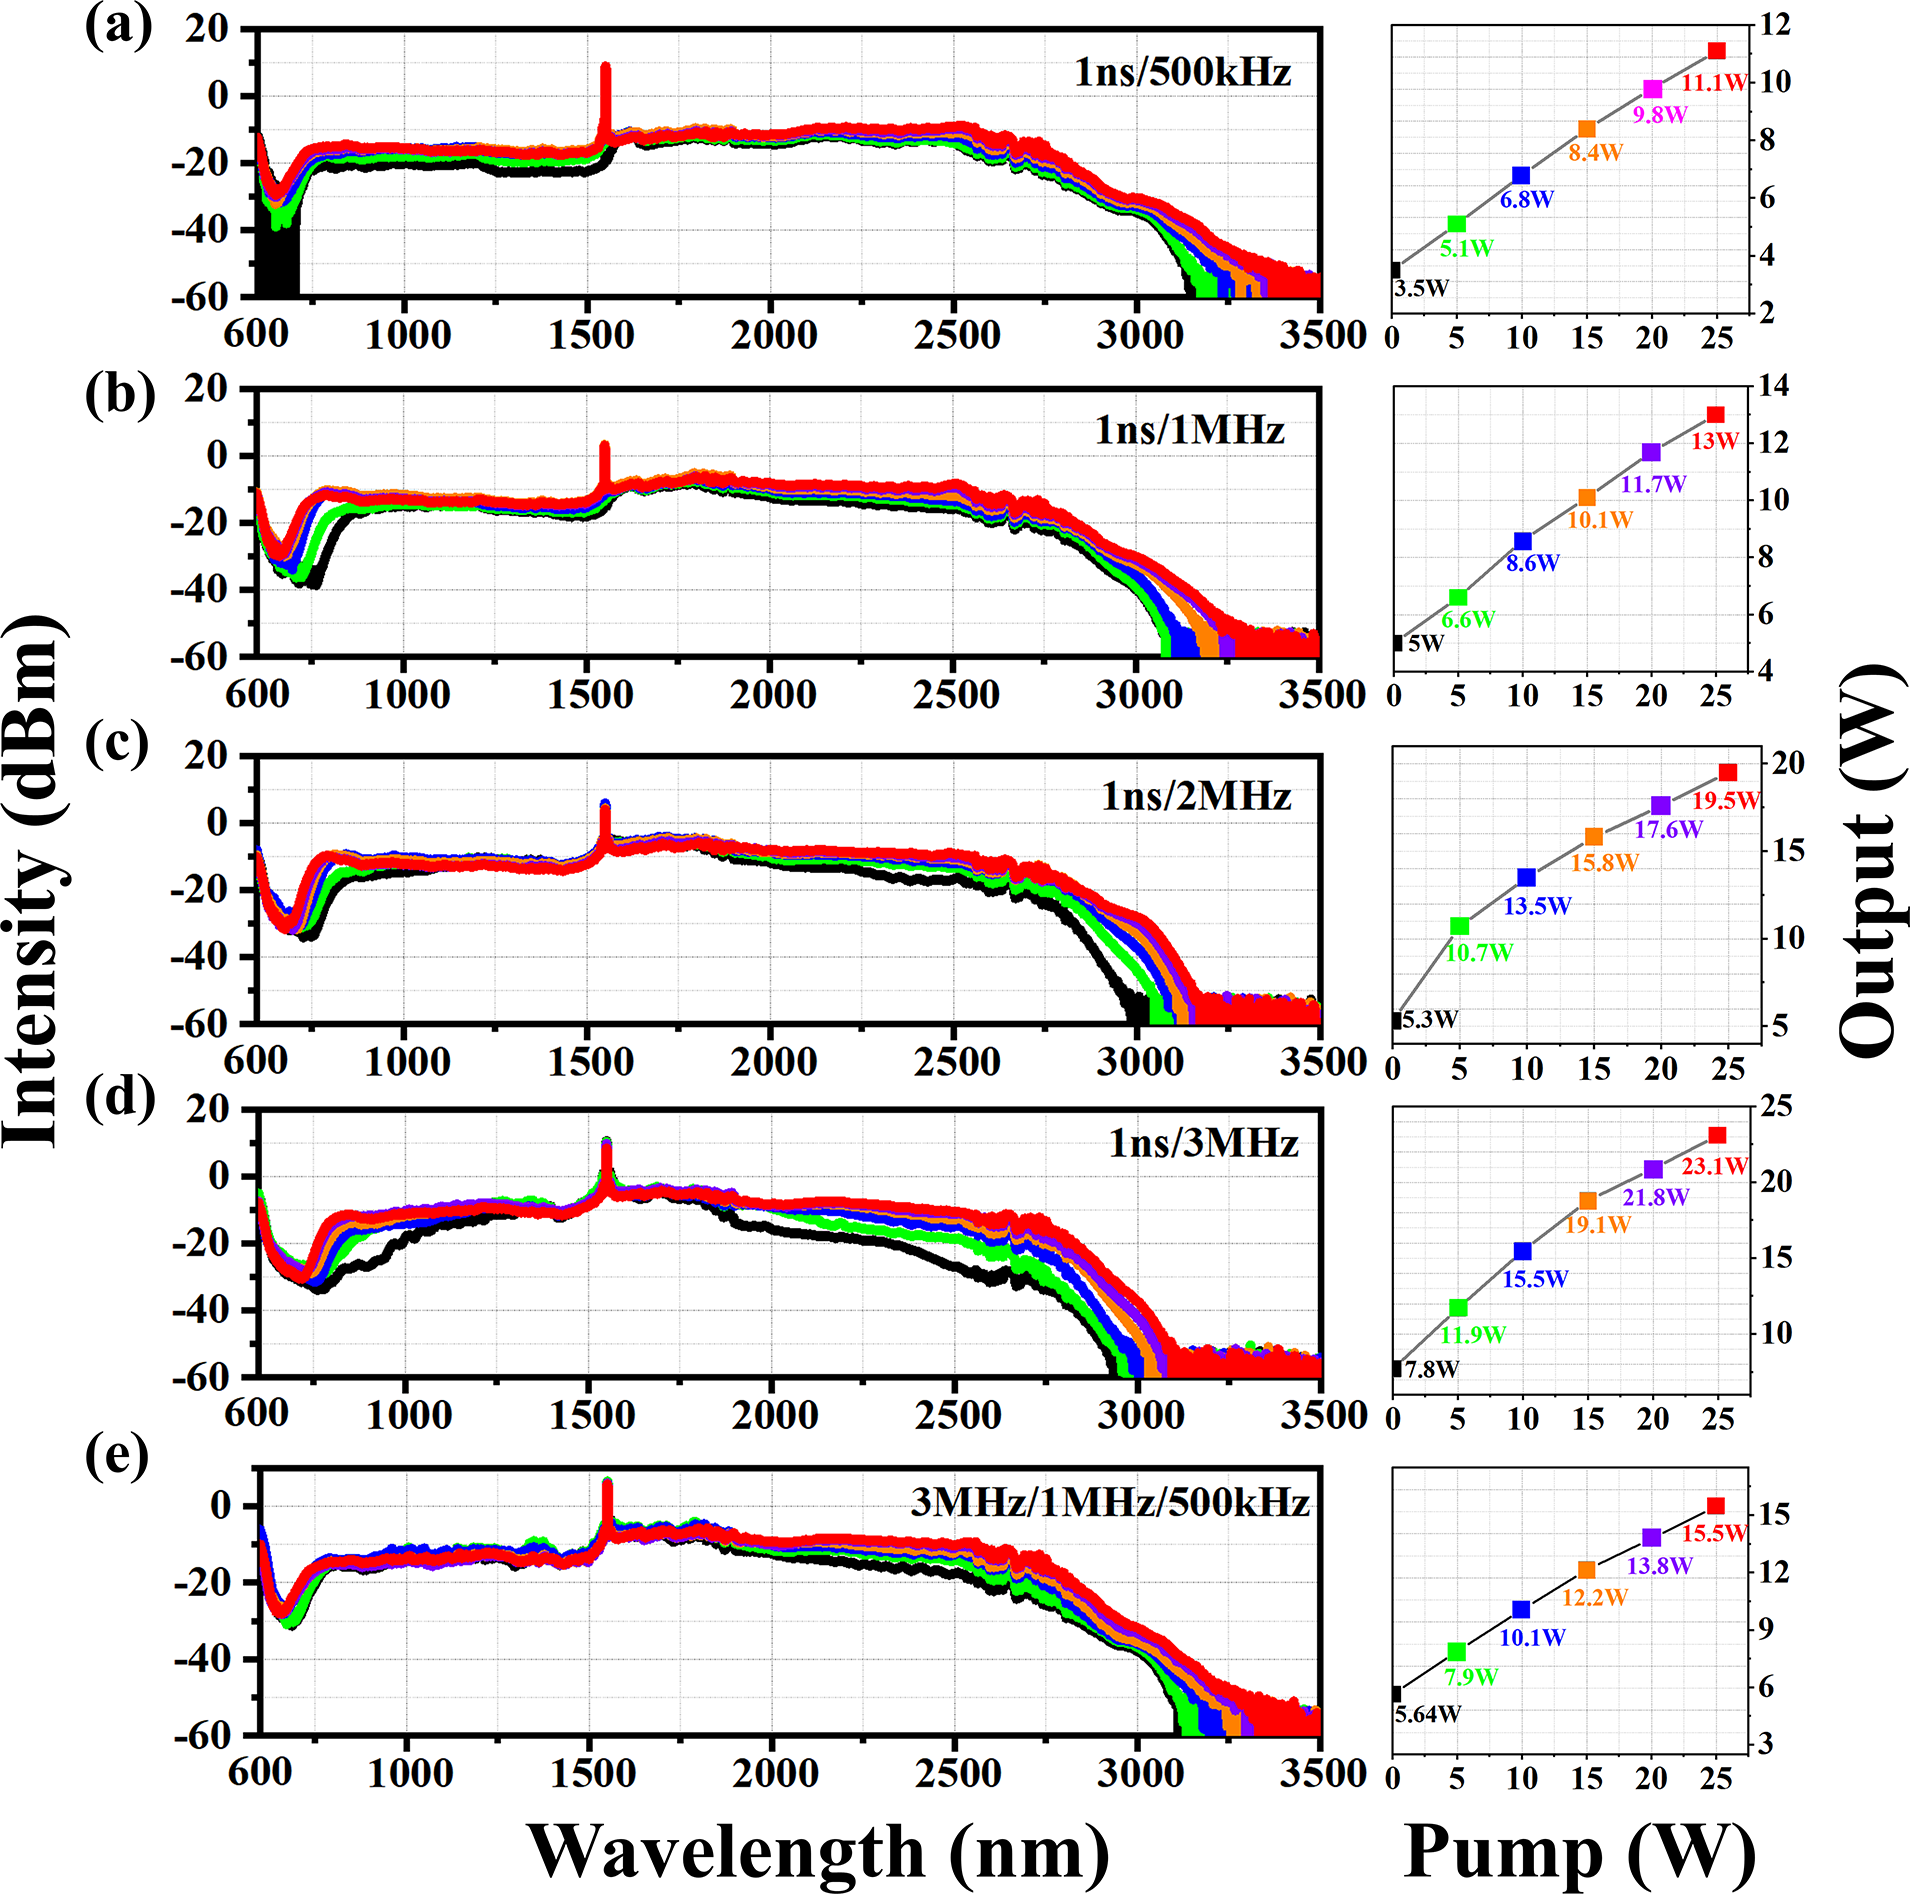
Figure 6 shows the spectral evolution of the H-GTFB under various incident power and repetition rate conditions, revealing significant impacts on signal characteristics and system performance. The spectral variation in the H-GTFB at the repetition rate of 500 kHz is a result of the increased pump power of channels 1–3. The spectra gradually broaden in the pigtail of the H-GTFB, as shown in left-hand graph of Figure 6(a). The spectral LWE of the H-GTFB extends to 3.45 μm and the spectral short-wavelength edge (SWE) reaches 0.65 μm. The right-hand graph of Figure 6(a) displays the power evolution, showing a linear increasing trend, and the corresponding SC maximum output power can reach up to 11.1 W. We observe that the H-GTFB spectrum is narrower than that of the single GCF in Figure 3(d). The spectral narrowing, as analyzable from Figure 4(a), is likely caused by minor core deformation observed in the waist region of all three GCFs, which leads to long-wavelength signal leakage from the fiber cores. Figure 6(b) shows the spectral evolution in the H-GTFB at the repetition rate of 1 MHz; the maximum SC average power can be scaled up to 13 W, accompanied by the spectral LWE increasing to 3.25 μm. Similar to the case of 500 kHz, the spectral LWE after beam combining also undergoes a reduction, while the spectral SWE remains unchanged. Figure 6(c) shows the spectral evolution at the repetition rate of 2 MHz; the SC power from H-GTFB surges to 19.5 W and the spectral LWE continues to undergo minor shrinking to 3.15 μm. Figure 6(d) depicts the spectral evolution when pumped at 3 MHz, where the SC power exceeds 20 W. The spectral LWE also dropped to 3.1 μm due to declined peak power, thus weakening the spectral broadening and intensity in the MIR region. Based on the aforementioned results for different repetition rates, the experimental results reveal significant variations of the SC performance with different repetition rates. Specifically, operating at 3 MHz yielded the highest output power and the narrowest spectrum, while a lower pulse repetition rate (500 kHz) resulted in wider spectra with reduced output power. A middle frequency of 1 MHz provided an optimal balance between these two opposing characteristics. Based on these observations, we selected 3 MHz for channel 1 to maximize output power, 1 MHz for channel 2 to achieve a balanced performance and 500 kHz for channel 3 to maximize spectrum width. As shown in Figure 6(e), the SC spectrum spans 0.65–3.4 μm, while obtaining higher output power at 15.5 W.
The spectral and power evolution of the H-GTFB with different repetition rates: (a) C1–C3: 500 kHz; (b) C1–C3: 1 MHz; (c) C1–C3: 2 MHz; (d) C1–C3: 3 MHz; (e) C1–C3: 3 MHz/1 MHz/500 kHz.

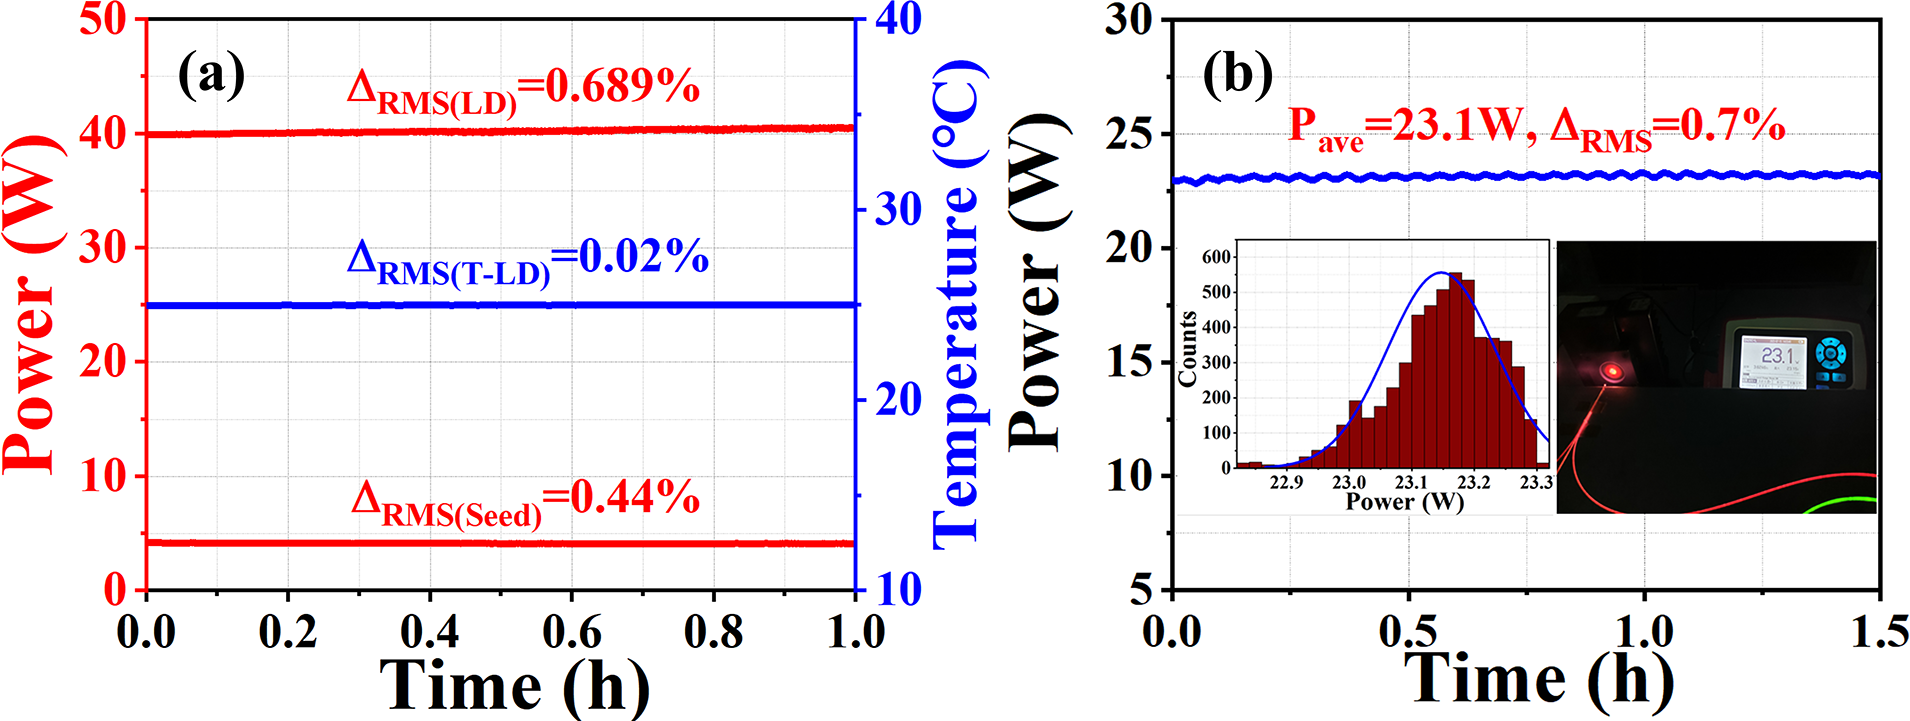
To optimize the power stability of the SC laser, we employed a temperature-feedback controlled TEC to precisely manage the excessive heat from the seed and laser diode (LD). The seed and LD with temperature control can work with a stable state . Figure 7(a) demonstrates the power stability of the seed source and LD, and temperature stability of the LD; the calculated power fluctuation RMS values of the seed and LD are 0.44% and 0.689% (red solid line) and the RMS of temperature is 0.02% (blue solid line). By taking the above-mentioned optimal measures, the broadband SC laser stability was dramatically improved; the average RMS value for power was calculated as 0.7% at an average power of 23.1 W, as shown in Figure 7(b). The inset of Figure 7(b) depicts the measured power counting distribution in 1 hour, which is in line with the normal distribution law. A picture of the power meter is also shown when the SC power is scaled up to 23.1 W.
(a) Power stability of the seed and LD (red line) and temperature stability of the LD (blue line). (b) Power stability of the SC laser in 1.5 hours at an average power of 23.1 W; left-hand inset: histogram of the power; right-hand inset: picture of the power meter at the output power of 23.1 W.

4 Conclusion
In summary, we demonstrated a high-power SC spanning from the visible to MIR regions, achieved through incoherent beam combination in GCF bundles pumped by 1.55 μm high-power pulses. Our experimental setup employs a 3×1 H-GTFB, from which we obtained an ultra-broadband SC spectrum with a maximum average output power of 23.1 W and a spectral bandwidth covering 0.73–3.1 μm, representing the highest reported output for GCF pumped at 1.55 μm.
Despite these impressive results, several challenges remain. First, the input laser beam quality is relatively low, leading to significant angular divergence and compromising collimation efficiency. Second, the transmission loss within the H-GTFB structure significantly impacts heat accumulation under short-time operation, necessitating further optimization of material selection and structural design. Third, limitations in long-wavelength attenuation result in a narrowing of effective spectral coverage.
To address these limitations, we are currently refining our approach to H-GTFB fabrication by optimizing structural parameters, enhancing fabrication precision control and improving manufacturing processes. These efforts aim to achieve SC powers exceeding 50 W while maintaining superior optical output characteristics across the entire spectrum range.
Acknowledgements
This work was supported by the National Natural Science Foundation of China (Grant Nos. 62090065, 62205015 and 62275015), the Natural Science Foundation of Ningbo (Grant No. 2022J078) and the Technology Innovation Center of Infrared Remote Sensing Metrology Technology, State Administration for Market Regulation (Grant No. AKYKF2425).

 Open access

