






Introduction
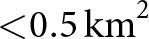
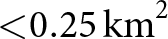
Glacierets, defined as small glaciers with a surface area smaller than 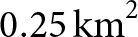 $0.25\,\mathrm{km}^2$ (Cogley and others, Reference Cogley2011), can be found in each mountain region globally. Small glaciers (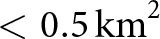 $ \lt 0.5\,\mathrm{km}^2$) are considered as good visible indicators for anthropogenic climate change’s impacts on the cryosphere (Huss and Fischer, Reference Huss and Fischer2016), mainly due to the intense area loss of glacierets which can lead to their extinction (Van Tricht and others, Reference Van Tricht2026), as has been documented in the Caucasus, Pyrenees, Swiss Alps, the southern Andes and the low-mid latitude regions (Fischer and others, Reference Fischer, Huss, Barboux and Hoelzle2014; Masiokas and others, Reference Masiokas2015; Carvalho Resende and others, Reference Carvalho Resende2022; Tielidze and others, Reference Tielidze, Nosenko, Khromova and Paul2022; Linsbauer and others, Reference Linsbauer, Huss, Hodel, Bauder and Barandun2025; Hematang and others, Reference Hematang2026).
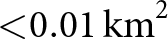
A particular object of interest is the response of very small glacierets, defined for the aim of this study, as glacierets whose surface area is smaller than 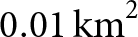 $0.01\,\mathrm{km}^2$ and down to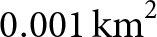 $0.001\,\mathrm{km}^2$. Recently, Ugalde and others (Reference Ugalde2025) reported the potential vanishing of 321 of these very small glacierets during the last 5 years (2018–2023) in the Northern and Central Andes of Chile. This contribution aims to provide new insights regarding the chronicle of the vanishing of those very small glacierets. For that purpose, we traced the evolution of each of the 321 very small glacierets by comparing the surface area reported by the two versions (IPG2014 and IPG2022) of the Chilean Public Glacier Inventory (Barcaza and others, Reference Barcaza2017; DGA, 2022). We also assessed the regional trends of the Zero-Degree Isotherm, $Z_{\text{0C}}$, and the Snowline Elevation, $Z_{\text{SL}}$, with respect to the elevation of the 321 very small glacierets throughout our study area.
We discuss our results in terms of their hydrological and practical relevance within the respective glaciers’ catchments. Our research represents a further contribution to the Global Glacier Casualty List (Boyer and Howe, Reference Boyer and Howe2024) and to the GLIMS efforts to track extinct glaciers (Raup and others, Reference Raup, Andreassen, Boyer, Howe, Pelto and Rabatel2025), which gain special relevance in the context of the UNESCO and WMO International Year of Glaciers’ Preservation.
Study area
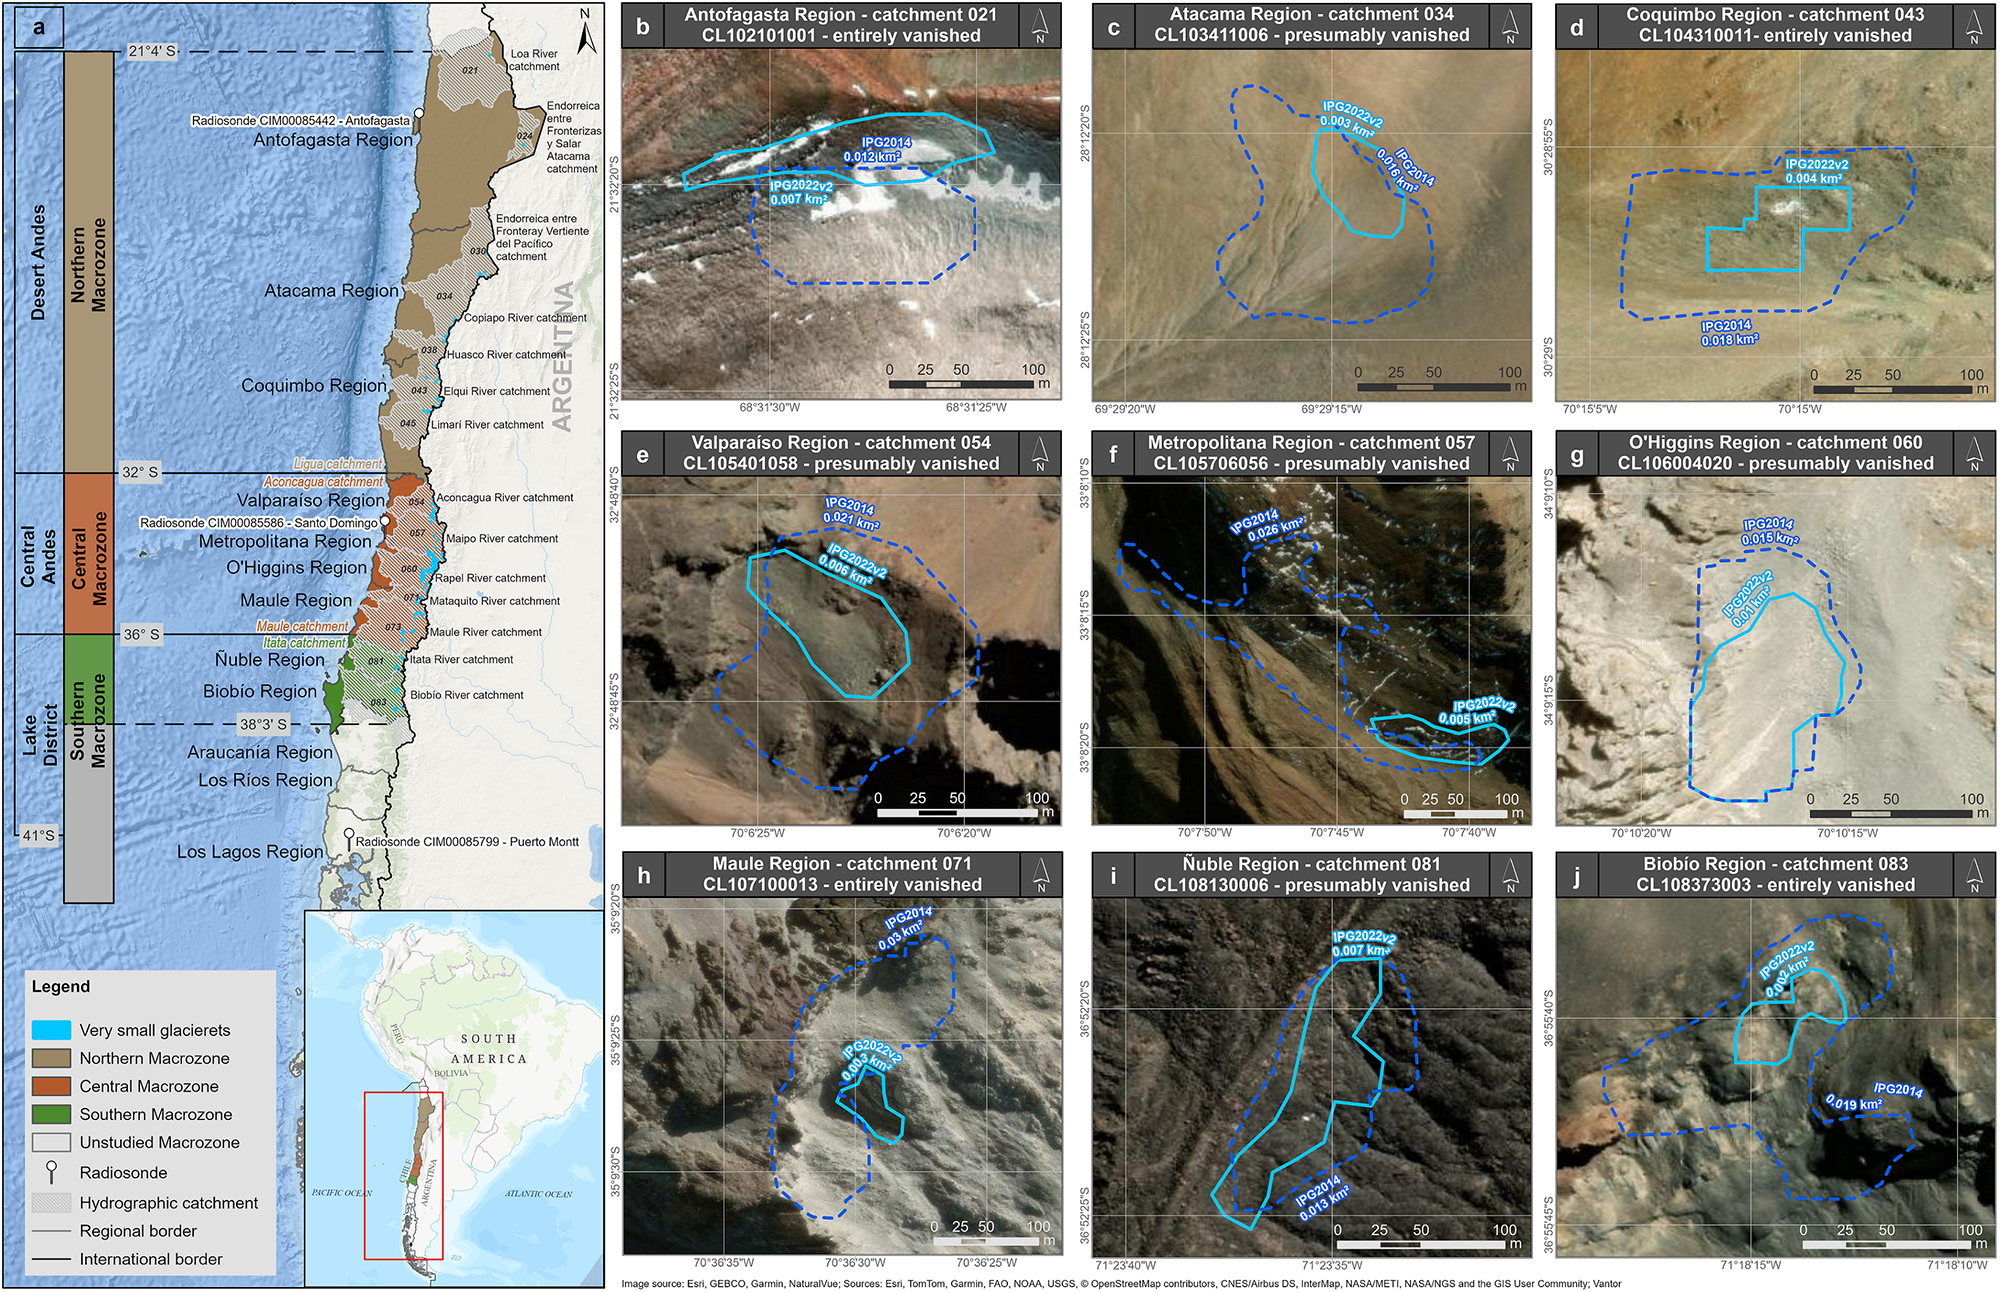
The study area corresponds to a large portion of the Northern and Central Andes of Chile. In total, nine regions are comprised, including the Antofagasta, Atacama, Coquimbo, Valparaíso, Metropolitana, O’Higgins, Maule, Ñuble and Biobío regions (Fig. 1). Those administrative regions host 5.175 glaciers, of which 321 very small glacierets are the focus of this study, according to the ‘vanished’ and ‘presumably vanished’ glacierets’ subsample defined in the study of Ugalde and others (Reference Ugalde2025). The latitudinal range, 21.5 $^{\circ}$S-37.9 $^{\circ}$S, hosts 22 glacierised hydrographic catchments; nonetheless, only 14 are the subject of this research, as the 321 very small glacierets lie within their boundaries. At the same time, 57 of these very small glacierets are located in the Northern glaciological macrozone, 222 in the Central macrozone and 42 in the comprised portion of the Southern macrozone (Ñuble and Biobío regions, Fig. 1).
Geographical setting of the study area. (a) Regions and catchments within the study area. All nine regions comprised by the study area are highlighted according to their respective glaciological macrozone. (b/j) Examples of entirely vanished and presumably vanished very small glacierets per region based on their IPG2014 (dashed line) and IPG2022 (continuous line) glacier outlines.
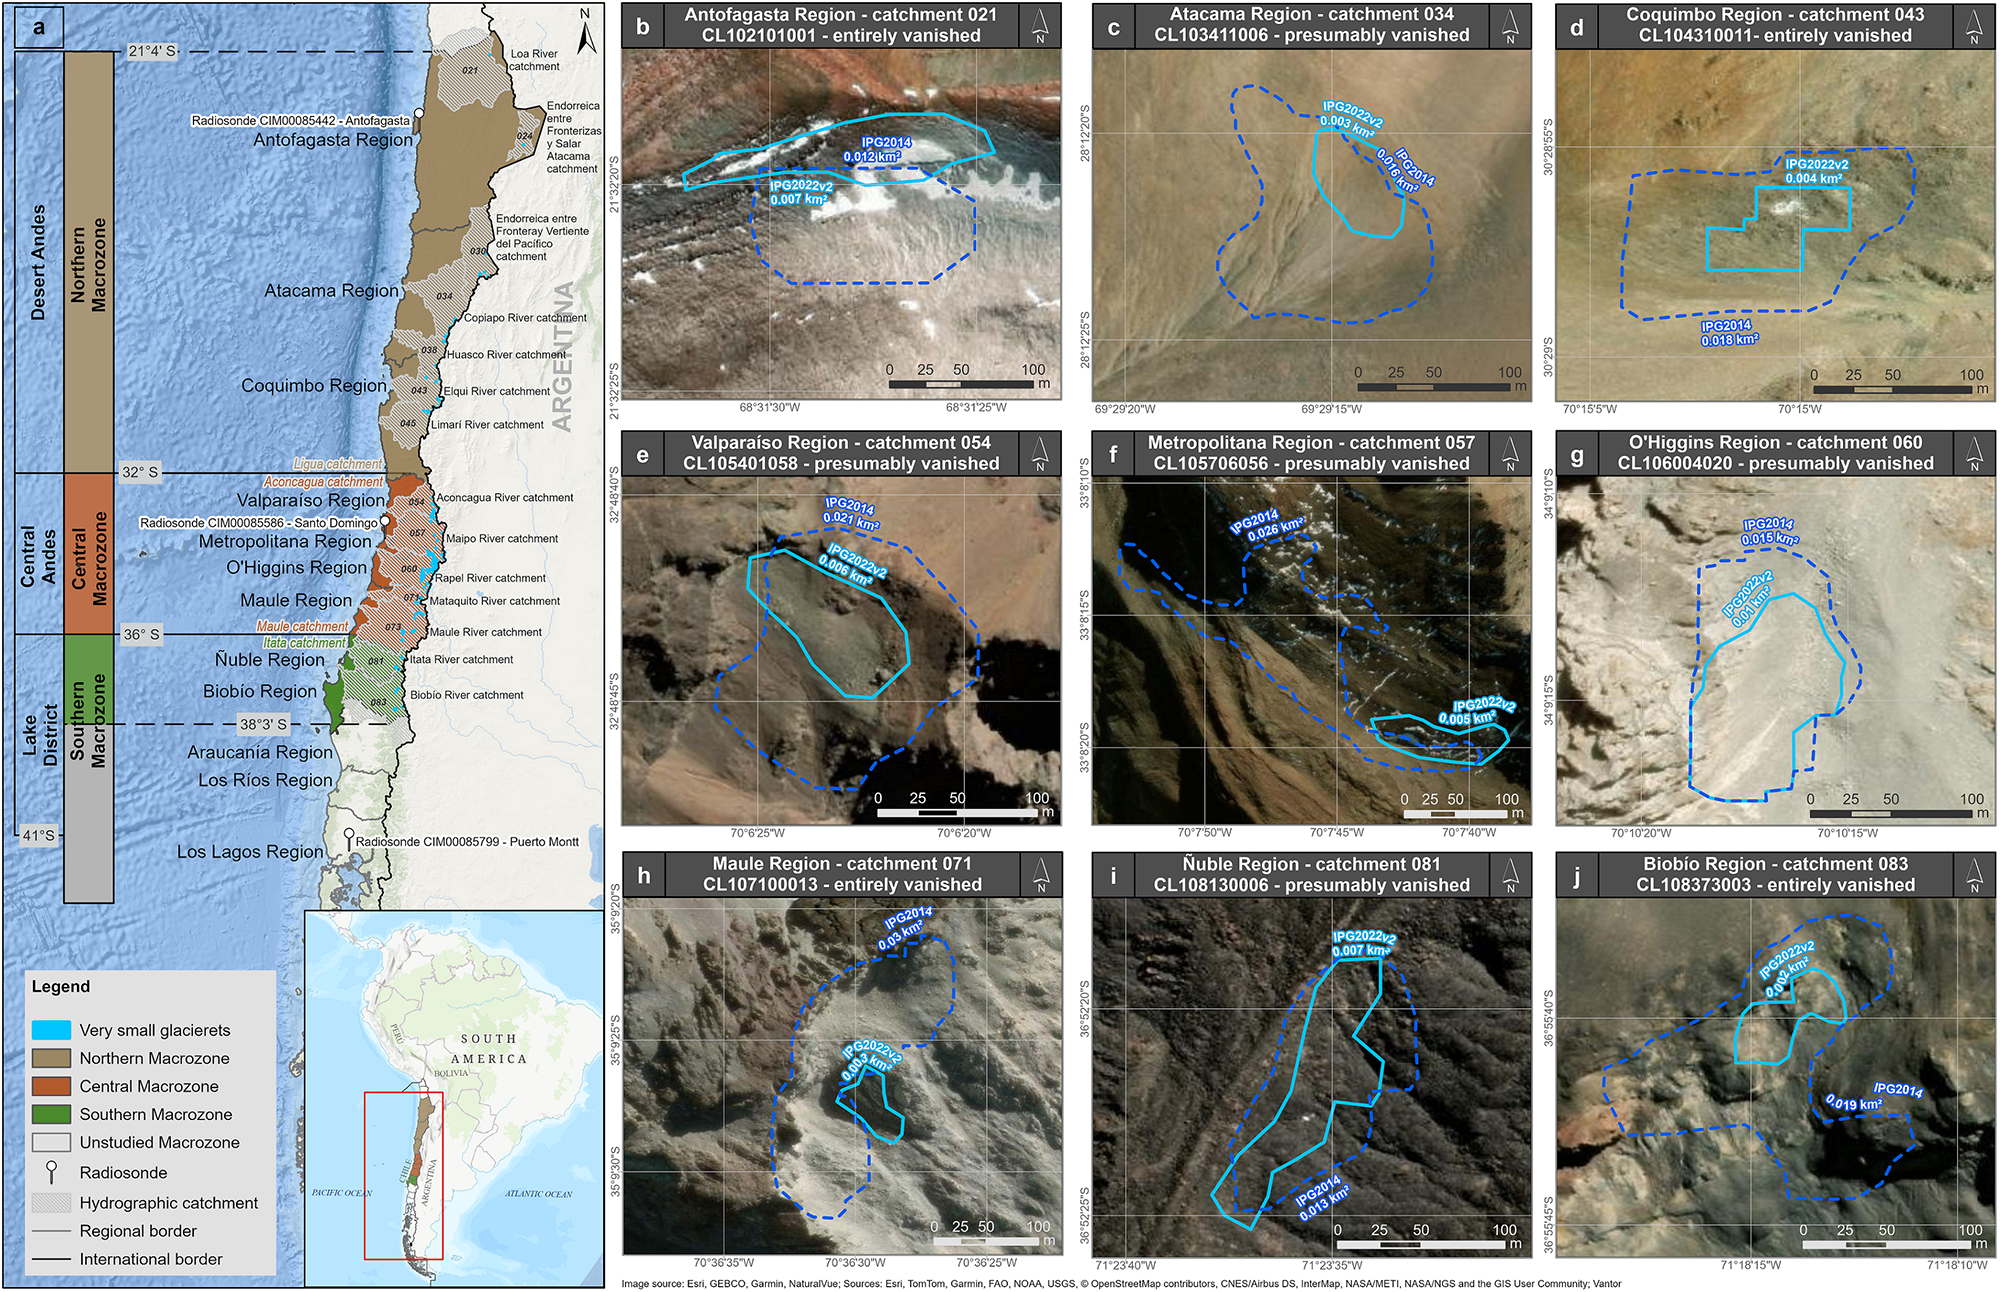
Figure 1 Long description
The left side of the image shows a map of Chile highlighting nine regions: Antofagasta, Atacama, Coquimbo, Valparaíso, Metropolitana, O’Higgins, Maule, Ñuble and Biobío. These regions are marked according to their glaciological macrozone. Below the map, a legend explains symbols for vanished glacierets, macrozones and boundaries. The right side contains nine images labeled A to J, each depicting a specific region with outlines of glacierets from 2014 (dashed line) and 2022 (continuous line). Each image includes a label indicating the region and the status of the glacieret, such as 'entirely vanished' or 'presumably vanished.' The images show varied landscapes with visible terrain features and glacier outlines. Regions include Antofagasta, Atacama, Coquimbo, Valparaíso, Metropolitana, O’Higgins, Maule, Ñuble and Biobío, each with specific glacieret data and outlines.
Data and methods
Vanished very small glacierets
Ugalde and others (Reference Ugalde2025) manually analysed all glacierets with a surface area less than 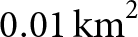 $0.01\,\mathrm{km}^2$, according to the IPG2022 (DGA, 2022), in the 17.7 $^{\circ}$S-38.3 $^{\circ}$S latitudinal range. The authors inspected high-resolution (submetre) optical satellite imagery from 2018 to 2023, including PlanetScope, GeoEye and WorldView imagery (Ugalde and others, Reference Ugalde2025). The resulting 588 very small glacierets subsample was then classified in terms of the presence or absence of visible surface ice. For the 321 very small glacierets without visible surface ice, a further classification was applied depending on the type of recognisable surface where glacier ice used to be. Very small glacierets with no visible surface ice and underlain by bedrock or water (77 very small glacierets) were classified as ‘entirely vanished’ (or just ‘vanished’ for the purposes of this research), whereas those very small glacierets with no visible surface ice and underlain by regolith were classified as ‘presumably vanished’ (244 very small glacierets, Fig. 1), as no field-validation was carried out to rule out the possibility of those very small glacierets being debris-covered (Ugalde and others, Reference Ugalde2025). In this way, the authors obtained a total dataset of 321 very small glacierets (the sum of both entirely vanished and presumably vanished categories).
Chilean glacier inventories
To develop the vanishing chronicle of the aforementioned 321 very small glacierets sample, we compared the IPG2014 and IPG2022, elaborated by the Chilean General Water Directorate (DGA). For our specific subset, the IPG2014 (Barcaza and others, Reference Barcaza2017) is based on satellite images spanning between 2000 and 2010, whereas the IPG2022 (DGA, 2022) is based on satellite images from the range 2017–2022. For both datasets, a minimum area of 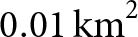 $0.01\,\mathrm{km}^2$ was used as a mapping criterion as reported by their authors (Barcaza and others, Reference Barcaza2017; DGA, 2022). Nonetheless, both datasets include a significant number of very small glacierets: 58928 in the case of the IPG2022 (5888 of those being classified as very small glacierets sensu stricto and the other 40 classified as rock glaciers), whereas the IPG2014, which constitutes the Chilean dataset for the Randolph Glacier Inventory 7.0 (RGI 7.0 Consortium, 2023), reported the existence of 68 very small glacierets (44 very small glacierets sensu stricto and 24 rock glaciers). According to the IPG2022 methodology (DGA, 2022), all ice bodies with a surface area less than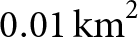 $0.01\,\mathrm{km}^2$, that were already mapped in the IPG2014 were included in the IPG2022, allowing us to assess the area changes for these very small glacierets. Thus, for each of the 321 very small glacierets, we manually matched the IPG2022-reported areas with those mapped in IPG2014.
Following UNESCO standards (UNESCO/IASH, 1970), every IPG presents information regarding the glacier surface area mapped and the year of the imagery employed for the glaciers’ mapping. Complementarily, both IPGs present an estimation of each glacier’s water equivalent volume computed through empirical relationships between area and average depth (Chen and Ohmura, Reference Chen and Ohmura1990) and an average density of 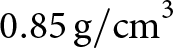 $0.85\,\mathrm{g/cm}^3$ (Huss, Reference Huss2013) for the IPG2022 (DGA, 2022) and of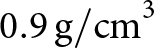 $0.9\,\mathrm{g/cm}^3$ (Cuffey and Paterson, Reference Cuffey and Paterson2010) for the IPG2014 (Barcaza and others, Reference Barcaza2017). This information allowed us to estimate the potential volume loss due to the vanishing of very small glacierets.
Lastly, and specifically for the Maipo catchment (Fig. 1), the analysis of the very small glacieret’s surface area data was traced further back in time by incorporating the Maipo glacier inventory (DGA, 1979), after georeferencing the corresponding digitised inventory map, allowing us to compare the fragmentation/reduction trend between glaciers mapped in the IPG2014 and in the 1979 Marangunic’s glacier inventory (DGA, 1979). As the 1979 Marangunic’s glacier inventory is based on 1955 aerial photographs from the Hycon surveys (DGA, 1979), the comparison with the IPG2014 and IPG2022 allowed us to cover nearly seven decades of glaciers’ fluctuations in the Maipo catchment.
Zero-degree isotherm and snowline elevation
The elevation trends of the 0 $^{\circ}$C isotherm (Zero-Degree Isotherm, $Z_{\text{0C}}$) and the snowline (Snowline Elevation, $Z_{\text{SL}}$) (Schauwecker and others, Reference Schauwecker, Palma, MacDonell, Ayala and Viale2022) serve as sensitive indicators of cryospheric retreat under climate warming. These metrics are particularly relevant for seasonal snow and very small glacierets.
A sustained rise in the  $Z_{\text{0C}}$ reflects a systematic increase of the atmospheric freezing level, consistent with global and regional warming (Carrasco and others, Reference Carrasco, Osorio and Casassa2008). This shift is closely linked to an upward displacement of the equilibrium line altitude (ELA) on glaciers. As the $Z_{\text{0C}}$ ascends, the ELA rises accordingly, implying increasingly negative glacier mass balances and front retreat, which can lead, eventually, to glacier vanishing in different global warming scenarios (Schuster and others, Reference Schuster2025; Van Tricht and others, Reference Van Tricht2026). In Chile, significant positive trends in the $Z_{\text{0C}}$ have been reported across the northern, central and southern Andes, highlighting a regional warming signal (Carrasco and others, Reference Carrasco, Casassa and Quintana2005; Barria and others, Reference Barria, Carrasco, Casassa and Barria2019). Similarly, a persistent rise in the $Z_{\text{SL}}$ indicates a reduction in seasonal snow cover duration, with direct implications for water availability and glacier mass balance.
To assess the relationship between very small glacierets vanishing and atmospheric warming throughout the study area, we analysed monthly vertical air temperature profiles from radiosonde observations conducted by the Chilean Meteorological Service (DMC) between 2020 and 2024. We employed data from the Antofagasta (CIM00085442), Santo Domingo (CIM00085586) and Puerto Montt (CIM00085799) stations. This period aligns with MODIS-derived  $Z_{\text{SL}}$ observations, which were analysed across selected Andean catchments, ensuring consistency across datasets. The data was acquired from the Satellite Snow Observatory (https://observatorionieves.cl/).
Environmental time series such as  $Z_{\text{0C}}$ and $Z_{\text{SL}}$ typically exhibit positive serial autocorrelation due to interannual climate persistence. To avoid inflated significance arising from non-independence, we applied the Modified Mann–Kendall (MMK) test with the variance correction of Hamed and Ramachandra Rao (Reference Hamed and Ramachandra Rao1998). This non-parametric method is suitable for non-normally distributed and serially correlated hydroclimatic data (Lauro and others, Reference Lauro, Vich and Rivera2025).
Statistical significance was assessed at  $\alpha = 0.05$ (95% confidence), with $0.05 \leq p \lt 0.10$ considered marginal (Carrasco and others, Reference Carrasco, Osorio and Casassa2008). Trend magnitude was estimated using Sen’s slope (Theil–Sen estimator), expressed in $\text{m}\cdot\text{decade}^{-1}$, providing a robust measure of physical change. Trend interpretation integrated the MMK-corrected $p$-value (significance), Kendall’s $\tau$ (direction and monotonic consistency) and Sen’s slope (magnitude). Monotonic strength was classified as weak (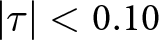 $|\tau| \lt 0.10$), moderate ( $0.10$– $0.30$) or strong ( $\geq 0.30$), and directional agreement between $\tau$ and Sen’s slope was verified.
Results
Glacier area reduction and loss of ice volume
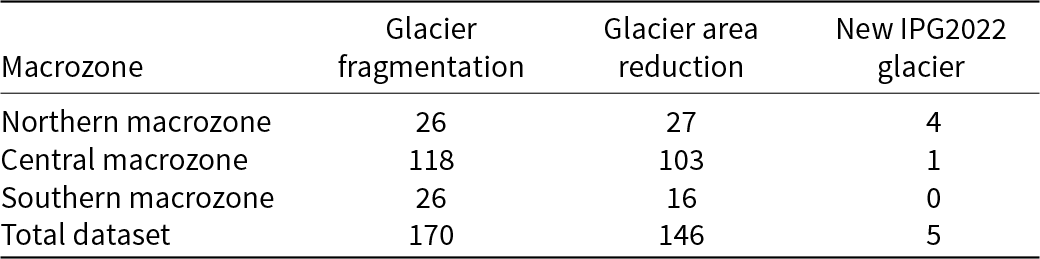
After comparing all 321 very small glacierets with the IPG2014 inventory, we found that five of these very small glacierets had not been mapped in the IPG2014. Such observation allowed us to qualify those very small glacierets as ‘new glaciers’ in the IPG2022, which contradicts, in part, the mapping criteria described in the IPG2022’s methodology (DGA, 2022) due to their very small surface area between 0.001 and 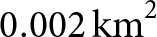 $0.002\,\mathrm{km}^2$. Once we excluded those five ‘new glaciers’ from the 321 total dataset of very small glacierets, we observed that 170 (53.8%) reduced their area from larger glaciers mapped in the IPG2014, due to fragmentation processes. On the other hand, 146 (46.2%) very small glacierets decreased in area directly due to the reduction in surface area from a single larger glacier in the IPG2014. Of these subsets, 139 very small glacierets have an assigned ID in the RGI version 7.0 (RGI 7.0 Consortium, 2023). Table 1 presents a summary of those observations for each glaciological macrozone and for the whole sample.
Number of glaciers in each category of the 321 very small glacierets after comparing the reported glacier surface in the IPG2014 and IPG2022 Chilean glacier inventories.
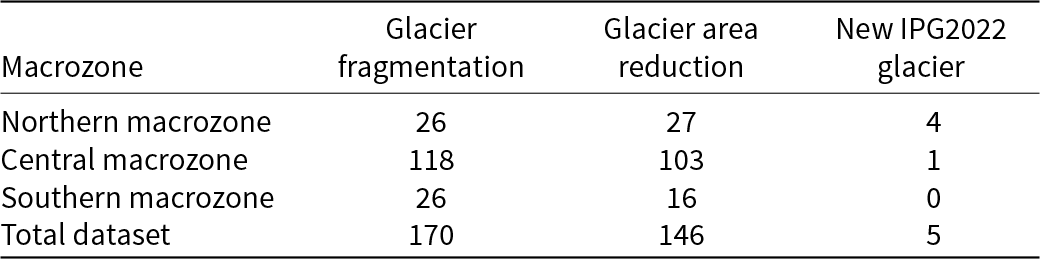
Table 1 Long description
The table compares the number of glaciers in three categories across different macrozones in Chile based on the IPG2014 and IPG2022 inventories. The Central macrozone shows the highest glacier fragmentation and area reduction, with 118 and 103 glaciers respectively, while the Northern and Southern macrozones have significantly fewer glaciers in these categories. The Northern macrozone has 26 fragmented glaciers and 27 with area reduction, whereas the Southern macrozone has 26 fragmented glaciers and 16 with area reduction. Additionally, the Central macrozone has only 1 new glacier identified in the IPG2022 inventory, compared to 4 in the Northern Macrozone and none in the Southern macrozone. Overall, the total dataset includes 170 fragmented glaciers, 146 with area reduction, and 5 new glaciers identified in the IPG2022 inventory.
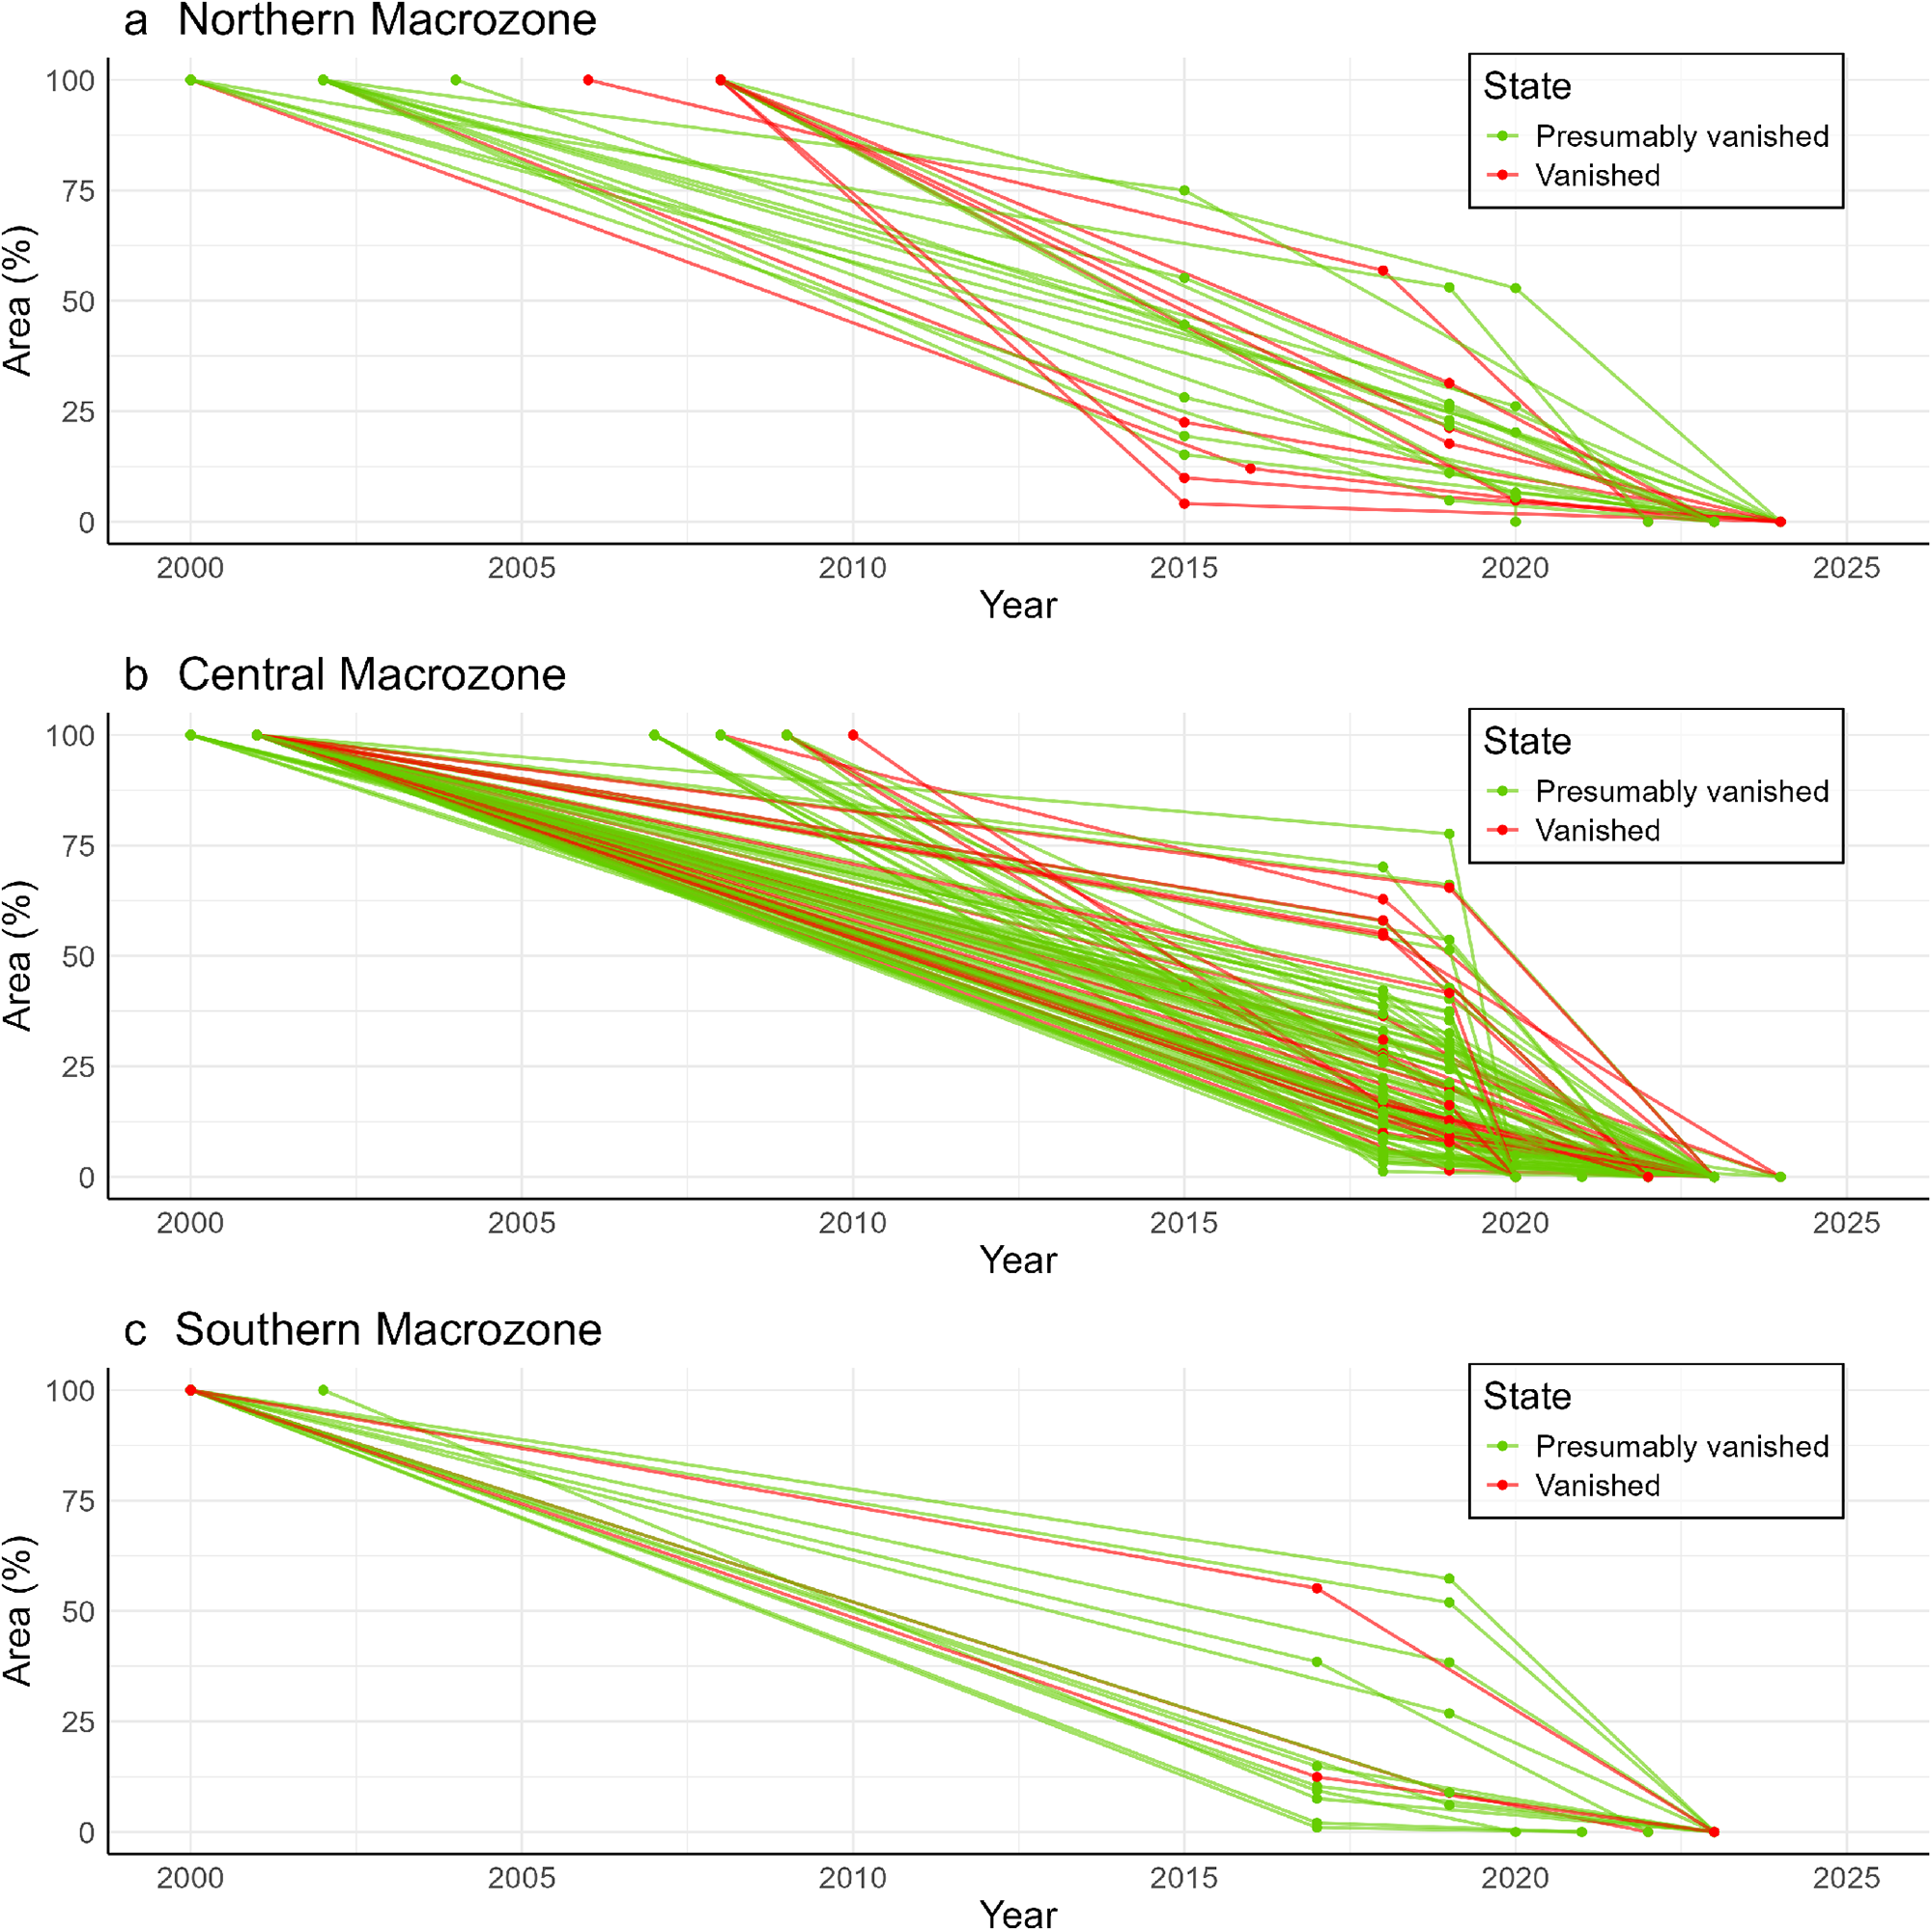
We assessed the relative area changes, in terms of %, for those very small glacierets whose surface area reduced from a single larger glacier mapped in the IPG2014 and compared to their reported surface area in the IPG2022. The results show that there is no clear relationship between the area loss and area-loss rate for those vanished and presumably vanished very small glacierets (Fig. 2). Nonetheless, we observed that nearly 50% of the total dataset of very small glacierets in the Northern and Central macrozones vanished within five years after being included in the IPG2022, based on the satellite imagery dates used for their mapping (DGA, 2022). In that sense, in the Central macrozone, which hosts the larger portion of the total dataset of very small glacierets (Table 1), most of those concentrated at the Rapel catchment (Fig. 1), 20% of the subsample vanished at the end of the 2019–2020 hydrological year, one of the driest periods since historical times in the Chilean central Andes (Alvarez-Garreton and others, Reference Alvarez-Garreton, Boisier, Garreaud, Seibert and Vis2021; Garreaud and others, Reference Garreaud2025), coinciding with the Chilean central Andes megadrought (Garreaud and others, Reference Garreaud, Boisier, Rondanelli, Montecinos, Sepúlveda and Veloso-Aguila2020). As for the Ñuble and Biobio regions, Southern macrozone (Fig. 2), we observe a bimodal behaviour in the area-loss rates. Six of 16 very small glacierets showed a more pronounced area loss after 2017, whereas the other 10 significantly reduced their area between 2000 and 2017. It is worth noting that five of the 16 very small glacierets in the Southern macrozone vanished by 2022, whilst the rest of the subset vanished by 2023 (Ugalde and others, Reference Ugalde2025).
Relative area change (%) for all reduced very small glacierets within the three glaciological macrozones comprised in this study. Red series corresponds to entirely vanished very small glacierets, whereas green series corresponds to presumably vanished very small glacierets, following Ugalde and others (Reference Ugalde2025) classification scheme. (a) Northern macrozone. (b) Central macrozone. (c) Southern macrozone.
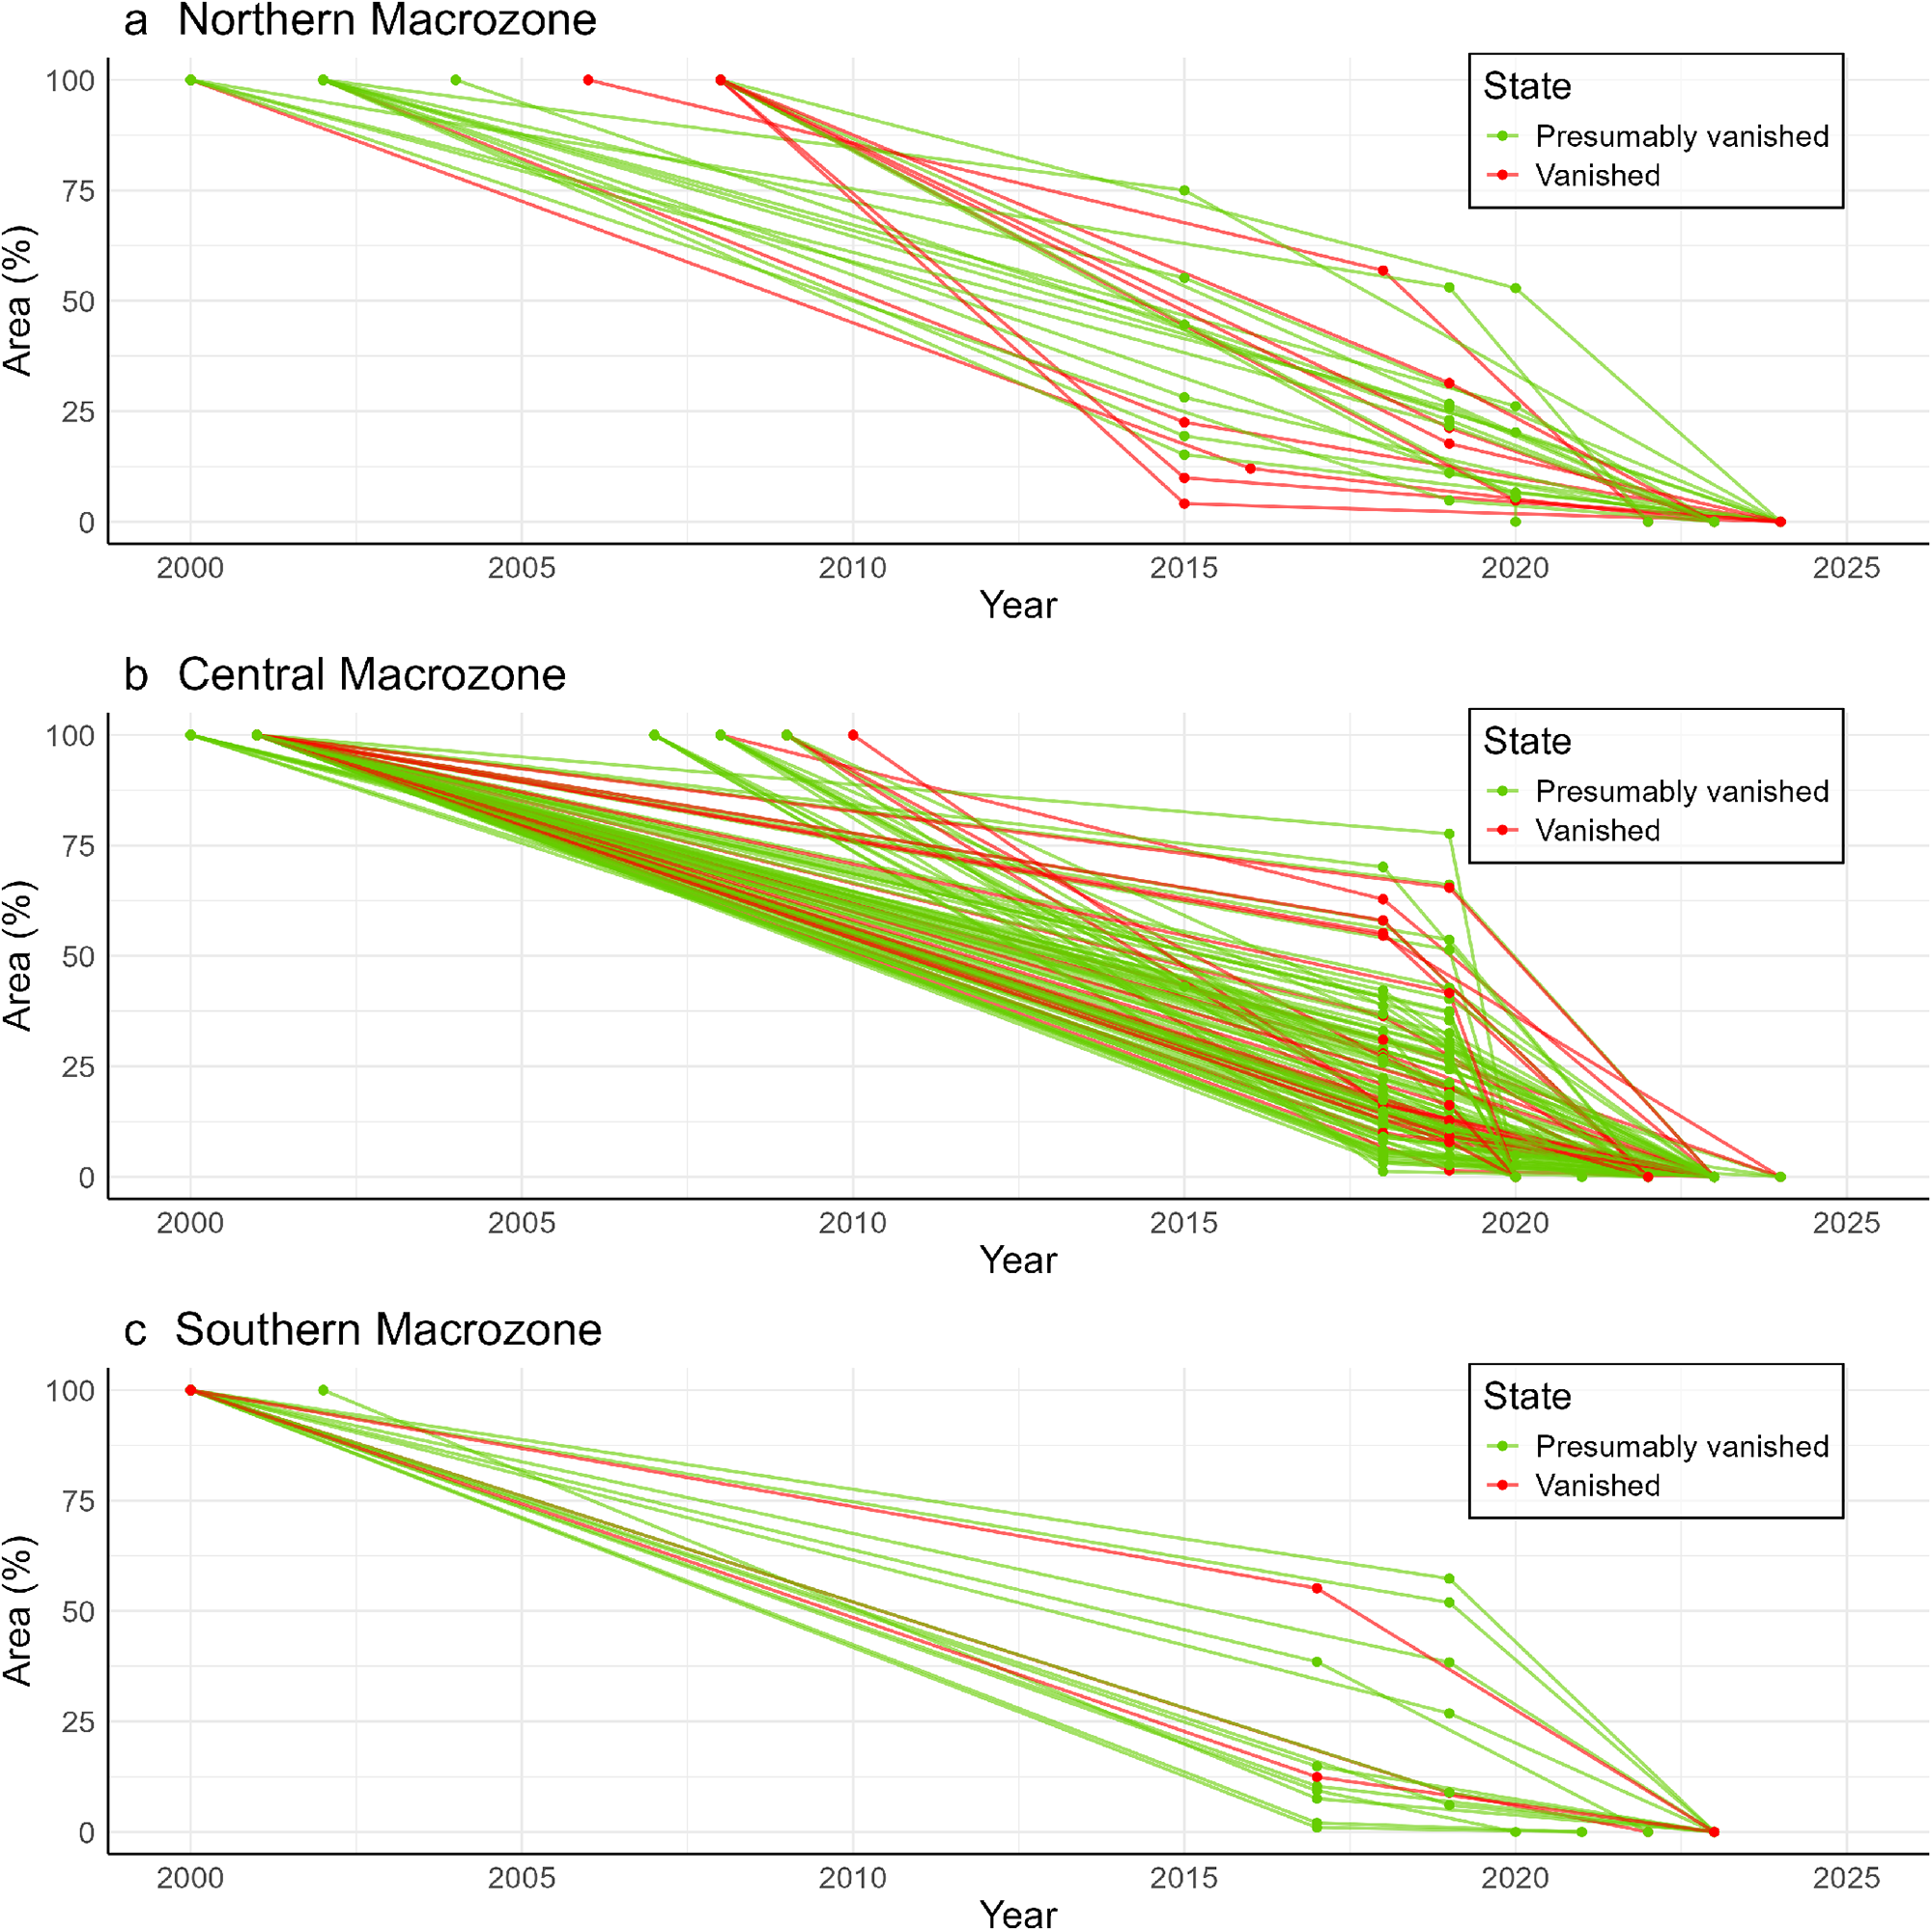
Figure 2 Long description
Three line graphs depict the relative area change percentage of very small glacierets across three macrozones from 2000 to 2025. The x-axis is labeled 'Year' and the y-axis is labeled 'Area (percent)'. Each graph includes two series: 'Presumably vanished' in green and 'Vanished' in red. The first graph, labeled 'Northern Macrozone', shows multiple lines indicating a decrease in area over time, with some lines ending abruptly, representing vanished glacierets. The second graph, labeled 'Central Macrozone', displays a similar trend with a dense cluster of lines, indicating a significant reduction in area, particularly after 2015. The third graph, labeled 'Southern Macrozone', shows a consistent decline in area, with several lines ending before 2025, indicating vanished glacierets. Each graph reflects the changes in glacieret areas over the specified period, highlighting the differences in disappearance rates across the macrozones.
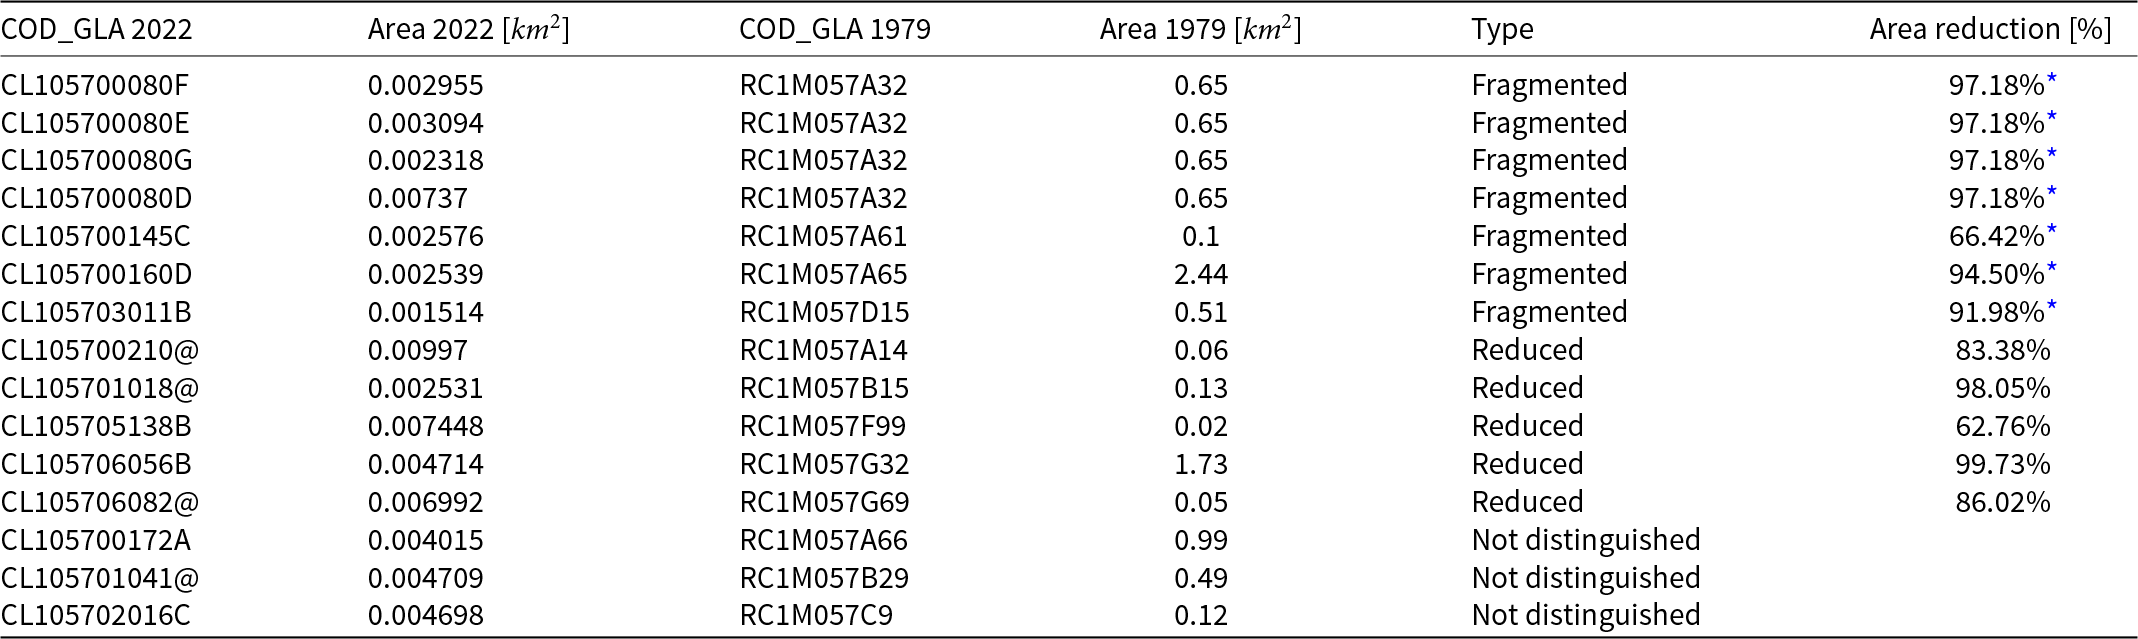
When comparing the Maipo catchment subset with the 1979 Marangunic’s glacier inventory, we observed that 15 very small glacierets could be identified and traced to the IPG2014 and IPG2022 datasets. Of these, seven showed a fragmentation process and five an area reduction from a single larger glacier. As for the other three identified very small glacierets in the 1979 glacier inventory, we could not determine whether they underwent fragmentation or area reduction (Table 2). Lastly, only three glaciers suffered a sustained area reduction from a single glacier identified in all of the three glacier inventories (1979 Marangunic’s inventory, IPG2014 and IPG2022) prior to their vanishing, being CL105700210@, CL105701018@ and CL105706082@ (Table 2), whereas the other two reduced very small glacierets (CL105705138B and CL105706056B) had a fragmentation process in between the IPG2014 and IPG2022.
Very small glacierets areal comparison between IPG2022 and 1979 Marangunic’s glacier inventory at the Maipo catchment.
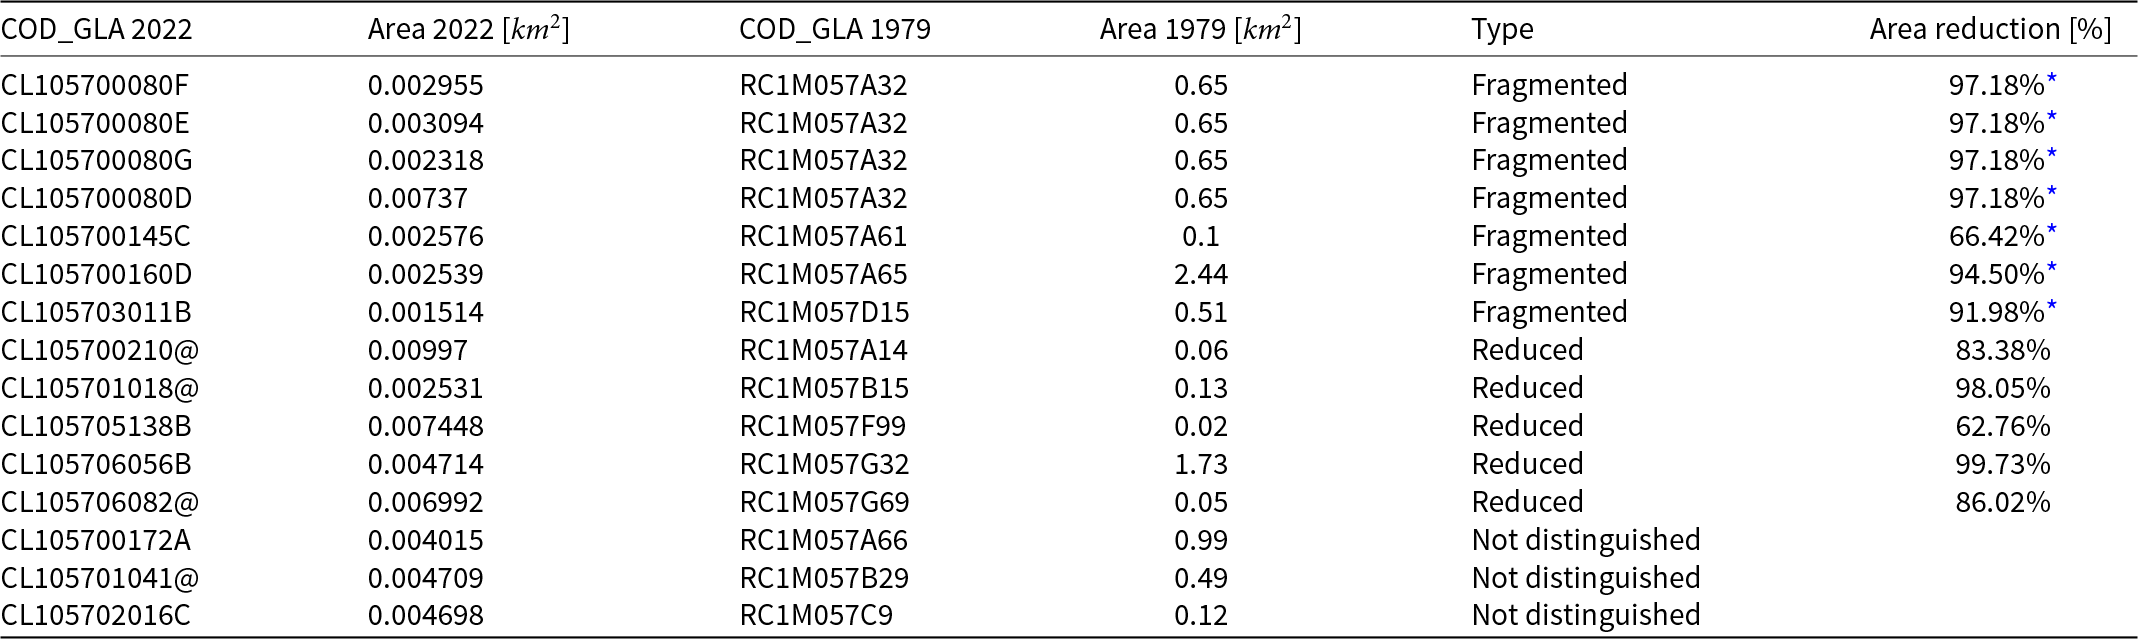
Table 2 Long description
The table compares glacier areas in the Maipo catchment between 1979 and 2022, highlighting significant reductions in size. Fragmented glaciers show the most substantial decrease, with some areas reduced by over 99%. For example, glacier CL105706056B decreased from 1.73 square kilometers in 1979 to 0.004714 square kilometers in 2022, marking a 99.73% reduction. Other glaciers, categorized as reduced, also show notable decreases, such as CL105701018@, which reduced by 98.05%. Some glaciers are not distinguished in terms of area reduction, indicating variability in measurement or classification. Overall, the data suggests a trend of shrinking glacier sizes over the decades, with fragmented glaciers experiencing the most pronounced reductions.
* Cumulative sum of fragmented glacier areas, including the ones with areas greater than 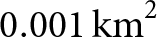 $0.001\,\mathrm{km}^2$ (glaciers and very small glacierets).
In terms of the potential loss of ice volume, we calculated the cumulative total loss of water equivalent ice volume, according to the IPG2022 data, to be  $5.69\times 10^6\,\mathrm{m}^3$. As expected, the Central macrozone poses the largest ice volume loss with $4.22\times 10^6\,\mathrm{m}^3$ of water equivalent ice volume loss, followed by the Northern and Southern macrozones with $0.87\times 10^6\,\mathrm{m}^3$ and $0.6\times 10^6\,\mathrm{m}^3$ water equivalent ice volume loss, respectively. However, when narrowing this subset to only the ‘entirely vanished’ very small glacierets, according to Ugalde and others (Reference Ugalde2025), the total amount of ice loss diminishes to $1.47\times 10^6\,\mathrm{m}^3$ of water equivalent ice volume (Table 3).
Water equivalent ice volume loss according to the vanished, presumably and total dataset (entirely plus presumably) vanished scheme for all the 321 very small glacierets compared to the total sum of glacieret’s water equivalent ice volume per glaciological macrozone.

Table 3 Long description
The table measures the water equivalent ice volume loss for glacierets across three glaciological macrozones: Northern, Central, and Southern. The Central macrozone shows the highest loss, with over 4.2 million cubic meters of ice volume vanished, both entirely and presumably. In contrast, the Northern macrozone lost approximately 872,000 cubic meters, and the Southern macrozone lost about 597,000 cubic meters. The total ice volume loss across all macrozones is over 5.6 million cubic meters. When compared to the total sum of glacierets' water equivalent ice volume, the losses are relatively small, indicating that while significant, the vanished ice volume represents only a fraction of the total glacieret volume.
* All glacierets reported by the IPG2022 per each segment of the study area.
Elevation trends of the  $\text{Z}_{\text{0C}}$ and
$\text{Z}_{\text{SL}}$
$\text{Z}_{\text{0C}}$ and
$\text{Z}_{\text{SL}}$


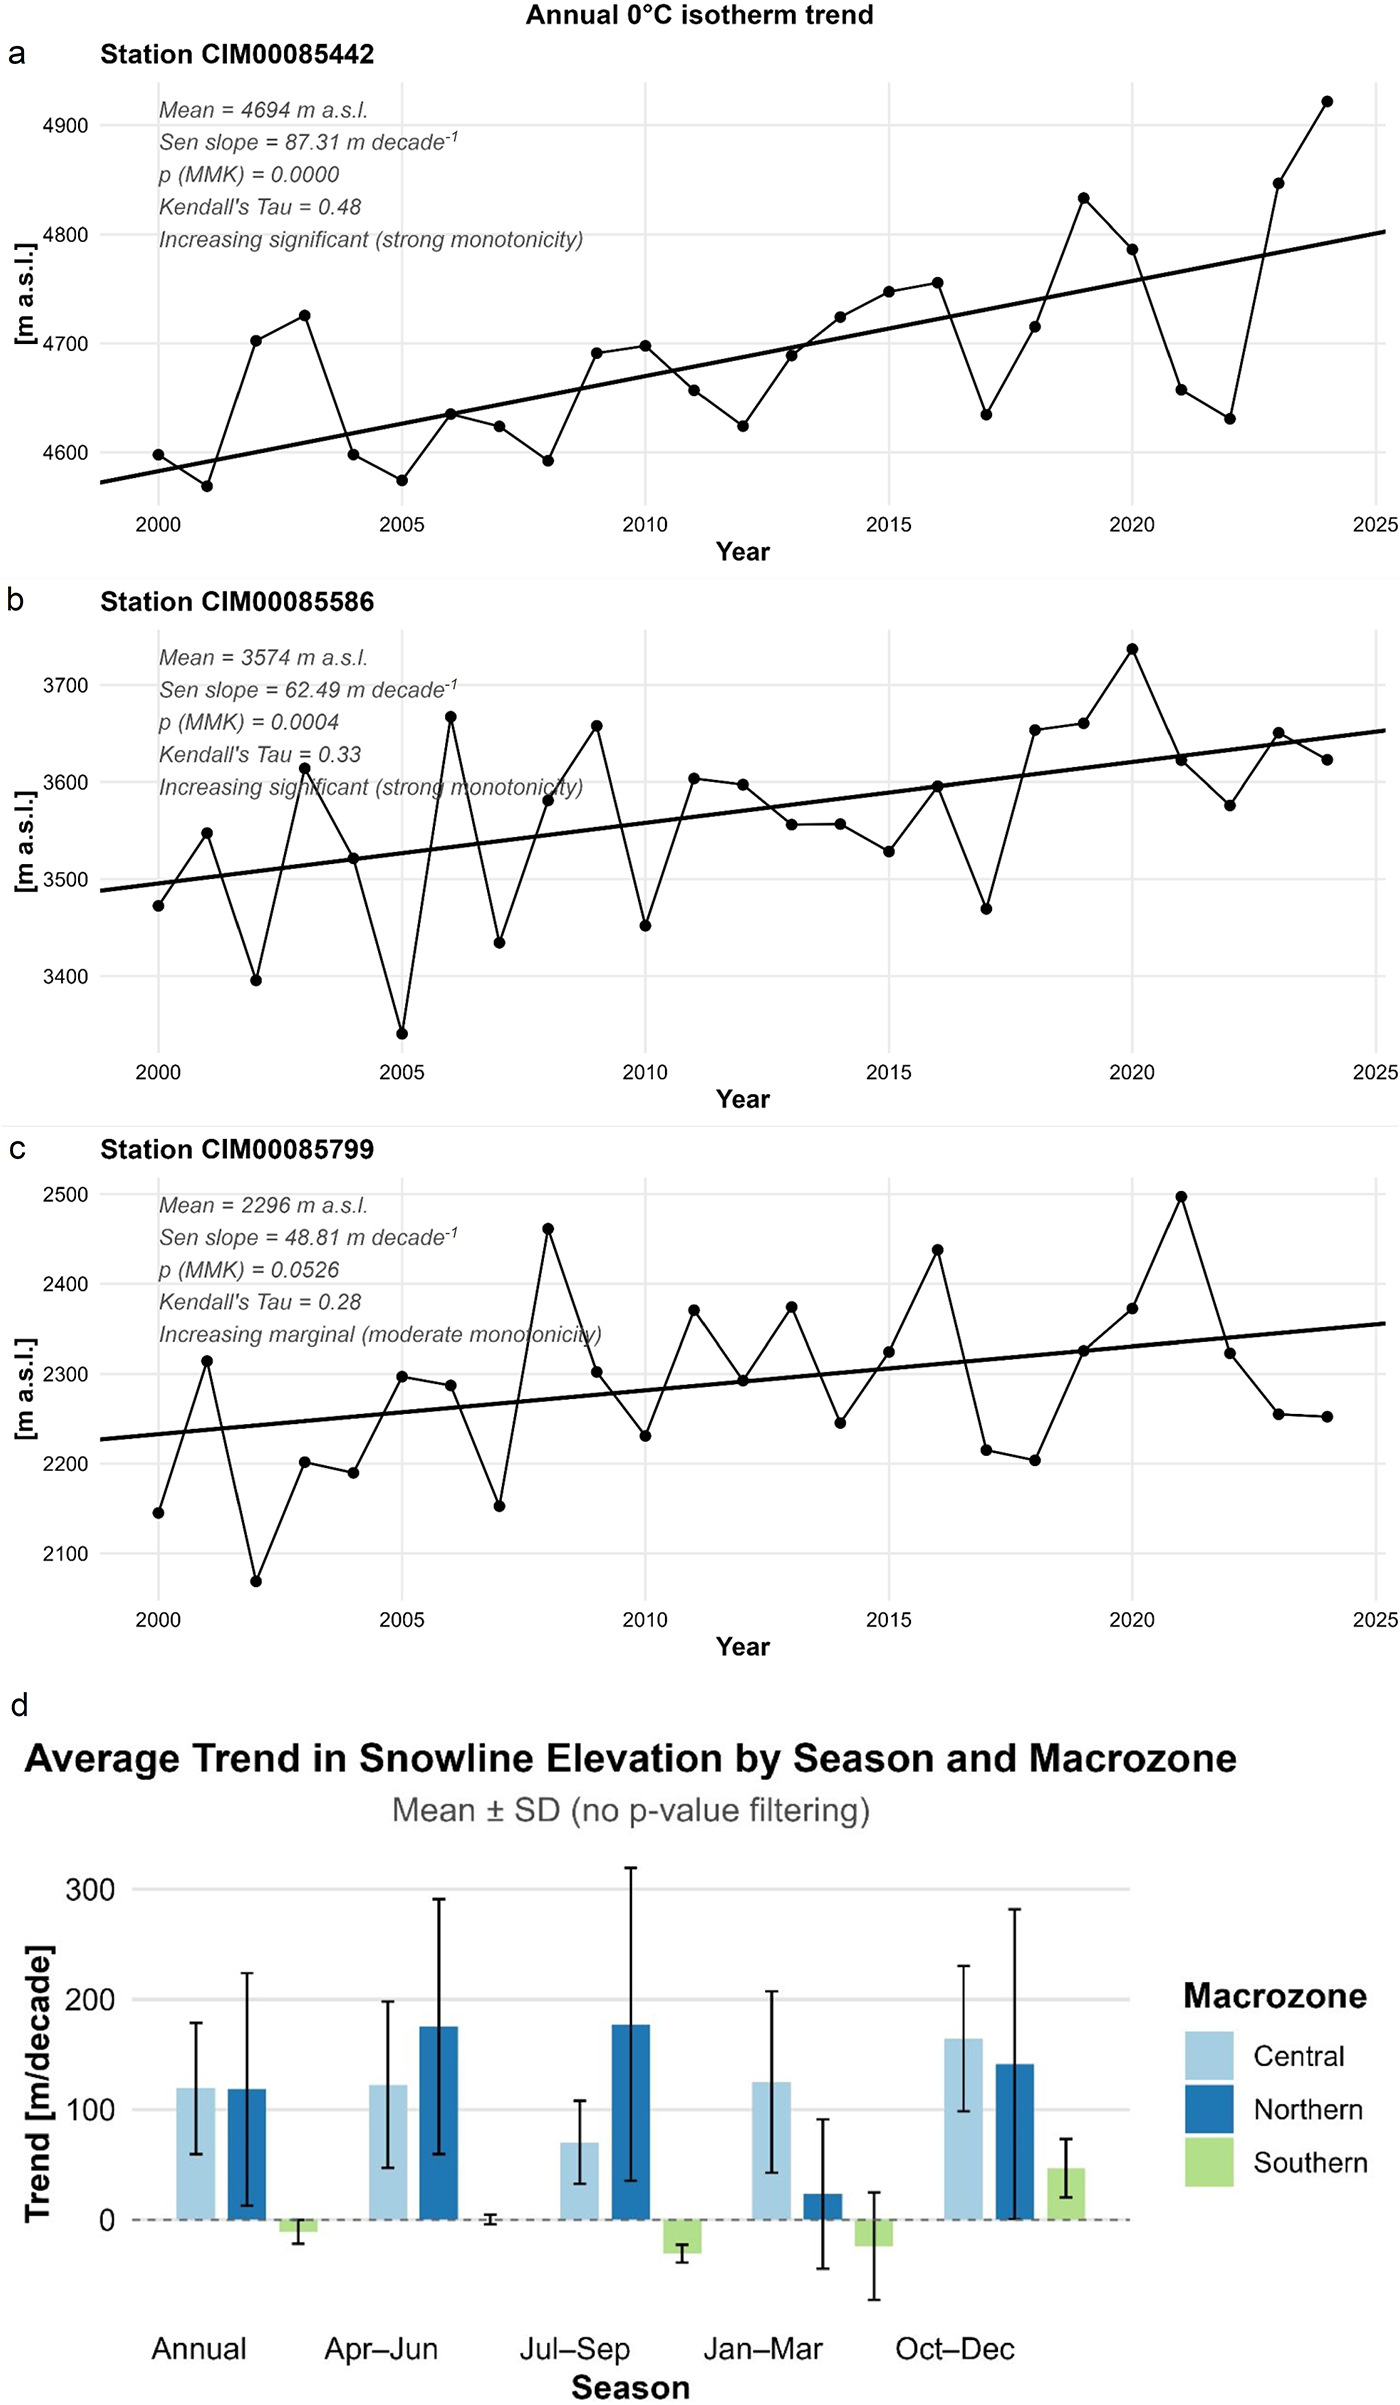
The Modified Mann–Kendall (MMK) analysis reveals a coherent upward shift in the annual  $Z_{\text{0C}}$ across the three study sites during the 2000–2024 period (Fig. 3). Two stations, Antofagasta (CIM00085442, 23.4 $^{\circ}$S), in the Northern macrozone, with a mean $Z_{\text{0C}}$ elevation of 4694 m a.s.l., and Santo Domingo (CIM00085586, 33.7 $^{\circ}$S), in the Central macrozone, with a mean $Z_{\text{0C}}$ elevation of 3574 m a.s.l., exhibit statistically significant increasing trends (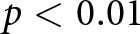 $p \lt 0.01$), with Sen slopes of $+87.3 \text{m}\cdot\text{decade}^{-1}$ and $+62.5 \text{m}\cdot\text{decade}^{-1}$, respectively. Kendall’s $\tau$ values ( $0.48$ and $0.33$) indicate strong to moderate monotonic consistency, supporting the robustness of the detected trends after correction for serial autocorrelation (Hamed and Ramachandra Rao, Reference Hamed and Ramachandra Rao1998). The third station, Puerto Montt (CIM00085799, 41.4 $^{\circ}$S), with a mean $Z_{\text{0C}}$ elevation of 2296 m a.s.l., shows a marginally significant increase (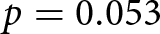 $p = 0.053$), with a Sen slope of $+48.8 \text{m}\cdot\text{decade}^{-1}$ and moderate monotonicity ( $\tau = 0.28$). Although statistical confidence is lower, the direction and magnitude remain consistent with the regional signal. The upward displacement of $Z_{\text{0C}}$ by $\sim$50–90 $\text{m}\cdot\text{decade}^{-1}$ implies a substantial shift in thermal conditions affecting snowline dynamics, melt processes and glacier mass balance. These results indicate a persistent regional warming signal with clear implications for glacier-climate interactions within the study area.
Fluctuations of the Zero-degree isotherm,  $Z_{\text{0C}}$ and Snowline elevation, $Z_{\text{SL}}$, for the 2000–2024 period. (a) $Z_{\text{0C}}$ annual trend for the CIM00085442 station, Northern macrozone. (b) $Z_{\text{0C}}$ annual trend for the CIM00085586 station, Central macrozone. (c) $Z_{\text{0C}}$ annual trend for the CIM00085799 station, Southern macrozone. Stations’ locations shown in Figure 1. (d) Seasonal and annual average trend in $Z_{\text{SL}}$ for each macrozone.
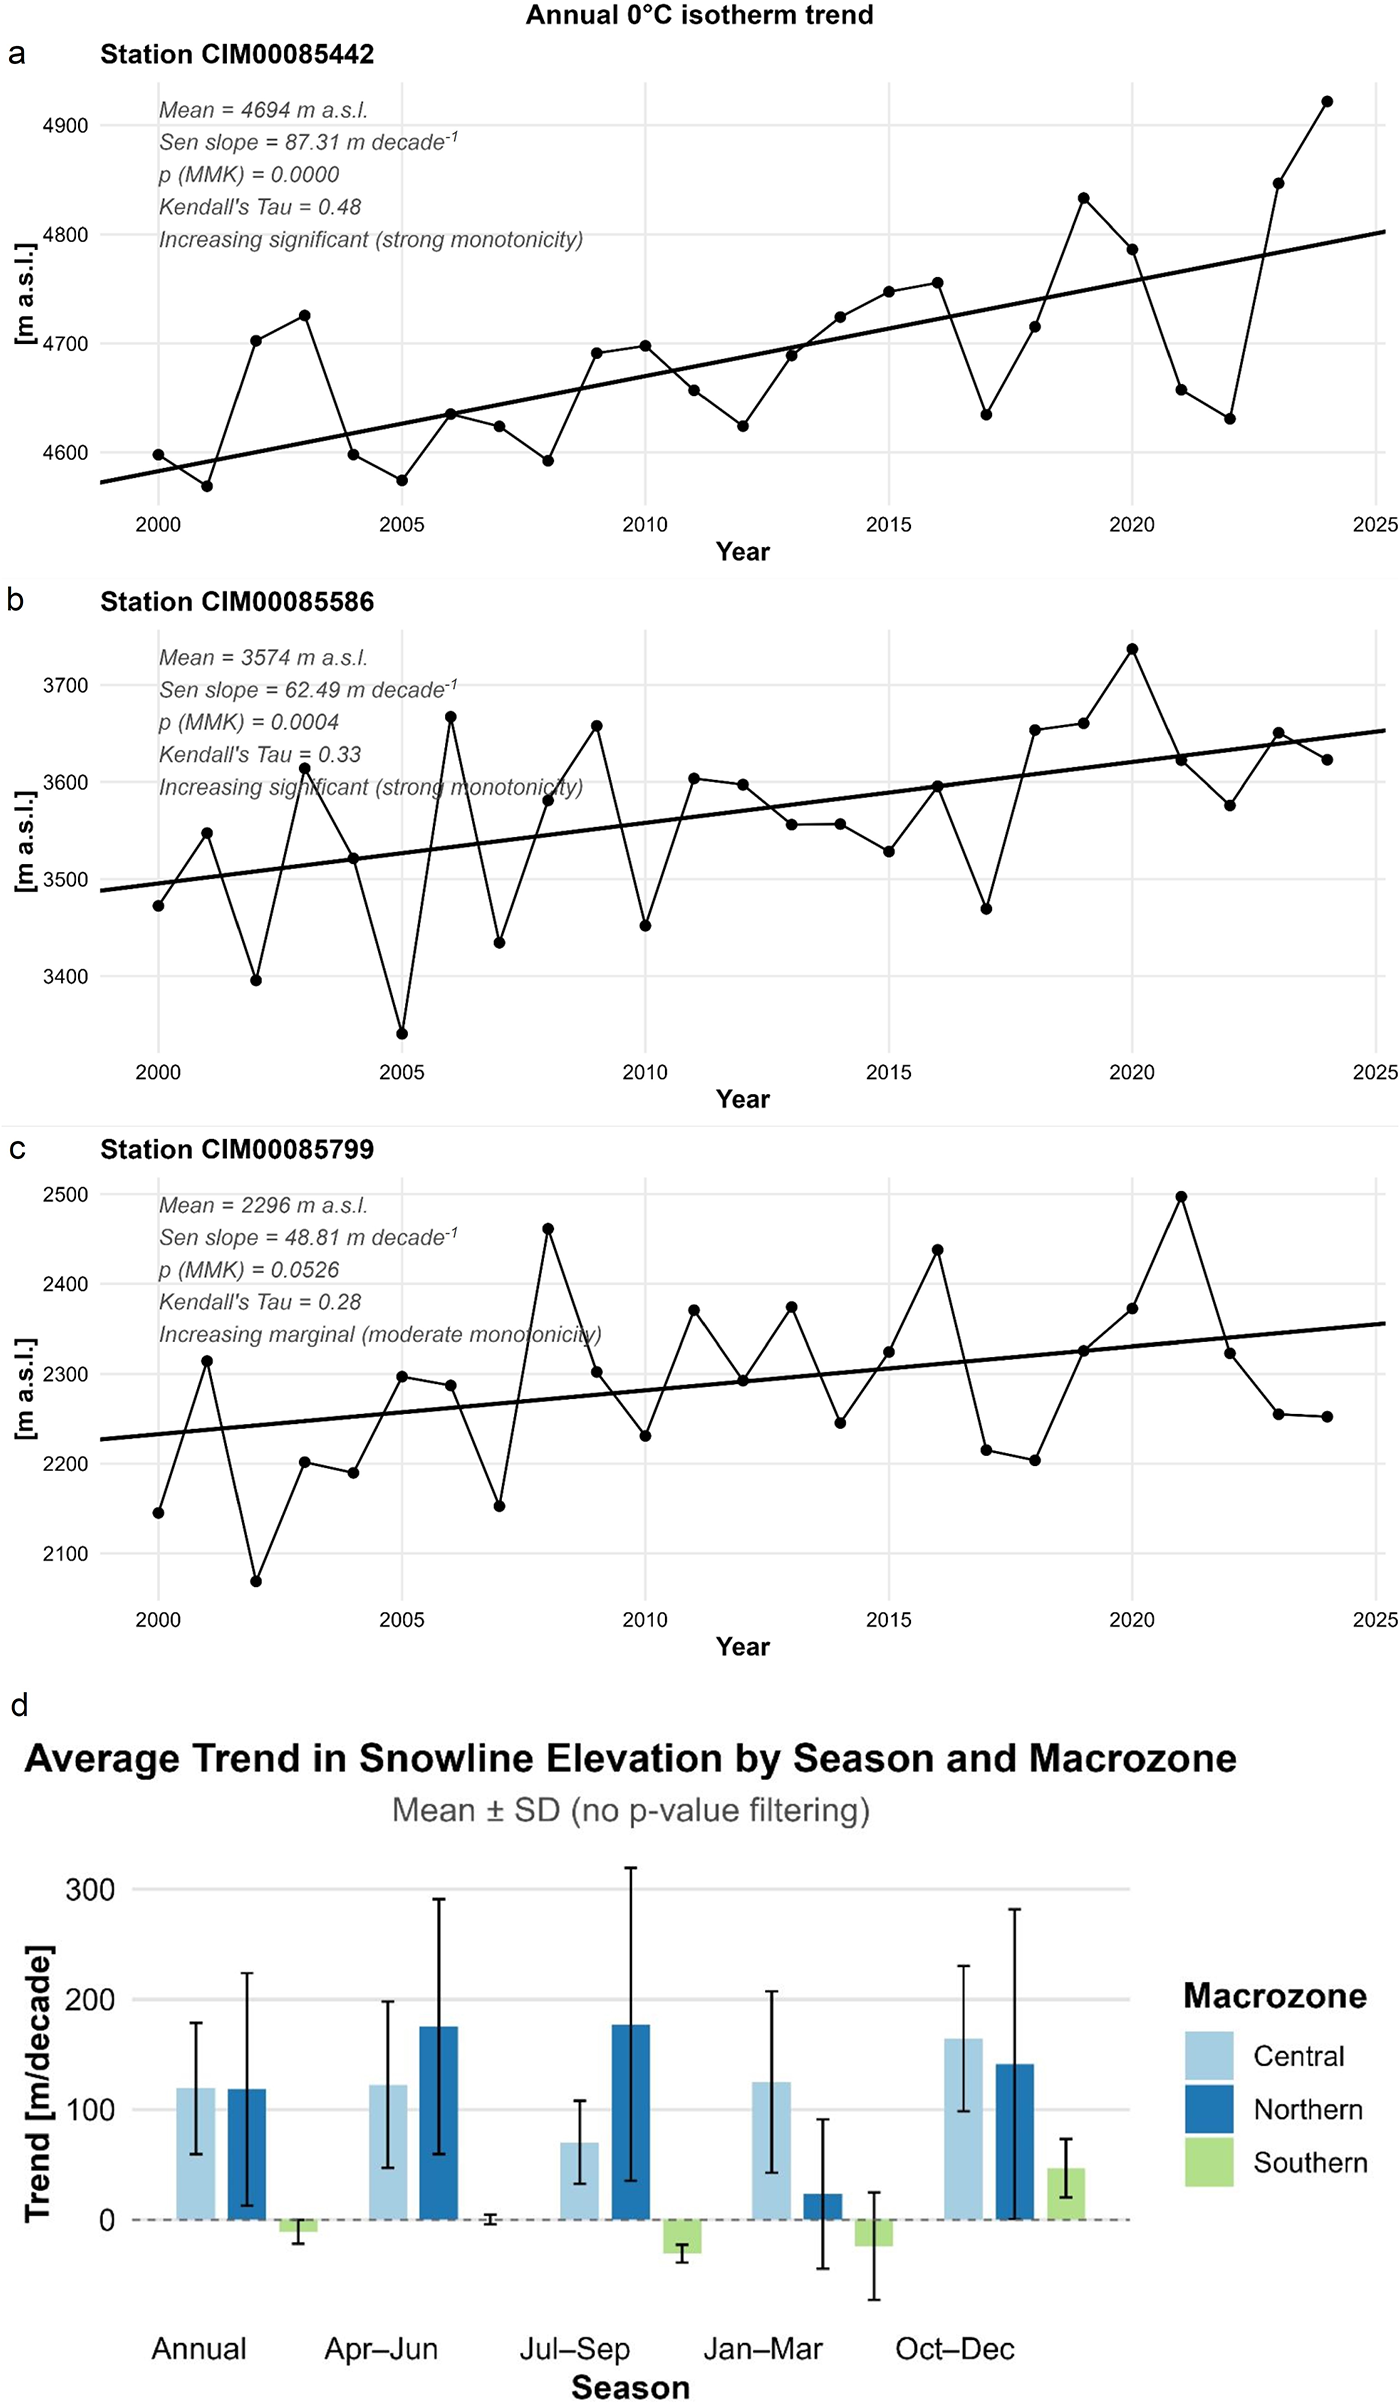
Figure 3 Long description
The image contains four graphs. The first graph shows the annual zero-degree isotherm trend for Station CIM00085442 from 2000 to 2024, with a mean elevation of 4694 meters above sea level, a trend of 79.2 meters per decade and a p-value of 0. The second graph displays the trend for Station CIM00085586, with a mean elevation of 3574 meters above sea level, a trend of 66.98 meters per decade and a p-value of 0.008. The third graph illustrates the trend for Station CIM00085799, with a mean elevation of 2296 meters above sea level, a trend of 56.25 meters per decade and a p-value of 0.042. The fourth graph shows the average trend in snowline elevation by season and macrozone, with mean and standard deviation values, without p-value filtering. The macrozones are labeled as Central, Northern and Southern.
Our results show that the central Andes exhibit the most consistent and statistically significant rise in  $Z_{\text{SL}}$, both annually and seasonally (Fig. 3d). Notably, the Aconcagua (054), Maipo (057), Rapel (060) and Mataquito (071) catchments in the Central macrozone (Figs. 1 and 3) exhibit significant $Z_{\text{SL}}$ increases, with an average trend of +140.9 $\text{m}\cdot\text{decade}^{-1}$ and a maximum of +177.4 $\text{m}\cdot\text{decade}^{-1}$ in the Maipo catchment. In particular, the strongest seasonal signal at the Central macrozone, where most of the very small glacierets have vanished (Fig. 2), occurs in austral spring (October-November–December, OND, Fig. 3d), indicating potential reductions in winter accumulation and shorter snow cover duration. These results are consistent with those reported by Dietz and others (Reference Dietz2025), who analysed $Z_{\text{SL}}$ trends in the Aconcagua and Maipo river catchments using Landsat imagery.
Discussion
Very small glacierets and minimum area
Glacierets are, by definition, very small glaciers with a surface area lower than 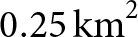 $0.25\,\mathrm{km}^2$ (Cogley and others, Reference Cogley2011). Nonetheless, some authors already consider small glaciers as those whose surface area is below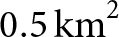 $0.5\,\mathrm{km}^2$ (Fischer and others, Reference Fischer, Huss, Barboux and Hoelzle2014; Huss and Fischer, Reference Huss and Fischer2016; Arie and others, Reference Arie, Narama, Fukui and Iida2025), which is twice the size of a glacieret by definition. In this sense, the definition of a surface threshold will be subject to the main purpose of the respective assessment (Pope, Reference Pope2025). In our case, and following the IPG2022 dataset (DGA, 2022), we specifically considered as very small glacierets those whose area is in the $0.001-0.01\,\mathrm{km}^2$ envelope, a surface range already below the commonly accepted lower area threshold of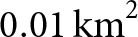 $0.01\,\mathrm{km}^2$ (Pfeffer and others, Reference Pfeffer2014; Tielidze and others, Reference Tielidze, Nosenko, Khromova and Paul2022; Paul and others, Reference Paul, Baumann, Anderson and Rastner2023).
Nonetheless, it is worth mentioning that our research relies on the practical purposes of the Chilean Public Glacier Inventories IPG2014 (Barcaza and others, Reference Barcaza2017) and IPG2022 (DGA, 2022), which follow operational purposes according to UNESCO/IASH (1970) guidelines. As the IPG2014 reported only 68 very small glacierets, which represent 0.28% of the 24 005 glaciers accounted for in that inventory (Barcaza and others, Reference Barcaza2017), it is likely that the inclusion of those few very small glacierets responds to the uncertainties of glacier’s manual and semiautomatic delineation, an issue already assessed by Paul and others (Reference Paul2013). However, in the case of the IPG2022, the 5928 very small glacierets reported represent a more systematic approach, as mentioned in the Data and methods sections, with 22.6% of all Chilean mapped glaciers in the IPG2022 falling into the ‘very small glacieret’ surface area range. The vast majority (88.2%) of those very small glacierets, if they can be considered glaciers at all (Pope, Reference Pope2025), are located in the Austral and Southern regions of Aysén, Magallanes and Los Lagos according to the IPG2022 (DGA, 2022). In this regard, (Pope, Reference Pope2025) summarises alternative terms for such small ice bodies, including ‘ice patches’, ‘remnant glacier’, ‘perennial snow’ and ‘dead/stagnant ice’. As for our research, given that many of the 321 very small glacierets derived from larger glaciers mapped almost 50 years ago, based on aerial photographic surveys from 1955 (Table 2, DGA (1979)), we find it pertinent to still refer to them as glaciers, or glacierets being the case.
As concluding remarks, we seek to contribute a small update to the IPG2022, subtracting up to 321 very small glacierets. Whether all 321 or just the 77 entirely vanished glacierets, according to Ugalde and others (Reference Ugalde2025), will depend on the criteria that the corresponding authorities determine to implement, which can include, even, extensive fieldwork to corroborate remotely sensed evidence (Arie and others, Reference Arie, Narama, Fukui and Iida2025; Huss and others, Reference Huss, Fischer, Linsbauer and Bauder2025). At the same time, and as the IPG2014 (Barcaza and others, Reference Barcaza2017) constitutes the Chilean dataset for the current RGI, version 7.0 (RGI 7.0 Consortium, 2023), all 139 very small glacierets recognised in the RGI version 7.0, as part of the 146 reduced very small glacierets subset (Table 1), can be directly subtracted from the GLIMS database, following the guidelines of Raup and others (Reference Raup, Andreassen, Boyer, Howe, Pelto and Rabatel2025), and thus, can also be added to the Global Glacier Casualty List (Boyer and Howe, Reference Boyer and Howe2024). This contribution, performed exclusively from high-spatial-resolution remote sensing data, can be extended to glacierets with a surface area over 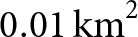 $0.01\,\mathrm{km}^2$, although such an effort is likely to be highly time-consuming.
Hydrological impacts of the vanishing of very small glacierets
Although the total loss of water equivalent ice volume sums  $5.69\times 10^6\,\mathrm{m}^3$ (Table 3), this amount is negligible when compared to the water equivalent ice volume of all glacierets, despite their surface area, accounted for within our study area (Table 3). In fact, only in the assessed portion of the Southern macrozone, (Fig. 1), the total water equivalent ice volume, according to the IPG2022 data and method (DGA, 2022), is $49.28\times 10^6\,\mathrm{m}^3$, a value that increases by an order of magnitude for the Central ( $536.83\times 10^6\,\mathrm{m}^3$) and Northern ( $196.81\times 10^6\,\mathrm{m}^3$) macrozones (Table 3). Thus, we can neglect the hydrological impacts of the vanishing of very small glacierets on a regional and/or catchment scale, although local effects should not be neglected, especially in the Northern macrozone, as it constitutes most of the Dry Andes (Masiokas and others, Reference Masiokas2020). Overall, it is very likely that most of the vanished very small glacierets saw their disappearance as a consequence of two of the driest reported years, 2019 and 2021, of the Central Andes (Garreaud and others, Reference Garreaud2025). Thus, the very small glacieret’s area-reduction trend that such vanishing phenomena represent is one of the key points of our results, which aligns with current findings regarding glacier loss (Ayala and others, Reference Ayala2025; Schuster and others, Reference Schuster2025; Van Tricht and others, Reference Van Tricht2026).
Regarding the snowline elevation evolution and its relationship with the vanishing of very small glacierets, in the Northern Andes, all five analysed catchments within the Northern macrozone (Figs. 1 and 3d) show rising  $Z_{\text{SL}}$ trends. However, only Elqui (043) and Limarí (045) show statistically significant trends at annual and seasonal scales. The clearest seasonal signal occurs in austral winter for the Northern macrozone (July-August-September, JAS, Fig. 3d), potentially associated with reduced snow accumulation and enhanced ablation, particularly sublimation, in high-elevation headwaters. In contrast, catchments at the Southern macrozone show weak or non-significant $Z_{\text{SL}}$ trends, with some exhibiting slight decreases (Fig. 3d). Nevertheless, a moderate upward trend is detected in austral spring (OND) for all macrozones throughout the study area (Figs. 1 and 3d), possibly linked to warmer temperatures and reduced snow accumulation in recent years.
These findings support the hypothesis that very small glacierets are particularly vulnerable to recent atmospheric warming (Schuster and others, Reference Schuster2025; Van Tricht and others, Reference Van Tricht2026), with the Central and Northern Andes showing clear evidence of  $Z_{\text{0C}}$ and $Z_{\text{SL}}$ elevation rise. This phenomenon becomes particularly relevant when compared with the lowest elevation of the total dataset of very small glacierets. In the case of the Central macrozone, 35% of the subsample lay above the 2024 $Z_{\text{0C}}$ elevation close to 3600 m a.s.l. (Fig. 3b), whereas for the Northern macrozone this value increments to 79% compared to the $Z_{\text{0C}}$ elevation of 4900 m a.s.l. observed for the same year (Fig. 3a). This climatic forcing likely contributes to the very small glacierets retreat and, in many cases, local vanishing. Such trends emphasise the urgent need for continuous monitoring and regionally tailored adaptation strategies in water resource management and cryosphere conservation.
Conclusions
We have presented a chronicle on the vanishing of 321 very small glacierets in the Northern and Central Andes of Chile. Of the whole analysed dataset, 146 very small glacierets vanished after receding from a single large glacier in each case. 50% of the very small glacierets in the Northern and Central macrozones vanished within five years after their inclusion in the latest version of the Chilean Public Glacier Inventory, IPG2022. In particular, in the Central macrozone, where most of the vanished glacierets were located, 20% vanished after two of the driest years in the historical record, 2019 and 2021. Our findings are in agreement with increasing trends in  $Z_{\text{0C}}$ and $Z_{\text{SL}}$ throughout the study area.
Although the hydrological significance of the water equivalent ice volume loss of  $5.69\times 10^6\,\mathrm{m}^3$ can be neglected when compared to the total estimated ice volume of all glacierets accounted for in the study area, the overall glacier area-reduction and vanishing trend poses an urgent need to keep updating local and regional glacier inventories along with continuous monitoring and regional adaptation strategies in water resource management.
Supplementary material
The supplementary material for this article can be found at https://doi.org/10.1017/aog.2026.10052.
Acknowledgements
We would like to acknowledge Geoestudios for supporting our research since the beginning of the conceptualisation process. We also acknowledge the Chilean General Water Directorate, specifically the former Glaciology and Snow Unit (UGN), for their effort in carrying out the two versions of the Chilean Public Glacier Inventory. Felipe Ugalde is funded through the Doctoral Scholarship EPEC 2026. Diego Pinto acknowledges the support from ANID-PIA Project AFB230001 (AMTC).






 Open access

