


1 Introduction
The scrape-off layer (SOL) of a tokamak plasma is a region at the outermost edge where the plasma flows unconstrained along open magnetic field lines that intersect the material wall (Stangeby Reference Stangeby2000; Stoltzfus-Dueck Reference Stoltzfus-Dueck2009). The SOL plasma sets the boundary conditions on the core confined plasma, so the ability to influence the plasma behaviour in this region and in the pedestal is key to improving overall reactor performance (Kotschenreuther et al. Reference Kotschenreuther, Dorland, Beer and Hammett1995; Dimits et al. Reference Dimits, Bateman, Beer, Cohen, Dorland, Hammett, Kim, Kinsey, Kotschenreuther and Kritz2000; Shimada et al. Reference Shimada, Campbell, Mukhovatov, Fujiwara, Kirneva, Lackner, Nagami, Pustovitov, Uckan and Wesley2007; Zweben et al. Reference Zweben, Boedo, Grulke, Hidalgo, LaBombard, Maqueda, Scarin and Terry2007; Kinsey et al. Reference Kinsey, Staebler, Candy, Waltz and Budny2011). On a basic level, plasma dynamics in the SOL involve plasma outflow from the core, cross-field turbulent transport, and parallel losses at the divertor or limiter plates (Mosetto Reference Mosetto2014), where plasma-surface interactions such as recycling and impurity influx can occur. The balance of these processes is believed to set the SOL width, which affects the location and strength of heat loads on plasma-facing components (Eich et al. Reference Eich, Leonard, Pitts, Fundamenski, Goldston, Gray, Herrmann, Kirk, Kallenbach and Kardaun2013). The ability to operate future tokamaks like ITER and DEMO with high fusion gain without the significant erosion and melting of plasma-facing components is a major challenge that necessitates a thorough understanding of SOL turbulence.
A popular approach in SOL modelling is to solve simplified transport equations based on the Braginskii fluid equations. These codes use approximate sheath boundary conditions in the parallel direction and do not capture plasma turbulence, requiring the use of ad hoc diffusion terms to model the turbulent transport across the magnetic field (Rognlien et al. Reference Rognlien, Brown, Campbell, Kaiser, Knoll, McHugh, Porter, Rensink and Smith1994; Schneider et al. Reference Schneider, Bonnin, Borrass, Coster, Kastelewicz, Reiter, Rozhansky and Braams2006). Edge turbulence codes solving three-dimensional (3D) drift-reduced Braginskii fluid equations have also been developed (Scott Reference Scott1997; Xu & Cohen Reference Xu and Cohen1998; Naulin, Windisch & Grulke Reference Naulin, Windisch and Grulke2008; Ricci, Rogers & Brunner Reference Ricci, Rogers and Brunner2008; Dudson et al. Reference Dudson, Umansky, Xu, Snyder and Wilson2009). While Braginskii fluid turbulence codes are relatively fast and have led to new insights into edge turbulence, they omit kinetic effects by approximating the plasma as highly collisional, an assumption that is typically violated in the tokamak SOL. Some codes that can include the SOL (Ribeiro & Scott Reference Ribeiro and Scott2005; Kervalishvili et al. Reference Kervalishvili, Kleiber, Schneider, Scott, Grulke and Windisch2008; Xu et al. Reference Xu, Xi, Dimits, Joseph, Umansky, Xia, Gui, Kim, Park and Rhee2013) have implemented gyrofluid models, which are more general and address these issues to some extent by incorporating finite-Larmor-radius effects and a Landau-damping model (Dorland & Hammett Reference Dorland and Hammett1993; Snyder, Hammett & Dorland Reference Snyder, Hammett and Dorland1997), but they can only approximate certain nonlinear effects, such as the treatment of energetic tails, which are important for sheath physics. For these reasons, there are efforts to develop first-principles gyrokinetic codes for edge turbulence simulation (Chang et al. Reference Chang, Ku, Diamond, Lin, Parker, Hahm and Samatova2009; Dorf et al. Reference Dorf, Dorr, Hittinger, Cohen and Rognlien2016; Korpilo et al. Reference Korpilo, Gurchenko, Gusakov, Heikkinen, Janhunen, Kiviniemi, Leerink, Niskala and Perevalov2016). Unlike Braginskii fluid approaches, gyrokinetic approaches use equations that are valid across a wide range of collisionality regimes, even if the collisional mean free path is not small compared to the parallel scale length or if the ion-drift-orbit excursions are not small compared to radial-gradient length scales (Goldston Reference Goldston2012). Gyrokinetic simulations, however, are much more computationally expensive than their fluid counterparts, so both approaches can be useful.
Continuum methods are Eulerian approaches to solve a kinetic equation (e.g. the 5D gyrokinetic equation) by discretizing the equation on a phase-space mesh. The other main class of algorithms used for plasma simulation is the particle-in-cell (PIC) method, which is essentially a Monte Carlo sampling technique that uses macroparticles to integrate along the characteristic phase-space trajectories of many gyrocentres without the need for a velocity-space grid (Krommes Reference Krommes2012). Each method has advantages, disadvantages, and challenges, and it is important to explore both approaches as independent cross-checks against each other and to guide the development of future gyrokinetic edge turbulence codes. Gyrokinetic PIC codes that include a scrape-off-layer region have been developed with various capabilities and are being extended (Korpilo et al. Reference Korpilo, Gurchenko, Gusakov, Heikkinen, Janhunen, Kiviniemi, Leerink, Niskala and Perevalov2016; Ku et al. Reference Ku, Hager, Chang, Kwon and Parker2016), while gyrokinetic continuum codes for edge simulation are less mature.
The edge region is challenging to simulate for a number of reasons, including the need to handle large-amplitude fluctuations while avoiding negative overshoots, open and closed field lines with a separatrix and X-point (which can cause difficulties with coordinates), fully electromagnetic fluctuations near the beta limit, a wide range of space and time scales, a wide range of collisionality regimes, sheath boundary conditions, plasma–wall interactions, atomic physics, and the existence of high-frequency electrostatic shear Alfvén modes (Lee Reference Lee1987; Belli & Hammett Reference Belli and Hammett2005) or sheath-interaction modes that one does not want to artificially excite. Sophisticated gyrokinetic codes for the core region of tokamaks have been developed and are highly successful, but major extensions to them or new codes are required to handle the additional challenges of the edge region.
Many of the existing core gyrokinetic codes assume small-amplitude fluctuations. Spectral techniques are commonly used in some directions, which can have problems with Gibbs phenomena that result in negative overshoots. Most algorithms used in magnetic fusion research are designed for cases in which viscous or dissipative scales are fully resolved and do not use limiters, and thus can have problems with small negative oscillations. Negative densities may cause various unphysical problems in the solution (for example, a negative density in the tail of the electron distribution function can reverse the slope of the sheath current versus sheath potential relation). Some finite-difference algorithms make it easier to calculate derivatives across the separatrix with field-aligned coordinates, but may have problems with particle conservation, and small imbalances in electron and ion gyrocentre densities may drive large electric fields.
Gkeyll is a plasma simulation code that implements several fluid and kinetic models using a variety of grid-based numerical algorithms. Recently, Gkeyll has been used for fluid studies of magnetic reconnection (Ng et al. Reference Ng, Huang, Hakim, Bhattacharjee, Stanier, Daughton, Wang and Germaschewski2015; Wang et al. Reference Wang, Hakim, Bhattacharjee and Germaschewski2015) and kinetic and multi-fluid sheath modelling (Cagas et al. Reference Cagas, Hakim, Juno and Srinivasan2017). The work presented here focuses on our efforts to implement gyrokinetic continuum algorithms in Gkeyll to investigate edge and SOL turbulence. Previously, we investigated the use of gyrokinetic continuum algorithms in a 1D1V (1 dimension in physical space, 1 dimension in velocity space) SOL with logical-sheath boundary conditions (Parker et al. Reference Parker, Procassini, Birdsall and Cohen1993) (using one and later two velocity dimensions) with encouraging results (Shi, Hakim & Hammett Reference Shi, Hakim and Hammett2015).
We are developing Gkeyll with a number of algorithmic choices to try to better handle some of the numerical challenges of the edge region. In the course of developing the code, we ran into and fixed problems related to some of the above challenges. Gkeyll at present uses a long-wavelength, full- $f$
(full distribution function) gyrokinetic formulation with a linearised polarisation term in the gyrokinetic Poisson equation. The gyrokinetic model is implemented using a discontinuous Galerkin (DG) algorithm that conserves not only particles but also energy (in the continuous time or implicit limit) for Hamiltonian terms (Liu & Shu Reference Liu and Shu2000), even if limiters (LeVeque Reference LeVeque2002; Dumbser et al.
Reference Dumbser, Balsara, Toro and Munz2008; Durran Reference Durran2010) are applied to the fluxes at cell boundaries. Limiters on boundary fluxes can only ensure positivity of cell averages (Zhang & Shu Reference Zhang and Shu2010) and we implement other limiters with correction steps to preserve positivity everywhere within a cell.
$f$
(full distribution function) gyrokinetic formulation with a linearised polarisation term in the gyrokinetic Poisson equation. The gyrokinetic model is implemented using a discontinuous Galerkin (DG) algorithm that conserves not only particles but also energy (in the continuous time or implicit limit) for Hamiltonian terms (Liu & Shu Reference Liu and Shu2000), even if limiters (LeVeque Reference LeVeque2002; Dumbser et al.
Reference Dumbser, Balsara, Toro and Munz2008; Durran Reference Durran2010) are applied to the fluxes at cell boundaries. Limiters on boundary fluxes can only ensure positivity of cell averages (Zhang & Shu Reference Zhang and Shu2010) and we implement other limiters with correction steps to preserve positivity everywhere within a cell.
In this paper, we detail our numerical approach and present results from gyrokinetic continuum simulations of electrostatic plasma turbulence in the Large Plasma Device (LAPD) at UCLA (Gekelman et al. Reference Gekelman, Pfister, Lucky, Bamber, Leneman and Maggs1991, Reference Gekelman, Pribyl, Lucky, Drandell, Leneman, Maggs, Vincena, Compernolle, Tripathi and Morales2016) using kinetic electrons with a reduced mass ratio and a single kinetic ion species. The LAPD is a linear device that creates a plasma column in a straight, open-field-line configuration. Despite its relatively low plasma temperature, the LAPD contains the basic elements of a SOL in a simplified (no X-point geometry, straight magnetic field lines, etc.), well-diagnosed setting, making this device a useful benchmark of edge gyrokinetic algorithms. The LAPD plasma’s relatively high collisionality also facilitates comparisons with Braginskii fluid codes, and good agreement between the two approaches is expected.
Our work is a gyrokinetic extension of fluid simulations of Rogers & Ricci (Reference Rogers and Ricci2010) and Popovich et al. (Reference Popovich, Umansky, Carter and Friedman2010a ), and in particular we follow much of the same simulation set-up as in Rogers & Ricci (Reference Rogers and Ricci2010). To our knowledge, these are the first 5D gyrokinetic continuum simulations on open field lines including interactions with sheath losses and are also the first 5D gyrokinetic simulations including a sheath model of a basic laboratory plasma experiment. We have also performed simulations of simple magnetised tori, in which the magnetic field lines are helical and the magnetic curvature drift is present, but we defer discussion of those results to a future publication.
2 Model
Several versions of full- $f$
gyrokinetic equations have been derived with various formulations, ordering assumptions, and levels of accuracy (Sugama Reference Sugama2000; Brizard & Hahm Reference Brizard and Hahm2007; Hahm, Wang & Madsen Reference Hahm, Wang and Madsen2009; Parra & Calvo Reference Parra and Calvo2011; Dimits Reference Dimits2012; Parra et al.
Reference Parra, Calvo, Burby, Squire and Qin2014; McMillan & Sharma Reference McMillan and Sharma2016), and can generically be written in the form of an evolution equation for the guiding centre distribution function, with a Poisson bracket for the phase-space velocities and expressions for the Lagrangian/Hamiltonian, coupled to field equations to determine the potentials. Here, we solve a long-wavelength limit of electrostatic full-
$f$
gyrokinetic equations have been derived with various formulations, ordering assumptions, and levels of accuracy (Sugama Reference Sugama2000; Brizard & Hahm Reference Brizard and Hahm2007; Hahm, Wang & Madsen Reference Hahm, Wang and Madsen2009; Parra & Calvo Reference Parra and Calvo2011; Dimits Reference Dimits2012; Parra et al.
Reference Parra, Calvo, Burby, Squire and Qin2014; McMillan & Sharma Reference McMillan and Sharma2016), and can generically be written in the form of an evolution equation for the guiding centre distribution function, with a Poisson bracket for the phase-space velocities and expressions for the Lagrangian/Hamiltonian, coupled to field equations to determine the potentials. Here, we solve a long-wavelength limit of electrostatic full- $f$
gyrokinetic equations with a linearised polarisation term for simplicity, as summarised by Idomura et al. (Reference Idomura, Urano, Aiba and Tokuda2009). As the code is further developed, it can be extended to more accurate and more general equations, though they will still have this generic structure.
$f$
gyrokinetic equations with a linearised polarisation term for simplicity, as summarised by Idomura et al. (Reference Idomura, Urano, Aiba and Tokuda2009). As the code is further developed, it can be extended to more accurate and more general equations, though they will still have this generic structure.
The fundamental assumption of standard gyrokinetics is that there is a coordinate system in which things change slowly compared to the gyrofrequency. In some gyrokinetic derivations, the ordering assumptions are written in a more restrictive form requiring that the fluctuation amplitudes must be small. But as discussed in various places (such as Hahm et al. Reference Hahm, Wang and Madsen2009; Dimits Reference Dimits2012; McMillan & Sharma Reference McMillan and Sharma2016), more general derivations that are appropriate for the edge region of fusion devices are possible, such as using a small vorticity ordering (McMillan & Sharma Reference McMillan and Sharma2016), which allows large flows and large-amplitude fluctuations at long wavelengths.
We solve a full- $f$
gyrokinetic equation written in the conservative form (Sugama Reference Sugama2000; Brizard & Hahm Reference Brizard and Hahm2007; Idomura et al.
Reference Idomura, Urano, Aiba and Tokuda2009)
$f$
gyrokinetic equation written in the conservative form (Sugama Reference Sugama2000; Brizard & Hahm Reference Brizard and Hahm2007; Idomura et al.
Reference Idomura, Urano, Aiba and Tokuda2009)
 $$\begin{eqnarray}\frac{\unicode[STIX]{x2202}{\mathcal{J}}f_{s}}{\unicode[STIX]{x2202}t}+\unicode[STIX]{x1D735}\boldsymbol{\cdot }({\mathcal{J}}\dot{\boldsymbol{R}}f_{s})+\frac{\unicode[STIX]{x2202}}{\unicode[STIX]{x2202}v_{\Vert }}({\mathcal{J}}\dot{v}_{\Vert }f_{s})={\mathcal{J}}C[f_{s}]+{\mathcal{J}}S_{s},\end{eqnarray}$$
where $f_{s}=f_{s}(\boldsymbol{R},v_{\Vert },\unicode[STIX]{x1D707},t)$
is the gyrocentre distribution function for species
$f_{s}=f_{s}(\boldsymbol{R},v_{\Vert },\unicode[STIX]{x1D707},t)$
is the gyrocentre distribution function for species $s$
,
$s$
, ${\mathcal{J}}=B_{\Vert }^{\ast }$
is the Jacobian of the gyrocentre coordinates,
${\mathcal{J}}=B_{\Vert }^{\ast }$
is the Jacobian of the gyrocentre coordinates, $B_{\Vert }^{\ast }=\boldsymbol{b}\boldsymbol{\cdot }\boldsymbol{B}^{\ast }$
,
$B_{\Vert }^{\ast }=\boldsymbol{b}\boldsymbol{\cdot }\boldsymbol{B}^{\ast }$
, $\boldsymbol{B}^{\ast }=\boldsymbol{B}+(Bv_{\Vert }/\unicode[STIX]{x1D6FA}_{s})\unicode[STIX]{x1D735}\times \boldsymbol{b}$
,
$\boldsymbol{B}^{\ast }=\boldsymbol{B}+(Bv_{\Vert }/\unicode[STIX]{x1D6FA}_{s})\unicode[STIX]{x1D735}\times \boldsymbol{b}$
, $C[f_{s}]$
represents the effects of collisions,
$C[f_{s}]$
represents the effects of collisions, $\unicode[STIX]{x1D6FA}_{s}=q_{s}B/m_{i}$
, and
$\unicode[STIX]{x1D6FA}_{s}=q_{s}B/m_{i}$
, and $S_{s}=S_{s}(\boldsymbol{R},v_{\Vert },\unicode[STIX]{x1D707},t)$
represents plasma sources (e.g. neutral ionisation or core plasma outflow). In a straight-field-line geometry,
$S_{s}=S_{s}(\boldsymbol{R},v_{\Vert },\unicode[STIX]{x1D707},t)$
represents plasma sources (e.g. neutral ionisation or core plasma outflow). In a straight-field-line geometry, $B_{\Vert }^{\ast }$
simplifies to
$B_{\Vert }^{\ast }$
simplifies to $B$
. The phase-space advection velocities are defined as
$B$
. The phase-space advection velocities are defined as $\dot{\boldsymbol{R}}=\{\boldsymbol{R},H\}$
and
$\dot{\boldsymbol{R}}=\{\boldsymbol{R},H\}$
and $\dot{v_{\Vert }}=\{v_{\Vert },H\}$
, where the gyrokinetic Poisson bracket is
$\dot{v_{\Vert }}=\{v_{\Vert },H\}$
, where the gyrokinetic Poisson bracket is
 $$\begin{eqnarray}\{F,G\}=\frac{\boldsymbol{B}^{\ast }}{m_{s}B_{\Vert }^{\ast }}\boldsymbol{\cdot }\left(\unicode[STIX]{x1D735}F\frac{\unicode[STIX]{x2202}G}{\unicode[STIX]{x2202}v_{\Vert }}-\frac{\unicode[STIX]{x2202}F}{\unicode[STIX]{x2202}v_{\Vert }}\unicode[STIX]{x1D735}G\right)-\frac{1}{q_{s}B_{\Vert }^{\ast }}\boldsymbol{b}\boldsymbol{\cdot }\unicode[STIX]{x1D735}F\times \unicode[STIX]{x1D735}G.\end{eqnarray}$$
The gyrocentre Hamiltonian is
 $$\begin{eqnarray}H_{s}={\textstyle \frac{1}{2}}m_{s}v_{\Vert }^{2}+\unicode[STIX]{x1D707}B+q_{s}\langle \unicode[STIX]{x1D719}\rangle _{\unicode[STIX]{x1D6FC}},\end{eqnarray}$$
where $\langle \unicode[STIX]{x1D719}\rangle _{\unicode[STIX]{x1D6FC}}$
is the gyro-averaged potential. In this paper, we consider a long-wavelength limit of the gyrokinetic system and neglect gyroaveraging in the Hamiltonian to take
$\langle \unicode[STIX]{x1D719}\rangle _{\unicode[STIX]{x1D6FC}}$
is the gyro-averaged potential. In this paper, we consider a long-wavelength limit of the gyrokinetic system and neglect gyroaveraging in the Hamiltonian to take $\langle \unicode[STIX]{x1D719}\rangle _{\unicode[STIX]{x1D6FC}}=\unicode[STIX]{x1D719}$
. This system has similarities to some versions of drift kinetics (and is sometimes referred to as the drift-kinetic limit of gyrokinetics (Cohen & Xu Reference Cohen and Xu2008; Dorf et al.
Reference Dorf, Dorr, Hittinger, Cohen and Rognlien2016)), but is unlike versions that include the polarisation drift in the kinetic equation or determine the potential from some other equation. In a straight-magnetic-field-line geometry, (2.1)–(2.3) reduce to the description of parallel streaming, an
$\langle \unicode[STIX]{x1D719}\rangle _{\unicode[STIX]{x1D6FC}}=\unicode[STIX]{x1D719}$
. This system has similarities to some versions of drift kinetics (and is sometimes referred to as the drift-kinetic limit of gyrokinetics (Cohen & Xu Reference Cohen and Xu2008; Dorf et al.
Reference Dorf, Dorr, Hittinger, Cohen and Rognlien2016)), but is unlike versions that include the polarisation drift in the kinetic equation or determine the potential from some other equation. In a straight-magnetic-field-line geometry, (2.1)–(2.3) reduce to the description of parallel streaming, an $E\times B$
drift and acceleration along the field line due to
$E\times B$
drift and acceleration along the field line due to $E_{\Vert }$
(see (4.4)).
$E_{\Vert }$
(see (4.4)).
The potential is solved for using the long-wavelength gyrokinetic Poisson equation with a linearised ion polarisation density
 $$\begin{eqnarray}-\!\unicode[STIX]{x1D735}_{\bot }\boldsymbol{\cdot }\left(\frac{n_{i0}^{g}q_{i}^{2}\unicode[STIX]{x1D70C}_{\text{s}0}^{2}}{T_{e0}}\unicode[STIX]{x1D735}_{\bot }\unicode[STIX]{x1D719}\right)=\unicode[STIX]{x1D70E}_{g}=q_{i}n_{i}^{g}(\boldsymbol{R})-en_{e}(\boldsymbol{R}),\end{eqnarray}$$
where $\unicode[STIX]{x1D70C}_{\text{s}0}=c_{\text{s}0}/\unicode[STIX]{x1D6FA}_{i}$
,
$\unicode[STIX]{x1D70C}_{\text{s}0}=c_{\text{s}0}/\unicode[STIX]{x1D6FA}_{i}$
, $c_{\text{s}0}=\sqrt{T_{e0}/m_{i}}$
, and
$c_{\text{s}0}=\sqrt{T_{e0}/m_{i}}$
, and $n_{i0}^{g}$
is the background ion guiding centre density that we will take to be a constant in space and in time. Gyroaveraging in the guiding centre densities is neglected in this long-wavelength limit. The replacement of
$n_{i0}^{g}$
is the background ion guiding centre density that we will take to be a constant in space and in time. Gyroaveraging in the guiding centre densities is neglected in this long-wavelength limit. The replacement of $n_{i}^{g}(\boldsymbol{R})$
by
$n_{i}^{g}(\boldsymbol{R})$
by $n_{i0}^{g}$
on the left-hand side of (2.4) is analogous to the Boussinesq approximation employed in some Braginskii fluid codes (Angus & Umansky Reference Angus and Umansky2014; Dudson et al.
Reference Dudson, Allen, Breyiannis, Brugger, Buchanan, Easy, Farley, Joseph, Kim and McGann2015; Halpern et al.
Reference Halpern, Ricci, Jolliet, Loizu, Morales, Mosetto, Musil, Riva, Tran and Wersal2016). We note that the use of a linearised ion polarisation charge density is formally valid when ion density fluctuations are small.
$n_{i0}^{g}$
on the left-hand side of (2.4) is analogous to the Boussinesq approximation employed in some Braginskii fluid codes (Angus & Umansky Reference Angus and Umansky2014; Dudson et al.
Reference Dudson, Allen, Breyiannis, Brugger, Buchanan, Easy, Farley, Joseph, Kim and McGann2015; Halpern et al.
Reference Halpern, Ricci, Jolliet, Loizu, Morales, Mosetto, Musil, Riva, Tran and Wersal2016). We note that the use of a linearised ion polarisation charge density is formally valid when ion density fluctuations are small.
Note that (2.4) is a statement of quasineutrality, where the right-hand side is the guiding-centre component of the charge density $\unicode[STIX]{x1D70E}_{g}$
, and the left-hand side is the negative of the ion polarisation charge density,
$\unicode[STIX]{x1D70E}_{g}$
, and the left-hand side is the negative of the ion polarisation charge density, $-\unicode[STIX]{x1D70E}_{pol}$
(due to the plasma response to a cross-field electric field), so this equation is equivalent to
$-\unicode[STIX]{x1D70E}_{pol}$
(due to the plasma response to a cross-field electric field), so this equation is equivalent to $0=\unicode[STIX]{x1D70E}=\unicode[STIX]{x1D70E}_{g}+\unicode[STIX]{x1D70E}_{pol}$
. Since this paper focuses on simulations of a linear device, the calculations are done in a Cartesian geometry with
$0=\unicode[STIX]{x1D70E}=\unicode[STIX]{x1D70E}_{g}+\unicode[STIX]{x1D70E}_{pol}$
. Since this paper focuses on simulations of a linear device, the calculations are done in a Cartesian geometry with $x$
and
$x$
and $y$
being used as coordinates perpendicular to the magnetic field, which lies solely in the
$y$
being used as coordinates perpendicular to the magnetic field, which lies solely in the $z$
direction. Therefore,
$z$
direction. Therefore, $\unicode[STIX]{x1D735}_{\bot }=\hat{\boldsymbol{x}}\unicode[STIX]{x2202}_{x}+\hat{\boldsymbol{y}}\unicode[STIX]{x2202}_{y}$
.
$\unicode[STIX]{x1D735}_{\bot }=\hat{\boldsymbol{x}}\unicode[STIX]{x2202}_{x}+\hat{\boldsymbol{y}}\unicode[STIX]{x2202}_{y}$
.
At present, electron–electron and ion–ion collisions are implemented using a Lenard–Bernstein model collision operator (Lenard & Bernstein Reference Lenard and Bernstein1958)
 $$\begin{eqnarray}\displaystyle C_{ss}[f_{s}] & = & \displaystyle \unicode[STIX]{x1D708}_{ss}\frac{\unicode[STIX]{x2202}}{\unicode[STIX]{x2202}\boldsymbol{v}}\boldsymbol{\cdot }\left[(\boldsymbol{v}-\boldsymbol{u}_{s})f_{s}+v_{t,ss}^{2}\frac{\unicode[STIX]{x2202}f_{s}}{\unicode[STIX]{x2202}\boldsymbol{v}}\right]\nonumber\\ \displaystyle & = & \displaystyle \unicode[STIX]{x1D708}_{ss}\frac{\unicode[STIX]{x2202}}{\unicode[STIX]{x2202}v_{\Vert }}\left[(v_{\Vert }-u_{\Vert ,s})f_{s}+v_{t,ss}^{2}\frac{\unicode[STIX]{x2202}f_{s}}{\unicode[STIX]{x2202}v_{\Vert }}\right]+\unicode[STIX]{x1D708}_{ss}\frac{\unicode[STIX]{x2202}}{\unicode[STIX]{x2202}\unicode[STIX]{x1D707}}\left[2\unicode[STIX]{x1D707}f_{s}+2\frac{m_{s}v_{t,ss}^{2}}{B}\unicode[STIX]{x1D707}\frac{\unicode[STIX]{x2202}f_{s}}{\unicode[STIX]{x2202}\unicode[STIX]{x1D707}}\right],\end{eqnarray}$$
where standard expressions are used for collision frequency $\unicode[STIX]{x1D708}_{ss}$
(Huba Reference Huba2013, p. 37),
$\unicode[STIX]{x1D708}_{ss}$
(Huba Reference Huba2013, p. 37), $n_{s}v_{t,ss}^{2}=\int \text{d}^{3}v\,(\boldsymbol{v}-\boldsymbol{u}_{s})^{2}f_{s}/3$
, and
$n_{s}v_{t,ss}^{2}=\int \text{d}^{3}v\,(\boldsymbol{v}-\boldsymbol{u}_{s})^{2}f_{s}/3$
, and $n_{s}u_{\Vert ,s}=\int \text{d}^{3}v\,v_{\Vert }f_{s}$
. This collision operator relaxes to a local Maxwellian, contains pitch-angle scattering, and conserves number, momentum, and energy. Note that the collision frequency is independent of velocity; the
$n_{s}u_{\Vert ,s}=\int \text{d}^{3}v\,v_{\Vert }f_{s}$
. This collision operator relaxes to a local Maxwellian, contains pitch-angle scattering, and conserves number, momentum, and energy. Note that the collision frequency is independent of velocity; the $v^{-3}$
dependence of the collision frequency expected for Coulomb collisions is neglected. This collision operator is long wavelength and ignores finite-gyroradius corrections, which lead to classical cross-field diffusion. This model operator represents many of the key features of the full operator, including velocity-space diffusion that preferentially damps small velocity-space scales. Collisions with neutrals are neglected at present.
$v^{-3}$
dependence of the collision frequency expected for Coulomb collisions is neglected. This collision operator is long wavelength and ignores finite-gyroradius corrections, which lead to classical cross-field diffusion. This model operator represents many of the key features of the full operator, including velocity-space diffusion that preferentially damps small velocity-space scales. Collisions with neutrals are neglected at present.
For simplicity, we also use a Lenard–Bernstein collision operator to model electron-ion collisions, rather than an operator that only causes pitch-angle scattering:
 $$\begin{eqnarray}\displaystyle C_{ei}[f_{e}]=\unicode[STIX]{x1D708}_{ei}\frac{\unicode[STIX]{x2202}}{\unicode[STIX]{x2202}v_{\Vert }}\left[(v_{\Vert }-u_{\Vert ,i})f_{e}+v_{t,ei}^{2}\frac{\unicode[STIX]{x2202}f_{e}}{\unicode[STIX]{x2202}v_{\Vert }}\right]+\unicode[STIX]{x1D708}_{ei}\frac{\unicode[STIX]{x2202}}{\unicode[STIX]{x2202}\unicode[STIX]{x1D707}}\left[2\unicode[STIX]{x1D707}f_{e}+2\frac{m_{e}v_{t,ei}^{2}}{B}\unicode[STIX]{x1D707}\frac{\unicode[STIX]{x2202}f_{e}}{\unicode[STIX]{x2202}\unicode[STIX]{x1D707}}\right], & & \displaystyle\end{eqnarray}$$
where $\unicode[STIX]{x1D708}_{ei}=\unicode[STIX]{x1D708}_{ee}/1.96$
is used in the simulations and
$\unicode[STIX]{x1D708}_{ei}=\unicode[STIX]{x1D708}_{ee}/1.96$
is used in the simulations and $n_{e}v_{t,ei}^{2}=\int \text{d}^{3}v\,(\boldsymbol{v}-\boldsymbol{u}_{i})^{2}f_{e}/3$
. The coefficients are chosen so that the electrons relax to become isotropic in the frame of the mean ion velocity, and conserves energy while losing mean momentum to the ions. Because electron–electron collisions cause both pitch-angle scattering and energy diffusion, we set
$n_{e}v_{t,ei}^{2}=\int \text{d}^{3}v\,(\boldsymbol{v}-\boldsymbol{u}_{i})^{2}f_{e}/3$
. The coefficients are chosen so that the electrons relax to become isotropic in the frame of the mean ion velocity, and conserves energy while losing mean momentum to the ions. Because electron–electron collisions cause both pitch-angle scattering and energy diffusion, we set $\unicode[STIX]{x1D708}_{ei}$
to a smaller value than
$\unicode[STIX]{x1D708}_{ei}$
to a smaller value than $\unicode[STIX]{x1D708}_{ee}$
. The corresponding small change in the ion velocity is neglected, leading to a small
$\unicode[STIX]{x1D708}_{ee}$
. The corresponding small change in the ion velocity is neglected, leading to a small $O(m_{e}/m_{i})$
violation of momentum conservation. The very slow energy exchange due to the
$O(m_{e}/m_{i})$
violation of momentum conservation. The very slow energy exchange due to the $C_{ie}$
operator is also neglected.
$C_{ie}$
operator is also neglected.
2.1 Numerical algorithms
An energy-conserving (in the continuous-time limit) discontinuous Galerkin algorithm (Liu & Shu Reference Liu and Shu2000) is used to discretise the equations in space. Although Liu & Shu (Reference Liu and Shu2000) presented their algorithm for the two-dimensional incompressible Euler and Navier–Stokes equations, we recognised the general applicability of their algorithm for Hamiltonian systems. Upwind interface fluxes are used in (2.1) (interface flux terms appear after integrating by parts the product of (2.1) and a test function). This algorithm requires that the Hamiltonian be represented on a continuous subset of the basis set used to represent the distribution function. Therefore, the distribution function is represented using discontinuous ( $C^{-1}$
) polynomials, while the electrostatic potential is represented using continuous (
$C^{-1}$
) polynomials, while the electrostatic potential is represented using continuous ( $C^{0}$
) polynomials (equivalent to continuous finite elements).
$C^{0}$
) polynomials (equivalent to continuous finite elements).
Liu & Shu (Reference Liu and Shu2000) presented their algorithm for 2D incompressible Euler equations in a vorticity-streamfunction form: $\unicode[STIX]{x2202}\unicode[STIX]{x1D70C}(x,y,t)/\unicode[STIX]{x2202}t+\unicode[STIX]{x1D735}\boldsymbol{\cdot }(\boldsymbol{u}\unicode[STIX]{x1D70C})=0$
, with the streamfunction
$\unicode[STIX]{x2202}\unicode[STIX]{x1D70C}(x,y,t)/\unicode[STIX]{x2202}t+\unicode[STIX]{x1D735}\boldsymbol{\cdot }(\boldsymbol{u}\unicode[STIX]{x1D70C})=0$
, with the streamfunction $\unicode[STIX]{x1D713}$
given by
$\unicode[STIX]{x1D713}$
given by $\unicode[STIX]{x1D6FB}^{2}\unicode[STIX]{x1D713}=\unicode[STIX]{x1D70C}$
and the velocity
$\unicode[STIX]{x1D6FB}^{2}\unicode[STIX]{x1D713}=\unicode[STIX]{x1D70C}$
and the velocity $\boldsymbol{u}=\unicode[STIX]{x1D735}^{\bot }\unicode[STIX]{x1D713}=(-\unicode[STIX]{x2202}_{y}\unicode[STIX]{x1D713},\unicode[STIX]{x2202}_{x}\unicode[STIX]{x1D713})$
. They showed analytically that the DG spatial discretisation of these equations conserves energy if the basis functions for
$\boldsymbol{u}=\unicode[STIX]{x1D735}^{\bot }\unicode[STIX]{x1D713}=(-\unicode[STIX]{x2202}_{y}\unicode[STIX]{x1D713},\unicode[STIX]{x2202}_{x}\unicode[STIX]{x1D713})$
. They showed analytically that the DG spatial discretisation of these equations conserves energy if the basis functions for $\unicode[STIX]{x1D713}$
are in a continuous subspace of the basis functions used for the vorticity
$\unicode[STIX]{x1D713}$
are in a continuous subspace of the basis functions used for the vorticity $\unicode[STIX]{x1D70C}$
. (In their numerical tests, they do not use basis sets that satisfy these properties.) This problem can also be written in a Hamiltonian form
$\unicode[STIX]{x1D70C}$
. (In their numerical tests, they do not use basis sets that satisfy these properties.) This problem can also be written in a Hamiltonian form $\unicode[STIX]{x2202}\unicode[STIX]{x1D70C}/\unicode[STIX]{x2202}t=-\{\unicode[STIX]{x1D713},\unicode[STIX]{x1D70C}\}$
, where
$\unicode[STIX]{x2202}\unicode[STIX]{x1D70C}/\unicode[STIX]{x2202}t=-\{\unicode[STIX]{x1D713},\unicode[STIX]{x1D70C}\}$
, where $\unicode[STIX]{x1D713}$
is the Hamiltonian and the Poisson bracket in this case is
$\unicode[STIX]{x1D713}$
is the Hamiltonian and the Poisson bracket in this case is $\{\unicode[STIX]{x1D713},\unicode[STIX]{x1D70C}\}=\unicode[STIX]{x2202}_{x}\unicode[STIX]{x1D713}\unicode[STIX]{x2202}_{y}\unicode[STIX]{x1D70C}-\unicode[STIX]{x2202}_{y}\unicode[STIX]{x1D713}\unicode[STIX]{x2202}_{x}\unicode[STIX]{x1D70C}$
. All of the steps of their proof can be generalised for general Hamiltonian systems.
$\{\unicode[STIX]{x1D713},\unicode[STIX]{x1D70C}\}=\unicode[STIX]{x2202}_{x}\unicode[STIX]{x1D713}\unicode[STIX]{x2202}_{y}\unicode[STIX]{x1D70C}-\unicode[STIX]{x2202}_{y}\unicode[STIX]{x1D713}\unicode[STIX]{x2202}_{x}\unicode[STIX]{x1D70C}$
. All of the steps of their proof can be generalised for general Hamiltonian systems.
Following a standard finite-element approach, in order to satisfy continuity constraints on the potential, we project the gyrokinetic Poisson equation onto the space of basis functions for the potential, yielding a single non-local 3D solve to find the potential. There are ways to instead do a set of independent 2D solves, followed by a local self-adjoint smoothing/interpolation operation, but we have not yet implemented this approach. Although a non-local solve in three dimensions is required for the potential, the 5D gyrokinetic equation itself can be solved in a highly local manner. Second-order derivatives, which are present in the collision operator, are calculated using the recovery-based discontinuous Galerkin method (van Leer & Nomura Reference van Leer and Nomura2005), which has the desirable property of producing symmetric solutions. The collision operator is constructed to numerically conserve number and energy, while momentum was found to be conserved to a relative error of ${\sim}10^{-6}$
over a 10
${\sim}10^{-6}$
over a 10 $\unicode[STIX]{x03BC}\text{s}$
period in a spatially 0D test. Time stepping is performed using an explicit third-order strong-stability-preserving Runge–Kutta algorithm (Gottlieb, Shu & Tadmor Reference Gottlieb, Shu and Tadmor2001). We use rectangular meshes with uniform cell spacing, but we note that the DG algorithms used are also applicable to non-uniform and non-rectangular meshes.
$\unicode[STIX]{x03BC}\text{s}$
period in a spatially 0D test. Time stepping is performed using an explicit third-order strong-stability-preserving Runge–Kutta algorithm (Gottlieb, Shu & Tadmor Reference Gottlieb, Shu and Tadmor2001). We use rectangular meshes with uniform cell spacing, but we note that the DG algorithms used are also applicable to non-uniform and non-rectangular meshes.
For simplicity, we use nodal, linear basis functions to approximate the solution in each element. This leads to $32$
degrees of freedom per cell in the 5D phase-space mesh (
$32$
degrees of freedom per cell in the 5D phase-space mesh ( $8$
degrees of freedom in the 3D configuration-space mesh). With the
$8$
degrees of freedom in the 3D configuration-space mesh). With the $32$
degrees of freedom specified in a cell, the value of
$32$
degrees of freedom specified in a cell, the value of $f$
can be computed anywhere within the cell without additional approximation. The choice of a linear-polynomial basis set means that
$f$
can be computed anywhere within the cell without additional approximation. The choice of a linear-polynomial basis set means that $v_{\Vert }^{2}$
, which appears in the Hamiltonian (2.3), cannot be exactly represented. We therefore approximate
$v_{\Vert }^{2}$
, which appears in the Hamiltonian (2.3), cannot be exactly represented. We therefore approximate $v_{\Vert }^{2}$
in the linear basis set by requiring that the piecewise-linear approximation equal
$v_{\Vert }^{2}$
in the linear basis set by requiring that the piecewise-linear approximation equal $v_{\Vert }^{2}$
at the DG nodes. These nodes are located on the vertices of uniform rectangular cells, so the nodes of cell
$v_{\Vert }^{2}$
at the DG nodes. These nodes are located on the vertices of uniform rectangular cells, so the nodes of cell $j$
either have
$j$
either have $v_{\Vert }=v_{c,j}-\unicode[STIX]{x0394}v_{\Vert }/2$
or
$v_{\Vert }=v_{c,j}-\unicode[STIX]{x0394}v_{\Vert }/2$
or $v_{\Vert }=v_{c,j}+\unicode[STIX]{x0394}v_{\Vert }/2$
, where
$v_{\Vert }=v_{c,j}+\unicode[STIX]{x0394}v_{\Vert }/2$
, where $v_{c,j}$
is the
$v_{c,j}$
is the $v_{\Vert }$
coordinate of the centre of cell
$v_{\Vert }$
coordinate of the centre of cell $j$
. By approximating
$j$
. By approximating $v_{\Vert }^{2}$
in such a manner,
$v_{\Vert }^{2}$
in such a manner, $v_{\Vert }^{2}$
will vary linearly in cell
$v_{\Vert }^{2}$
will vary linearly in cell $j$
from
$j$
from $(v_{c,j}-\unicode[STIX]{x0394}v_{\Vert }/2)^{2}$
to
$(v_{c,j}-\unicode[STIX]{x0394}v_{\Vert }/2)^{2}$
to $(v_{c,j}+\unicode[STIX]{x0394}v_{\Vert }/2)^{2}$
. Note that the approximated
$(v_{c,j}+\unicode[STIX]{x0394}v_{\Vert }/2)^{2}$
. Note that the approximated $v_{\Vert }^{2}$
is continuous across elements, as required for numerical energy conservation, and its first derivative is discontinuous across elements, i.e.
$v_{\Vert }^{2}$
is continuous across elements, as required for numerical energy conservation, and its first derivative is discontinuous across elements, i.e. $\unicode[STIX]{x2202}_{v_{\Vert }}H=v_{c,j}$
. Integration is performed using Legendre–Gauss quadrature, ensuring that the number of quadrature points used is sufficient to evaluate every required integral exactly.
$\unicode[STIX]{x2202}_{v_{\Vert }}H=v_{c,j}$
. Integration is performed using Legendre–Gauss quadrature, ensuring that the number of quadrature points used is sufficient to evaluate every required integral exactly.
2.1.1 Positivity of the distribution function
We found it necessary to adjust the distribution function of each species at every time step so that $f_{s}\geqslant 0$
at every node to avoid stability issues. After much investigation, the main source of negativity in the distribution function appears to be the collision operator at locations where the perpendicular temperature of the distribution function is close to the lowest perpendicular temperature that can be represented on the grid.
$f_{s}\geqslant 0$
at every node to avoid stability issues. After much investigation, the main source of negativity in the distribution function appears to be the collision operator at locations where the perpendicular temperature of the distribution function is close to the lowest perpendicular temperature that can be represented on the grid.
If one considers a velocity-space grid made of uniform cells with widths $\unicode[STIX]{x0394}v_{\Vert }$
and
$\unicode[STIX]{x0394}v_{\Vert }$
and $\unicode[STIX]{x0394}\unicode[STIX]{x1D707}$
in the parallel and perpendicular coordinates, the minimum temperatures for a realizable distribution are computed by assuming that the distribution function is non-zero at the node located at
$\unicode[STIX]{x0394}\unicode[STIX]{x1D707}$
in the parallel and perpendicular coordinates, the minimum temperatures for a realizable distribution are computed by assuming that the distribution function is non-zero at the node located at $(v_{\Vert }=0,\unicode[STIX]{x1D707}=0)$
and 0 at all other nodes. Using piecewise-linear basis functions,
$(v_{\Vert }=0,\unicode[STIX]{x1D707}=0)$
and 0 at all other nodes. Using piecewise-linear basis functions,
 $$\begin{eqnarray}\displaystyle & \displaystyle T_{\Vert ,min}=\frac{m}{6}\left(\unicode[STIX]{x0394}v_{\Vert }\right)^{2} & \displaystyle\end{eqnarray}$$
 $$\begin{eqnarray}\displaystyle & \displaystyle T_{\bot ,min}=\frac{B}{3}\unicode[STIX]{x0394}\unicode[STIX]{x1D707} & \displaystyle\end{eqnarray}$$
 $$\begin{eqnarray}\displaystyle & \displaystyle T_{min}={\textstyle \frac{1}{3}}(T_{\Vert ,min}+2T_{\bot ,min}). & \displaystyle\end{eqnarray}$$
Typical values of $\unicode[STIX]{x0394}v_{\Vert }$
and
$\unicode[STIX]{x0394}v_{\Vert }$
and $\unicode[STIX]{x0394}\unicode[STIX]{x1D707}$
for a uniformly spaced grid that contains a few
$\unicode[STIX]{x0394}\unicode[STIX]{x1D707}$
for a uniformly spaced grid that contains a few $v_{t}=\sqrt{T/m}$
can result in
$v_{t}=\sqrt{T/m}$
can result in $T_{\Vert ,min}<T_{\bot ,min}$
. A situation can occur in which the collision operator will try to relax the
$T_{\Vert ,min}<T_{\bot ,min}$
. A situation can occur in which the collision operator will try to relax the $T_{\bot }$
at a location to a value below
$T_{\bot }$
at a location to a value below $T_{\bot ,min}$
, resulting in negative-valued regions appearing in the distribution function.
$T_{\bot ,min}$
, resulting in negative-valued regions appearing in the distribution function.
This positivity issue can altogether be avoided by choosing a velocity-space grid that has $T_{\Vert ,min}=T_{\bot ,min}=T_{min}$
, either by increasing the resolution in
$T_{\Vert ,min}=T_{\bot ,min}=T_{min}$
, either by increasing the resolution in $\unicode[STIX]{x1D707}$
relative to the resolution in
$\unicode[STIX]{x1D707}$
relative to the resolution in $v_{\Vert }$
, using a non-uniformly spaced grid in
$v_{\Vert }$
, using a non-uniformly spaced grid in $\unicode[STIX]{x1D707}$
, using non-polynomial basis functions (Yuan & Shu Reference Yuan and Shu2006) that guarantee the positivity of the distribution function, or using
$\unicode[STIX]{x1D707}$
, using non-polynomial basis functions (Yuan & Shu Reference Yuan and Shu2006) that guarantee the positivity of the distribution function, or using $\sqrt{\unicode[STIX]{x1D707}}$
as a coordinate instead of
$\sqrt{\unicode[STIX]{x1D707}}$
as a coordinate instead of $\unicode[STIX]{x1D707}$
. For now, we use a simpler correction procedure described in this section, which has a philosophy similar to the correction operator used by Taitano et al. (Reference Taitano, Chacón, Simakov and Molvig2015). The magnitude of the correction operator scales with the truncation error of the method, and so it vanishes as the grid is refined and does not affect the order of accuracy of the algorithm while making the simulation more robust on coarse grids by preserving key conservation laws.
$\unicode[STIX]{x1D707}$
. For now, we use a simpler correction procedure described in this section, which has a philosophy similar to the correction operator used by Taitano et al. (Reference Taitano, Chacón, Simakov and Molvig2015). The magnitude of the correction operator scales with the truncation error of the method, and so it vanishes as the grid is refined and does not affect the order of accuracy of the algorithm while making the simulation more robust on coarse grids by preserving key conservation laws.
For use in these initial simulations, we developed a relatively simple positivity-adjustment procedure to eliminate the negative-valued nodes of the distribution functions, while keeping the number density and thermal energy unchanged. First, the number density, parallel energy, perpendicular energy, and parallel momentum for each species are computed. Next, all negative-valued nodes of the distribution functions are set to zero, resulting in changes to the thermal energy and density at locations where the distribution functions have been modified. To compensate for the increased density, the distribution function is scaled uniformly in velocity space at each configuration-space node to restore the original density.
The remaining task is to modify the distribution function so that no additional energy is added through the positivity-adjustment procedure. To remove parallel thermal energy $\int \text{d}^{3}v\,m_{s}v_{\Vert }^{2}f_{s}/2$
added through the positivity-adjustment procedure, we use a numerical drag term of the form
$\int \text{d}^{3}v\,m_{s}v_{\Vert }^{2}f_{s}/2$
added through the positivity-adjustment procedure, we use a numerical drag term of the form
 $$\begin{eqnarray}\frac{\unicode[STIX]{x2202}f}{\unicode[STIX]{x2202}t}=\frac{\unicode[STIX]{x2202}}{\unicode[STIX]{x2202}v_{\Vert }}[\unicode[STIX]{x1D6FC}_{corr,v_{\Vert }}(v_{\Vert }-u_{\Vert })f],\end{eqnarray}$$
where $\unicode[STIX]{x1D6FC}_{corr,v_{\Vert }}$
is a small numerical correction drag rate that is chosen each time step to remove the extra parallel energy added. To guarantee that the numerical drag term will not cause any nodes to go negative, this operator is implemented in a finite-volume sense, adjusting the mean values:
$\unicode[STIX]{x1D6FC}_{corr,v_{\Vert }}$
is a small numerical correction drag rate that is chosen each time step to remove the extra parallel energy added. To guarantee that the numerical drag term will not cause any nodes to go negative, this operator is implemented in a finite-volume sense, adjusting the mean values:
 $$\begin{eqnarray}\frac{\bar{f}_{j}^{n+1}-\bar{f}_{j}^{n}}{\unicode[STIX]{x0394}t}=\frac{\unicode[STIX]{x1D6FC}_{corr,v_{\Vert }}}{\unicode[STIX]{x0394}v_{\Vert }}((v_{\Vert }-u_{\Vert })_{j+1/2}\hat{f}_{j+1/2}^{n}-(v_{\Vert }-u_{\Vert })_{j-1/2}\hat{f}_{j-1/2}^{n}),\end{eqnarray}$$
where the interface flux $\hat{f}_{j+1/2}^{n}=g(\bar{f}_{j}^{n},\bar{f}_{j+1}^{n})$
is chosen in an upwind sense according to the sign of
$\hat{f}_{j+1/2}^{n}=g(\bar{f}_{j}^{n},\bar{f}_{j+1}^{n})$
is chosen in an upwind sense according to the sign of $v_{\Vert }-u_{\Vert }$
and
$v_{\Vert }-u_{\Vert }$
and $\bar{f}_{j}$
denotes the cell-averaged value of
$\bar{f}_{j}$
denotes the cell-averaged value of $f_{j}$
. To ensure that the parallel drag term does not modify the perpendicular energy
$f_{j}$
. To ensure that the parallel drag term does not modify the perpendicular energy $\int \text{d}^{3}v\,(1/2)m_{s}v_{\bot }^{2}\,f_{s}$
, this operator is applied at fixed
$\int \text{d}^{3}v\,(1/2)m_{s}v_{\bot }^{2}\,f_{s}$
, this operator is applied at fixed $(\boldsymbol{R},\unicode[STIX]{x1D707})$
. In our tests, we found that
$(\boldsymbol{R},\unicode[STIX]{x1D707})$
. In our tests, we found that $\unicode[STIX]{x1D6FC}_{corr,v_{\Vert }}$
cannot be generally chosen to restore the parallel thermal energy at every position-space node, since there is a limit on how large
$\unicode[STIX]{x1D6FC}_{corr,v_{\Vert }}$
cannot be generally chosen to restore the parallel thermal energy at every position-space node, since there is a limit on how large $\unicode[STIX]{x1D6FC}_{corr,v_{\Vert }}$
can be while keeping
$\unicode[STIX]{x1D6FC}_{corr,v_{\Vert }}$
can be while keeping $\bar{f}_{j}\geqslant 0$
in every cell. Instead, we choose
$\bar{f}_{j}\geqslant 0$
in every cell. Instead, we choose $\unicode[STIX]{x1D6FC}_{corr,v_{\Vert }}$
to restore the cell-averaged parallel energy
$\unicode[STIX]{x1D6FC}_{corr,v_{\Vert }}$
to restore the cell-averaged parallel energy
 $$\begin{eqnarray}\bar{W}_{\Vert ,j}=\int _{x_{j}-\unicode[STIX]{x0394}x/2}^{x_{j}+\unicode[STIX]{x0394}x/2}\text{d}x\int _{y_{j}-\unicode[STIX]{x0394}y/2}^{y_{j}+\unicode[STIX]{x0394}y/2}\text{d}y\int _{z_{j}-\unicode[STIX]{x0394}z/2}^{z_{j}+\unicode[STIX]{x0394}z/2}\text{d}z\int \text{d}^{3}v\,\frac{1}{2}m_{s}v_{\Vert }^{2}f_{s},\end{eqnarray}$$
which results in some position-space diffusion of energy.
We employ a similar procedure to remove the unphysical perpendicular energy added through positivity:
 $$\begin{eqnarray}\frac{\unicode[STIX]{x2202}f}{\unicode[STIX]{x2202}t}=\frac{\unicode[STIX]{x2202}}{\unicode[STIX]{x2202}\unicode[STIX]{x1D707}}(2\unicode[STIX]{x1D6FC}_{corr,\unicode[STIX]{x1D707}}\unicode[STIX]{x1D707}f).\end{eqnarray}$$
Here, the factor $\unicode[STIX]{x1D6FC}_{corr,\unicode[STIX]{x1D707}}$
is chosen to restore the cell-averaged perpendicular energy. Similarly, this operation modifies the perpendicular energy without changing the parallel energy. Generally speaking, all of the parallel energy added through positivity can usually be removed through the numerical drag operator while a small amount (
$\unicode[STIX]{x1D6FC}_{corr,\unicode[STIX]{x1D707}}$
is chosen to restore the cell-averaged perpendicular energy. Similarly, this operation modifies the perpendicular energy without changing the parallel energy. Generally speaking, all of the parallel energy added through positivity can usually be removed through the numerical drag operator while a small amount ( ${<}10\,\%$
) of perpendicular energy added through positivity remains even after applying the numerical drag operator, a consequence from the choice of a uniformly spaced grid in
${<}10\,\%$
) of perpendicular energy added through positivity remains even after applying the numerical drag operator, a consequence from the choice of a uniformly spaced grid in $\unicode[STIX]{x1D707}$
(energy is typically added in the distribution function tails, so a uniformly spaced energy grid will be more constrained than a quadratically spaced energy grid in removing energy added through positivity using a numerical drag operator). We observe that much of the extra energy added through the positivity-adjustment procedure are in cells located in the outer region
$\unicode[STIX]{x1D707}$
(energy is typically added in the distribution function tails, so a uniformly spaced energy grid will be more constrained than a quadratically spaced energy grid in removing energy added through positivity using a numerical drag operator). We observe that much of the extra energy added through the positivity-adjustment procedure are in cells located in the outer region $r>0.4$
m and near the boundaries in the parallel direction where much of it may be quickly lost in the outflows through the sheaths, so we think the extra energy added will not have a significant impact on the turbulence characteristics in the main part of the simulation. (Our present model for the physical source is uniform in
$r>0.4$
m and near the boundaries in the parallel direction where much of it may be quickly lost in the outflows through the sheaths, so we think the extra energy added will not have a significant impact on the turbulence characteristics in the main part of the simulation. (Our present model for the physical source is uniform in $z$
, but there may be a localised source from recycling near the real end plates, which may offset the need for the numerical positivity source there.)
$z$
, but there may be a localised source from recycling near the real end plates, which may offset the need for the numerical positivity source there.)
3 Sheath boundary conditions
Debye sheaths form at the plasma–material interface, such as where open magnetic field lines intersect a divertor or limiter. The sheath width is of order the Debye length and forms on a time scale of order the plasma period, which are both very disparate scales compared to the turbulence scales of interest in gyrokinetics, so it is natural and desirable to treat the sheath through model boundary conditions to avoid the need to directly resolve it. For example, the Debye length in LAPD is ( ${\sim}10^{-5}$
m), which is very small compared to the gyroradius (
${\sim}10^{-5}$
m), which is very small compared to the gyroradius ( ${\sim}10^{-2}$
m) and even smaller compared to the parallel scales of the turbulence (
${\sim}10^{-2}$
m) and even smaller compared to the parallel scales of the turbulence ( ${\sim}10$
m). The plasma frequency is
${\sim}10$
m). The plasma frequency is ${\sim}10^{11}~\text{s}^{-1}$
, which is much larger compared to the ion gyrofrequency (
${\sim}10^{11}~\text{s}^{-1}$
, which is much larger compared to the ion gyrofrequency ( ${\sim}10^{6}~\text{s}^{-1}$
), and even larger than the turbulence frequencies of interest (
${\sim}10^{6}~\text{s}^{-1}$
), and even larger than the turbulence frequencies of interest ( $\unicode[STIX]{x1D714}_{\ast }\sim 10^{4}~\text{s}^{-1}$
at
$\unicode[STIX]{x1D714}_{\ast }\sim 10^{4}~\text{s}^{-1}$
at $k_{\unicode[STIX]{x1D703}}\unicode[STIX]{x1D70C}_{\text{s}0}\sim 0.3$
). Furthermore, the quasineutrality and low-frequency assumptions of gyrokinetics break down in the sheath, so gyrokinetic models cannot directly handle sheaths. There is also a transition region between the collisional upstream region and the collisionless sheath, with a width of order the mean free path. This region not resolved in the present simulations.
$k_{\unicode[STIX]{x1D703}}\unicode[STIX]{x1D70C}_{\text{s}0}\sim 0.3$
). Furthermore, the quasineutrality and low-frequency assumptions of gyrokinetics break down in the sheath, so gyrokinetic models cannot directly handle sheaths. There is also a transition region between the collisional upstream region and the collisionless sheath, with a width of order the mean free path. This region not resolved in the present simulations.
We use (2.4) to solve for the potential $\unicode[STIX]{x1D719}(x,y,z)$
everywhere in the simulation domain. The sheath potential
$\unicode[STIX]{x1D719}(x,y,z)$
everywhere in the simulation domain. The sheath potential $\unicode[STIX]{x1D719}_{sh}(x,y)$
on each boundary in
$\unicode[STIX]{x1D719}_{sh}(x,y)$
on each boundary in $z$
(where the field lines intersect the wall) is obtained by simply evaluating
$z$
(where the field lines intersect the wall) is obtained by simply evaluating $\unicode[STIX]{x1D719}$
on that boundary, so at the lower boundary,
$\unicode[STIX]{x1D719}$
on that boundary, so at the lower boundary, $\unicode[STIX]{x1D719}_{sh}(x,y)=\unicode[STIX]{x1D719}(x,y,-L_{z}/2)$
. The wall is taken to be just outside the simulation domain and the wall potential
$\unicode[STIX]{x1D719}_{sh}(x,y)=\unicode[STIX]{x1D719}(x,y,-L_{z}/2)$
. The wall is taken to be just outside the simulation domain and the wall potential $\unicode[STIX]{x1D719}_{w}$
is 0 for a grounded wall. Outgoing particles with
$\unicode[STIX]{x1D719}_{w}$
is 0 for a grounded wall. Outgoing particles with $(1/2)m_{s}v_{\Vert }^{2}<-q_{s}(\unicode[STIX]{x1D719}_{sh}-\unicode[STIX]{x1D719}_{w})$
are reflected (e.g. when
$(1/2)m_{s}v_{\Vert }^{2}<-q_{s}(\unicode[STIX]{x1D719}_{sh}-\unicode[STIX]{x1D719}_{w})$
are reflected (e.g. when $\unicode[STIX]{x1D719}_{sh}$
is positive, some electrons will be reflected), while the rest of the outgoing particles leave the simulation domain. This procedure is analogous to how some fluid codes determine
$\unicode[STIX]{x1D719}_{sh}$
is positive, some electrons will be reflected), while the rest of the outgoing particles leave the simulation domain. This procedure is analogous to how some fluid codes determine $\unicode[STIX]{x1D719}$
everywhere (including the sheath potential) from the fluid vorticity equation and then use the sheath potential to set the boundary condition on the parallel electron velocity (sometimes called a conducting-wall boundary condition) (Xu & Cohen Reference Xu and Cohen1998; Rogers & Ricci Reference Rogers and Ricci2010; Friedman et al.
Reference Friedman, Carter, Umansky, Schaffner and Joseph2013).
$\unicode[STIX]{x1D719}$
everywhere (including the sheath potential) from the fluid vorticity equation and then use the sheath potential to set the boundary condition on the parallel electron velocity (sometimes called a conducting-wall boundary condition) (Xu & Cohen Reference Xu and Cohen1998; Rogers & Ricci Reference Rogers and Ricci2010; Friedman et al.
Reference Friedman, Carter, Umansky, Schaffner and Joseph2013).
Note that our present sheath model for electrons is different than the logical sheath model (Parker et al.
Reference Parker, Procassini, Birdsall and Cohen1993), which determines the sheath potential each time step by requiring that the electron flux match the ion flux at each point on the wall so there is no current to the wall (this might be considered a model for an insulating wall). In the present conducting wall approach, the sheath potential is determined by other effects (the gyrokinetic Poisson equation or the related fluid vorticity equation), and then used to determine what fraction of electrons are reflected and thus the resulting currents to the wall. If one starts with an initial condition where $\unicode[STIX]{x1D70E}_{g}=0$
in (2.4) so
$\unicode[STIX]{x1D70E}_{g}=0$
in (2.4) so $\unicode[STIX]{x1D719}=0$
, then electrons will rapidly leave the plasma, causing the guiding centre charge
$\unicode[STIX]{x1D719}=0$
, then electrons will rapidly leave the plasma, causing the guiding centre charge $\unicode[STIX]{x1D70E}_{g}$
to rise to be positive, and thus the sheath potential will quickly rise to reflect most of the electrons and bring the sheath currents down to a much smaller level while allowing the sheath currents to self-consistently fluctuate in interactions with the turbulence. Currents are allowed to flow in and out of the wall, with current paths closing through the wall.
$\unicode[STIX]{x1D70E}_{g}$
to rise to be positive, and thus the sheath potential will quickly rise to reflect most of the electrons and bring the sheath currents down to a much smaller level while allowing the sheath currents to self-consistently fluctuate in interactions with the turbulence. Currents are allowed to flow in and out of the wall, with current paths closing through the wall.
In the code, this reflection procedure is applied at each node on the upper and lower surfaces in $z$
at the end of the simulation domain
$z$
at the end of the simulation domain $z=\pm L_{z}/2$
(adjacent to the end plates), where the reflected distribution function
$z=\pm L_{z}/2$
(adjacent to the end plates), where the reflected distribution function $f_{R}(\boldsymbol{R},v_{\Vert },\unicode[STIX]{x1D707})$
is set in ghost cells. Let us consider a case in which
$f_{R}(\boldsymbol{R},v_{\Vert },\unicode[STIX]{x1D707})$
is set in ghost cells. Let us consider a case in which $\unicode[STIX]{x1D719}_{sh}-\unicode[STIX]{x1D719}_{w}$
is positive on a node in the upper
$\unicode[STIX]{x1D719}_{sh}-\unicode[STIX]{x1D719}_{w}$
is positive on a node in the upper $z$
boundary, so low-energy outgoing electrons with
$z$
boundary, so low-energy outgoing electrons with $0<v_{\Vert }<v_{cut,e}=\sqrt{2e(\unicode[STIX]{x1D719}_{sh}-\unicode[STIX]{x1D719}_{w})/m_{e}}$
are reflected with velocity
$0<v_{\Vert }<v_{cut,e}=\sqrt{2e(\unicode[STIX]{x1D719}_{sh}-\unicode[STIX]{x1D719}_{w})/m_{e}}$
are reflected with velocity $-v_{\Vert }$
and all outgoing ions leave the simulation domain. Since the distribution function is discretised on a phase-space grid, each cell is associated with a range of parallel velocities
$-v_{\Vert }$
and all outgoing ions leave the simulation domain. Since the distribution function is discretised on a phase-space grid, each cell is associated with a range of parallel velocities $v_{c,j}-\unicode[STIX]{x0394}v_{\Vert }/2<v_{\Vert }<v_{c,j}+\unicode[STIX]{x0394}v_{\Vert }/2$
, where
$v_{c,j}-\unicode[STIX]{x0394}v_{\Vert }/2<v_{\Vert }<v_{c,j}+\unicode[STIX]{x0394}v_{\Vert }/2$
, where $v_{c,j}$
is the
$v_{c,j}$
is the $v_{\Vert }$
coordinate of the centre of cell
$v_{\Vert }$
coordinate of the centre of cell $j$
and
$j$
and $\unicode[STIX]{x0394}v_{\Vert }$
is the width of cell
$\unicode[STIX]{x0394}v_{\Vert }$
is the width of cell $j$
in the
$j$
in the $v_{\Vert }$
direction. For cells whose parallel velocity extents do not bound
$v_{\Vert }$
direction. For cells whose parallel velocity extents do not bound $v_{cut,e}$
, the reflection procedure is straightforward: find the corresponding ghost cell
$v_{cut,e}$
, the reflection procedure is straightforward: find the corresponding ghost cell $j^{\prime }$
with
$j^{\prime }$
with $v_{c,j^{\prime }}=-v_{c,j}$
and copy the solution after reflection about the
$v_{c,j^{\prime }}=-v_{c,j}$
and copy the solution after reflection about the $v_{\Vert }$
axis.
$v_{\Vert }$
axis.
In the cells whose parallel velocity extents bound $v_{cut,e}$
, the distribution function copied into the corresponding ghost cell needs to be both reflected about the
$v_{cut,e}$
, the distribution function copied into the corresponding ghost cell needs to be both reflected about the $v_{\Vert }$
axis and scaled by a factor so that the net outward flux has the correct value based on the reflection of outgoing particles with
$v_{\Vert }$
axis and scaled by a factor so that the net outward flux has the correct value based on the reflection of outgoing particles with $v_{\Vert }<v_{cut,e}$
. Due to the numerical representation of the distribution function, which is a local polynomial expansion in each configuration-space cell, it is not possible to represent a reflected distribution function that is zero for all
$v_{\Vert }<v_{cut,e}$
. Due to the numerical representation of the distribution function, which is a local polynomial expansion in each configuration-space cell, it is not possible to represent a reflected distribution function that is zero for all $v_{\Vert }<-v_{cut,e}$
unless
$v_{\Vert }<-v_{cut,e}$
unless $v_{cut,e}$
happens to lie on the boundary between two cells. Therefore, the reflected distribution function in the cutoff cell is scaled by the fraction
$v_{cut,e}$
happens to lie on the boundary between two cells. Therefore, the reflected distribution function in the cutoff cell is scaled by the fraction
 $$\begin{eqnarray}c=\frac{\displaystyle \int _{v_{j}-\unicode[STIX]{x0394}v/2}^{v_{cut,e}}\text{d}v_{\Vert }\int _{0}^{\unicode[STIX]{x1D707}_{max}}\text{d}\unicode[STIX]{x1D707}\,v_{\Vert }f_{e}}{\displaystyle \int _{v_{j}-\unicode[STIX]{x0394}v_{\Vert }/2}^{v_{j}+\unicode[STIX]{x0394}v_{\Vert }/2}\text{d}v_{\Vert }\int _{0}^{\unicode[STIX]{x1D707}_{max}}\text{d}\unicode[STIX]{x1D707}\,v_{\Vert }f_{e}},\end{eqnarray}$$
although this is just one of many choices in modifying the reflected distribution function so that the net outward flux has the correct value.
So far, we have only described the boundary condition for the electrons. The boundary condition we use for ions is the same as the one used in the logical sheath model (Parker et al.
Reference Parker, Procassini, Birdsall and Cohen1993) (a variant of which is used in the XGC gyrokinetic PIC codes (Churchill et al.
Reference Churchill, Canik, Chang, Hager, Leonard, Maingi, Nazikian and Stotler2016)): the ions just pass out freely at whatever velocity they have been accelerated to by the potential drop from the upstream source region to the sheath entrance. (This is for a normal positive sheath. In the unusual situation that the sheath potential were to go negative, then some ions would be reflected.) The only boundary condition that the sheath model imposes on the ions is that there are no incoming ions, i.e. at the incoming lower-sheath boundary we have the boundary condition that $f_{i}(x,y,z=-L_{z}/2,v_{\Vert },\unicode[STIX]{x1D707})=0$
for all
$f_{i}(x,y,z=-L_{z}/2,v_{\Vert },\unicode[STIX]{x1D707})=0$
for all $v_{\Vert }\geqslant 0$
. While this leads to a well-posed set of boundary conditions, and appears to work well and give physically reasonable results for the simulations carried out in this paper, it might need improvements in some parameter regimes.
$v_{\Vert }\geqslant 0$
. While this leads to a well-posed set of boundary conditions, and appears to work well and give physically reasonable results for the simulations carried out in this paper, it might need improvements in some parameter regimes.
3.1 Future considerations for sheath models
Sheaths have long been studied in plasma physics, including kinetic effects and angled magnetic fields, and there is a vast literature on them. The standard treatments look at steady-state results in one dimension, in which the potential is determined by solving the Poisson equation along a field line (for the case here in which the magnetic field is perpendicular to the surface), but for gyrokinetic turbulence, we need to consider time-varying fluctuations in which the sheath region needs to couple to an upstream gyrokinetic region where the potential is determined in 2D planes perpendicular to the magnetic field by solving the gyrokinetic quasineutrality equation (2.4). The details of how this matching or coupling is carried out may depend on the particular numerical algorithm used and how it represents electric fields near a boundary.
There are a range of possible sheath models of different levels of complexity and accuracy that could be considered in future work. The present model does not guarantee that the Bohm sheath criterion is met, which requires that the ion outflow velocity exceed the sound speed, $u_{\Vert i}\geqslant c_{s}$
, for a steady-state sheath and in the sheath-entrance region. However, the present simulations start at a low density and ramp up the density to an approximate steady state over a period of a few sound transit times, and during this phase, the pressure and potential drop from the central source region to the edges is large enough to accelerate ions to near-sonic velocities, with
$u_{\Vert i}\geqslant c_{s}$
, for a steady-state sheath and in the sheath-entrance region. However, the present simulations start at a low density and ramp up the density to an approximate steady state over a period of a few sound transit times, and during this phase, the pressure and potential drop from the central source region to the edges is large enough to accelerate ions to near-sonic velocities, with $u_{\Vert i}/c_{\text{s}}\approx 0.9{-}1.1$
, where
$u_{\Vert i}/c_{\text{s}}\approx 0.9{-}1.1$
, where $c_{\text{s}}=\sqrt{(T_{e}+(5/3)T_{i})/m_{i}}$
. (As we will see in figure 3, the potential drop from the centre of the simulation to the edge in
$c_{\text{s}}=\sqrt{(T_{e}+(5/3)T_{i})/m_{i}}$
. (As we will see in figure 3, the potential drop from the centre of the simulation to the edge in $z$
is larger than the electron temperature near the edge.)
$z$
is larger than the electron temperature near the edge.)
There could be other cases where the acceleration of ions in the upstream region is not strong enough to enforce the Bohm sheath criterion for a steady-state result. In such a case, some kind of rarefaction fan may propagate from near the sheath, accelerating ions back up to a sonic level. This situation is very similar to the Riemann problem for the expansion of a gas into a vacuum (Munz Reference Munz1994) or into a perfectly absorbing surface, which leads to a rarefaction wave that always maintains $u_{\Vert i}\geqslant c_{s}$
at the boundary (but also modifies the density and temperature at the outflow boundary because of the rarefaction in the expanding flow). A Riemann solver has been implemented in the two-fluid version of Gkeyll for 1D simulations that resolve the sheath (Cagas et al.
Reference Cagas, Hakim, Juno and Srinivasan2017), and the results were compared with a fully kinetic solver. Exact and approximate Riemann solvers are often used in computational fluid dynamics to determine upwind fluxes at an interface (LeVeque Reference LeVeque2002; Durran Reference Durran2010). It could be useful to work out a kinetic analogue of this process, or a kinetic model based on the approximate fluid result, but those are beyond the scope of this paper.
$u_{\Vert i}\geqslant c_{s}$
at the boundary (but also modifies the density and temperature at the outflow boundary because of the rarefaction in the expanding flow). A Riemann solver has been implemented in the two-fluid version of Gkeyll for 1D simulations that resolve the sheath (Cagas et al.
Reference Cagas, Hakim, Juno and Srinivasan2017), and the results were compared with a fully kinetic solver. Exact and approximate Riemann solvers are often used in computational fluid dynamics to determine upwind fluxes at an interface (LeVeque Reference LeVeque2002; Durran Reference Durran2010). It could be useful to work out a kinetic analogue of this process, or a kinetic model based on the approximate fluid result, but those are beyond the scope of this paper.
There is ongoing research to develop improved sheath models for fluid codes. In some past fluid simulations of LAPD, the parallel ion dynamics were neglected and modelled by sink terms to maintain a desired steady state on average (Popovich et al.
Reference Popovich, Umansky, Carter and Friedman2010b
; Friedman et al.
Reference Friedman, Carter, Umansky, Schaffner and Dudson2012, Reference Friedman, Carter, Umansky, Schaffner and Joseph2013). Rogers and Ricci included parallel ion dynamics in their fluid simulations (Ricci & Rogers Reference Ricci and Rogers2010; Rogers & Ricci Reference Rogers and Ricci2010) and imposed the boundary condition $u_{\Vert i}=c_{\text{s}}$
, thus avoiding the problem of
$u_{\Vert i}=c_{\text{s}}$
, thus avoiding the problem of $u_{\Vert i}<c_{\text{s}}$
. This could be generalised to allow
$u_{\Vert i}<c_{\text{s}}$
. This could be generalised to allow $u_{\Vert i}>c_{\text{s}}$
at the boundary to handle cases in which turbulent fluctuations or other effects give more upstream acceleration (Togo et al.
Reference Togo, Takizuka, Nakamura, Hoshino, Ibano, Lang and Ogawa2016; Dudson & Leddy Reference Dudson and Leddy2017). Loizu et al. (Reference Loizu, Ricci, Halpern and Jolliet2012) carried out a kinetic study to develop improved sheath-model boundary conditions for fluid codes that include various effects (including the magnetic pre-sheath (Chodura Reference Chodura1982) in an oblique magnetic field and the breakdown of the ion drift approximation) that have been incorporated into later versions of the GBS code (Halpern et al.
Reference Halpern, Ricci, Jolliet, Loizu, Morales, Mosetto, Musil, Riva, Tran and Wersal2016).
$u_{\Vert i}>c_{\text{s}}$
at the boundary to handle cases in which turbulent fluctuations or other effects give more upstream acceleration (Togo et al.
Reference Togo, Takizuka, Nakamura, Hoshino, Ibano, Lang and Ogawa2016; Dudson & Leddy Reference Dudson and Leddy2017). Loizu et al. (Reference Loizu, Ricci, Halpern and Jolliet2012) carried out a kinetic study to develop improved sheath-model boundary conditions for fluid codes that include various effects (including the magnetic pre-sheath (Chodura Reference Chodura1982) in an oblique magnetic field and the breakdown of the ion drift approximation) that have been incorporated into later versions of the GBS code (Halpern et al.
Reference Halpern, Ricci, Jolliet, Loizu, Morales, Mosetto, Musil, Riva, Tran and Wersal2016).
4 Simulations of LAPD
We selected the parameters for our simulations of a LAPD-like helium plasma based on those used by Rogers & Ricci (Reference Rogers and Ricci2010) in a previous Braginskii-fluid-based study, with some modifications for use in a kinetic model: $T_{e0}=6$
eV,
$T_{e0}=6$
eV, $T_{i0}=1$
eV,
$T_{i0}=1$
eV, $m_{i}=3.973m_{p}$
(
$m_{i}=3.973m_{p}$
( $m_{p}$
is the proton mass),
$m_{p}$
is the proton mass),
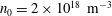
 $B=0.0398$
T, and
$B=0.0398$
T, and $n_{0}=2\times 10^{18}~\text{m}^{-3}$
. As done by Rogers & Ricci (Reference Rogers and Ricci2010), we have also used a reduced mass ratio of
$n_{0}=2\times 10^{18}~\text{m}^{-3}$
. As done by Rogers & Ricci (Reference Rogers and Ricci2010), we have also used a reduced mass ratio of $m_{e}/m_{i}=1/400$
, which allows for larger time steps to be taken but weakens the adiabatic electron response. These parameters are for a fairly collisional case with a mean free path
$m_{e}/m_{i}=1/400$
, which allows for larger time steps to be taken but weakens the adiabatic electron response. These parameters are for a fairly collisional case with a mean free path $v_{t,e}/\unicode[STIX]{x1D708}_{ee}\sim 10^{-2}$
m, and the assumption that the collision frequency is small compared to the gyrofrequency is sometimes marginal. We have reduced the collision frequency by a factor of 10 for these simulations, which increases the minimum stable explicit time step size while keeping the collisional mean free path small compared to the parallel length of the simulation box. We plan to implement an implicit or super-time-stepping algorithm for the collision operator to be able to take much larger time steps with the physical collision frequency. The rectangular simulation box (an approximation to the cylindrical LAPD plasma) has perpendicular lengths
$v_{t,e}/\unicode[STIX]{x1D708}_{ee}\sim 10^{-2}$
m, and the assumption that the collision frequency is small compared to the gyrofrequency is sometimes marginal. We have reduced the collision frequency by a factor of 10 for these simulations, which increases the minimum stable explicit time step size while keeping the collisional mean free path small compared to the parallel length of the simulation box. We plan to implement an implicit or super-time-stepping algorithm for the collision operator to be able to take much larger time steps with the physical collision frequency. The rectangular simulation box (an approximation to the cylindrical LAPD plasma) has perpendicular lengths $L_{\bot }=L_{x}=L_{y}=100\unicode[STIX]{x1D70C}_{s0}$
and parallel length
$L_{\bot }=L_{x}=L_{y}=100\unicode[STIX]{x1D70C}_{s0}$
and parallel length $L_{z}=18$
m, where
$L_{z}=18$
m, where $\unicode[STIX]{x1D70C}_{\text{s}0}=c_{\text{s}0}/\unicode[STIX]{x1D6FA}_{i}$
and
$\unicode[STIX]{x1D70C}_{\text{s}0}=c_{\text{s}0}/\unicode[STIX]{x1D6FA}_{i}$
and $c_{\text{s}0}=\sqrt{T_{e0}/m_{i}}$
. The grid parameters are summarised in table 1, with 32 degrees of freedom stored in each cell. With these parameters,
$c_{\text{s}0}=\sqrt{T_{e0}/m_{i}}$
. The grid parameters are summarised in table 1, with 32 degrees of freedom stored in each cell. With these parameters, $T_{e,min}=0.9067$
eV,
$T_{e,min}=0.9067$
eV, $T_{\Vert e,min}=0.32$
eV, and
$T_{\Vert e,min}=0.32$
eV, and $T_{\bot e,min}=1.2$
eV. For time stepping, the Courant number is set to 0.1. These simulations were run with 648 cores, taking several wall-clock days to reach a quasisteady state. This case has a very high collision frequency and the time step is limited by the present explicit algorithm for collisions. An implicit algorithm for collisions is expected to reduce the cost of these simulations by a large factor. The underlying kinetic solver parallelises well in multiple dimensions and the execution time is approximately linear in the number of cells.
$T_{\bot e,min}=1.2$
eV. For time stepping, the Courant number is set to 0.1. These simulations were run with 648 cores, taking several wall-clock days to reach a quasisteady state. This case has a very high collision frequency and the time step is limited by the present explicit algorithm for collisions. An implicit algorithm for collisions is expected to reduce the cost of these simulations by a large factor. The underlying kinetic solver parallelises well in multiple dimensions and the execution time is approximately linear in the number of cells.
Parameters for the phase-space grid used in the LAPD simulations. The temperatures appearing in the velocity-space extents are $T_{i,grid}=1$
eV and
$T_{i,grid}=1$
eV and $T_{e,grid}=3$
eV. Piecewise linear basis functions are used, resulting in 32 degrees of freedom per cell.
$T_{e,grid}=3$
eV. Piecewise linear basis functions are used, resulting in 32 degrees of freedom per cell.

Although we expect the quasisteady state of the system to be insensitive to the choice of initial conditions, we found that it was important to start the simulation with a non-uniform density profile to avoid exciting large transient potentials that resulted in extremely small restrictions being imposed on the time step. Because the boundary conditions force $\unicode[STIX]{x1D719}$
to a constant on the side walls (see § 4.1), electrons near the domain boundaries in
$\unicode[STIX]{x1D719}$
to a constant on the side walls (see § 4.1), electrons near the domain boundaries in $x$
and
$x$
and $y$
are quickly lost at thermal speeds from the simulation box. We believe that this large momentary imbalance in the electron and ion densities is the source of this stability issue.
$y$
are quickly lost at thermal speeds from the simulation box. We believe that this large momentary imbalance in the electron and ion densities is the source of this stability issue.
The initial density profile for both ions and electrons is chosen to be $n_{0}A(r;c_{edge}=1/20)$
, where
$n_{0}A(r;c_{edge}=1/20)$
, where $r=\sqrt{x^{2}+y^{2}}$
and
$r=\sqrt{x^{2}+y^{2}}$
and $A(r;c_{edge})$
is a function that falls from the peak value of
$A(r;c_{edge})$
is a function that falls from the peak value of $1$
at
$1$
at $r=0$
to a constant value
$r=0$
to a constant value $c_{edge}$
for
$c_{edge}$
for $r>L_{\bot }/2$
:
$r>L_{\bot }/2$
:
 $$\begin{eqnarray}A(r;c_{edge})=\left\{\begin{array}{@{}ll@{}}(1-c_{edge})\left(1-\displaystyle \frac{r^{2}}{(L_{\bot }/2)^{2}}\right)^{3}+c_{edge},\quad & r<L_{\bot }/2\\ c_{edge},\quad & \text{else}.\end{array}\right.\end{eqnarray}$$
The initial electron temperature profile has the form $5.7A(r;c_{edge}=1/5)$
eV, while the initial ion temperature profile is a uniform 1 eV. Both electrons and ions are initialised as non-drifting Maxwellians, although future runs could be initialised with a specified non-zero mean velocity as a function of the parallel coordinate computed from simplified 1D models (Shi et al.
Reference Shi, Hakim and Hammett2015) to reach a quasisteady state more quickly.
$5.7A(r;c_{edge}=1/5)$
eV, while the initial ion temperature profile is a uniform 1 eV. Both electrons and ions are initialised as non-drifting Maxwellians, although future runs could be initialised with a specified non-zero mean velocity as a function of the parallel coordinate computed from simplified 1D models (Shi et al.
Reference Shi, Hakim and Hammett2015) to reach a quasisteady state more quickly.
The electron and ion sources have the form
 $$\begin{eqnarray}S_{s}=1.08\frac{n_{0}c_{\text{s}0}}{L_{z}}\left\{0.01+0.99\left[\frac{1}{2}-\frac{1}{2}\tanh \left(\frac{r-r_{s}}{L_{s}}\right)\right]\right\}F_{M,s}(v_{\Vert },\unicode[STIX]{x1D707};T_{s}),\end{eqnarray}$$
where $r_{s}=20\unicode[STIX]{x1D70C}_{\text{s}0}=0.25$
m,
$r_{s}=20\unicode[STIX]{x1D70C}_{\text{s}0}=0.25$
m, $L_{s}=0.5\unicode[STIX]{x1D70C}_{\text{s}0}=0.625$
cm, and
$L_{s}=0.5\unicode[STIX]{x1D70C}_{\text{s}0}=0.625$
cm, and $F_{M,s}(v_{\Vert },\unicode[STIX]{x1D707};T_{s})$
is a normalised non-drifting Maxwellian distribution for species
$F_{M,s}(v_{\Vert },\unicode[STIX]{x1D707};T_{s})$
is a normalised non-drifting Maxwellian distribution for species $s$
with temperature
$s$
with temperature $T_{s}$
. Figure 1 shows the simulation geometry and plasma density source in the
$T_{s}$
. Figure 1 shows the simulation geometry and plasma density source in the $x$
–
$x$
– $z$
plane at
$z$
plane at $y=0$
. The ion source has a uniform temperature of 1 eV, while the electron source has a temperature profile given by
$y=0$
. The ion source has a uniform temperature of 1 eV, while the electron source has a temperature profile given by $6.8A(r;c_{edge}=1/2.5)$
eV. Unlike the sources used by Rogers & Ricci (Reference Rogers and Ricci2010), the sources we use model the neutrals as being ionised at zero mean velocity. In the fluid equations of Rogers & Ricci (Reference Rogers and Ricci2010), a zero-velocity plasma source would give rise to an additional term
$6.8A(r;c_{edge}=1/2.5)$
eV. Unlike the sources used by Rogers & Ricci (Reference Rogers and Ricci2010), the sources we use model the neutrals as being ionised at zero mean velocity. In the fluid equations of Rogers & Ricci (Reference Rogers and Ricci2010), a zero-velocity plasma source would give rise to an additional term $-S_{n}V_{\Vert i}/n$
on the right-hand side of the
$-S_{n}V_{\Vert i}/n$
on the right-hand side of the $\unicode[STIX]{x2202}_{t}V_{\Vert i}$
equation, which is kept in the more general equations of Wersal & Ricci (Reference Wersal and Ricci2015). In our simulations, electrons and ions are also sourced in the
$\unicode[STIX]{x2202}_{t}V_{\Vert i}$
equation, which is kept in the more general equations of Wersal & Ricci (Reference Wersal and Ricci2015). In our simulations, electrons and ions are also sourced in the $r>r_{s}$
region at
$r>r_{s}$
region at $1/100$
th the amplitude of the central source rate to avoid potential issues arising from zero-density regions. While there are no primary electrons in the
$1/100$
th the amplitude of the central source rate to avoid potential issues arising from zero-density regions. While there are no primary electrons in the $r>r_{s}$
region in the actual LAPD device, Carter & Maggs (Reference Carter and Maggs2009) have discussed the possibility of ionisation in this region from rotation-heated bulk electrons. Note that (4.2) does not represent the only source of energy in the system, as the positivity-adjustment procedure also results in some energy being added to the particles at large
$r>r_{s}$
region in the actual LAPD device, Carter & Maggs (Reference Carter and Maggs2009) have discussed the possibility of ionisation in this region from rotation-heated bulk electrons. Note that (4.2) does not represent the only source of energy in the system, as the positivity-adjustment procedure also results in some energy being added to the particles at large $r$
and near the sheath entrances, as discussed in § 2.1.1.
$r$
and near the sheath entrances, as discussed in § 2.1.1.
A plot of the LAPD-simulation plasma density source (in $\text{m}^{-3}~\text{s}^{-1}$
) in the
$\text{m}^{-3}~\text{s}^{-1}$
) in the $x$
–
$x$
– $z$
plane at
$z$
plane at $y=0$
. Annotations indicate the direction of the magnetic field, side-wall boundary conditions, and sheath-model boundary condition locations.
$y=0$
. Annotations indicate the direction of the magnetic field, side-wall boundary conditions, and sheath-model boundary condition locations.

4.1 Boundary conditions and energy balance
Dirichlet boundary conditions $\unicode[STIX]{x1D719}=0$
are used on the
$\unicode[STIX]{x1D719}=0$
are used on the $x$
and
$x$
and $y$
boundaries for the potential solve (taking the side walls to be grounded to the
$y$
boundaries for the potential solve (taking the side walls to be grounded to the $\unicode[STIX]{x1D719}_{w}=0$
end plates), while no boundary condition is required in
$\unicode[STIX]{x1D719}_{w}=0$
end plates), while no boundary condition is required in $z$
because (2.4) contains no
$z$
because (2.4) contains no $z$
derivatives. The distribution function uses zero-flux boundary conditions in
$z$
derivatives. The distribution function uses zero-flux boundary conditions in $x$
,
$x$
, $y$
,
$y$
, $v_{\Vert }$
, and
$v_{\Vert }$
, and $\unicode[STIX]{x1D707}$
, which amounts to zeroing out the interface flux evaluated on a boundary where zero-flux boundary conditions are to be applied. This ensures that particles are not lost through the domain boundaries in
$\unicode[STIX]{x1D707}$
, which amounts to zeroing out the interface flux evaluated on a boundary where zero-flux boundary conditions are to be applied. This ensures that particles are not lost through the domain boundaries in $x$
,
$x$
, $y$
,
$y$
, $v_{\Vert }$
, and
$v_{\Vert }$
, and $\unicode[STIX]{x1D707}$
. It should be noted that zero-flux boundary conditions on the
$\unicode[STIX]{x1D707}$
. It should be noted that zero-flux boundary conditions on the $x$
and
$x$
and $y$
boundaries are a result of the choice of a constant
$y$
boundaries are a result of the choice of a constant $\unicode[STIX]{x1D719}$
on the side-wall boundaries, so the
$\unicode[STIX]{x1D719}$
on the side-wall boundaries, so the $E\times B$
velocity at these boundaries is parallel to the wall. Sheath-model boundary conditions, discussed in the previous section, are applied on the upper and lower boundaries in the
$E\times B$
velocity at these boundaries is parallel to the wall. Sheath-model boundary conditions, discussed in the previous section, are applied on the upper and lower boundaries in the $z$
direction.
$z$
direction.
To demonstrate how the choice of $\unicode[STIX]{x1D719}=0$
affects the energy balance in our long-wavelength gyrokinetic system with a linearised polarisation term in the gyrokinetic Poisson equation, we define the plasma thermal energy as
$\unicode[STIX]{x1D719}=0$
affects the energy balance in our long-wavelength gyrokinetic system with a linearised polarisation term in the gyrokinetic Poisson equation, we define the plasma thermal energy as
 $$\begin{eqnarray}W_{K}=\int \text{d}^{3}x\mathop{\sum }_{s}\int \text{d}^{3}v\,f_{s}H_{0},\end{eqnarray}$$
where $H_{0}=(1/2)mv_{\Vert }^{2}+\unicode[STIX]{x1D707}B$
. Neglecting sources and collisions for simplicity, the gyrokinetic equation in a straight, constant magnetic field can be written as
$H_{0}=(1/2)mv_{\Vert }^{2}+\unicode[STIX]{x1D707}B$
. Neglecting sources and collisions for simplicity, the gyrokinetic equation in a straight, constant magnetic field can be written as
 $$\begin{eqnarray}\frac{\unicode[STIX]{x2202}f_{s}}{\unicode[STIX]{x2202}t}+\frac{\unicode[STIX]{x2202}}{\unicode[STIX]{x2202}z}\left(v_{\Vert }f_{s}\right)+\unicode[STIX]{x1D735}\boldsymbol{\cdot }\left(\boldsymbol{v}_{E}f_{s}\right)+\frac{\unicode[STIX]{x2202}}{\unicode[STIX]{x2202}v_{\Vert }}\left(\frac{q_{s}}{m_{s}}E_{\Vert }f_{s}\right)=0,\end{eqnarray}$$
where $E_{\Vert }=-\boldsymbol{b}\boldsymbol{\cdot }\unicode[STIX]{x1D735}\langle \unicode[STIX]{x1D719}\rangle$
and
$E_{\Vert }=-\boldsymbol{b}\boldsymbol{\cdot }\unicode[STIX]{x1D735}\langle \unicode[STIX]{x1D719}\rangle$
and $\boldsymbol{v}_{E}=\boldsymbol{b}\times \unicode[STIX]{x1D735}\langle \unicode[STIX]{x1D719}\rangle /B$
.
$\boldsymbol{v}_{E}=\boldsymbol{b}\times \unicode[STIX]{x1D735}\langle \unicode[STIX]{x1D719}\rangle /B$
.
Multiplying (4.4) by $H_{0}$
and integrating over phase space,
$H_{0}$
and integrating over phase space,
 $$\begin{eqnarray}\displaystyle \frac{\unicode[STIX]{x2202}W_{K}}{\unicode[STIX]{x2202}t} & = & \displaystyle \left.-\int \text{d}x\,\text{d}y\mathop{\sum }_{s}\int \text{d}^{3}v\,H_{0}v_{\Vert }f_{s}\right|_{z_{lower}}^{z_{upper}}+\int \text{d}^{3}x\mathop{\sum }_{s}\int \text{d}^{3}v\,v_{\Vert }f_{s}q_{s}E_{\Vert }\nonumber\\ \displaystyle & = & \displaystyle \left.-\int \text{d}x\,\text{d}y\mathop{\sum }_{s}\int \text{d}^{3}v\,H_{0}v_{\Vert }f_{s}\right|_{z_{lower}}^{z_{upper}}+\int \text{d}^{3}x\,j_{\Vert }E_{\Vert },\end{eqnarray}$$
where we have used the fact that the normal component of $\boldsymbol{v}_{E}$
vanishes on the side walls (since
$\boldsymbol{v}_{E}$
vanishes on the side walls (since $\unicode[STIX]{x1D719}$
is a constant on the side walls) and zero-flux boundary conditions on
$\unicode[STIX]{x1D719}$
is a constant on the side walls) and zero-flux boundary conditions on $f_{s}$
in
$f_{s}$
in $v_{\Vert }$
. The first term on the right-hand side is the parallel heat flux out to the sheaths and the second term is the parallel acceleration by the electric field, which mediates the transfer of energy between thermal and field energies in this model (this term appears with the opposite sign in the equation for the evolution of
$v_{\Vert }$
. The first term on the right-hand side is the parallel heat flux out to the sheaths and the second term is the parallel acceleration by the electric field, which mediates the transfer of energy between thermal and field energies in this model (this term appears with the opposite sign in the equation for the evolution of $E\times B$
energy).
$E\times B$
energy).
To calculate the field energy evolution, we take the time derivative of the gyrokinetic Poisson equation (2.4),
 $$\begin{eqnarray}\displaystyle -\unicode[STIX]{x1D735}_{\bot }\boldsymbol{\cdot }\left(\unicode[STIX]{x1D716}\unicode[STIX]{x1D735}_{\bot }\frac{\unicode[STIX]{x2202}\unicode[STIX]{x1D719}}{\unicode[STIX]{x2202}t}\right) & = & \displaystyle \mathop{\sum }_{s}q_{s}\int \text{d}^{3}v\frac{\unicode[STIX]{x2202}f_{s}}{\unicode[STIX]{x2202}t}\nonumber\\ \displaystyle & = & \displaystyle -\mathop{\sum }_{s}q_{s}\int \text{d}^{3}v\,\left[\frac{\unicode[STIX]{x2202}}{\unicode[STIX]{x2202}z}\left(v_{\Vert }f_{s}\right)+\unicode[STIX]{x1D735}\boldsymbol{\cdot }\left(\boldsymbol{v}_{E}f_{s}\right)\right]\nonumber\\ \displaystyle & = & \displaystyle -\frac{\unicode[STIX]{x2202}j_{\Vert }}{\unicode[STIX]{x2202}z}-\unicode[STIX]{x1D735}\boldsymbol{\cdot }(\boldsymbol{v}_{E}\unicode[STIX]{x1D70E}_{g}),\end{eqnarray}$$
where $\unicode[STIX]{x1D716}=n_{i0}^{g}e^{2}\unicode[STIX]{x1D70C}_{\text{s}0}^{2}/T_{e0}$
.
$\unicode[STIX]{x1D716}=n_{i0}^{g}e^{2}\unicode[STIX]{x1D70C}_{\text{s}0}^{2}/T_{e0}$
.
Next, we multiply (4.6) by $\unicode[STIX]{x1D719}$
and integrate over space:
$\unicode[STIX]{x1D719}$
and integrate over space:
 $$\begin{eqnarray}\displaystyle -\int \text{d}^{3}x\,\unicode[STIX]{x1D719}\unicode[STIX]{x1D735}_{\bot }\boldsymbol{\cdot }\left(\unicode[STIX]{x1D716}\unicode[STIX]{x1D735}_{\bot }\frac{\unicode[STIX]{x2202}\unicode[STIX]{x1D719}}{\unicode[STIX]{x2202}t}\right) & = & \displaystyle -\int \text{d}^{3}x\,\unicode[STIX]{x1D719}\left[\frac{\unicode[STIX]{x2202}j_{\Vert }}{\unicode[STIX]{x2202}z}+\unicode[STIX]{x1D735}\boldsymbol{\cdot }(\boldsymbol{v}_{E}\unicode[STIX]{x1D70E}_{g})\right]\nonumber\\ \displaystyle -\int \text{d}\boldsymbol{S}_{\bot }\boldsymbol{\cdot }\unicode[STIX]{x1D719}\unicode[STIX]{x1D716}\unicode[STIX]{x1D735}_{\bot }\frac{\unicode[STIX]{x2202}\unicode[STIX]{x1D719}}{\unicode[STIX]{x2202}t}+\frac{1}{2}\int \text{d}^{3}x\,\unicode[STIX]{x1D716}\frac{\unicode[STIX]{x2202}\left(\unicode[STIX]{x1D735}_{\bot }\unicode[STIX]{x1D719}\right)^{2}}{\unicode[STIX]{x2202}t} & = & \displaystyle \left.-\int \text{d}x\,\text{d}y\,\unicode[STIX]{x1D719}j_{\Vert }\right|_{z_{lower}}^{z_{upper}}+\int \text{d}^{3}x\,\frac{\unicode[STIX]{x2202}\unicode[STIX]{x1D719}}{\unicode[STIX]{x2202}z}j_{\Vert }\nonumber\\ \displaystyle & & \displaystyle -\int \text{d}\boldsymbol{S}_{\bot }\boldsymbol{\cdot }\unicode[STIX]{x1D719}\boldsymbol{v}_{E}\unicode[STIX]{x1D70E}_{g}\nonumber\\ \displaystyle & & \displaystyle +\int \text{d}^{3}x\,\unicode[STIX]{x1D735}\unicode[STIX]{x1D719}\boldsymbol{\cdot }\boldsymbol{v}_{E}\unicode[STIX]{x1D70E}_{g}.\end{eqnarray}$$
The integral involving $\int \text{d}\boldsymbol{S}_{\bot }$
on the right-hand side is zero because
$\int \text{d}\boldsymbol{S}_{\bot }$
on the right-hand side is zero because $\boldsymbol{v}_{E}$
has no normal component on the side walls. By assuming that
$\boldsymbol{v}_{E}$
has no normal component on the side walls. By assuming that $\unicode[STIX]{x1D719}=0$
on the side walls, the term on the left-hand side involving
$\unicode[STIX]{x1D719}=0$
on the side walls, the term on the left-hand side involving $\int \text{d}\boldsymbol{S}_{\bot }\unicode[STIX]{x1D719}$
is also zero and we have
$\int \text{d}\boldsymbol{S}_{\bot }\unicode[STIX]{x1D719}$
is also zero and we have
 $$\begin{eqnarray}\frac{\unicode[STIX]{x2202}W_{\unicode[STIX]{x1D719}}}{\unicode[STIX]{x2202}t}=\frac{\unicode[STIX]{x2202}}{\unicode[STIX]{x2202}t}\left(\frac{1}{2}\int \text{d}^{3}x\,\unicode[STIX]{x1D716}\left(\unicode[STIX]{x1D735}_{\bot }\unicode[STIX]{x1D719}\right)^{2}\right)=\left.-\int \text{d}x\,\text{d}y\,\unicode[STIX]{x1D719}j_{\Vert }\right|_{z_{lower}}^{z_{upper}}-\int \text{d}^{3}x\,j_{\Vert }E_{\Vert }.\end{eqnarray}$$
If the wall is biased instead of grounded, as done in a set of experiments by Carter & Maggs (Reference Carter and Maggs2009), one must retain the first term on the left-hand side of (4.7) in energy-balance considerations. The second term on the right-hand side of (4.8) is equal and opposite to the second term on the right-hand side of (4.5), and so cancels when the two equations are added together. The total energy is the sum of the kinetic energy $W_{k}$
and the field energy
$W_{k}$
and the field energy $W_{\unicode[STIX]{x1D719}}$
. Substituting the definition of
$W_{\unicode[STIX]{x1D719}}$
. Substituting the definition of $\unicode[STIX]{x1D716}$
, this field energy can be written as
$\unicode[STIX]{x1D716}$
, this field energy can be written as $W_{\unicode[STIX]{x1D719}}=\int \text{d}^{3}x\,n_{i0}^{g}m_{i}v_{E}^{2}/2$
, indicating that it can be interpreted as the kinetic energy associated with the
$W_{\unicode[STIX]{x1D719}}=\int \text{d}^{3}x\,n_{i0}^{g}m_{i}v_{E}^{2}/2$
, indicating that it can be interpreted as the kinetic energy associated with the $E\times B$
motion. (The
$E\times B$
motion. (The $n_{i0}^{g}$
factor can be generalised to the full density
$n_{i0}^{g}$
factor can be generalised to the full density $n_{i}^{g}(\boldsymbol{R},t)$
as described in § 2, with an additional contribution to the Hamiltonian.) The first term on the right-hand side of (4.8) corresponds to work done on particles as they are accelerated through the sheath. The
$n_{i}^{g}(\boldsymbol{R},t)$
as described in § 2, with an additional contribution to the Hamiltonian.) The first term on the right-hand side of (4.8) corresponds to work done on particles as they are accelerated through the sheath. The $\unicode[STIX]{x1D719}$
in this boundary term is the potential at the
$\unicode[STIX]{x1D719}$
in this boundary term is the potential at the $z$
boundaries of the simulation domain, where the sheath entrances are. When
$z$
boundaries of the simulation domain, where the sheath entrances are. When $j_{\Vert }=0$
at the sheath entrance, then the energy lost by electrons as they drop through the sheath is exactly offset by the energy gained by ions as they drop through the sheath. If more electrons than ions are leaving through the sheath, then the net energy lost in the unresolved sheath region contributes to an increase in the field energy.
$j_{\Vert }=0$
at the sheath entrance, then the energy lost by electrons as they drop through the sheath is exactly offset by the energy gained by ions as they drop through the sheath. If more electrons than ions are leaving through the sheath, then the net energy lost in the unresolved sheath region contributes to an increase in the field energy.
There is also room for improvements in the side-wall boundary conditions. Identifying the left-hand side of (4.6) as $-\unicode[STIX]{x2202}\unicode[STIX]{x1D70E}_{pol}/\unicode[STIX]{x2202}t=\unicode[STIX]{x1D735}\boldsymbol{\cdot }\boldsymbol{j}_{pol}$
, and integrating over all space,
$-\unicode[STIX]{x2202}\unicode[STIX]{x1D70E}_{pol}/\unicode[STIX]{x2202}t=\unicode[STIX]{x1D735}\boldsymbol{\cdot }\boldsymbol{j}_{pol}$
, and integrating over all space,
 $$\begin{eqnarray}\displaystyle \int \text{d}^{3}x\,\unicode[STIX]{x1D735}\boldsymbol{\cdot }\boldsymbol{j}_{pol} & = & \displaystyle \int \text{d}\boldsymbol{S}\boldsymbol{\cdot }\boldsymbol{j}_{pol}\nonumber\\ \displaystyle & = & \displaystyle \int \text{d}\boldsymbol{S}_{\bot }\boldsymbol{\cdot }\unicode[STIX]{x1D716}\frac{\unicode[STIX]{x2202}\boldsymbol{E}_{\bot }}{\unicode[STIX]{x2202}t},\end{eqnarray}$$
so we see that there is an ion polarisation current into the side wall when the electric field pointing into the side wall is increasing in time, which is physically reasonable. However, if the sign of the electric-field time derivative reverses, it is not possible to pull ions out of the side wall (where they are trapped by quantum effects, or return as neutrals), and a boundary layer might form near the side walls. In fusion devices, it is rare for the magnetic field to be exactly parallel to the wall, so it could be appropriate to use a model of the Chodura magnetic pre-sheath (Chodura Reference Chodura1982). Geraldini, Parra & Militello (Reference Geraldini, Parra and Militello2017) also recently studied a gyrokinetic approach to the magnetic pre-sheath.
The inclusion of charge-neutral source terms and number-conserving collision operators to the above analysis does not result in additional sources of $E\times B$
energy, since they lead to the addition of terms to the right-hand side of (4.8) of the form
$E\times B$
energy, since they lead to the addition of terms to the right-hand side of (4.8) of the form
 $$\begin{eqnarray}-\int \text{d}^{3}x\,\unicode[STIX]{x1D719}\mathop{\sum }_{s}q_{s}\int \text{d}^{3}v\,S_{s}(\boldsymbol{R},\boldsymbol{v},t)=0.\end{eqnarray}$$
4.2 Results
In this section we present results from various quantities derived from our gyrokinetic simulation. Our goal here is not to argue that our simulations are a faithful model of the LAPD plasma, but instead to demonstrate the ability to carry out gyrokinetic continuum simulations of open-field-line plasmas in a numerically stable way and to demonstrate a reasonable level of qualitative agreement by making contact with turbulence measurements from the real LAPD device and previous Braginskii fluid simulations (Ricci & Rogers Reference Ricci and Rogers2010; Friedman et al.
Reference Friedman, Carter, Umansky, Schaffner and Dudson2012; Fisher et al.
Reference Fisher, Rogers, Rossi, Guice and Carter2015), since we have used similar plasma parameters and geometry. Starting from the initial conditions described in § 4, the electron and ion distributions evolve for a few ion sound transit times ( $\unicode[STIX]{x1D70F}_{\text{s}}\sim (L_{z}/2)/c_{\text{s}}\approx 1.1$
ms using
$\unicode[STIX]{x1D70F}_{\text{s}}\sim (L_{z}/2)/c_{\text{s}}\approx 1.1$
ms using $T_{e}=3$
eV) until a quasisteady state is reached, during which the total number of particles of each species remains approximately constant.
$T_{e}=3$
eV) until a quasisteady state is reached, during which the total number of particles of each species remains approximately constant.
As seen in LAPD experiments (Schaffner et al. Reference Schaffner, Carter, Rossi, Guice, Maggs, Vincena and Friedman2012, Reference Schaffner, Carter, Rossi, Guice, Maggs, Vincena and Friedman2013), we observe a weak spontaneous rotation in the ion-diamagnetic-drift direction. Figure 2 shows snapshots in the perpendicular plane of the total electron density, electron temperature, and electrostatic potential after a few ion transit times, which are qualitatively similar to the snapshots presented from Braginskii fluid simulations of LAPD (Rogers & Ricci Reference Rogers and Ricci2010; Fisher et al. Reference Fisher, Rogers, Rossi, Guice and Carter2015).
Figure 2( $c$
) shows that a boundary layer with a width of order the sound gyroradius forms in the potential near the side walls, where the potential drops to match the boundary conditions
$c$
) shows that a boundary layer with a width of order the sound gyroradius forms in the potential near the side walls, where the potential drops to match the boundary conditions $\unicode[STIX]{x1D719}=0$
on the side walls. This means that a normal sheath at the ends in
$\unicode[STIX]{x1D719}=0$
on the side walls. This means that a normal sheath at the ends in $z$
with
$z$
with $\unicode[STIX]{x1D719}_{s}\sim 3T_{e}$
cannot occur very close to the side walls. However, one can still eventually get a quasisteady state with the electron flux,
$\unicode[STIX]{x1D719}_{s}\sim 3T_{e}$
cannot occur very close to the side walls. However, one can still eventually get a quasisteady state with the electron flux, ${\sim}n_{e}v_{te}\exp (-\text{e}\unicode[STIX]{x1D719}_{s}/T_{e})$
, of order the ion flux because the electron density becomes very small near the side walls and the electrons become colder there. Figure 3 shows the same fields as in figure 2, but the plots are made in the
${\sim}n_{e}v_{te}\exp (-\text{e}\unicode[STIX]{x1D719}_{s}/T_{e})$
, of order the ion flux because the electron density becomes very small near the side walls and the electrons become colder there. Figure 3 shows the same fields as in figure 2, but the plots are made in the $y=0$
plane to show the parallel structure.
$y=0$
plane to show the parallel structure.
Snapshots of the (a) total electron density (in $10^{18}~\text{m}^{-3}$
), (b) electron temperature (in eV) and (c) electrostatic potential (in V) from a 5D gyrokinetic simulation of a turbulent LAPD plasma. The plots are made in centre of the box at
$10^{18}~\text{m}^{-3}$
), (b) electron temperature (in eV) and (c) electrostatic potential (in V) from a 5D gyrokinetic simulation of a turbulent LAPD plasma. The plots are made in centre of the box at $z=0$
m. In this simulation, a continuous source of plasma concentrated inside
$z=0$
m. In this simulation, a continuous source of plasma concentrated inside $r_{s}=0.25$
m is transported radially outward by the turbulence as it flows at near-sonic speeds along the magnetic field lines to the end plates, where losses are mediated by sheath-model boundary conditions. The plots are made in a plane perpendicular to the magnetic field in the middle of the device after a few ion transit times.
$r_{s}=0.25$
m is transported radially outward by the turbulence as it flows at near-sonic speeds along the magnetic field lines to the end plates, where losses are mediated by sheath-model boundary conditions. The plots are made in a plane perpendicular to the magnetic field in the middle of the device after a few ion transit times.

Snapshots of the (a) total electron density (in $10^{18}~\text{m}^{-3}$
), (b) electron temperature (in eV) and (c) electrostatic potential (in V) from a 5D gyrokinetic simulation of a turbulent LAPD plasma. The plots are made in the
$10^{18}~\text{m}^{-3}$
), (b) electron temperature (in eV) and (c) electrostatic potential (in V) from a 5D gyrokinetic simulation of a turbulent LAPD plasma. The plots are made in the $x-z$
plane at
$x-z$
plane at $y=0$
m after a few ion transit times.
$y=0$
m after a few ion transit times.

Figure 4 shows the time-averaged radial profile of $n_{e}$
,
$n_{e}$
, $T_{e}$
, and
$T_{e}$
, and $\unicode[STIX]{x1D719}$
computed by averaging the data in the region
$\unicode[STIX]{x1D719}$
computed by averaging the data in the region $-4$
m
$-4$
m ${<}z<4$
m. We focus on this region since it is similar to the region in which probe measurements are taken in the LAPD, and there is little parallel variation in this region. Particle transport in the radial direction is especially evident in figure 4 from the broadening in the
${<}z<4$
m. We focus on this region since it is similar to the region in which probe measurements are taken in the LAPD, and there is little parallel variation in this region. Particle transport in the radial direction is especially evident in figure 4 from the broadening in the $n_{e}$
profile. In figure 4, the electron temperature drops off at mid-radii but is rather flat at large
$n_{e}$
profile. In figure 4, the electron temperature drops off at mid-radii but is rather flat at large $r$
. To understand this, note that there is a 2.72 eV residual electron source at large
$r$
. To understand this, note that there is a 2.72 eV residual electron source at large $r$
(see (4.2)), and that the observed temperature is close to the limit of the coldest temperature that can be represented on the grid when collisions dominate and the distribution function is isotropic, so
$r$
(see (4.2)), and that the observed temperature is close to the limit of the coldest temperature that can be represented on the grid when collisions dominate and the distribution function is isotropic, so $T_{e,min}\sim T_{\bot e,min}=1.2$
eV. Our choice of velocity-space grid is a compromise between resolving low energies and the need to go up to significantly higher energies than the temperature of the source (which has a maximum temperature of 6.7 eV) to represent the tail. This will be improved in future work using a non-uniformly spaced velocity grid or exponential basis functions, which can represent a range of electron energies much more efficiently. We do not expect the non-vanishing
$T_{e,min}\sim T_{\bot e,min}=1.2$
eV. Our choice of velocity-space grid is a compromise between resolving low energies and the need to go up to significantly higher energies than the temperature of the source (which has a maximum temperature of 6.7 eV) to represent the tail. This will be improved in future work using a non-uniformly spaced velocity grid or exponential basis functions, which can represent a range of electron energies much more efficiently. We do not expect the non-vanishing $T_{e}$
at large
$T_{e}$
at large $r$
to affect the results significantly because both
$r$
to affect the results significantly because both $n_{e}$
and the
$n_{e}$
and the $n_{e}$
fluctuation level are small at large
$n_{e}$
fluctuation level are small at large $r$
.
$r$
.
Plots of the average (a) electron density, (b) electron temperature and potential (c) profiles as a function of radius. The fields are time averaged over several ion transit times after the simulation has reached a quasisteady state, restricted to $-4$
m
$-4$
m ${<}z<4$
m, evaluated at eight equally spaced points in each cell and then binned by radius. The shaded region in
${<}z<4$
m, evaluated at eight equally spaced points in each cell and then binned by radius. The shaded region in $(a)$
illustrates the extent of the strong plasma source.
$(a)$
illustrates the extent of the strong plasma source.

Electron density fluctuation profiles have also been measured in LAPD (Carter & Maggs Reference Carter and Maggs2009; Friedman et al.
Reference Friedman, Carter, Umansky, Schaffner and Dudson2012). We define the density fluctuation as ${\tilde{n}}_{e}(x,y,z,t)=n_{e}(x,y,z,t)-\bar{n}_{e}(x,y,z)$
, where
${\tilde{n}}_{e}(x,y,z,t)=n_{e}(x,y,z,t)-\bar{n}_{e}(x,y,z)$
, where $\bar{n}(x,y,z)$
is computed by averaging the electron density using a
$\bar{n}(x,y,z)$
is computed by averaging the electron density using a $1~\unicode[STIX]{x03BC}\text{s}$
sampling interval over a period of 1 ms. The density fluctuation level is normalised to the peak amplitude of
$1~\unicode[STIX]{x03BC}\text{s}$
sampling interval over a period of 1 ms. The density fluctuation level is normalised to the peak amplitude of $\bar{n}_{e}$
at
$\bar{n}_{e}$
at $r=0$
(as done in Friedman et al.
Reference Friedman, Carter, Umansky, Schaffner and Dudson2012) and binned by radius in order to calculate the root mean square (r.m.s.) density fluctuation level as a function of radius, which is shown in figure 5(a). Figure 5(b) shows the power spectral density of electron density fluctuations, which is computed by averaging the power spectra at each node in the region
$r=0$
(as done in Friedman et al.
Reference Friedman, Carter, Umansky, Schaffner and Dudson2012) and binned by radius in order to calculate the root mean square (r.m.s.) density fluctuation level as a function of radius, which is shown in figure 5(a). Figure 5(b) shows the power spectral density of electron density fluctuations, which is computed by averaging the power spectra at each node in the region $25$
cm
$25$
cm ${<}r<30$
cm and
${<}r<30$
cm and $-4$
m
$-4$
m ${<}z<4$
m. Similar to measurements made on LAPD, we find that the turbulence has a broadband spectra.
${<}z<4$
m. Similar to measurements made on LAPD, we find that the turbulence has a broadband spectra.
Density fluctuation statistics computed from a 5D gyrokinetic simulation of a turbulent LAPD plasma. (a) Shows the normalised r.m.s. density fluctuation level (normalizing to a constant $\bar{n}_{max}=3.6117\times 10^{18}~\text{m}^{-3}$
) as a function of radius and (b) shows the density fluctuation power spectral density. These plots are in good qualitative agreement with LAPD measurements (Carter & Maggs Reference Carter and Maggs2009; Friedman et al.
Reference Friedman, Carter, Umansky, Schaffner and Dudson2012). The shaded region in (a) illustrates the extent of the strong plasma source.
$\bar{n}_{max}=3.6117\times 10^{18}~\text{m}^{-3}$
) as a function of radius and (b) shows the density fluctuation power spectral density. These plots are in good qualitative agreement with LAPD measurements (Carter & Maggs Reference Carter and Maggs2009; Friedman et al.
Reference Friedman, Carter, Umansky, Schaffner and Dudson2012). The shaded region in (a) illustrates the extent of the strong plasma source.

The coherence spectrum and cross-phase spectrum between electron density fluctuations ${\tilde{n}}_{e}$
and azimuthal electric field fluctuations
${\tilde{n}}_{e}$
and azimuthal electric field fluctuations $\tilde{E}_{\unicode[STIX]{x1D703}}$
have also been of interest in previous LAPD studies for their potential role in turbulent-particle-flux suppression by applied flow shear (Carter & Maggs Reference Carter and Maggs2009; Schaffner et al.
Reference Schaffner, Carter, Rossi, Guice, Maggs, Vincena and Friedman2012, Reference Schaffner, Carter, Rossi, Guice, Maggs, Vincena and Friedman2013). The cross-power spectrum
$\tilde{E}_{\unicode[STIX]{x1D703}}$
have also been of interest in previous LAPD studies for their potential role in turbulent-particle-flux suppression by applied flow shear (Carter & Maggs Reference Carter and Maggs2009; Schaffner et al.
Reference Schaffner, Carter, Rossi, Guice, Maggs, Vincena and Friedman2012, Reference Schaffner, Carter, Rossi, Guice, Maggs, Vincena and Friedman2013). The cross-power spectrum $P_{nE}(f)$
is first computed at each node as:
$P_{nE}(f)$
is first computed at each node as:
 $$\begin{eqnarray}P_{nE}(f)=\hat{n}_{e}^{\ast }\hat{E}_{\unicode[STIX]{x1D703}},\end{eqnarray}$$
where $\hat{n}_{e}(\boldsymbol{R},f)$
and
$\hat{n}_{e}(\boldsymbol{R},f)$
and $\hat{E}_{\unicode[STIX]{x1D703}}(\boldsymbol{R},f)$
are the Fourier transforms of the time series of
$\hat{E}_{\unicode[STIX]{x1D703}}(\boldsymbol{R},f)$
are the Fourier transforms of the time series of $\tilde{E}_{\unicode[STIX]{x1D703}}(\boldsymbol{R},t)$
and
$\tilde{E}_{\unicode[STIX]{x1D703}}(\boldsymbol{R},t)$
and ${\tilde{n}}_{e}(\boldsymbol{R},t)$
. The cross-power spectrum is then spatially averaged, and the cross-phase is computed as
${\tilde{n}}_{e}(\boldsymbol{R},t)$
. The cross-power spectrum is then spatially averaged, and the cross-phase is computed as
 $$\begin{eqnarray}\unicode[STIX]{x1D703}(f)=\text{Im}\log (\langle P_{nE}(f)\rangle ),\end{eqnarray}$$
where $\langle \ldots \rangle$
denotes a spatial average in the region
$\langle \ldots \rangle$
denotes a spatial average in the region $25$
cm
$25$
cm ${<}r<30$
cm and
${<}r<30$
cm and $-4$
m
$-4$
m ${<}z<4$
m. The coherence spectrum is defined as (Powers Reference Powers1974)
${<}z<4$
m. The coherence spectrum is defined as (Powers Reference Powers1974)
 $$\begin{eqnarray}|\unicode[STIX]{x1D6FE}_{nE}(f)|=\frac{|\langle P_{nE}(f)\rangle |}{\langle P_{nn}(f)\rangle ^{1/2}\langle P_{EE}(f)\rangle ^{1/2}},\end{eqnarray}$$
where $P_{nn}$
and
$P_{nn}$
and $P_{EE}$
are the real-valued power spectra of
$P_{EE}$
are the real-valued power spectra of ${\tilde{n}}_{e}$
and
${\tilde{n}}_{e}$
and $\tilde{E}_{\unicode[STIX]{x1D703}}$
, respectively. Figure 6 shows the coherence and cross-phase spectra computed from our simulation, which are similar to the spectra measured in LAPD (see Carter & Maggs Reference Carter and Maggs2009, p. 7) at frequencies below 10 kHz, where the fluctuation levels are the strongest as indicated in figure 5(b).
$\tilde{E}_{\unicode[STIX]{x1D703}}$
, respectively. Figure 6 shows the coherence and cross-phase spectra computed from our simulation, which are similar to the spectra measured in LAPD (see Carter & Maggs Reference Carter and Maggs2009, p. 7) at frequencies below 10 kHz, where the fluctuation levels are the strongest as indicated in figure 5(b).
Spectra of the (a) coherence and (b) cosine of the cross-phase between electron density and azimuthal electric field fluctuations.

The probability density function (PDF) of density fluctuations in LAPD has also been of interest. Carter (Reference Carter2006) focused on the intermittency of the density fluctuation PDF measured at various radial locations. As shown in figure 7, we observe similar trends in our simulations, in which we have measured the PDF at three radial locations (using $\unicode[STIX]{x0394}r=0.5$
cm wide radial intervals) in the region
$\unicode[STIX]{x0394}r=0.5$
cm wide radial intervals) in the region $-4$
m
$-4$
m ${<}z<4$
m. We find a negatively skewed PDF inside the strong-source region, a symmetric and Gaussian PDF at the location of peak fluctuation amplitude, and a positively skewed PDF in the weak-source region. The PDF in the weak-source region has a particularly strong enhancement of large-amplitude positive-density-fluctuation events.
${<}z<4$
m. We find a negatively skewed PDF inside the strong-source region, a symmetric and Gaussian PDF at the location of peak fluctuation amplitude, and a positively skewed PDF in the weak-source region. The PDF in the weak-source region has a particularly strong enhancement of large-amplitude positive-density-fluctuation events.
Density fluctuation amplitude PDF (in red and normalised to $\bar{n}_{max}=3.6117\times 10^{18}~\text{m}^{-3}$
) at three radial locations in the region
$\bar{n}_{max}=3.6117\times 10^{18}~\text{m}^{-3}$
) at three radial locations in the region $-4$
m
$-4$
m ${<}z<4$
m: (a) inside the strong-source region at
${<}z<4$
m: (a) inside the strong-source region at $r=19$
cm, (b) at the location of peak fluctuation amplitude at
$r=19$
cm, (b) at the location of peak fluctuation amplitude at $r=24$
cm and (c) in the weak-source region at
$r=24$
cm and (c) in the weak-source region at $r=31$
cm. Gaussian PDFs are shown in blue for comparison. Also indicated on each plot is the skewness
$r=31$
cm. Gaussian PDFs are shown in blue for comparison. Also indicated on each plot is the skewness $\unicode[STIX]{x1D6FE}_{1}=E[{\tilde{n}}_{e}^{3}]/\unicode[STIX]{x1D70E}^{3}$
and the kurtosis
$\unicode[STIX]{x1D6FE}_{1}=E[{\tilde{n}}_{e}^{3}]/\unicode[STIX]{x1D70E}^{3}$
and the kurtosis $\unicode[STIX]{x1D6FE}_{2}=E[{\tilde{n}}_{e}^{4}]/\unicode[STIX]{x1D70E}^{4}$
, where
$\unicode[STIX]{x1D6FE}_{2}=E[{\tilde{n}}_{e}^{4}]/\unicode[STIX]{x1D70E}^{4}$
, where $\unicode[STIX]{x1D70E}$
is the standard deviation of
$\unicode[STIX]{x1D70E}$
is the standard deviation of ${\tilde{n}}_{e}$
and
${\tilde{n}}_{e}$
and $E[\ldots ]$
denotes the expected value.
$E[\ldots ]$
denotes the expected value.

(a) The r.m.s. current fluctuation amplitude at the sheath entrances as a function of radius, normalised to the on-axis peak value of $j_{sat}=q_{i}nc_{\text{s}}\approx 1300~\text{A}~\text{m}^{-2}$
. (b) Trace of power sources, loss and error diagnostics over a 0.1 ms simulation period. The power error, which is defined in (4.20) and arises from the temporal discretisation, fluctuates in amplitude between
$j_{sat}=q_{i}nc_{\text{s}}\approx 1300~\text{A}~\text{m}^{-2}$
. (b) Trace of power sources, loss and error diagnostics over a 0.1 ms simulation period. The power error, which is defined in (4.20) and arises from the temporal discretisation, fluctuates in amplitude between $1$
–
$1$
– $6$
W.
$6$
W.

Figure 8(a) shows the r.m.s. current fluctuation level as a function of radius, measured at the sheath entrances. The current fluctuation amplitude has been normalised to the on-axis peak value of $j_{sat}=q_{i}nc_{\text{s}}\approx 1300~\text{A}~\text{m}^{-2}$
. Not shown is the mean total current at the sheath entrance, which has a peak value of approximately 100
$j_{sat}=q_{i}nc_{\text{s}}\approx 1300~\text{A}~\text{m}^{-2}$
. Not shown is the mean total current at the sheath entrance, which has a peak value of approximately 100 $\text{A}~\text{m}^{-2}$
. The observed behaviour is significantly different from the
$\text{A}~\text{m}^{-2}$
. The observed behaviour is significantly different from the $j_{\Vert }=0$
condition that would be imposed by logical-sheath boundary conditions, and future work can investigate the impact of
$j_{\Vert }=0$
condition that would be imposed by logical-sheath boundary conditions, and future work can investigate the impact of $j_{\Vert }=0$
versus
$j_{\Vert }=0$
versus $j_{\Vert }\neq 0$
boundary conditions. Thakur et al. (Reference Thakur, Xu, Manz, Fedorczak, Holland and Tynan2013) investigated the use of both conducting and insulating endplates on the controlled shear de-correlation experiment (CSDX), observing several changes in the turbulence characteristics.
$j_{\Vert }\neq 0$
boundary conditions. Thakur et al. (Reference Thakur, Xu, Manz, Fedorczak, Holland and Tynan2013) investigated the use of both conducting and insulating endplates on the controlled shear de-correlation experiment (CSDX), observing several changes in the turbulence characteristics.
Finally, we have investigated the energy-conservation properties of our model. As discussed in § 2.1, the spatial discretisation exactly conserves energy, but the SSP-RK3 time integrator introduces energy conservation errors. Therefore, it is interesting to quantify the energy non-conservation that results from the temporal discretisation. The evolution of total energy $W=W_{k}+W_{\unicode[STIX]{x1D719}}$
(with perfect spatial and temporal energy conservation) can be obtained by adding together (4.5) and (4.8):
$W=W_{k}+W_{\unicode[STIX]{x1D719}}$
(with perfect spatial and temporal energy conservation) can be obtained by adding together (4.5) and (4.8):
 $$\begin{eqnarray}\displaystyle & \displaystyle \frac{\unicode[STIX]{x2202}W}{\unicode[STIX]{x2202}t}=-P_{loss}+P_{source}, & \displaystyle\end{eqnarray}$$
 $$\begin{eqnarray}\displaystyle & \displaystyle P_{loss}=\left.-\int \text{d}x\,\text{d}y\mathop{\sum }_{s}\int \text{d}^{3}v\,H_{s}v_{\Vert }f_{s}\right|_{z_{lower}}^{z_{upper}}, & \displaystyle\end{eqnarray}$$
 $$\begin{eqnarray}\displaystyle & \displaystyle P_{source}=\int \text{d}^{3}x\mathop{\sum }_{s}\int \text{d}^{3}v\,H_{s}S_{s}=\int \text{d}^{3}x\mathop{\sum }_{s}\int \text{d}^{3}v\,H_{0}S_{s}, & \displaystyle\end{eqnarray}$$
where we have assumed a charge-neutral source for the second equality in (4.16). Although we also have a non-negligible source of energy from the positivity-adjustment procedure, this source of energy can also be measured and accounted for using diagnostics, i.e. by computing the total energy before and after the positivity-adjustment procedure, which is applied to the distribution functions at the end of each intermediate Runge–Kutta stage. By taking into account the details of the multi-stage SSP-RK3 time integrator, we can derive a simple expression for the expected change in the total energy of the system after a total time step of size $\unicode[STIX]{x0394}t$
that involves a combination of power loss and source terms from each substage.
$\unicode[STIX]{x0394}t$
that involves a combination of power loss and source terms from each substage.
For clarity, the SSP-RK3 algorithm to advance an equation of the form $\unicode[STIX]{x2202}_{t}\,f=\unicode[STIX]{x1D709}(f,\unicode[STIX]{x1D719})$
from
$\unicode[STIX]{x2202}_{t}\,f=\unicode[STIX]{x1D709}(f,\unicode[STIX]{x1D719})$
from $f(t^{n})=f^{n}$
to
$f(t^{n})=f^{n}$
to $f(t^{n+1})$
, where
$f(t^{n+1})$
, where $t^{n+1}=t^{n}+\unicode[STIX]{x0394}t$
, is written as (Peterson & Hammett Reference Peterson and Hammett2013)
$t^{n+1}=t^{n}+\unicode[STIX]{x0394}t$
, is written as (Peterson & Hammett Reference Peterson and Hammett2013)
 $$\begin{eqnarray}\displaystyle & \displaystyle f^{\ast }=f^{n}+\unicode[STIX]{x0394}t\unicode[STIX]{x1D709}(f^{n},\unicode[STIX]{x1D719}^{n}), & \displaystyle\end{eqnarray}$$
 $$\begin{eqnarray}\displaystyle & \displaystyle f^{\prime }={\textstyle \frac{3}{4}}f^{n}+{\textstyle \frac{1}{4}}[f^{\ast }+\unicode[STIX]{x0394}t\unicode[STIX]{x1D709}(f^{\ast },\unicode[STIX]{x1D719}^{\ast })], & \displaystyle\end{eqnarray}$$
 $$\begin{eqnarray}\displaystyle & \displaystyle f^{n+1}={\textstyle \frac{1}{3}}f^{n}+{\textstyle \frac{2}{3}}[f^{\prime }+\unicode[STIX]{x0394}t\unicode[STIX]{x1D709}(f^{\prime },\unicode[STIX]{x1D719}^{\prime })]. & \displaystyle\end{eqnarray}$$
The positivity-adjustment procedure is applied to $f^{\ast }$
,
$f^{\ast }$
, $f^{\prime }$
, and
$f^{\prime }$
, and $f^{n+1}$
before it is used in the
$f^{n+1}$
before it is used in the $\unicode[STIX]{x1D709}(f,\unicode[STIX]{x1D719})$
operator of the subsequent stage, so we denote the extra energy added to the electrons and ions at the end of each substage as
$\unicode[STIX]{x1D709}(f,\unicode[STIX]{x1D719})$
operator of the subsequent stage, so we denote the extra energy added to the electrons and ions at the end of each substage as $W_{pos}^{\ast }$
,
$W_{pos}^{\ast }$
, $W_{pos}^{\prime }$
, and
$W_{pos}^{\prime }$
, and $W_{pos}^{n+1}$
. The SSP-RK3 algorithm (4.17) can be combined as
$W_{pos}^{n+1}$
. The SSP-RK3 algorithm (4.17) can be combined as
 $$\begin{eqnarray}f^{n+1}=f^{n}+\unicode[STIX]{x0394}t\left({\textstyle \frac{1}{6}}\unicode[STIX]{x1D709}(f^{n},\unicode[STIX]{x1D719}^{n})+{\textstyle \frac{1}{6}}\unicode[STIX]{x1D709}(f^{\prime },\unicode[STIX]{x1D719}^{\prime })+{\textstyle \frac{2}{3}}\unicode[STIX]{x1D709}(f^{\ast },\unicode[STIX]{x1D719}^{\ast })\right).\end{eqnarray}$$
Using (4.14), we notice that the energy change associated with a term like $\unicode[STIX]{x1D709}(f^{n},\unicode[STIX]{x1D719}^{n})$
is
$\unicode[STIX]{x1D709}(f^{n},\unicode[STIX]{x1D719}^{n})$
is
 $$\begin{eqnarray}\displaystyle \int \text{d}^{3}x\mathop{\sum }_{s}\int \text{d}^{3}v\,H_{s}^{n}\unicode[STIX]{x1D709}(f_{s}^{n},\unicode[STIX]{x1D719}^{n}) & = & \displaystyle -P_{loss}^{n}+P_{source}^{n},\end{eqnarray}$$
where the superscript $n$
on
$n$
on $P_{loss}$
and
$P_{loss}$
and $P_{source}$
indicates that (4.15) and (4.16) are to be evaluated with
$P_{source}$
indicates that (4.15) and (4.16) are to be evaluated with $H^{n}$
and
$H^{n}$
and $f^{n}$
. By multiplying (4.18) by
$f^{n}$
. By multiplying (4.18) by $H^{n+1}$
, integrating over phase space, and summing over both species, the energy change in the system after the total time step can be written as
$H^{n+1}$
, integrating over phase space, and summing over both species, the energy change in the system after the total time step can be written as
 $$\begin{eqnarray}\displaystyle P_{total} & = & \displaystyle \frac{W^{n+1}-W^{n}}{\unicode[STIX]{x0394}t}=\left(\frac{1}{6}P_{loss}^{n}+\frac{1}{6}P_{loss}^{\ast }+\frac{2}{3}P_{loss}^{\prime }\right)\nonumber\\ \displaystyle & & \displaystyle +\,\left(\frac{1}{6}P_{source}^{n}+\frac{1}{6}P_{source}^{\ast }+\frac{2}{3}P_{source}^{\prime }\right)\nonumber\\ \displaystyle & & \displaystyle +\frac{1}{\unicode[STIX]{x0394}t}\left(\frac{1}{6}W_{pos}^{\ast }+\frac{2}{3}W_{pos}^{\prime }+W_{pos}^{n+1}\right)+P_{err},\end{eqnarray}$$
 $$\begin{eqnarray}\displaystyle & \displaystyle W^{n}=\int \text{d}^{3}x\int \text{d}^{3}v\left(H^{n}-\frac{1}{2}q_{s}\unicode[STIX]{x1D719}^{n}\right)f^{n}, & \displaystyle\end{eqnarray}$$
 $$\begin{eqnarray}\displaystyle & \displaystyle W^{n+1}=\int \text{d}^{3}x\int \text{d}^{3}v\left(H^{n+1}-\frac{1}{2}q_{s}\unicode[STIX]{x1D719}^{n+1}\right)f^{n+1}, & \displaystyle\end{eqnarray}$$
where $P_{err}$
is a measure of the energy conservation error
$P_{err}$
is a measure of the energy conservation error $\propto (\unicode[STIX]{x2202}_{t}W)^{4}(\unicode[STIX]{x0394}t)^{3}$
resulting from the temporal discretisation scheme. While it has a complicated expression, it can be tracked in the code by measuring all the other terms in (4.20) using diagnostics.
$\propto (\unicode[STIX]{x2202}_{t}W)^{4}(\unicode[STIX]{x0394}t)^{3}$
resulting from the temporal discretisation scheme. While it has a complicated expression, it can be tracked in the code by measuring all the other terms in (4.20) using diagnostics.
Figure 8(b) shows the traces of the terms appearing in the power balance (4.20) over a $0.1$
ms period of the simulation in a quasisteady turbulent state, or approximately
$0.1$
ms period of the simulation in a quasisteady turbulent state, or approximately $2\times 10^{4}$
time steps. Also plotted in figure 8(b) is
$2\times 10^{4}$
time steps. Also plotted in figure 8(b) is $P_{err}$
, which is found to vary in magnitude between
$P_{err}$
, which is found to vary in magnitude between $1$
–
$1$
– $6$
W, so the energy conservation error introduced by the time discretisation is extremely low.
$6$
W, so the energy conservation error introduced by the time discretisation is extremely low.
5 Conclusions
We have presented results from the first 5D gyrokinetic continuum simulations of turbulence in an open-field-line plasma. The simulations were performed using a version of the Gkeyll code that employs an energy-conserving discontinuous Galerkin algorithm. We found it important to include self-species collisions in the electrons to avoid driving high-frequency instabilities in our simulations. Our gyrokinetic simulations are generally in good qualitative agreement with previous Braginskii fluid simulations of LAPD and with experimental data.
We use sheath-model boundary conditions for electrons that are a kinetic extension of the sheath model used in past fluid simulations, which allow self-consistent currents to fluctuate in and out of the wall. In this approach, the sheath potential is determined from the gyrokinetic Poisson equation (analogous to how the vorticity equation is used in the fluid approach of Rogers & Ricci (Reference Rogers and Ricci2010)). The ion boundary conditions used at present are the same as for the logical sheath model, in which ions flow out at whatever velocity they have been accelerated to at the sheath edge. This works well for the time period of this LAPD simulation. As discussed in § 3, future work is planned to consider improved models of a kinetic sheath, including the role of rarefaction dynamics near the sheath that may modify the outflowing distribution function and the effective outflow Mach number.
A number of possible modifications to the simulations could allow closer quantitative modelling of the LAPD experiment. In the real LAPD experiment, a cathode–anode discharge emits an energetic 40–60 eV electron beam that ionises the background gas along the length of the device (Carter & Maggs Reference Carter and Maggs2009; Gekelman et al. Reference Gekelman, Pribyl, Lucky, Drandell, Leneman, Maggs, Vincena, Compernolle, Tripathi and Morales2016), creating the bulk plasma source that we have directly modelled in our simulations. At present, we are ignoring the current from these energetic electrons and modelling the anode as a regular conducting end plate. Because the anode in the actual device is a semi-transparent mesh, there is finite pressure on the other side of the anode from the main plasma that can act to slow down ion outflows and thus relax the Bohm sheath criterion. Since our simulations are kinetic, future work could include the non-Maxwellian high-energy electrons and a model of the ionisation process instead of using explicit source terms. We have also performed simulations of turbulence suppression experiments (Schaffner et al. Reference Schaffner, Carter, Rossi, Guice, Maggs, Vincena and Friedman2012, Reference Schaffner, Carter, Rossi, Guice, Maggs, Vincena and Friedman2013; Fisher & Rogers Reference Fisher and Rogers2017) on LAPD using a biasable limiter to control flow shear, and these results will be presented in a future publication. Future work will also investigate the primary mechanism driving the cross-field transport observed in our simulations (such as linear drift-wave, nonlinear, or Kelvin–Helmholtz instabilities) by analysing the energy dynamics of the system (Friedman et al. Reference Friedman, Carter, Umansky, Schaffner and Dudson2012, Reference Friedman, Carter, Umansky, Schaffner and Joseph2013) and through the use of presence/absence tests (Rogers & Ricci Reference Rogers and Ricci2010; Fisher et al. Reference Fisher, Rogers, Rossi, Guice and Carter2015).
We plan several improvements to our numerical algorithms. The time step restriction in our LAPD simulations is currently set by the electron–electron collision frequency. A super-time-stepping method, such as the Runge–Kutta–Legendre method (Meyer, Balsara & Aslam Reference Meyer, Balsara and Aslam2014), or implicit method could significantly alleviate this restriction. The use of non-polynomial basis functions (Yuan & Shu Reference Yuan and Shu2006) for efficient velocity-space discretisation is expected to reduce the computational cost of these simulations (by allowing for a coarser velocity-space grid) and to preserve the positivity of the distribution function. Future studies will also implement the full nonlinear ion polarisation density in gyrokinetic Poisson equation (2.4), which is related to removing the Boussinesq approximation in fluid models (Dudson et al.
Reference Dudson, Allen, Breyiannis, Brugger, Buchanan, Easy, Farley, Joseph, Kim and McGann2015; Halpern et al.
Reference Halpern, Ricci, Jolliet, Loizu, Morales, Mosetto, Musil, Riva, Tran and Wersal2016). This modification requires replacing $n_{i0}^{g}$
in (2.4) with the full
$n_{i0}^{g}$
in (2.4) with the full $n_{i}^{g}(\boldsymbol{R},t)$
and retaining a corresponding second-order contribution to the Hamiltonian (2.3) necessary for energy conservation (Scott & Smirnov Reference Scott and Smirnov2010; Krommes Reference Krommes2012, Reference Krommes2013).
$n_{i}^{g}(\boldsymbol{R},t)$
and retaining a corresponding second-order contribution to the Hamiltonian (2.3) necessary for energy conservation (Scott & Smirnov Reference Scott and Smirnov2010; Krommes Reference Krommes2012, Reference Krommes2013).
Although the results presented here are a major milestone in our efforts towards developing a gyrokinetic continuum code to study tokamak edge turbulence, many physical effects remain to be added to the code, such as realistic tokamak magnetic geometry (including both open and closed-magnetic-field-line regions, a separatrix, and the X-point), full Landau collisions, finite-Larmor-radius effects, electromagnetic effects, and interactions with neutrals and other atomics physics.
Acknowledgements
We thank P. Ricci for suggesting LAPD as a test problem, T. Carter and G. Rossi for useful discussions about LAPD, and N. Mandell for building the Gkeyll code on various clusters. We also thank B. Friedman, J. Loizu, P. Ricci, B. Rogers, and M. Dorf for useful discussions about various aspects of these kinds of simulations and plasma sheaths. This work was funded by the U.S. Department of Energy under contract no. DE-AC02-09CH11466, through the Max-Planck/Princeton Center for Plasma Physics and the Princeton Plasma Physics Laboratory. Initial development used the Edison system at the National Energy Research Scientific Computing Center, a DOE Office of Science User Facility supported by the Office of Science of the U.S. Department of Energy under contract no. DE-AC02-05CH11231. G.W.H. and A.H. were supported in part by the SciDAC Center for the Study of Plasma Microturbulence. A.H. was also supported in part by the Laboratory Directed Research and Development program. Simulations reported in this paper were performed on the Perseus cluster at the TIGRESS high performance computer centre at Princeton University, which is jointly supported by the Princeton Institute for Computational Science and Engineering and the Princeton University Office of Information Technology’s Research Computing department.


