


1. Introduction
Abrupt liquid motion causes pressure fluctuations inside the liquid column, resulting in significant fluid motion. For example, a large deformation of the free surface (i.e. jets) can occur in Pokrovski's experiment, where a liquid-filled container falls under gravity and hits the floor (Antkowiak et al. Reference Antkowiak, Bremond, Le Dizès and Villermaux2007). The pressure impulse approach under the incompressible fluid assumption explains the jet formation. Nevertheless, Kiyama et al. (Reference Kiyama, Tagawa, Ando and Kameda2016) found that sufficiently large acceleration causes cavitation accompanied by jet formation with a vibrating interface. This implies that the acoustic pressure waves propagate in the liquid column (Bao et al. Reference Bao, Reuter, Zhang, Lu and Ohl2023), meaning that the jet liquid behaves as a weakly compressible fluid.
To describe the liquid compressibility, scaling analysis (Batchelor Reference Batchelor1967, § 6.3 and p. 168) provides three important terms related as
 \begin{equation} \left|\frac{1}{\rho c^2}\,\frac{\partial p}{\partial t}-\frac{1}{2c^2}\,\frac{{\rm D}q^2}{{\rm D}t}+\frac{aU}{c^2}\right|\ll\frac{U}{L}, \end{equation}
where  $\rho$ is the liquid density, $c$ is the speed of sound, $p$ is the pressure, $q$ is a quantity having the same dimensions as velocity, $a$ is the typical acceleration, $U$ is the typical velocity of liquid (e.g. the impact velocity in an example of Pokrovski's experiment), and $L$ is the typical length scale of the liquid system. Note that the flow is assumed to be isentropic. When each term on the left-hand side has a much smaller magnitude than the spatial derivatives of the components of liquid velocity $U/L$, the liquid behaves as if it were incompressible. This consideration gives three dimensionless incompressibility conditions relating to the Mach number $Ma$, Strouhal number $St$, and Froude number $Fr$, defined as
 \begin{equation} \frac{L}{c\,\Delta t}=St\ll1, \end{equation}
 \begin{equation} \frac{U}{c}=Ma\ll1, \end{equation}
 \begin{equation} \frac{aL}{c^2}=Fr^{{-}1}\ll1, \end{equation}
where  $\Delta t$ is the duration required for the development of the pressure field. The Strouhal number $St$ is the ratio of the duration of acceleration $\Delta t$ to the acoustic time scale $L/c$; a detailed explanation will be provided in § 3.1. Note that the Froude number $Fr$ is generally expressed as the ratio of inertial force to gravitational force. The physical meaning of $Fr$ in the above equation is the competition between the pressure change due to the body force (acceleration including gravity) $\sim \rho aL$ and the ambient pressure $\sim \rho c^2$. This dimensionless number $aL/c^2$ is equivalent to $Fr^{-1}$, and is also the product of the other two dimensionless numbers (i.e. $Fr^{-1}\sim St\,Ma$) when the typical acceleration can be scaled as $a\sim U/\Delta t$.
In a previous example of Pokrovski's experiment with fluid compressibility effects (Kiyama et al. Reference Kiyama, Tagawa, Ando and Kameda2016), the typical values were found to be  $U\sim O(10^0)\, {\rm m}\,{\rm s}^{-1}$, $c\sim O(10^3)\, {\rm m}\,{\rm s}^{-1}$, $L\sim O(10^{-1})\,{\rm m}$, $\Delta t\sim O(10^{-4})\,{\rm s}$ and $a\sim O(10^4)\,{\rm m}\,{\rm s}^{-2}$. Under such conditions, $Ma\sim O(10^{-3})\ll 1$, $St\sim O(10^0)$ and $Fr^{-1}\sim O(10^{-3})\ll 1$. This suggests that the compressibility effect in Pokrovski's experiment might be scaled with the Strouhal number $St$, rather than with $Ma$ and $Fr$. However, Kiyama et al. (Reference Kiyama, Tagawa, Ando and Kameda2016) did not consider the influence of the acceleration duration (i.e. $St$).
We tested the above hypothesis in a preliminary experiment. Figure 1 shows the time series of the acceleration  $a$ measured at the top of a container filled with silicone oil (10 cSt) as it impacts the floor. The red line indicates the data taken from the tube impacting a metal floor, where the duration of acceleration is $\Delta t\sim 0.11$ ms (indicated by the red shading). The blue line presents the data for a resin floor ( $\Delta t\sim 0.27$ ms, blue shading). The dimensionless parameters are $St\sim 3.1\times 10^{-1}$, $Ma\sim 8.2\times 10^{-4}\ll 1$ and $Fr^{-1}\sim 3.6\times 10^{-5}\ll 1$ (red) and $St\sim 1.2\times 10^{-1}$, $Ma\sim 2.1\times 10^{-3}\ll 1$ and $Fr^{-1}\sim 3.6\times 10^{-5}\ll 1$ (blue). Although both cases exhibit similar peaks and mean accelerations at impact, the magnitude of later acceleration fluctuations is quite different. The case with the larger Strouhal number $St$ (i.e. a smaller $\Delta t$) exhibits more significant acceleration fluctuations for $t>\Delta t$. This confirms that the short-term acceleration induces pressure waves in the liquid column, even when $Ma\ll 1$ and $Fr^{-1}\ll 1$. We conjectured that the influence of $\Delta t$ (and thus $St$) became visible there, as the other two dimensionless parameters ( $Ma, Fr^{-1}$) remain much smaller than unity, implying that they are less important. The effects of the acceleration duration $\Delta t$ are also visible in the fluid motion inside test tubes dropped from the same height (i.e. the same velocity
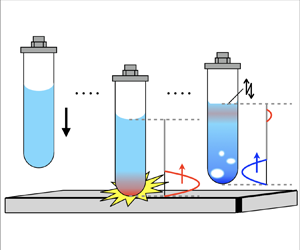
  $U$; see figure 2). The resin floor induces a smooth jet (figure 2a), while the metal floor triggers surface vibrations (figure 2b) and cavitation (figure 2c); see supplementary movies available at https://doi.org/10.1017/jfm.2024.1190.
Measured acceleration of a liquid-filled glass container after collision with the floor. Red and blue curves show the acceleration with different floor materials and drop heights. The acceleration during the impact is marked by the shaded area. Although both cases have similar peaks and mean accelerations at impact, the magnitudes of the subsequent acceleration fluctuations are quite different.

Photographs taken at 100 000 fps using a high-speed camera (Photron SA-X) with a back-light method. The typical velocity is mostly constant ( ${\approx }2.0\,{\rm m}\,{\rm s}^{-1}$), and the height of the jet does not change significantly in each case. (a ii–c ii) Magnified views of the free surface at $t=4.6$ ms. (a) Test tube impacting a resin floor, where the free surface remains smooth. (b) Test tube impacting a metal floor, where the free surface vibrates periodically and exhibits a rough texture (marked by a white arrow). (c) Test tube impacting a metal floor, where cavitation occurs inside the liquid. The free surface exhibits a similar response to that in (a). See the supplementary movies.

To the best of our knowledge, the role of  $\Delta t$ in the development of the pressure field in Pokrovski's experiment has not been investigated systematically. Most existing research took a pressure impulse approach, assuming an incompressible flow and a constant $\Delta t$ that is greater than the acoustic time scale $L/c$, i.e. $St\ll 1$ (Antkowiak et al. Reference Antkowiak, Bremond, Le Dizès and Villermaux2007; Pan et al. Reference Pan, Kiyama, Tagawa, Daily, Thomson, Hurd and Truscott2017). In this approach, the pressure field of the liquid is fully developed immediately after the impact, thus the liquid pressure does not change as a function of time. Another approach takes the water hammer theory into account (Kiyama et al. Reference Kiyama, Tagawa, Ando and Kameda2016), and thus assumes an instant increment in pressure, i.e. $\Delta t=0$ (Ghidaoui et al. Reference Ghidaoui, Zhao, McInnis and Axworthy2005; Bergant, Simpson & Tijsseling Reference Bergant, Simpson and Tijsseling2006), where $St=\infty$. This assumption predicts periodic pressure fluctuations $\bar {P}$ with magnitude $\rho cU$, but does not capture the role of $\Delta t$ in the development of the pressure field. Existing research has considered one or other of these approaches, but the intermediate region between $St\ll 1$ and $St=\infty$ has rarely been studied.
This paper focuses on the role of  $St$ in the pressure fluctuations, especially in the intermediate $St$ regime. We first define the physical meaning of $St$ in § 3.1 as a function of $\Delta t$, and examine the experimental data with various liquid depths $L$, velocities $U$, acceleration durations $\Delta t$, and liquid types. The experimental data collapse onto a single curve, suggesting that $St$ is suitable for describing the pressure fluctuations (§ 3.2). The conditions for the onset of cavitation are derived in § 3.2.2, and the pressure fluctuations in a hydrogel are examined in § 3.2.3. In both cases, the present results are shown to be in line with existing pressure results for fluids. We also develop a simple model that takes the effect of the finite thickness of the pressure wavefront into account. This model is used to describe the liquid pressure fluctuations at $t>\Delta t$ based on the one-dimensional wave equation (§ 3.3). We then compare the output from the proposed model with a wide range of experimental data. The influence of the motion of the surrounding container and the profile of the pressure wavefront is also discussed.
2. Experiments
Figure 3 shows the experimental set-up. The container, which is partially filled with a liquid/hydrogel, falls freely and eventually collides with the floor. This accelerates the liquid in the vertical direction opposite to the direction of gravity  $g$. The acceleration of the container is measured with an accelerometer (2350, Showa Sokki Co., sensibility $0.3\,{\rm pC}\,({\rm m}\,{\rm s}^{-2})^{-1}$) attached to the top of the container, where the accelerometer is tightly glued. The accelerometer outputs a charge that is converted to a voltage by a charge amplifier (5015A, 5011B, Kistler Co.), and the voltage is recorded by an oscilloscope (Iwatsu Co., ViewGo II, DS 5554-A).
Schematic illustration of the experimental set-up. The accelerometer attached to the top of the container records the acceleration  $a$ acting on the system. A change in the floor material allows us to change the duration of acceleration $\Delta t$. The depth $L$ of the liquid in the container is also varied in our experiments.

Note that the connection between the accelerometer and the amplifier is established using a stiff wire. It sometimes tilts the falling test tube. While we assume that the output from the system was robust enough, it poses a clear limitation of this set-up. However, we would also note that the same limitation should apply even when using other sensors, such as a needle-type hydrophone, which allows us to measure the underwater pressure directly. It could thus be said that the acceleration measurement has some merits as it does not disturb either the flow or the pressure fields during the measurement (see also supplementary material).
The control parameters are the depth of the liquid column  $L$, the change in the liquid velocity induced by the impact $u_{0}$, the duration of acceleration $\Delta t$, and the type of liquid/hydrogel. The depth of the liquid column $L$ ranges from 30 to 285 mm. We use two borosilicate glass containers of different sizes and masses (see table 1). The characteristic velocity $U$ in this experiment corresponds to the impact velocity $u_0$, which is varied from 0.5 to 3 ${\rm m}\,{\rm s}^{-1}$ by adjusting the drop height of the container. The duration of acceleration $\Delta t$ ranges from 0.1 to 2.2 ms. To control $\Delta t$, different floor materials are used: steel, aluminium, epoxy resin, ABS resin and rubber. We use different fluids (silicone oils with 1 and 10 cSt obtained from Shin-Etsu Chemical Co., pure water, and ethanol) and a weak gelatin gel (5 wt%) that is expected to flow when it experiences rapid deformation (Kiyama et al. Reference Kiyama, Mansoor, Speirs, Tagawa and Truscott2019) and exhibits similar cavitation to water (Rapet, Tagawa & Ohl Reference Rapet, Tagawa and Ohl2019). The physical properties of these media are summarized in table 2. The tube dimensions and media properties allow us to estimate a degree of the fluid–structure interaction through the parameter $\beta =(c^2_l/c^2_s)(\rho _l/\rho _s)[(d_{in}+h)/h]$ (e.g. Kiyama et al. Reference Kiyama, Tagawa, Ando and Kameda2016). As for water, we estimated $\beta <1$ for all tube types used, suggesting that the tube deformation does not play a non-negligible role.
Specifications of the containers.

Physical properties of media in a tube. Speed of sound in gelatin is calculated from the acceleration frequency and liquid depth.

A measured acceleration profile is shown in figure 4(a). A positive value of the acceleration indicates upward vertical acceleration. The grey curve shows the raw acceleration data, whereas the red curve shows the low-pass-filtered data. For filtering, the cut-off frequencies for the 130 and 300 mm tube lengths are 11 000 and 5000 Hz, respectively; these values are estimated based on the tube length and the speed of sound in glass ( $c\sim 5.4\times 10^3\,{\rm m}\,{\rm s}^{-1}$) and are finalized while following the empirical considerations. The filter threshold was set to cut not the oscillation of the liquid but that of the tube. The raw data suddenly change at $t=0$ when the container impacts the floor, and the acceleration exceeds 1000 $g$ immediately after the impact. We note that the acceleration change before $t<0$ was much smaller than the main acceleration due to the impact, meaning that the observer in our system is stood on a test tube. We define $\Delta t$ as the duration from the collision until the filtered acceleration falls back to $0\,{\rm m}\,{\rm s}^{-2}$. It is assumed that all of the acceleration changes that occurred during the impact event were covered within this $\Delta t$. Periodic fluctuations in acceleration are then observed – see figure 4 for $t>t_0$. At $t>t_0$, no fluctuations are visible for an empty container (see inset), indicating that there must be some liquid/hydrogel in the container to observe fluctuations.
(a) Acceleration of the container partially filled with silicone oil (10 cSt). The grey and red lines represent raw data and data subjected to a low-pass filter;  $\Delta t$ is the duration of acceleration. After $t_{0}$ (defined in § 2), fluctuations in acceleration are visible. The inset shows the acceleration of an empty glass container. (b) Acceleration of each floor type is shown by different colours. Data are obtained from the impact of an empty test tube on each floor material. The Young's modulus is specified in the legend, where superscript $\ast$ denotes the tensile strength.

The acceleration during  $\Delta t$ for each floor type is shown in figure 4(b). The container is dropped from the same height so that the integral of the acceleration over $\Delta t$ is similar for all cases. However, a stiffer floor introduces a higher magnitude of acceleration $a$ within a shorter $\Delta t$.
The measured acceleration is translated to pressure according to the momentum conservation law, which can be written as
 \begin{equation} mv+\rho A\int_{0}^{L} u\,{\rm d}\kern0.7pt x=H({\rm const.}), \end{equation}
where  $m$ is the mass of the container, $v$ is the velocity of the container, $\rho$ is the liquid density, $A$ is the cross-sectional area of the liquid column, and $u$ is the velocity of the liquid. This equation encompasses the entire system (i.e. both the liquid and the container). We do not take the contribution of gravitational acceleration $g$ into account because it is expected to be sufficiently small when compared to the acceleration imposed by the impact ( $g\ll u_0/\Delta t$), where $u_0$ is the initial velocity change due to the impact estimated through the experiment.
Equation (2.1) can also be rewritten as
 \begin{equation} m\bar{v}+mv^\prime+\rho A \int_{0}^{L}\bar{u}\,{{\rm d}\kern0.7pt x}+ \rho A\int_{0}^{L}u^\prime \,{{\rm d}\kern0.7pt x}=H({{\rm const.}}), \end{equation}
while introducing  $u=\bar {u}+u^\prime$ and $v=\bar {v}+v^\prime$. Here, velocities $u$ and $v$ were decomposed into the time-averaged ( $\bar {u}$ and $\bar {v}$) and respective fluctuations ( $u^\prime$ and $v^\prime$) components. Considering the extremes, the momentum change in the liquid may be expressed as
 \begin{equation} \varPi_{L}=\rho A\,\frac{\left(\int_{0}^{L}u\,{\rm d}\kern0.7pt x\right)_{max}-\left(\int_{0}^{L}u\,{\rm d}\kern0.7pt x\right)_{min}}{2}. \end{equation}
 Let  $\bar {U}$ be the amplitude of the time-averaged velocity component, calculated across the entire liquid depth from the bottom of the liquid to the gas–liquid interface as
 \begin{equation} \bar{U}=\frac{\left(\int_{0}^{L}u\,{\rm d}\kern0.7pt x\right)_{max}-\left(\int_{0}^{L}u\,{\rm d}\kern0.7pt x\right)_{min}}{2L}, \end{equation}
for convenience. Then (2.3) can finally be reformulated by using  $\bar {U}$ as
 \begin{equation} \varPi_{L}=\rho A L \bar{U}. \end{equation}
 Similarly, the amplitude of the velocity fluctuation of the container  $V$ can be expressed as
 \begin{equation} V=\frac{v_{max}-v_{min}}{2}. \end{equation}
The amplitude of the change in momentum of the container is thus expressed as
 \begin{equation} \varPi_{T}=mV, \end{equation}
where  $m$ is the mass of the container (see table 1). Coupling (2.5) and (2.7) gives the expression
 \begin{equation} \frac{\bar{U}}{u_{0}}=\frac{m}{\rho A L}\,\frac{V}{u_0}. \end{equation}
We can determine the right-hand side of (2.8) experimentally. We estimate the velocity of the container  $V$ by integrating the acceleration data (see figure 4a). We focus on the velocity after $t = t_{0}$, and detect the velocity fluctuations $v_{max}$ and $v_{min}$ (see figure 5). Note that $v_{max}$ and $v_{min}$ are taken from the first period after $t=t_{0}$ to reduce the influence of drift noise.
Temporal velocity of the container (i.e. the test tube) from the beginning of impact, as calculated by integrating the acceleration data. The peak velocities  $v_{max}$ and $v_{min}$ are marked.

Assuming the relationship  $\bar {P}=\rho c\bar {U}$, we obtain
 \begin{equation} \frac{\bar{U}}{u_{0}}=\frac{\bar{P}}{\rho c u_{0}}. \end{equation}
Hereafter, the experimental data  $\bar {P}/(\rho cu_0)$ are estimated as the representation of $mV/(\rho ALu_0)$.
We note that the vibration of the acceleration data is assumed to represent the pressure wave propagation in the liquid (Kiyama et al. Reference Kiyama, Tagawa, Ando and Kameda2016), in which the peak frequency was expected to be estimated as  $\sim c_l/(4L)$. We have found that the frequency of the acceleration data follows the trend (see the supplementary material). This trend agrees qualitatively with the frequency response of the direct pressure measurement, which further supports the hypothesis. The detailed discussion can be found in the supplementary material.
3. Results and discussion
3.1. Strouhal number  $St$ as an indicator of liquid compressibility

We first derive the Strouhal number  $St$ for the one-dimensional system. We assume an infinitesimal disturbance to the velocity, pressure and density in the inviscid flow. We then obtain the continuity and Euler equations in terms of the density $\rho$, velocity $u$, time $t$, length $x$ and pressure $p$ as
 \begin{equation} \frac{\partial \rho}{\partial t} +\rho_{0}\,\frac{\partial u}{\partial x}=0, \end{equation}
 \begin{equation} \frac{\partial u}{\partial t}+\frac{1}{\rho_{0}}\,\frac{\partial p}{\partial x}=0. \end{equation}
Here,  $\rho _0$ is the characteristic liquid density in the far field. The speed of sound in the liquid, $c$, is defined as $c^2=\partial p/\partial \rho$. Coupling (3.1) and (3.2) yields the wave equation (Leighton Reference Leighton1994) in the form
 \begin{equation} \frac{\partial ^{2} \varPhi}{\partial t^{2}}-c^2\,\frac{\partial ^{2} \varPhi}{\partial x^{2}}=0, \end{equation}
where  $\varPhi$ is the velocity potential (Fujikawa et al. Reference Fujikawa, Takeda, Yano and Murai2005). Introducing dimensionless quantities, the wave equation can be written as
 \begin{equation} St^2\,\frac{\partial^2 \varPhi^{{\ast}}}{\partial t^{\ast2}}-\frac{\partial^2 \varPhi^{{\ast}}}{\partial x^{\ast2}}=0, \end{equation}
where  $St=x/(ut)$ is the Strouhal number. The superscript $\ast$ denotes dimensionless quantities. In this work, the length of the liquid column $L$, speed of sound $c$, and duration of acceleration $\Delta t$ are substituted for the characteristic length $x$, speed $u$ and time $t$, respectively. The Strouhal number $St$ for our experiments is thus defined as
 \begin{equation} St=\frac{L}{c\,\Delta t}, \end{equation}
which is the same form as (1.2). In this form,  $St$ can be considered as the ratio between the characteristic length of the geometry $L$ and the length scale required to develop the acoustic nature, i.e. the thickness of the wavefront of the pressure wave.
Equation (3.4) also provides a theoretical insight into the fact that  $St$ reflects the fluid compressibility, as reported by Reijers, Snoeijer & Gelderblom (Reference Reijers, Snoeijer and Gelderblom2017). For $St\ll 1$, (3.4) can be rewritten as
 \begin{equation} \frac{\partial^2 \varPhi^{{\ast}}}{\partial x^{\ast2}}=0, \end{equation}
which describes incompressible and irrotational flow, indicating that the pressure fluctuations due to wave propagation are negligible, as evidenced experimentally in figure 1. In contrast, for  $St\not \ll 1$, the liquid compressibility and pressure fluctuations become visible (figure 1). The pressure fluctuations are derived from the Euler equation (3.2). Integrating this equation with respect to $x$, and assuming $p=p_{0}$ and ${u}=0$ in the far field, gives
 \begin{equation} p-p_{0}=\rho cU, \end{equation}
where  $\rho cU$ is known as the water hammer pressure; this expression is known as Joukovski's equation (Batchelor Reference Batchelor1967; Thompson Reference Thompson1972), a classical formulation for predicting the maximal pressure fluctuations in one-dimensional flows. As explained earlier, in the limit $\Delta t\approx 0$, an instantaneous pressure rise is assumed, and the pressure in the liquid jumps from zero to $\rho cU$. According to the above discussion, in our experiments where the characteristic speed is $U=u_0$, the development of pressure $\bar {P}$ is expected to be dominated by the Strouhal number $St$, which successively connects $\bar {P}=0$ at $St\ll 1$, and $\bar {P}=\rho cu_0$ at $St\gg 1$.
3.2. Experimental results and remarks
3.2.1. Pressure fluctuations in liquids
The amplitude of the velocity fluctuations of the container,  $V/u_0$, increases with Strouhal number $St$, as shown in the inset of figure 6. As discussed, an increase of $St$ values induces larger velocity fluctuations for different floor materials (i.e. $\Delta t$). One might notice that the slope for each $\Delta t$ is different. At the same Strouhal number $St$, the net liquid height $L$ has to be different by definition, suggesting that a proper normalization is desired to scale the influence of either $L$ or $\Delta t$ as discussed in (2.8) and (2.9).
Magnitude of pressure fluctuation  $\bar {P}/(\rho c u_{0})$ versus Strouhal number $St$. Data points show experimental results, and each plot colour denotes a different floor type. The shapes of the data points correspond to the different liquid types (including a hydrogel), as indicated in the legend. An inset compares the amplitude of the velocity fluctuations of the container $V/u_0$ and Strouhal number $St$.
$St$.

Based on this, figure 6 examines the relationship between the amplitude of the spatially averaged liquid pressure change (hereafter, the pressure fluctuation)  $\bar {P}$ and the Strouhal number $St$ for different values of $\Delta t$ and $L$. The use of different floor materials results in $\Delta t$ varying from 0.1 to 2.2 ms, as indicated in the legend. The use of water ( ${\bigtriangleup}$), 1 cSt silicone oil ( $\bigtriangledown$) and ethanol ( $\lozenge$) allows us to vary the speed of sound $c$ and the liquid density $\rho$, which are related to the water hammer pressure. In particular, the speed of sound $c$ in water is approximately 1.6 times faster than that in 1 cSt silicone oil. The density $\rho$ of water is approximately 1.3 times higher than that of ethanol.
The experimental data fall onto a single curve that is insensitive to the experimental parameters tested. All of the data for  $St>0.2$ overlap significantly and approach $\bar {P}/(\rho c u_{0})\approx 1.0$ when $St\geq O(1)$, whereas the data using resin floors for $St\leq 0.2$ are scattered. The collapse of the data in figure 6 indicates that the Strouhal number $St$ describes the gradual pressure development in a one-dimensional tube. Of the conditions tested, $St\sim 0.2$ is the threshold at which the pressure fluctuations become visible and the transition begins ( $\bar {P}/(\rho c u_{0})\approx 0.1$).
Figure 6 also contains data for 10 cSt silicone oil ( $\bigcirc$). This has a greater viscosity than the other liquids, but the same trend can be observed because the viscous boundary layer $\delta \sim \sqrt {\nu \,\Delta t}\sim O(10^{-2})$ mm is expected to be sufficiently thinner than the container radius $\sim O(1)$ mm, as argued in the case of jetting experiments (Onuki, Oi & Tagawa Reference Onuki, Oi and Tagawa2018; Gordillo, Onuki & Tagawa Reference Gordillo, Onuki and Tagawa2020). The surface tension does not significantly affect the pressure fluctuations in the present experiments, despite the surface tension of water being approximately 4.3 times higher than that of 1 cSt silicone oil. From the above, the Strouhal number $St$ provides a powerful means of describing the pressure fluctuations inside widely used low-viscosity liquids.
Previous research on similar systems suggests that the accelerating fluid can be modelled as either a compressible fluid (Fogg & Goodson Reference Fogg and Goodson2009; Kiyama et al. Reference Kiyama, Tagawa, Ando and Kameda2016; Daou et al. Reference Daou, Igualada, Dutilleul, Citerne, Rodríguez-Rodríguez, Zaleski and Fuster2017; Yukisada et al. Reference Yukisada, Kiyama, Zhang and Tagawa2018; Kamamoto et al. Reference Kamamoto, Kiyama, Tagawa and Zhang2021a) or an incompressible fluid (Niederhaus & Jacobs Reference Niederhaus and Jacobs2003; Killian, Klaus & Truscott Reference Killian, Klaus and Truscott2012; Daily et al. Reference Daily, Pendlebury, Langley, Hurd, Thomson and Truscott2014; Garcia-Atance Fatjo Reference Garcia-Atance Fatjo2016; Pan et al. Reference Pan, Kiyama, Tagawa, Daily, Thomson, Hurd and Truscott2017; Gordillo et al. Reference Gordillo, Onuki and Tagawa2020; Kamamoto, Onuki & Tagawa Reference Kamamoto, Onuki and Tagawa2021b; Krishnan, Bharadwaj & Vasan Reference Krishnan, Bharadwaj and Vasan2022), even if the Strouhal number is in the intermediate region  $St\approx O(1)$. Our experimental results (figure 6) obviously show that the pressure wave appears at moderate values of $St$, and its magnitude scales with $St$: the transition from the ‘incompressible fluid’ region starts at $St\sim O(10^{-1})$ ( $St\approx 0.2$ in this experiment), and the ‘compressible fluid’ region is established at $St\sim O(10^{1})$. This is reasonably consistent with the case of laser ablation onto a droplet (Reijers et al. Reference Reijers, Snoeijer and Gelderblom2017), in which fluid compressibility appears in the flow field (and accordingly the pressure field) at $St\gg 1$.
3.2.2. Cavitation inception following pressure fluctuations
It is thus expected that the Strouhal number  $St$ could provide a measure of the tendency for cavitation in a one-dimensional fluid system. The cavitation number for the accelerated liquid (Pan et al. Reference Pan, Kiyama, Tagawa, Daily, Thomson, Hurd and Truscott2017) is written as
 \begin{equation} Ca=\frac{P_{atm}-P_v}{\rho aL}, \end{equation}
where  $a=\bar {U}/\Delta t$. Employing the first-order approximation $\rho L(\bar {U}/\Delta t)\sim St\,\rho cu_0$, we obtain
 \begin{equation} Ca\sim St^{{-}1}\,\frac{P_{atm}-P_v}{\rho c\bar{U}}. \end{equation}
This expression makes sense for situations in which the influence of  $\Delta t$ is dominant over that of other parameters. If $\Delta t$ is dominant, then $Ca$ and $St^{-1}$ play similar roles and are thus interchangeable. Increasing $St$ decreases $Ca$, meaning a greater pressure reduction, as expected, and a higher possibility of cavitation occurring (Daily et al. Reference Daily, Pendlebury, Langley, Hurd, Thomson and Truscott2014; Pan et al. Reference Pan, Kiyama, Tagawa, Daily, Thomson, Hurd and Truscott2017; Eshraghi et al. Reference Eshraghi, Veilleux, Shi, Collins, Ardekani and Vlachos2022). This perhaps explains the findings in previous studies (Garcia-Atance Fatjo Reference Garcia-Atance Fatjo2016; Pan et al. Reference Pan, Kiyama, Tagawa, Daily, Thomson, Hurd and Truscott2017; Xu et al. Reference Xu, Liu, Zuo and Pan2021; Wang et al. Reference Wang, Liu, Li, Zuo and Pan2022), in which the overall cavitation tendency was reasonably classified by considering only $Ca$ as the significance of $\Delta t$ remained largely unchanged.
Figure 7 shows the probability curves of cavitation in silicone oil (10 cSt) for different floor types. Each marker shows the cavitation probability determined through 10 separate experimental runs. The gradual increase in probability is fitted by the sigmoid function (Maxwell et al. Reference Maxwell, Cain, Hall, Fowlkes and Xu2013; Bustamante, Singh & Cronin Reference Bustamante, Singh and Cronin2017; Hayasaka, Kiyama & Tagawa Reference Hayasaka, Kiyama and Tagawa2017; Oguri & Ando Reference Oguri and Ando2018; Bustamante & Cronin Reference Bustamante and Cronin2019) as
 \begin{equation} {\rm Prob.}=\frac{1}{2}\left[1+\mathrm{erf}\left(\frac{St - \alpha}{\beta\sqrt{2}}\right)\right], \end{equation}
where  $\mathrm {erf}()$ is the error function implemented in Matlab, and $\alpha$ and $\beta$ are the fitting parameters. Overall, cavitation starts at $St$ values as low as 0.2, which agrees well with the condition for noticeable pressure fluctuations. Closer observation reveals the influence of the floor material. For relatively stiff floors (i.e. SS400 and aluminium), a 50 % probability of cavitation is reached at $St=0.43$ and $0.46$, respectively. For softer floors, the probability curve is steeper (i.e. smaller $\beta$ values), and the minimum $St$ value required does not vary significantly. The physical reasoning behind this remains unclear, and further investigation is needed. The $\Delta t$ value varies for softer floors (figure 6), so its influence on the results needs to be clarified.
Cavitation probability of silicone oil (10 cSt) for various floor materials, as indicated by colours. The probabilities were determined experimentally through 10 separate experimental runs. The fitting curves were obtained based on (3.10), where the fitting parameters are  $\alpha =0.431$ and $\beta =0.109$ for SS400, $\alpha =0.456$ and $\beta =0.113$ for aluminium, $\alpha =0.396$ and $\beta =0.053$ for epoxy resin, and $\alpha =0.249$ and $\beta =0.0032$ for ABS resin.

3.2.3. Pressure fluctuations and cavitation in a hydrogel
The Strouhal number  $St$ is still a powerful tool for describing the pressure fluctuations in hydrogels. In figure 6, the gelatin data (squares) for various floor types are in good agreement with the other data for standard fluids. The 5 wt% gelatin gel is a water-based viscoelastic material, which behaves as a soft solid in the rest state. At the moment of impact, it is expected that the gelatin gel could flow due to the fast deformation ( $\Delta t\sim O(0.1)$ ms). The above discussion on the Strouhal number $St$ and the water hammer pressure $\rho cu_0$ can be applied to the accelerated hydrogel, although further investigations are needed for a quantitative understanding. Our findings provide an experimental understanding of the inception of cavitation inside the gel (Kang et al. Reference Kang, Ashfaq, O'Shaughnessy and Bagchi2017a,Reference Kang, Chen, Bagchi and O'Shaughnessyb; Kang & Raphael Reference Kang and Raphael2018); see the supplementary material. This phenomenon has been used to address brain injury issues (Yu et al. Reference Yu, Azor, Sharp and Ghajari2020; Lang et al. Reference Lang, Nathan, Zhou, Zhang, Li and Wu2021).
3.3. Analysis of the pressure fluctuations
We now discuss the basic theoretical framework for predicting the pressure fluctuations. First, we consider a gradual pressure increment at the pressure wavefront to confirm the smooth connection between the ‘incompressible fluid’ region ( $St\ll 1$) and the ‘compressible fluid’ region ( $St>1$) as a function of the Strouhal number $St$ (§ 3.3.1). We then compare the theoretical models and the experimental data (§ 3.3.2). We discuss the influence of both the container mass and the pressure wavefront profile.
3.3.1. Model considering thickness of pressure wave
This paper focuses on the case  $St=L/(c\,\Delta t)\approx 1$, where the length of the liquid column $L$ is similar to the length $c\,\Delta t$. We call $c\,\Delta t$ the thickness of the pressure wavefront because it corresponds to the length required to establish the water hammer pressure. In such cases, the pressure fluctuations are not determined by the classical formulation assuming an instantaneous pressure rise (3.7), but are caused by both the temporal pressure change during $\Delta t$ and the reflection of the pressure wave at the boundaries.
The liquid column in the container has a gas–liquid interface at one end, and a solid–liquid interface at the other end. First, we define the function  $f^{\ast }(\xi ^{\ast },t^{\ast })$ describing the liquid pressure change, where $\xi ^{\ast }$ and $t^{\ast }$ are the distance from the solid–liquid interface and the time from the initial impact, respectively. Here, $f^{\ast }$, $\xi ^{\ast }$ and $t^{\ast }$ are dimensionless values expressed as $f^{\ast }=f/\rho cu_{0}$, $\xi ^{\ast }=\xi /c\,\Delta t$ and $t^{\ast }=t/\Delta t$. The pressure change propagates in the direction of $\xi ^{\ast }$. The wavefront is located at $\xi ^{\ast }=t^{\ast }$. We express $f^{\ast }(\xi ^{*},t^{*})$ as
 \begin{equation} f^{{\ast}}(\xi^{{\ast}},t^{{\ast}}) = \left \{ \begin{array}{@{}ll}
1 & (t^{{\ast}}-1 \geq \xi^{{\ast}} ),\\[5pt]
I^{{\ast}}(\xi^{{\ast}}-t^{{\ast}}+1) & (t^{{\ast}}-1 \leq \xi^{{\ast}} \leq t^{{\ast}} ),\\[5pt]
0 & (t^{{\ast}} \leq \xi^{{\ast}}), \end{array}\right. \end{equation}
\begin{equation} f^{{\ast}}(\xi^{{\ast}},t^{{\ast}}) = \left \{ \begin{array}{@{}ll}
1 & (t^{{\ast}}-1 \geq \xi^{{\ast}} ),\\[5pt]
I^{{\ast}}(\xi^{{\ast}}-t^{{\ast}}+1) & (t^{{\ast}}-1 \leq \xi^{{\ast}} \leq t^{{\ast}} ),\\[5pt]
0 & (t^{{\ast}} \leq \xi^{{\ast}}), \end{array}\right. \end{equation}
where  $I^{\ast }(\eta )$ is the pressure change in the pressure wavefront, which is modelled as
 \begin{equation} I^{{\ast}}(\eta) =\frac{1}{2}\sin\left(\eta{\rm \pi}+\frac{\rm \pi}{2}\right)+\frac{1}{2}; \end{equation}
see also figure 8. This sinusoidal-wave-type model is chosen as one of the conventional models that expresses a smooth transition from zero to one. At the same time, it is an intuitive choice from the first-order simplification of our system, in which we might be able to treat the struck tube as the freely vibrating spring–mass system. The reflection of the pressure wave at the boundaries is modelled by assuming the principle of superposition (Thompson Reference Thompson1972). We assume that the mismatching of the acoustic impedance at the gas–liquid and solid–liquid interfaces is significant, hence we neglect the energy loss upon reflection. The sign of the pressure reverses when the pressure wave reflects at the gas–liquid interface, but does not change when the pressure wave collides with the solid–liquid interface, as discussed in Kiyama et al. (Reference Kiyama, Tagawa, Ando and Kameda2016). The local pressure in the liquid column  $p^{\ast }$ is calculated as
 \begin{align} & p^\ast(\xi^\ast,t^\ast,St)=\sum_{i=0}^{{\rm ceil}(({t^\ast}/{St})-1)}g^\ast(\xi^\ast,t^\ast,St,i), \end{align}
 \begin{align} & g^{{\ast}}(\xi^{{\ast}},t^{{\ast}},St,i)=\left \{ \begin{array}{@{}ll} f^*(i\,St+St-\xi^*,t^*) & (i = 4n-1),\\[4pt]
-f^*(i\,St+\xi^*,t^*) & (i = 4n-2),\\[4pt]
-f^*(i\,St+St-\xi^*,t^*) & (i = 4n-3),\\[4pt] f^*(i\,St+\xi^*,t^*) & (i = 4n), \end{array}\right. \end{align}
\begin{align} & g^{{\ast}}(\xi^{{\ast}},t^{{\ast}},St,i)=\left \{ \begin{array}{@{}ll} f^*(i\,St+St-\xi^*,t^*) & (i = 4n-1),\\[4pt]
-f^*(i\,St+\xi^*,t^*) & (i = 4n-2),\\[4pt]
-f^*(i\,St+St-\xi^*,t^*) & (i = 4n-3),\\[4pt] f^*(i\,St+\xi^*,t^*) & (i = 4n), \end{array}\right. \end{align}
where  $i$ represents the number of pressure wave reflections, and $n$ is a natural number.
Outline view of the function of pressure change  $f^{\ast }$, described by the dimensionless time $t^{\ast }$ and dimensionless position $\xi ^{\ast }$. Red, blue and black lines show models with the assumptions that the thickness of the wavefront is 0 (i.e. water hammer theory), that the liquid is incompressible, and that the wavefront has a finite thickness, as modelled herein, respectively.

This model allows us to estimate the temporal changes in pressure. We then calculate the amplitude of the spatially averaged pressure in the liquid,  $\bar {P}$. Hereafter, the amplitude of the pressure change $\bar {P}/(\rho cu_0)$ calculated from the above model is compared with that estimated from the experiments, $mV/(\rho ALu_0)$.
3.3.2. Comparison and discussion
We now compare the experimental results (dataset visualized in figure 6) with the model in figure 9(a). The black solid line expresses our model with consideration of the pressure wavefront thickness (see § 3.3.1). Figure 9(b) shows a magnified view. For  $St = O(10^{-2})$, the fluctuations are not obvious in either the model or the experimental results ( ${\bar {P}}/({\rho c u_{0}})<10^{-2}$), suggesting that the liquid behaves as an incompressible fluid. For $St = O(10^{-1})$, the fluctuations in both the experimental results and the model increase notably, which is associated with an increase in the Strouhal number $St$. Therefore, the effect of liquid compressibility appears at $St = O(10^{-1})$. The proposed model predicts the onset of pressure fluctuations (see figure 9(b), $St\sim 0.2$) and captures the overall trend of these fluctuations with respect to $St$, but overestimates the magnitude of the fluctuations for higher $St$ values ( $St< O(10^{0})$). Though the model implies that the water hammer pressure ( ${\bar {P}}/({\rho c u_{0}})=1.0$) is reached at higher $St$ values, the experimental results saturate at approximately ${\bar {P}}/({\rho c u_{0}})\sim 0.7$ for $St\sim 1$. Although no data could be obtained for $St>O(10^{1})$ due to experimental limitations, we expect that the experimental scenario would differ for higher $St$ values as well because of the influence of the container motion and the profile for the pressure wavefront, as discussed below.
Dimensionless amplitude of the spatial pressure in a liquid as a function of the Strouhal number  $St$. Data points show experimental results, and each plot colour corresponds to a different floor type. The shapes of the data points correspond to different liquids. The red and blue lines show the pressure calculated under the assumptions of compressible and incompressible liquids, respectively. The thin black line represents the calculation result using the model (§ 3.3.1).

First, we investigate the effects of the container motion. Equation (2.1) can be reformulated as follows in dimensionless quantities:
 \begin{equation} mv^{{\ast}}u_{0}+A\rho u_{0} c\,\Delta t\int_{0}^{St} u^{{\ast}}\,{{\rm d}\kern0.7pt x}^{{\ast}}=H({\rm const.}). \end{equation}
The momentum conserved in the system,  $H$, is calculated using $v^{\ast }$ and $u^{\ast }$ immediately after the impact. The velocity of the container $v^{\ast }$ is then calculated from the constant momentum $H$ and the instantaneous velocity in the liquid $u^{\ast }$. We incorporate the function $f^{\ast }$ in § 3.3.1 into the velocity of the container, $v^{\ast }$, as
 \begin{equation} f^{{\ast}}(\xi^{{\ast}},t^{{\ast}})=\left \{ \begin{array}{@{}ll@{}} v^{{\ast}} & (t^{{\ast}}-1 \geq \xi^{{\ast}} ),\\[2pt] I^{{\ast}}(\xi^{{\ast}}-t^{{\ast}}+1) & (t^{{\ast}}-1 \leq \xi^{{\ast}} \leq t^{{\ast}} ),\\[2pt] 0 & (t^{{\ast}} \leq \xi^{{\ast}}). \end{array}\right. \end{equation}
The pressure in the liquid is calculated from (3.13) using the function  $f^{\ast }$. The velocity of the liquid, $u^{\ast }$, is calculated from the equation
 \begin{align} u^{{\ast}}(\xi^{{\ast}},t^{{\ast}},St)&=\sum_{i=0}^{{\rm ceil}(({t^{{\ast}}}/{St})-1)}h^{{\ast}}(\xi^{{\ast}},t^{{\ast}},St,i), \end{align}
 \begin{align} h^{{\ast}}(\xi^{{\ast}},t^{{\ast}},St,i)&=\left \{ \begin{array}{@{}ll@{}} -f^*(i\,St+St-\xi^*,t^*) & (i = 4n-1),\\[4pt]
-f^*(i\,St+\xi^*,t^*) & (i = 4n-2),\\[4pt]
f^*(i\,St+St-\xi^*,t^*) & (i = 4n-3),\\[4pt]
f^*(i\,St+\xi^*,t^*) & (i = 4n). \end{array}\right. \end{align}
\begin{align} h^{{\ast}}(\xi^{{\ast}},t^{{\ast}},St,i)&=\left \{ \begin{array}{@{}ll@{}} -f^*(i\,St+St-\xi^*,t^*) & (i = 4n-1),\\[4pt]
-f^*(i\,St+\xi^*,t^*) & (i = 4n-2),\\[4pt]
f^*(i\,St+St-\xi^*,t^*) & (i = 4n-3),\\[4pt]
f^*(i\,St+\xi^*,t^*) & (i = 4n). \end{array}\right. \end{align}
The velocity of the container,  $v^{\ast }$, is dependent on the momentum of the liquid, which implies some dependence on $L$,
$L$,  $m$,
$m$,  $A$ and $\rho$ (see (3.15)), and can be interchanged with the pressure, as we did for the experimental data. Considering the velocity change of the container, the amplitude of the pressure fluctuations in the liquid is defined by the Strouhal number $St$ and the water hammer pressure.
The revised model is compared with the experimental results in the case of an epoxy resin floor (figure 10). We used two different tubes to vary the mass; the filled and open circles represent the data for the long and short tubes, respectively. The dashed and dotted lines correspond to the model for the long and short tubes, respectively. The revised model taking the change in container velocity into account improves accuracy in terms of the overestimation observed in the original models. The revised model for different tubes also predicts the influence of the tube types, whereas such variations might not necessarily be visible in the experimental data.
Effect of container motion on the pressure fluctuations in a liquid. Open circles show experimental results using short tubes, whereas the closed circles represent the long tubes data. The dotted and dashed lines respectively show the model results considering the motion of the short and long containers.

We also tested the effect of the pressure wavefront profile. For comparison purposes, we used a simple profile, illustrated by the dot-dashed line in figure 11(a). This is expressed by  $I^{\ast }(\eta )$ in (3.11), which is defined as
 \begin{equation} I^{{\ast}}(\eta)=1-\eta. \end{equation}
This model overpredicts the pressure fluctuations for smaller  $St$ values ( $St< O(10^{-1})$), but gives better agreement for larger $St$ values (figure 11b). This suggests that the profile of the pressure wavefront could affect the accuracy of the model predictions, which provides a possible explanation for the difference between the experimental results and the original model (figure 9). In our experiments, the profile of the pressure wavefront is assumed to be dependent on the floor material. Hence the effect of the pressure profile causes variations in the pressure fluctuations measured experimentally at the same $St$, as well as the cavitation trend for each floor type. Our recent attempt to measure the pressure directly suggested that the two different shapes of the wavefront that we tested here might be still too simple to model the actual phenomena (see the supplementary material). The discussion above should be considered as a starting point, thus further research would be needed.
(a) Profile of the pressure wavefront. (b) Dimensionless fluctuations in water hammer pressure with respect to Strouhal number. The solid and dot-dashed lines represent different wavefront profiles.

In addition to the above considerations, there are two possible reasons for differences between the model and experiments: the vibration of the container and the curvature of the bottom of the container. Although the model does not consider the effect of vibrations in the container, the liquid can vibrate due to the propagation of the pressure waves, inducing the fluid–structure interaction. The momentum in the experimental system is converted to vibrations. The vibration of the container after the rebound might also be related to the amount of liquid inside the system (Killian et al. Reference Killian, Klaus and Truscott2012; Kiyama et al. Reference Kiyama, Tagawa, Ando and Kameda2016; Andrade et al. Reference Andrade, Catalán, Marín, Salinas, Castillo, Gordillo and Gutiérrez2023). Another important aspect of the tube vibration is that in the radial direction. Although it is not considered the primary source of the free surface vibration that we have been discussing as the additional measurements on pressure wave in liquid column and acceleration at the container wall suggested (see the supplementary material), it perhaps assists in the formation of fine droplets when the top of the tube is not tightly glued (Kiyama et al. Reference Kiyama, Tagawa, Ando and Kameda2016). It would emphasize the rich physics contained in this rather simple system and indeed be an important aspect of future work. Additionally, the model does not consider the curvature of the bottom of the container, which leads to the formation of a plane wave in this region. However, we used a container with a rounded bottom in the experiments. A radial phase lag is likely to occur, and the fluctuations will differ from those of the model. Related to this, in Kiyama et al. (Reference Kiyama, Tagawa, Ando and Kameda2016), it is discussed that the rounded tube bottom might change the frequency response of the system slightly. It might resolve the slight discrepancies observed in the comparison between the model and the experiments (i.e. acceleration, free surface vibration, and pressure, as discussed in the supplementary material).
4. Conclusions
This paper has shown that the Strouhal number  $St$ provides a measure of the fluid compressibility in a one-dimensional system, unlike other dimensionless indicators such as $Ma$ and $Fr$. Experiments with various liquid column depths inside a tube were performed for different liquid velocities, acceleration durations and media types (four standard liquids and one hydrogel), producing a wide range of Strouhal numbers, $0.02 \leq St \leq 2.2$. The pressure fluctuations, which were calculated based on the measured acceleration, indicate a unified trend as a function of $St$ for a wide range of parameters (figure 6), suggesting that $St$ gives a good measure of the liquid compressibility in cases where the pressure impulse approach breaks down. Our experimental findings regarding the importance of $St$ are consistent with those from numerical work on bursting droplets (Reijers et al. Reference Reijers, Snoeijer and Gelderblom2017), suggesting that our discussion related to $St$ might even be applicable in different geometries. We also found that $St$ is useful for describing the cavitation tendency (figure 7). In addition to empirical relations, we derived a conceptual model in which a modified version of water hammer theory accounts for the finite thickness of the pressure wavefront. This simple model describes the overall trend of the experimental data: the magnitude of the pressure fluctuations increases as the Strouhal number $St$ increases (figure 9). Implementing corrections in the model allowed us to show that both the motion of the surrounding container and the profile of the pressure wavefront influence the pressure development (see figures 10 and 11).
Supplementary material
Supplementary material and movies are available at https://doi.org/10.1017/jfm.2024.1190.
Acknowledgements
We thank Professor J. Rodríguez-Rodríguez for fruitful discussions. We also thank Dr A. Franco-Gomez, Professor M. Muto, Dr H. Onuki and Dr P. Sonar from Tokyo University of Agriculture and Technology for proofreading the manuscript and making a number of helpful suggestions.
Funding
The authors would like to thank Mr I. Kikuchi for his genuine support in conducting a series of additional experiments. This work was partly supported by JSPS KAKENHI through grant nos JP16J08521, JP17H01246, JP20H00223, JP20H00222, JP20K20972, JP24H00289 and JP23K19089, the Japan Science and Technology Agency PRESTO (grant no. JPMJPR21O5) and the Japan Agency for Medical Research and Development (grant no. JP22he0422016), and by funding from the Institute of Global Innovation Research at the Tokyo University of Agriculture and Technology.
Declaration of interests
The authors report no conflict of interest.


 Open access