


Introduction
A dramatic increase in population size following the transition from foraging/hunting to farming has become a baseline expectation in the archaeological record, having been routinely observed in different palaeodemographic proxies worldwide. Genetic, skeletal and settlement data show evidence of an increase in population size following the shift in subsistence economy around the world, regardless of the date of this shift (e.g. Bocquet-Appel & Naji Reference Bocquet-Appel and Naji2006; Shennan et al. Reference Shennan2013; Kim et al. Reference Kim, Lee and Crema2021; Speidel et al. Reference Speidel, Cassidy, Davies, Hellenthal, Skoglund and Myers2021), providing empirical support for the so-called Neolithic Demographic Transition (NDT) (Bocquet-Appel Reference Bocquet-Appel2002). At its core, the NDT model hypothesises that rapid population growth following the introduction of farming was primarily driven by a radical change in life-history strategy (Wells & Stock Reference Wells and Stock2020), as decreasing mobility and greater access to reliable food supplies promoted a reduction in the average interbirth interval. Yet the transition to farming is also associated with population dispersal, with variously sized migrant communities of farmers interacting and admixing with incumbent populations of hunter-gatherers (Skoglund et al. Reference Skoglund2012; Harris Reference Harris2017; Hudson et al. Reference Hudson, Nakagome and Whitman2020). The combined effect of these processes shaped much of the cultural and biological diversity observed among contemporary populations across the globe.
While the long-term implications of NDT are generally well understood, the immediate impact of this transition has received less attention, partly due to the coarse chronological resolution offered by proxies such as skeletal and genetic data. Yet, the demographic trajectories of the first few centuries following the appearance of farming can provide invaluable insights into the nature and the tempo of the transition itself. Indeed, archaeological evidence from various regions across the globe increasingly suggests that the initial stages of the transition were characterised by different rates of diffusion of the new subsistence economy, including instances of short or prolonged coexistence of foragers and farmers (Lipson et al. Reference Lipson2017), varying degrees of reliance on domesticates (Stevens et al. Reference Stevens, Crema and Shoda2022) and even episodes of abandonment of farming practices (Bellwood Reference Bellwood2005; Oota et al. Reference Oota2005). These and other processes may effectively lead to different stages of demographic transitions, characterised by different growth rates or even episodes of population boom and bust (Bandy Reference Bandy2005; Shennan et al. Reference Shennan2013; Lesure et al. Reference Lesure, Sinensky, Schachner, Wake and Bishop2021; Lima et al. Reference Lima2024). Examining these distinct demographic trajectories can provide insights into the nature and impact of early farming economies and their potential inter-regional variations.
The adoption of rice farming in prehistoric Japan represents an exceptional opportunity for contributing to this research agenda. While some evidence of plant management (e.g. chestnut and horse-chestnut) and small-scale cultivation (azuki, soybeans and barnyard millet) are observed from around the fourth millennium BC (Crawford Reference Crawford2011), a more notable shift in subsistence economy begins in the first millennium BC with the dispersal of rice and millet (foxtail and broomcorn) farming (Fujio Reference Fujio2021). The diffusion of these crops within the Japanese archipelago was initiated by migrant farmers from the Korean peninsula, who were also responsible for the staggered import of new pottery styles, burial customs, various toolkits associated with farming and metallurgy (Mizoguchi Reference Mizoguchi2013).
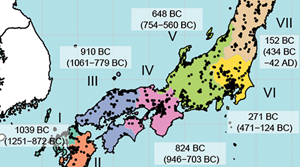
The diffusion of these new traditions was, however, accompanied by substantial regional variation in tempo (i.e. the rate of geographic dispersal) and mode (i.e. demic versus cultural diffusion), as reflected by different combinations of cultural elements of continental origin observed across the Japanese islands (Barnes Reference Barnes2019). Several authors (Kobayashi Reference Kobayashi and Nishimoto2009; Leipe et al. Reference Leipe, Long, Wagner, Goslar and Tarasov2020; Fujio Reference Fujio2021) have observed that the diffusion of rice agriculture was potentially characterised by episodes of slowing down, accelerating, possible leapfrogging transmission, as well as instances of a return to forager-based subsistence economies. While many of these suggestions are based on qualitative and descriptive accounts, a recent study using a Bayesian analysis of charred rice grains confirmed many of these speculations, providing a new chronology of the dispersal of rice farming (Crema et al. Reference Crema, Stevens and Shoda2022). According to this work, rice farming first appeared in northern Kyushu (region I, Figure 1) at the turn of the first millennium BC and subsequently moved rapidly eastwards into western Honshu (regions III & IV), while its expansion to the southern portion of Kyushu (region II) took considerably longer. Rice farming reached central Japan around the eighth–sixth centuries BC after a possible minor slowdown in its dispersal. Expansion towards north-eastern Japan possibly occurred through leapfrogging to the northern tip of Honshu (Aomori, region VIII) at around the second half of the fifth century BC. The dispersal of rice farming in the remaining portions of Honshu (regions VI and VII) shows considerable delays, with arrival dates estimated around the third and second centuries BC.
Distribution of the eight regional units of analysis (from Crema et al. Reference Crema, Stevens and Shoda2022) along with the posterior mean and 95 per cent highest posterior density interval of the arrival dates (in brackets) and the sampling location of radiocarbon dates used in this study (black dots) (figure by authors).

The first millennium BC can thus be considered a long period of transition, where, over a timespan of nearly 800 years, different regions of the archipelago experienced potentially different trajectories of cultural, social and economic transformation. Putative drivers that might have conditioned the dispersal rates of rice farming include social factors, such as pre-existing connectivity networks (Kobayashi Reference Kobayashi and Hirose2007), as well as environmental constraints on its cultivation, such as temperature and soil type (Brady Reference Brady1981; Hussain et al. Reference Hussain, Khaliq, Ali, Hussain, Qadir, Hussain, Hasanuzzaman, Hakeem, Nahar and Alharby2019). It is worth noting that these patterns do not provide insights into the rate of diffusion of farming within each region. Regions with an earlier-than-expected arrival date (e.g. Aomori, region VIII) do not necessarily show the same uptake of farming compared with regions that experienced some initial resistance with a later arrival date (e.g. Kanto, region VI). Indeed, archaeobotanical evidence demonstrates varying contributions of wild-plant resources persisting throughout the Yayoi period (c. tenth century BC–third century AD) and beyond (Stevens et al. Reference Stevens, Crema and Shoda2022), hinting that the new subsistence economy was not necessarily as central nor its impact the same across the archipelago.
Regional comparisons of the population dynamics of the first millennium BC are, however, currently lacking. Most studies are focused on smaller regional reconstructions, typically based on time frequencies of sites or residential units with limited chronological accuracy based on ceramic typologies (Fujio Reference Fujio2009; Matsugi Reference Matsugi2014). Shūzō Koyama's (Reference Koyama1978) seminal study offers the only large-scale comparative assessment of Yayoi demography. Koyama's analyses provide estimates of absolute mean population sizes of different regions of the archipelago, revealing generally higher population densities in western Japan. These analyses do not, however, factor in differences in the arrival of rice cultivation. Consequently, some of the observed variations in the number of archaeological sites from which these estimates were derived might be purely the result of how long farming was practised in each region. Here, we investigate Yayoi population dynamics by focusing specifically on the demographic consequences of the introduction of rice agriculture. We limit our analyses to the diffusion of rice for two reasons: 1) there is no reliable absolute chronology of the arrival times of millet in different regions of Japan; 2) archaeobotanical evidence suggests that, at most, the offset in the arrival of these crops is limited to 100–200 years (Nakazawa Reference Nakazawa2017), with millets potentially arriving before rice.
Our objective is to determine whether the varying rates of dispersal of rice agriculture were linked to varying reliance on farming practices and consequently resulted in different population growth rates. We investigate this by estimating the mean annual population growth rates after the putative date of the appearance of rice farming inferred by Crema and colleagues (Reference Crema, Stevens and Shoda2022) in eight geographic regions (Figure 1). Our choice was dictated by the availability of clear sampling units with internally homogeneous diffusion rates and by the fact that arrival-date estimates were based on statistical inference rather than the earliest dated sample.
We infer population growth rates before and after the estimated arrival of rice agriculture in each region using time frequencies of radiocarbon (14C) dates. The use of 14C dates as a demographic proxy has led to intense debate over the past decade (e.g. Timpson et al. Reference Timpson, Manning and Shennan2015; Torfing Reference Torfing2015a, Reference Torfing2015b; for a broader review, see also Crema Reference Crema2022), with concerns expressed for the interpretive value and reliability of such an approach. Many (although not all) of these concerns have now been tackled either by developing more robust statistical methods for addressing specific limitations of radiocarbon data or by identifying the limits of their inferential power as a population proxy in specific contexts and datasets. While a thorough review of the utility (and the limitations) of this approach is outside the scope of this article (Carleton & Groucutt Reference Carleton and Groucutt2020; Crema Reference Crema2022), it is worth highlighting here that time-frequency analyses of radiocarbon dates are particularly well suited for the context of our study for two reasons. Firstly, despite recent advances, there is no clear consensus on the absolute chronology of phases and sub-phases of the Yayoi period, making the use of other population proxies based on these chronological frames of reference problematic. The increased trust in radiocarbon dates has radically transformed the chronology of the Yayoi period in recent years, with its beginning pushed back from the fourth to the eighth or ninth century BC (Shoda Reference Shoda2010). Nevertheless, a thorough and formal examination of the radiocarbon record associated with each ceramic phase is still lacking and, consequently, the extent of chronological uncertainty in start and end dates is still unknown. Secondly, given that our primary interest is in an estimate of the annual growth rate over a defined time interval, we expect that the potential impact of idiosyncrasies in sampling efforts is likely to average out with a smaller risk of biases in the estimates.
Materials and methods
Population growth rates before and after the arrival of rice agriculture in Japan have been inferred by examining the time frequency of anthropogenic radiocarbon dates under the broad assumptions of the so-called ‘dates as data’ approach (Rick Reference Rick1987). We obtained radiocarbon data by filtering the database published by the National Museum of Japanese History (Kudo et al. Reference Kudo, Sakamoto, Hakozaki, Stevens and Crema2023) using strict inclusion criteria that eliminate any duplicates, errors and samples that are not clearly associated with anthropogenic contexts or are susceptible to potential reservoir effects. Calibration of the resulting dates using the IntCal20 calibration curve (Reimer et al. Reference Reimer2020) allowed only samples with a cumulative calibrated probability above 0.5 within the time window of analyses to be considered in the following analyses (see Table 1).
Estimated arrival time of rice agriculture (from Crema et al. Reference Crema, Stevens and Shoda2022), sample sizes for radiocarbon and settlement analyses, and estimated Yayoi period average population density for the eight regions in the Honshu, Shikoku and Kyushu islands, following an updated methodology from Koyama (Reference Koyama1978) and the latest site counts from the Japanese Agency for Cultural Affairs (2016).

Growth rates are estimated using the direct hierarchical Bayesian approach introduced by Crema and Shoda (Reference Crema and Shoda2021). In contrast to typical statistical routines based on regression analyses over summed probability distribution (SPD) of radiocarbon dates, this approach provides unbiased estimates that correctly account for sampling error and calibration effects (Crema Reference Crema2022). More specifically, we fitted intrinsic conditional autoregressive (ICAR) double-exponential growth models with growth rates r1 and r2 and a change-point c, for each of the eight geographic regions defined previously in Crema and colleagues (Reference Crema, Stevens and Shoda2022) (see Figure 1). In contrast to previous applications of the double-exponential growth model (Crema & Shoda Reference Crema and Shoda2021; Kim et al. Reference Kim, Lee and Crema2021), the change point c is not inferred but instead treated as a constant using the mean estimated arrival date of rice farming in each region (Crema et al. Reference Crema, Stevens and Shoda2022). The ICAR component of the model accounts for the spatial autocorrelation of the inferred parameters, ensuring that the growth estimates for each region are in part informed by neighbouring regions. It is worth noting that the choice of the double-exponential model does not imply that we assume the population dynamics before and after the arrival of farming had an exponential trajectory. Instead, we interpret the estimates of r1 and r2 as the average annual growth rate over a given timespan before and after the putative date of the arrival of farming. While more complex growth models acknowledging differential growth rates can be fitted, the objective here is to capture the average trend following similar studies carried out elsewhere (Zahid et al. Reference Zahid, Robinson and Kelly2016; Silva & Vander Linden Reference Silva and Vander Linden2017). We fit two versions of our model using different time windows—one covering a shorter time interval of ±500 years from the arrival of farming and one with a slightly longer interval of ±750 years. These intervals provide a good tradeoff between sample size and a timespan that does not include the subsequent Kofun period (c. third–seventh centuries AD), which was characterised by further economic and social transformations of continental origin.
In order to address potential concerns about the reliability of radiocarbon dates as a demographic proxy and to provide an interpretative framework based on absolute population sizes, we collated two additional datasets. Firstly, we examined the time frequency of Yayoi settlements using the Jomon and Yayoi settlement database of the National Museum of Japanese History (2012). The database consists of over 25 000 records of site phases, with most entries associated with a start and end date derived from the relative chronology reported in the original excavation report. Given that these start and end dates represent a mixture of occupation length and chronological uncertainty, we iteratively sampled a random date from the reported time interval and generated a kernel density estimate at each iteration. The resulting composite kernel density estimate (cKDE) provides a measure of change in site density over time that accounts for the chronological uncertainty of the settlement data. However, as noted above, conversion from relative to absolute chronology remains problematic and we stress that interpretations should be limited to the characterisation of broader trends.
Finally, absolute population sizes for the eight regions are inferred using a revised calculation of the approach adopted by Koyama (Reference Koyama1978). The core method consists of using eighth-century AD historical population estimates and site counts as a baseline for converting the number of sites attributed to the Yayoi period into an average population size while accounting for variations in individual settlement size. More formally, Koyama's method is defined by the following equation:
 $${\rm P}_{{\rm Yayoi, i}} = {\rm P}_{{\rm Haji, Kanto}}/ {\rm S}_{{\rm Haji, Kanto}} \times {\rm C}_{{\rm Yayoi/Haji}} \times {\rm S}_{{\rm Yayoi, i}}$$
where PYayoi,i is the average estimated population size during the Yayoi period for the region i, PHaji,Kanto is the population size estimated from historical tax records during the Haji period (c. AD 250–1185) in the Kanto region, SHaji,Kanto and SYayoi,i are the number of recorded archaeological sites in Kanto and the target region i, and CYayoi/Haji is the constant of the population ratio between a typical Yayoi and Haji settlement, estimated to be ⅓ (Koyama Reference Koyama1978). The ratio PHaji,Kanto / SHaji,Kanto in equation [1] effectively estimates the contribution of each site to the total population estimate. Crucially, equation [1] is unaffected by sampling fraction as long as we can assume that such a fraction is a) the same for the Yayoi and Haji periods and b) comparable between Kanto and other regions.
We follow these principles making two notable changes: we update sites from the Haji and Yayoi periods using the figures published by the Japanese Agency for Cultural Affairs (2016), and modify equation [1] as follows:
 $${\rm P}_{{\rm Yayoi, i}} = {\rm P}_{{\rm Haji, j}}/ {\rm S}_{{\rm Haji, j}} \times {\rm C}_{{\rm Yayoi/Haji}} \times {\rm S}_{{\rm Yayoi, i}} \times {\rm D}_{{\rm Haji/Yayoi, i}}$$
where PHaji,j / SHaji,j is the site to population ratio for the region j containing the prefecture i, and DHaji/Yayoi,i is the relative duration of the Yayoi period in i. Using this ratio instead of PHaji,Kanto / SHaji,Kanto allows us to account for possible inter-regional variations in sampling fraction. We apply equation [2] for all Japanese prefectures and combine our estimates using the regions defined by Crema and colleagues (Reference Crema, Stevens and Shoda2022). Additional details on material and methods are provided in the online supplementary material (OSM). All data and R scripts are available on a dedicated GitHub repository (https://github.com/ercrema/yayoi_demo) and permanently archived on Zenodo (https://doi.org/10.5281/zenodo.11398533).
Results
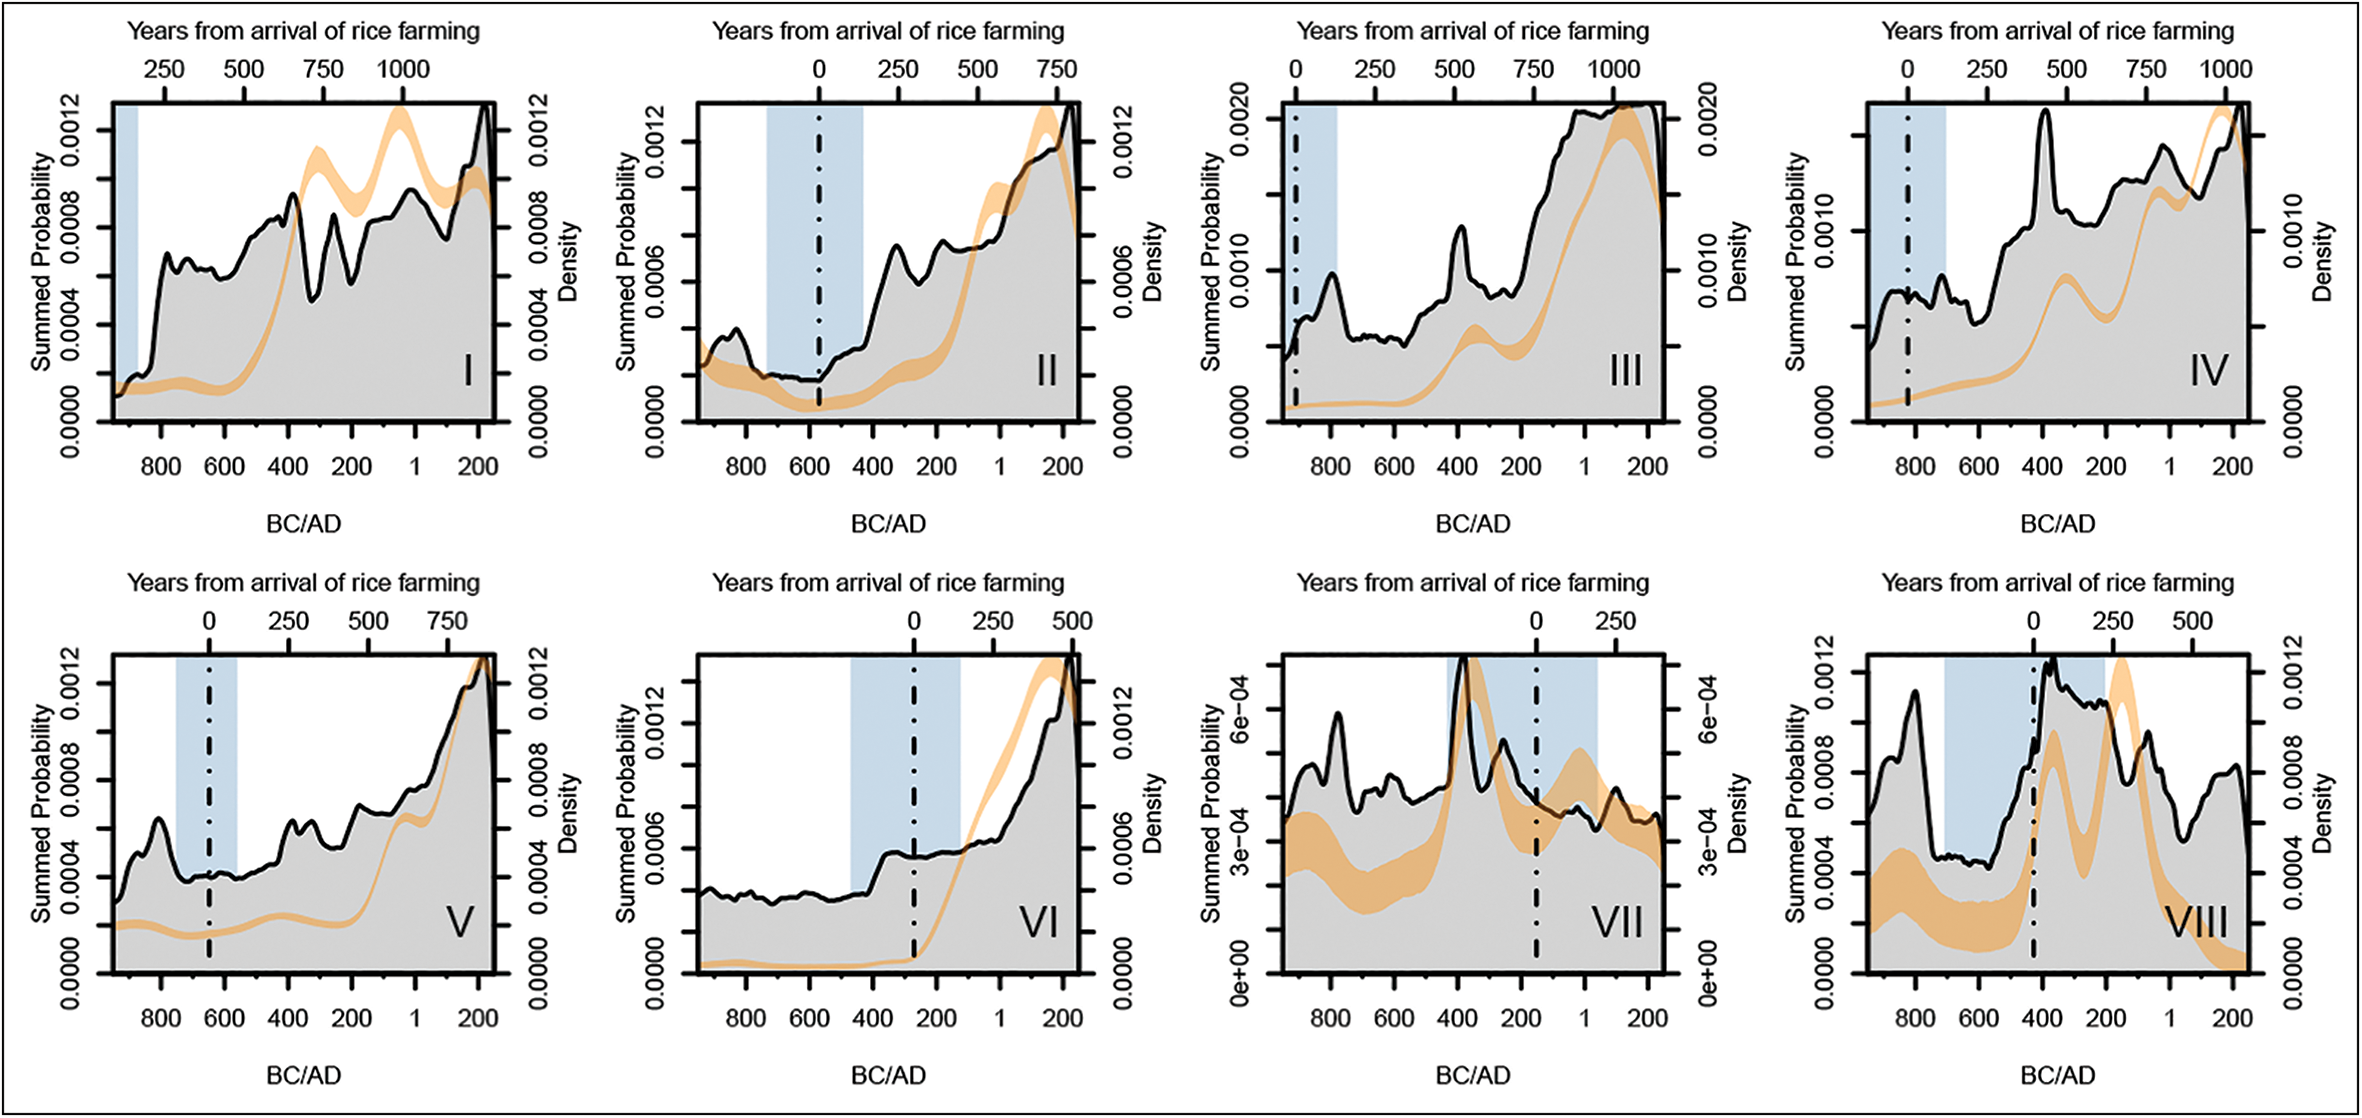
Figure 2 compares the radiocarbon SPDs to the settlement cKDEs of the eight regions examined. Notwithstanding the impact of calibration effects, sampling error and the imprecision in ceramic chronology, the two proxies show a general agreement: regions II–VI suggest a marked population increase from c. 200 BC; regions VII and VIII show similar fluctuations with no clear upward trend during the Yayoi period. The largest discrepancy between the two sets appears to be in region I, where the SPD shows an earlier population uptake (at around 800 BC) compared to the settlement data (at 400 BC). However, this interval corresponds to a calibration plateau and, given that the reliability of the conversion from relative to absolute chronology is still an open question, the extent of this discrepancy remains debatable.
Comparison of SPDs (grey areas) and cKDE of settlement data (orange band). The vertical point-and-dash lines indicate the mean posterior estimate of the arrival time of rice agriculture (from Crema et al. Reference Crema, Stevens and Shoda2022), while the blue-shaded region represents the 95 per cent highest posterior density interval (figure by authors).
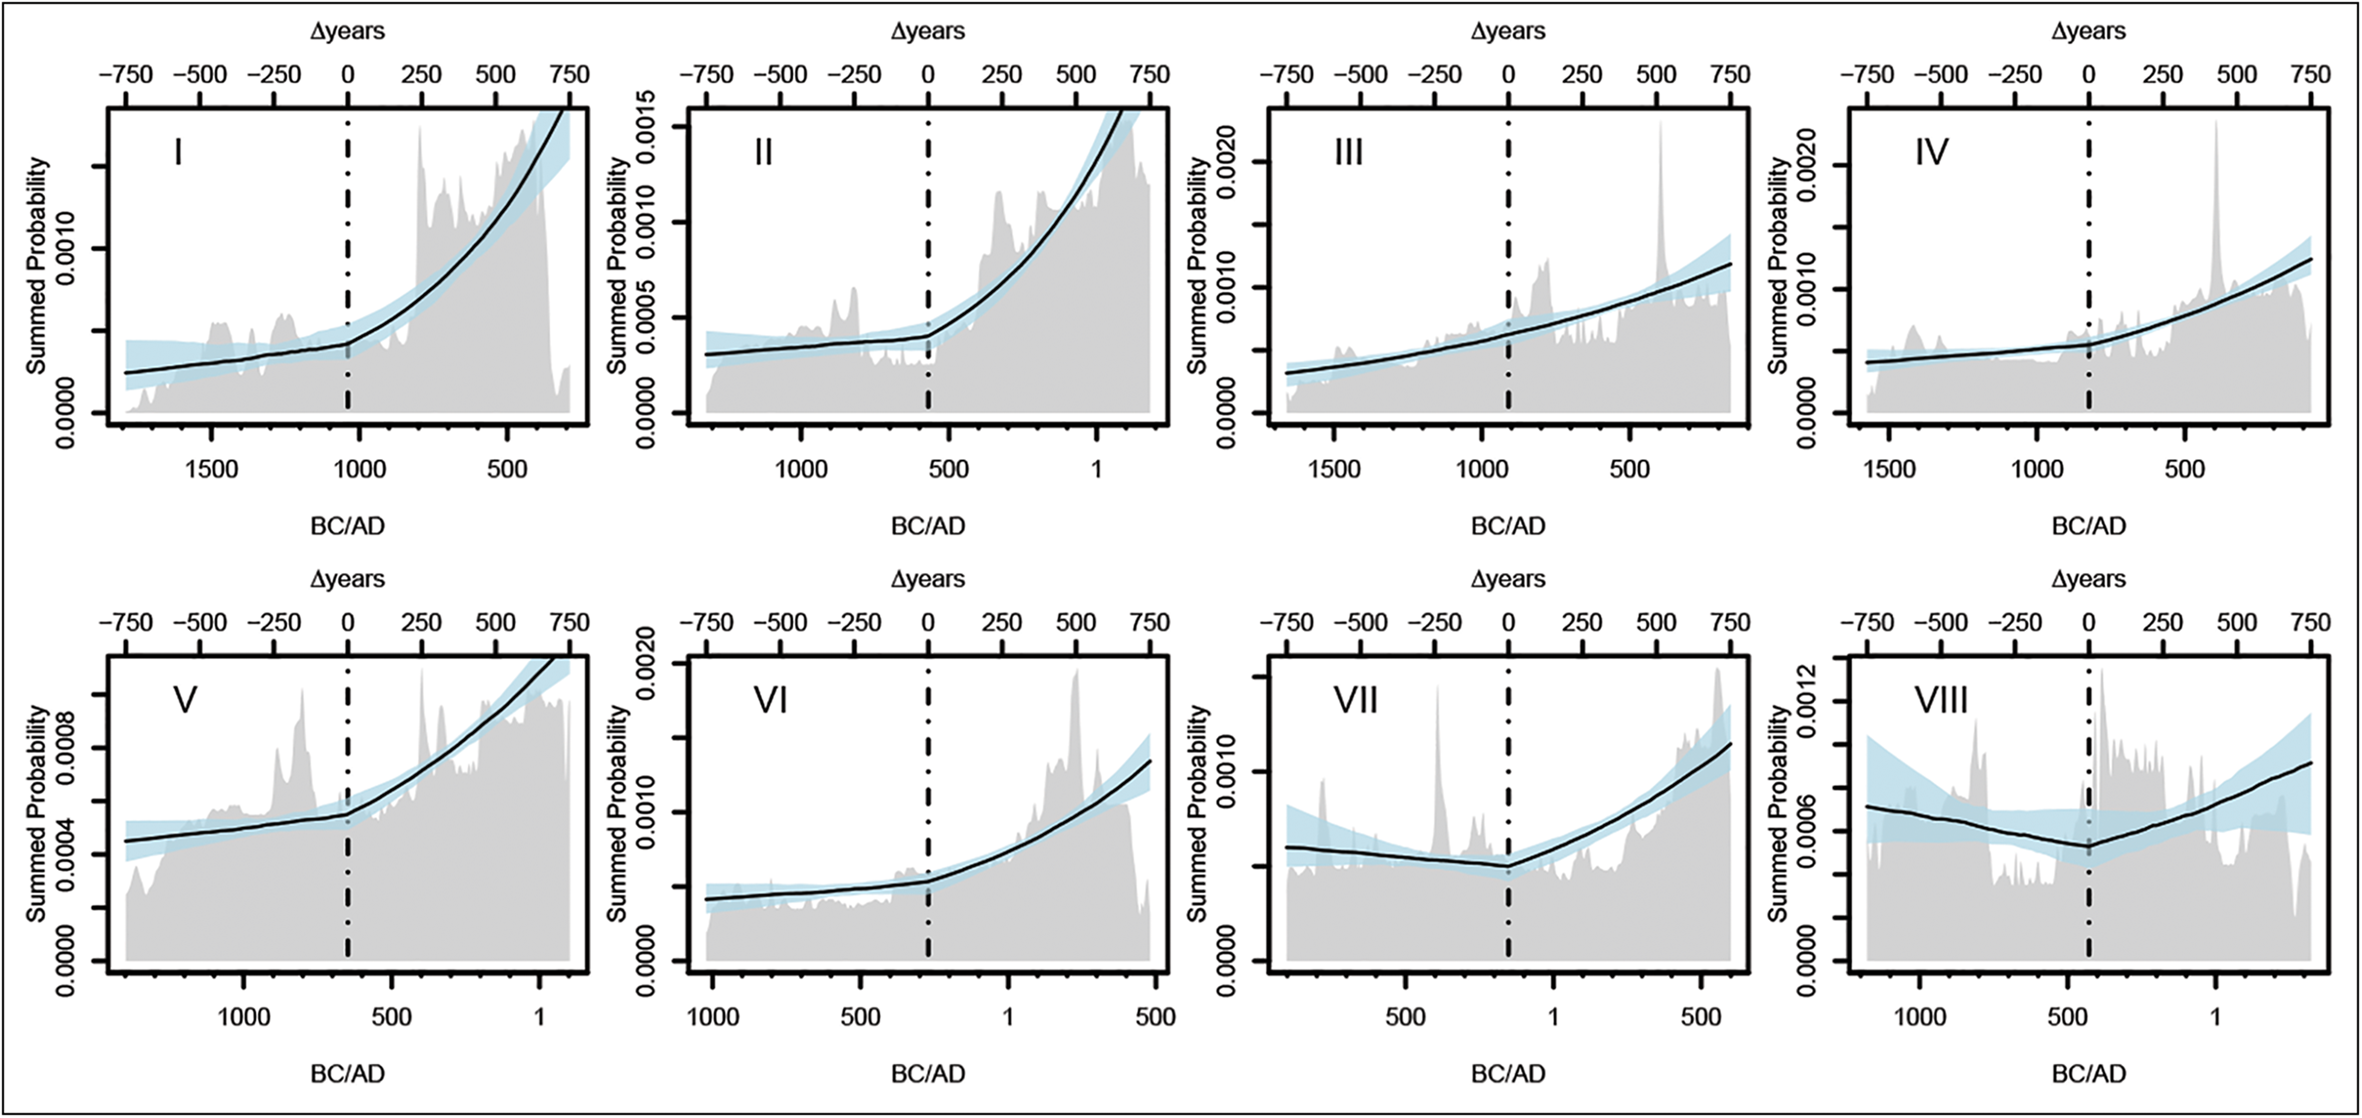
Figures 3 and 4 show the fitted double-exponential model over the SPD for each of the eight regions examined, while Figure 5 summarises the estimated growth rates before and after the arrival of farming for all regions. Overall, the shorter time window analyses (±500 years) returned growth rates with wider posteriors and larger deviations from zero. These results are due to the higher degree of uncertainty associated with smaller sample sizes and the fact that, with longer time intervals, there is a larger possibility of deviations from the exponential trend, resulting in average absolute growth rates close to zero.
Posterior estimates of the double-exponential growth model (500-year window, dashed lines indicate estimated arrival of rice agriculture). Grey-shaded areas show the observed SPDs, solid lines are the fitted model (posterior mean) and the blue-shaded ribbon is the 95 per cent highest posterior density interval (figure by authors).

Posterior estimates of the double-exponential growth model (750-year window, dashed lines indicate estimated arrival of rice agriculture). Grey-shaded areas show the observed SPDs, solid lines are the fitted model (posterior mean) and the blue-shaded ribbon is the 95 per cent highest posterior density interval (figure by authors).
Estimated growth rates of rice agriculture. Each rectangle represents a different region, with the horizontal edge representing the timespan and the vertical edge the 95 per cent highest posterior estimate of the growth rate. See OSM for raw figures (figure by authors).
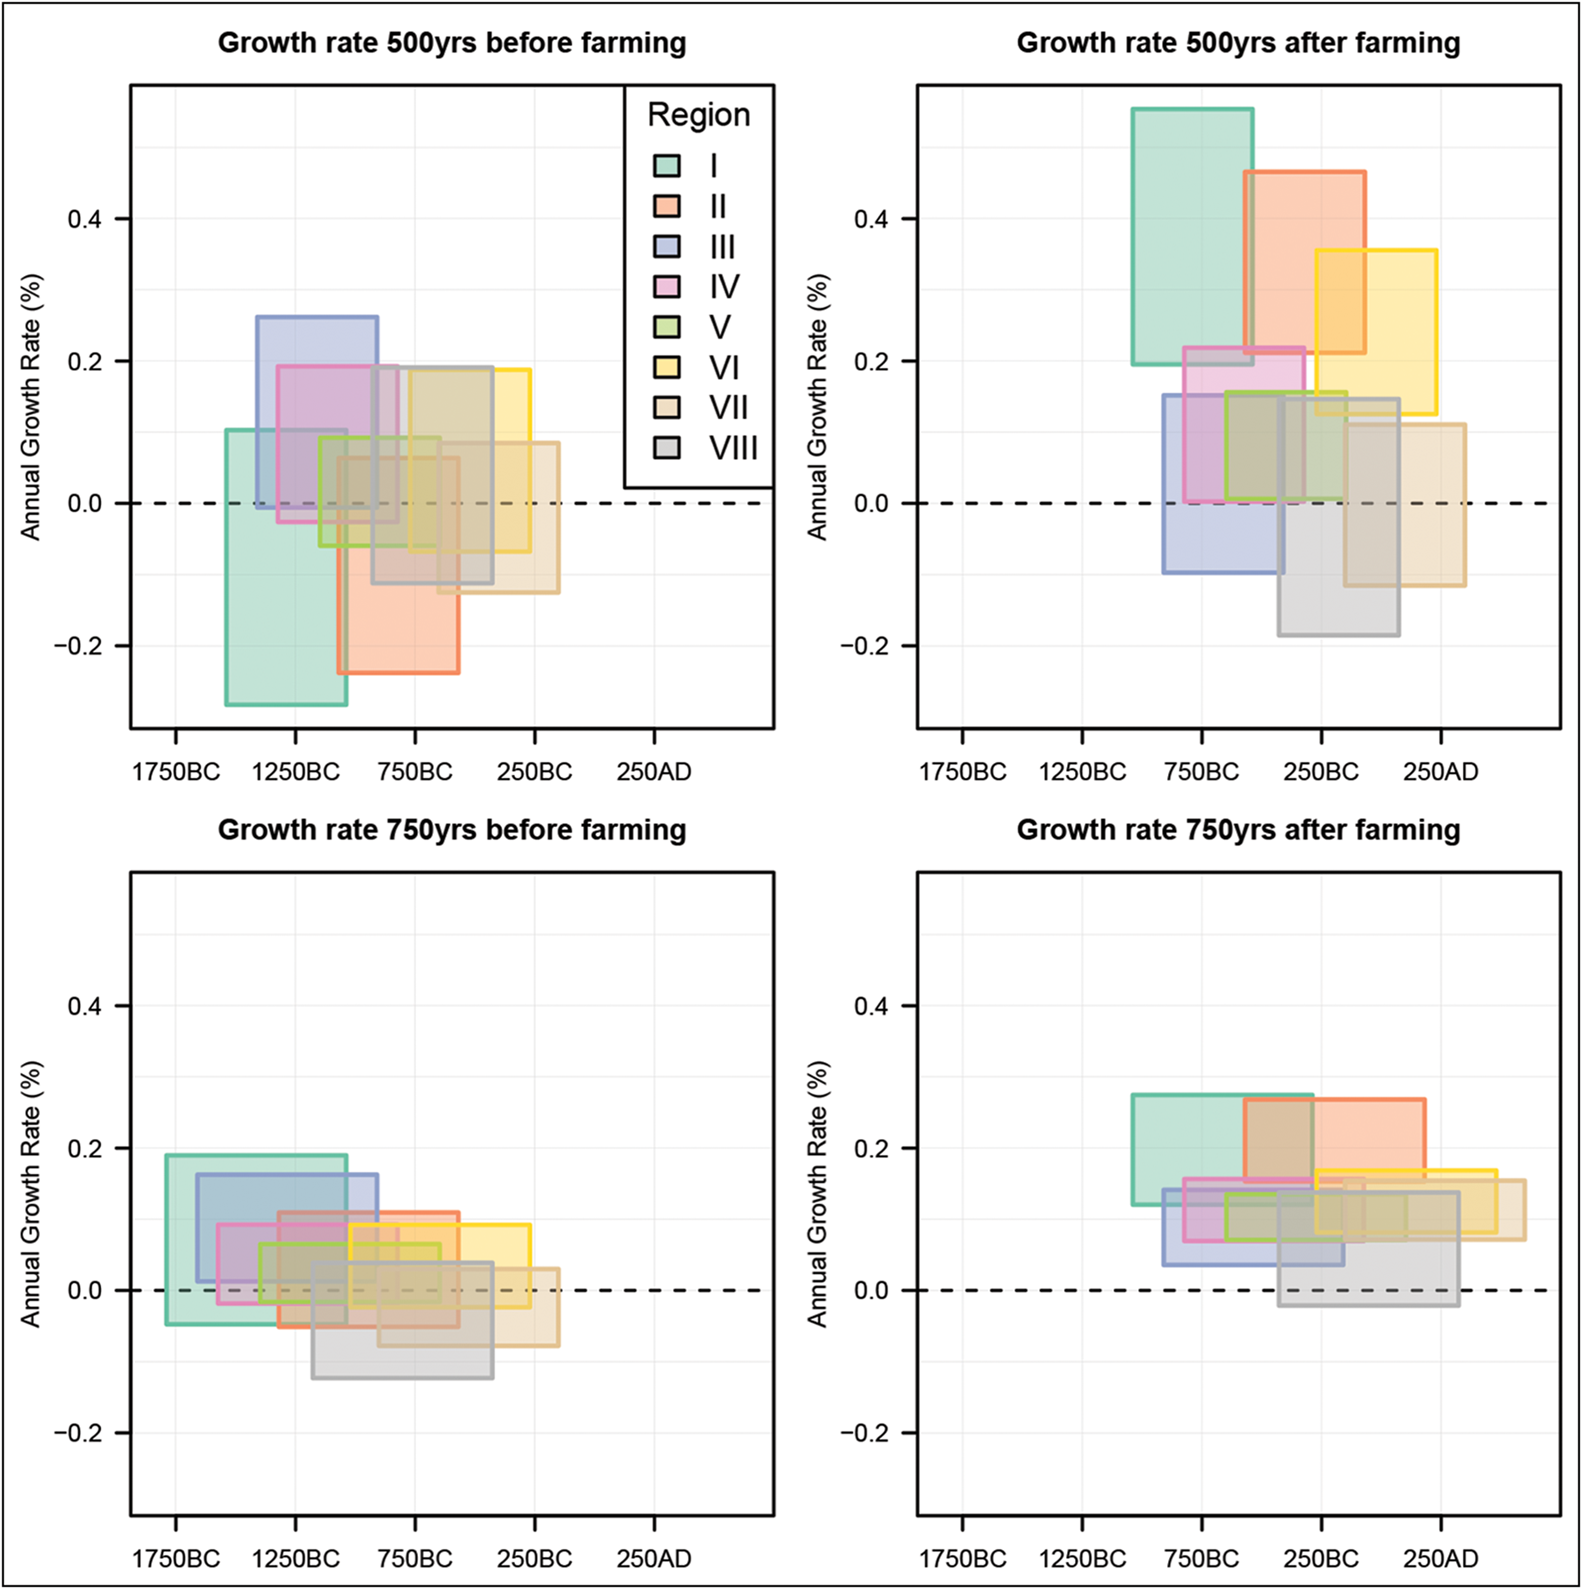
Our results indicate that, with some notable exceptions, the estimated growth rate after the arrival of rice agriculture was higher than the one inferred from the time interval before the arrival of farming (Figure 6). However, detailed examination reveals substantial inter-regional variations in the magnitude of growth rates and notable differences between the shorter and longer timespan analyses.
Highest posterior density estimates of the difference in growth rate after and before the arrival of farming (Δr) (figure by authors).
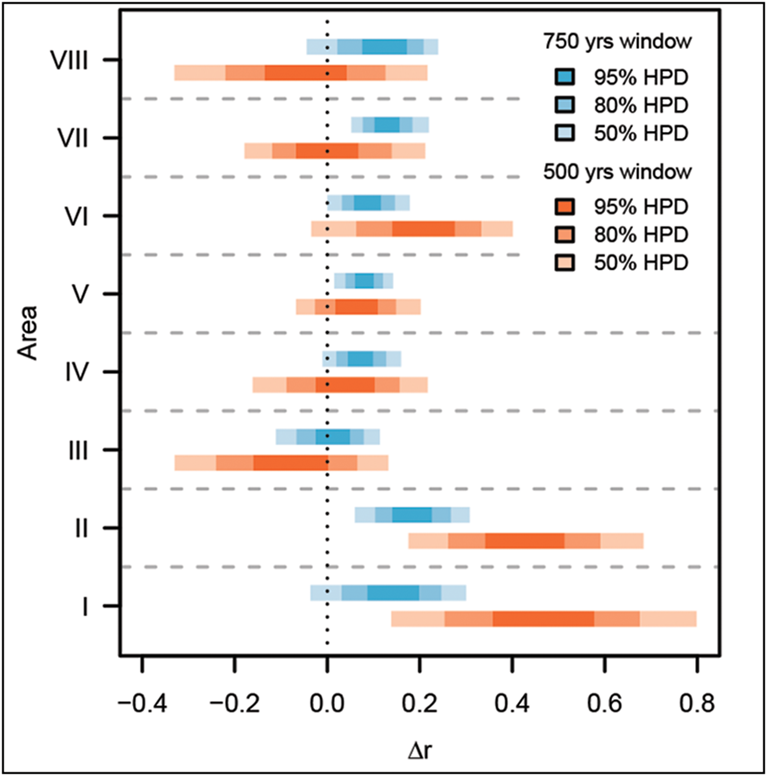
The two regions on the island of Kyushu (I and II) show the most drastic change (Figure 5) and the highest annual growth rate after the arrival of farming for both the short and longer time windows of analysis. In contrast, the Tohoku region on the island of Honshu (regions VII and VIII) shows some of the lowest growth rates, with no clear evidence of an increase in population during the first 500 years of rice farming. When a longer time window is considered, region VII shows comparable estimates to other regions, but region VIII (Aomori) still includes negative rates in its 90 per cent posterior interval. Regions IV, V and VI show comparable growth trajectories, particularly with the longer time window of 750 years. At shorter time scales, however, our analyses suggest a higher absolute growth rate and change in region VI, and negligible difference in the population trajectory before and after farming in region IV. Our analyses do not find any evidence of a tangible change in growth rate for region III before and after the onset of rice agriculture, although it should be noted that the estimated rates of the 750-years-time window are comparable to those observed in regions IV–VI.
Our absolute population density estimates (Table 1) are substantially different to Koyama's original study (see OSM for details on why). Overall, despite accounting for different timings for the transition to farming, these estimates are directly correlated with the arrival time of rice agriculture in western Japan. Region I shows the highest population density, followed by regions III, IV and II. In eastern Japan, estimates primarily follow a latitudinal cline, with regions V and VI showing higher population densities than regions VII and VIII.
Discussion
Our analyses confirm that mean annual population-growth rates estimated from the time frequency of the radiocarbon record yield higher values after the introduction of rice agriculture in each region, with values as high as 0.2–0.5% per year during the first 500 years. This overall population boom mirrors what has been observed in settlement studies and more recent estimates of effective population sizes based on genomic data (Watanabe et al. Reference Watanabe, Naka, Khor, Sawai, Hitomi, Tokunaga and Ohashi2019; Mizuno et al. Reference Mizuno2021). The absolute growth-rate estimates in our studies are comparatively low when compared with those observed among extant hunter-gatherers (Page & French Reference Page and French2020) and closer to the lower end of parameter values assumed in previous simulation studies (Nakahashi & Iizuka Reference Nakahashi and Iizuka2008) but are on the same order of magnitude to those estimated previously by Koyama (Reference Koyama1978).
It is worth noting, however, that longer-term population estimates average out repeated episodes of population fluctuations and several authors have indicated that this might lead to absolute estimates of growth rates closer to zero (Gurven & Davison Reference Gurven and Davison2019; Page & French Reference Page and French2020; Tallavaara & Jørgensen Reference Tallavaara and Jørgensen2021). These suggestions are indeed confirmed by our analyses, with the 750-year interval systematically yielding absolute growth rates closer to zero when compared with the 500-year interval (cf. Figure 5), although this trend might also be explained by the population reaching a temporary carrying capacity or as a signature of the multistage nature of the NDT (Bandy Reference Bandy2005). Additionally, given that radiocarbon density is closer to a proxy of settlement counts than absolute population size (Crema Reference Crema2022), we also speculate that an increase in settlement nucleation following the introduction of rice agriculture might have biased our estimate to lower growth rates.
Despite these issues concerning absolute estimates, our analyses reveal clear inter-regional variations in the demographic response following the introduction of rice agriculture. Crema and colleagues (Reference Crema, Stevens and Shoda2022) have previously shown that the dispersal of rice farming in Japan was characterised by several episodes of slowing down, most notably between regions I and II, V and VI, and IV and V. It follows that when measuring growth rates over the Yayoi period, the subsistence economy in regions located in northern and eastern Japan will still predominantly be based on foraging for much of this timespan.
Once the impact of the uneven dispersal rate is controlled for, an intriguing picture of demographic responses emerges. Regions II, V and VI, which demonstrate a marked delay in the dispersal of farming, do not show evidence of lower growth rates (although region II shows a comparatively lower population density compared to other regions in south-west Japan). In contrast, region VIII, where rice agriculture appears to have arrived earlier than in regions VI and VII, shows the lowest growth rates (albeit with a considerable amount of uncertainty due to the smaller number of radiocarbon dates). Our results thus indicate that faster or slower dispersal rates do not necessarily imply a rapid or slow uptake of agricultural practices within each region, and, consequently, that dispersal rates are not a good predictor of a higher or lower population growth rate. Even when accounting for the different durations of rice farming within the Yayoi period, our absolute population estimates still show a general south-west to north-east geographic cline, potentially paralleling different temperature suitability for rice agriculture. It is worth noting, however, that some of these patterns could be explained by the dispersal of broomcorn and foxtail millets and their relative contribution to the subsistence economy. Evidence from seed impressions on pottery from the Chubu region (region V), for example, shows higher frequencies of millets over rice, potentially indicating an economy less centred on rice farming (Endo & Leipe Reference Endo and Leipe2022).
The extent by which rice agriculture contributed to the Yayoi subsistence economy is, indeed, still debated, with recent studies increasingly highlighting a broader spectrum of resources in different parts of the archipelago (Shitara Reference Shitara2014) and a more prominent role of wild starch-rich plant resources during the early stages of farming in Japan (Stevens et al. Reference Stevens, Crema and Shoda2022). From a demographic standpoint, the key question is how these differences in subsistence economy also impacted life-history decision-making and population growth rates. With the notable exception of northern Tohoku (region VIII), where archaeological evidence appears to suggest that the construction of paddy fields was limited to only a few centuries and subsequently abandoned (Takase Reference Takase and Fujio2017), our analyses seem to show that these economic differences become negligible for most regions once we consider a slightly wider window of analysis.
Finally, it is important to consider that some of the different demographic trajectories observed here can also be the result of the mechanisms that promoted the dispersal of rice agriculture in the first place. For example, a demic diffusion process coupled with a reasonably large population influx might lead to higher growth rates than a mixture of demic and cultural diffusion processes characterised by episodes of inter-group marriages and vertical transmission of new subsistence strategies. While it is difficult to speculate on the extent by which these factors are determining the observed differences in demographic trajectories, it is worth noting how the island of Kyushu (regions I and II) yields the highest growth rates, possibly as a result of repeated waves of migration from the Korean peninsula (Miyamoto Reference Miyamoto2019).
Conclusions
The demographic impact of agriculture is well-established in the archaeological literature, with different lines of evidence pointing towards a general increase in growth rate promoted by a change in fertility. While these broad, millennium-scale patterns are generally well understood, whether and to what extent we can observe local differences in the demographic response to farming is still an open question. Our analyses of the demographic impact of the introduction of rice agriculture in Japan suggest some regional variations, possibly linked to differing impacts of rice farming on the subsistence economy but also to the extent by which these changes were triggered by population movement. We found no clear evidence linking direct variations in the rates of dispersal to differences in population growth rate, indicating the necessity of further studies to unravel the causes and consequences of the differential tempo and mode of the diffusion of rice farming in prehistoric Japan.
Acknowledgements
We are grateful to the two anonymous reviewers and the editor for their insightful comments and feedback.
Funding statement
This work was supported by the European Research Council Starting Grant (ENCOUNTER; no. 801953), a Philip Leverhulme Prize (#PLP-2019–304) and JSPS KAKENHI (no. 21H04370).
Online supplementary material (OSM)
To view supplementary material for this article, please visit https://doi.org/10.15184/aqy.2024.146 and select the supplementary materials tab.


 Open access