Undernutrition is still a critical public health problem among children from low- and middle-income countries because its effects are long-lasting and surpass childhood(Reference Bomela1,2) . Globally, data from 2019 show that 6·9 % of children under 5 years of age (< 5 years) were underweight(3). Conversely, the prevalence of overweight and obesity has rapidly increased in many countries and different populations. The WHO estimates that about 38 million children worldwide are overweight(3). In Brazil, the National Demographic and Health Survey conducted in 2006 indicates that the prevalence of wasting and overweight (including obesity) among children under 5 years was 1·4 and 7·3 %, respectively(4).
Wasting has been observed in younger children (< 24 months), and the different prevalence between countries seems to be related to socio-demographic characteristics(5,Reference Harding, Aguayo and Webb6) . All forms of undernutrition can weaken the immune system, affect cognitive function in childhood and adversely affect school performance, productivity and overall health(Reference Martins, Toledo Florêncio and Grillo7). Like wasting, being overweight is more prevalent in low-income countries and has been related to poor diet quality and food insecurity(Reference Black, Victora and Walker8,Reference Hawkes, Ruel and Salm9) . Being overweight in childhood affects physical and psychological consequences, with the possibility of remaining overweight in adulthood and developing non-communicable chronic diseases, such as diabetes and CVD(Reference Black, Victora and Walker8,Reference Sahoo, Sahoo and Choudhury10) .
In low- and middle-income countries, the determinants of different forms of malnutrition include parental education, sanitation and housing conditions, diet quality, breastfeeding practices and the child’s nutritional status of micronutrients(Reference Black, Victora and Walker8–Reference Vitolo, Gama and Bortolini13). Studies showed that ultra-processed foods (UPF) consumption is linked to overweight in preschoolers and schoolchildren(Reference Lacerda, Carmo and Sousa14). In addition, two studies revealed that maternal schooling, access to household goods and maternal nutritional status were the determinants that mainly explained child overweight(Reference Razaz, Villamor and Muraca15,Reference Voerman, Santos and Patro Golab16) . However, no nationally representative data on malnutrition in children < 5 years were available in Brazil since 2006, a low- and middle-income country with substantial socio-economic and health disparities. The availability of the Brazilian National Survey on Child Nutrition (ENANI-2019) data allowed an update of the malnutrition status and the associated factors.
Given the impact of childhood nutritional status on health and quality of life, it’s crucial to explore the determinants of malnutrition and the most vulnerable groups. Thus, this study aimed to identify socio-economic, demographic, dietary and maternal determinants of wasting and overweight among Brazilian children between 6 and 59 months.
Methods
Study design, sampling and population
This study used data from the ENANI-2019, a population-based survey conducted between 2019 and 2020. The ENANI-2019 has a complex probabilistic sample(Reference Vasconcellos, Silva and Castro17) that uses stratification and clustering, incorporating two or three selection stages. We selected municipalities or census enumeration areas as the primary sampling units. The elementary sampling units were the households with at least one child < 5 years. The ENANI-2019 sample is representative of Brazil’s five geographic regions, children’s age groups (0–23 and 24–59 months) and sex(Reference Vasconcellos, Silva and Castro17). Detailed information on the study protocol has been previously described(Reference Alves-Santos, Castro and Anjos18).
The ENANI-2019 evaluated 14 558 children < 5 years in 12 524 households. For the present study, children aged 6–59 months and with information on the biological mothers’ anthropometric measures were included (n 11 998). Children who had any syndrome or physical disability that compromised the anthropometric measure (n 4), those in which it was not possible to calculate the weight-for-height Z-score (WHZ) (n 54), those with implausible values (n 2), whose mothers were pregnant at the evaluation (n 59) or whose mothers had maternal missing values of anthropometric measurements (n 11) were excluded. Those classified as indigenous or Asian descendant’s skin colour/race (n 79) were further excluded due to low sample precision. Thus, the final sample comprised 11 789 children.
Anthropometric measures
The data collection team comprised 30 supervisors and 323 interviewers. The staff was recruited to collect data in the 123 municipalities participating in ENANI-2019. All participants underwent training and standardisation for the collection of anthropometric measurements. Interviewers were responsible for visiting the households, performing the anthropometric measurements and administering the questionnaire. At the same time, supervisors would assist interviewers in cases of difficulties and would cross-check the obtained measurements. Detailed information on training sessions and the standardisation of the anthropometric measurements can be found in a previous publication(Reference Anjos, Ferreira and Alves-Santos19).
The weight and length/height measurements were obtained using portable SECA brand equipment. Measurement of weight (kg) and height (cm) for biological mothers and children ≥ 2 years of age were collected on a digital platform scale (model 813) and stadiometer (model 213). For children < 2 years of age, paediatric scales (model 336) and anthropometers (model 417) were used.
All measurements were obtained in duplicate and recorded on a mobile device. Interviewers could not retrieve or access the first measurement while recording the second one. The mobile device was programmed to detect implausible anthropometric measurements of children by calculating the Z-scores according to the WHO growth standards(20).
After collection, data were evaluated based on the quality indicators proposed by WHO/UNICEF(21). The ENANI-2019 anthropometric data were in accordance with the recommendations for all indicators assessed. Subsequently, the missing (n 197; 1·4 %) or implausible values (n 135; 0·9 %) were imputed using the ‘nearest neighbour’ imputation method, in which socio-economic and demographic information (macro-region, sex, age and income quarter) and existing anthropometric measurements were considered while selecting donor records(22,23) . This method was chosen for its ability to preserve the data structure and the relationships between variables.
Implausible measures were classified if WHZ was < −5 or > 5, length/height for age Z-score was < −6 or > 6 and weight-for-age Z-score was < −6 or > 5(21). The system asked for confirmation of birth date or to repeat the measurement in these cases. At the end of the fieldwork, there were 0·9 % implausible cases for WHZ; after imputation, only 0·1 % of the WHZ remained implausible. Data after fieldwork revealed that only 0·8 % of children were flagged as having a difference greater than 0·3 kg for weight between the first and second measurements and 1·84 % for length/height above 0·5 and 1 cm, respectively. The first measurement of weight and length/height of children was used to classify the nutritional status according to the WHO growth standard(20). In contrast, the second measurement was utilised solely as a quality assurance mechanism to identify inconsistencies and validate field staff performance.
The anthropometric nutritional status was classified according to the Brazilian Ministry of Health and WHO recommendations, as wasting (WHZ < −2), normal weight (–2 ≤ WHZ ≤ 1), overweight risk (1 < WHZ ≤ 2) and overweight (WHZ > 2)(20,24) . For adult biological mothers (age ≥ 20 years), anthropometric status was based on BMI (calculated by dividing the weight (kg) by the squared height (m)) classification using the WHO cutoffs(25). For adolescent biological mothers (< 20 years), the BMI-for-age Z-score was calculated and classified according to WHO reference charts(Reference de Onis, Onyango and Borghi26).
Dietary information
The children’s dietary data were collected using a structured questionnaire that included a group of food markers and referred to the consumption of any quantity on the day before the interview. Children were classified as having a minimum dietary diversity if they received at least five out of eight food groups ((1) breast milk; (2) grains, roots and tubers (bread, rice, pasta, baby cereal, potatoes, other starchy vegetables); (3) beans, nuts and seeds (beans, lentils, peas, chickpeas); (4) dairy products (animal milk, infant formula, yogurt, porridge); (5) flesh foods (animal meat, liver, kidney, heart, sausages, processed meats); (6) eggs; (7) vitamin A- rich fruits and vegetables (carrots, pumpkin, sweet potato, cabbage, spinach, other local dark greens leafy vegetables); and (8) fruits and vegetables)(27). Children were also classified according to zero vegetable or fruit consumption, and those who did not consume any vegetables or fruits during the previous day were classified as yes for this indicator(27). The foods/food groups assessed in the present study were classified as ultra-processed, according to Monteiro et al. (2019)(Reference Monteiro, Cannon and Levy28). The number of UPF groups consumption (none, 1–2, 3–4, ≥ 5 groups) was classified based on the following ten food groups: (1) sweet or salty cookies/crackers; (2) instant flours (rice, corn, wheat or oatmeal); (3) carbonated drinks; (4) other sugar-sweetened beverages (excluding carbonated drinks) (boxed juice, boxed coconut water, guarana syrup, currant juice, powdered juice or natural fruit juice with added sugar); (5) candies (confectionery); (6) processed meats (hamburger, ham, mortadella, salami, nugget, sausages or frankfurter); (7) packaged snacks; (8) processed bread (such as flatbread, breadsticks and hamburger buns); (9) instant noodles; and (10) yogurts.
Socio-economic and demographic characteristics
The following socio-economic and demographic characteristics were evaluated: Brazilian geographical regions (North, Northeast, Southeast, South and Midwest); child age group (6–23; 24–59 months); maternal age (< 20, 20–29, 30–39, ≥ 40 years), child skin colour/race (white, brown, black); sex (male, female); National Wealth Score (classified in tertiles of sample distribution), which is a household synthetic index based on a set of items related to the possession of consumer goods, the household characteristics and the education of the head of the household and allow the stratification of the economic status(Reference Andrade, Schincaglia and Farias29); the Brazilian Food Insecurity Scale (classified as food security, mild food insecurity, moderate or severe food insecurity); and household crowding (0–1, 2–3, ≥ 4 individuals per bedroom).
Statistical analysis
All the analyses were conducted considering the study’s complex sample design using the R programming language packages: ‘survey’, ‘srvyr’ and ‘svyVGAM’ to consider the structure of the sampling plan, weights and calibration. These functions account for the complexity of the sampling design. We tested for multicollinearity, but the analysis suggests this is not a significant issue in our data. The Z-scores of anthropometric indices of children and adolescent mothers were calculated using the R packages ‘growthstandards’ and ‘anthro’.
The descriptive analysis included the point prevalence of nutritional status, 95 % CI and the estimated population size with each condition (children × 1000). Pearson’s χ 2 and Rao and Scott adjustment tests were used to compare the proportion of nutritional status according to socio-demographic, maternal and dietary determinants.
Crude and adjusted multinomial logistic regression models were used to evaluate factors associated with the anthropometric conditions of the children: wasting, overweight risk and overweight, using normal weight as the reference category. The magnitude of the associations was expressed in OR. The adjusted models were defined using a backward stepwise selection of variables, in which we started with the complete model and excluded one variable at a time, in descending order of P-value, until all the remaining variables were statistically associated with the outcomes at a 20 % significant level. A P-value of 5 % or lower was considered statistically significant.
Results
Children were predominantly aged 24–59 months (65·8 %), brown (52·4 %) and males (50·8 %). The most frequent maternal age category was between 20 and 29 years (49·1 %), and 48·4 % of the households experienced any level of food insecurity. The prevalence of overweight among children’s biological mothers was 58·6 %, 9·5 % of Brazilian children between 6 and 59 months were overweight and 2·6 % were wasted (Table 1).
Distribution of Brazilian children under 5 years of age according to socio-economic, demographic, dietary and maternal characteristics (ENANI-2019)

WHZ, weight-for-height Z-score.
*Children (× 1000) cell value times 1000 represents the total of mother–child dyads estimate in the population with the condition. †Classified according to the BMI (WHO, 1995) for adult women (≥ 20 years). ‡Classified according to BRAZIL, 2011; WHO, 2006.
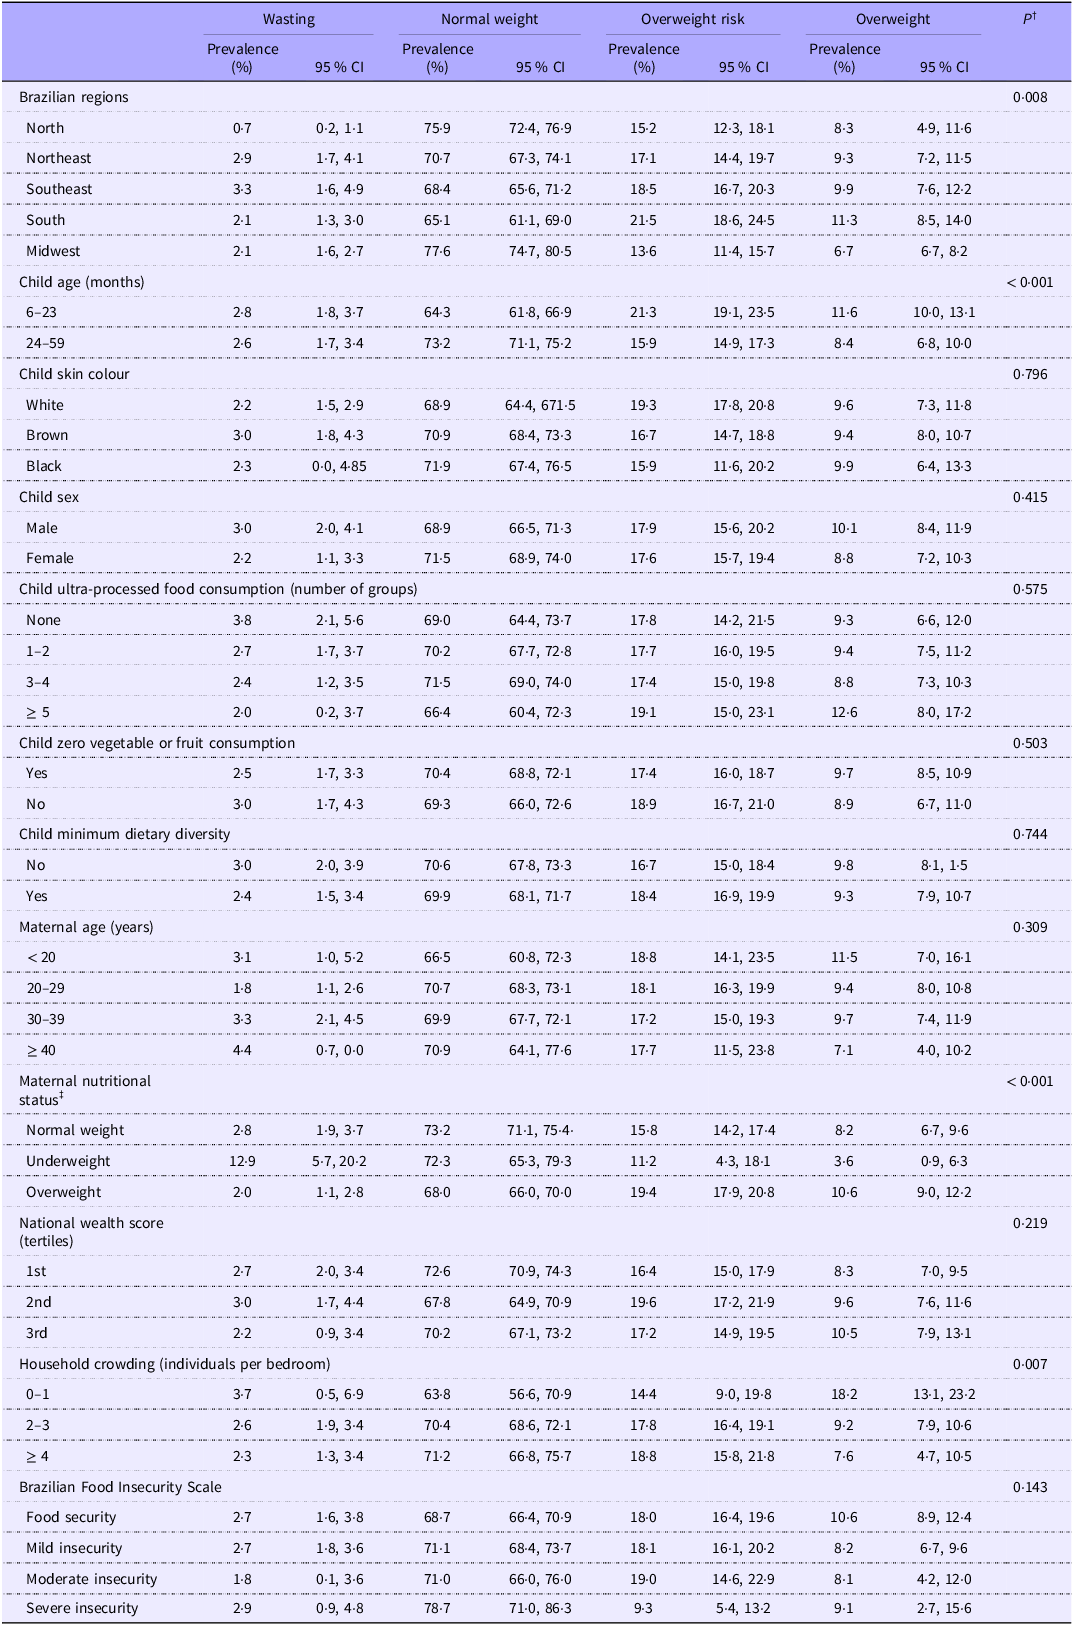
The prevalence of wasting varied significantly between regions, being lower in the North (0·7 %), compared with the Northeast (2·9 %) and Southeast (3·3 %). The prevalence of wasting was significantly higher in mothers with underweight (12·9 %) compared with those with normal weight (2·8 %) or overweight (2·0 %). The prevalence of overweight was significantly higher in children aged < 24 months (11·6 %) than in those aged ≥ 24 months (8·4 %) and in children from overweight mothers, compared with those with underweight (10·6 % v. 3·6 %) (Table 2).
Distribution of the nutritional status (weight for age)* of Brazilian children under 5 years of age, according to socio-economic, demographic, dietary and maternal characteristics (ENANI-2019)

Data are presented as prevalence (%) and 95 % CI. *Child nutritional status was classified using weight-for-height Z-score (WHZ) (wasting (< −2); normal weight (–2 ≤ WHZ ≤ 1); overweight risk (1 < WHZ ≤ 2); overweight (WHZ > 2)) according to BRAZIL, 2011; WHO, 2006. †The P-value refers to Pearson’s χ 2: Rao and Scott adjustment test. ‡Classified according to the BMI (WHO, 1995) for adult women (≥ 20 years).
In the adjusted model, younger age (6–23 months: OR 1·7; 95 % CI: 1·3, 2·2), consumption of ≥ 5 ultra-processed food groups (OR: 1·7; 95 % CI: 1·0, 2·9), maternal overweight (OR: 1·5; 95 % CI: 1·2, 1·9) and mild insecurity (OR: 0·8; 95 % CI: 0·6, 1·0) were associated with a higher OR of child overweight, while maternal underweight (OR: 0·4; 95 % CI: 0·2, 0·9) was inversely associated (Table 3). Higher household crowding (2–3 or ≥ 4 people per bedroom) was inversely associated with being overweight. Children from the Northeast (OR: 4·9; 95 % CI: 2·1, 11·3), Southeast (OR: 7·1; 95 % CI: 3·0, 16·6), South (OR: 4·7; 95 % CI: 1·8, 12·1) and Midwest regions (OR: 2·7; 95 % CI: 1·2, 6·2) and those whose mothers were underweight (OR: 5·4; 95 % CI: 2·7, 10·7) had higher odds of wasting.
Multinomial logistic regression models of the association between socio-economic, demographic, dietary and maternal characteristics and nutritional status* in Brazilian children under 5 years of age (ENANI-2019)

*Child nutritional status was classified using weight-for-height Z-score (WHZ) (wasting (< −2); normal weight (–2 ≤ WHZ ≤ 1); overweight risk (1 < WHZ ≤ 2); overweight (WHZ > 2)) according to BRAZIL, 2011; WHO, 2006. † P-value refers to multinomial logistic regression. ‡Classified according to the BMI (WHO, 1995) for adult women (≥ 20 years) and BMI-for-age Z-scores for adolescents (BRASIL, 2011; de ONIS, 2007).
Discussion
This study reveals a 9·5 % overweight prevalence among Brazilian children aged 6–59 months in 2019, while wasting is of lesser concern as a public health problem with a prevalence below 3 %. Second, we identified socio-economic, demographic, dietary and maternal characteristics significantly associated with child overweight and wasting. Specifically, being 6–23 months and having ≥ 5 UPF group consumption were associated with 1·7 and 1·7 odds of being overweight, respectively. Maternal nutritional status also played an important role, directly impacting child malnutrition, encompassing both overweight and wasting. The prevalence of wasting in children of underweight mothers was 12·9 % (95 % CI: 5·7, 20·2).
The magnitude of overweight observed in this national populational study classifies Brazil as a country with a medium prevalence of overweight, according to the WHO- UNICEF Technical Expert Advisory Group on Nutrition Monitoring(Reference de Onis, Borghi and Arimond30). Childhood overweight is rising in Brazil: its prevalence increased from 6·6 to 9·5 % in 2006–2019, that is, a 43·9 % expansion over 13 years(4,Reference Castro, Anjos and Lacerda31) . The 2019 prevalence was similar to other Latin American and Caribbean Countries for children < 5 years, such as Cuba (10·3 %, 2019), Uruguay (11·4 %, 2018) and Paraguay (12·4 %, 2016), and for the USA (9·4 %, 2018) but higher than countries like China (8·5 %, 2017) and Peru (8·1 %, 2019)(32).
The period between conception and 2 years of age is considered a significant vulnerability and crucial for developing the body, brain, metabolism and immune system(Reference Likhar and Patil33). Although the brain undergoes continuous development throughout life, during infancy, the first 1000 d are the greatest period of growth and development, during which the foundations for long-term health are also laid(Reference Bick and Nelson34).
A higher odd of being overweight was observed among children who reported the consumption of ≥ 5 UPF groups the day before the interview, compared with those who did not. This result is worrying since the trend in the consumption of UPF is increasing in many countries(Reference Moubarac, Batal and Martins35,Reference Wang, Martínez Steele and Du36) , including Brazil(Reference Louzada, Cruz and Silva37). The energy density of the diet, the relative content of free sugar, fats in general, saturated fats and trans fats increase significantly with increasing consumption of UPF. The association between UPF and health outcomes(Reference Chen, Zhang and Yang38), including overweight, has been established in the literature for adults(Reference Askari, Heshmati and Shahinfar39,Reference Canella, Levy and Martins40) . However, there is a lack of studies exploring this association among children, mainly < 5 years. Prospective cohorts with Portuguese(Reference Vedovato, Vilela and Severo41) and British(Reference Chang, Khandpur and Neri42) children found that a higher UPF consumption was significantly associated with increased trajectories of BMI. On the other hand, a longitudinal study with Brazilian preschool children (at 4 years old) evaluated the percentage of total energy consumption attributed to UPF and found no statistically significant association with BMI but statistically significant with waist circumference(Reference Costa, Rauber and Leffa43). More studies are needed to understand the implications of UPF consumption for nutritional status in preschool children. Maternal nutritional status also plays a vital role in child malnutrition, being associated with both overweight and wasting. The mother and child share more than genetic aspects; parents can expose their children to healthy or unhealthy food options. Mothers are considered the principal caregivers responsible for purchasing and preparing food for children(Reference Johnson, Goodell and Williams44), so the association of maternal characteristics has been widely studied with infant nutrition(Reference Dessie, Fentie and Abebe45,Reference Debela, Demmler and Rischke46) . Maternal food consumption can also be a modulator of children’s food preferences since the child will consume the food purchased by their parents(Reference Groele, Głąbska and Gutkowska47,Reference Hebestreit, Intemann and Siani48) .
Mild food insecurity was associated with lower odds of a child being overweight. Overweight and food insecurity often coexist among children, and this seemingly paradoxical relationship has been increasingly documented in the literature(Reference Biadgilign, Gebremariam and Mgutshini49–Reference Lee, Scharf and DeBoer51). Although this relationship does not yet appear to be fully explained, many variables could affect food insecurity status, such as physical activity, nutritional exposure and school environment. These factors may influence the classification of food insecurity status and how food insecurity impacts weight outcomes.
We have noted a disparity in the prevalence of overweight risk and overweight across various regions of Brazil. The factors contributing to nutritional transition, such as urbanisation and dietary habits, can partially explain these regional variations, which may vary across the country(Reference Alves, Dal’ Magro and Viacava52). Additionally, an increased odds of overweight risk was observed in the 2nd tertile of the National Wealth Score, but no association was found with overweight. On the other hand, household crowding was inversely associated with overweight prevalence. Household crowding, a condition where the number of occupants exceeds the capacity of the dwelling space available, is often considered a marker of poverty and social deprivation. Those results indicate that socio-economic status is directly associated with overweight in Brazil, with a higher prevalence in wealthy households. Other studies have reported a direct association between socio-economic status and overweight/obesity in different age groups(Reference Jaacks, Vandevijvere and Pan53–Reference Fernald56). In line with our results, a systematic review(Reference Dinsa, Goryakin and Fumagalli57) of studies assessing the association between socio-economic status and obesity in low- and middle-income countries found a direct association between socio-economic status and obesity in children, regardless of age, the level of gross national income per capita, the level of obesity or the socio-economic status indicator chosen.
We identified a 2·6 % prevalence of wasting among children aged 6–59 months in Brazil, classifying the country as having a low prevalence (when considering the threshold for children < 5 years)(Reference de Onis, Borghi and Arimond30). Nevertheless, it is crucial to note that this prevalence has risen since 2006 when it was 1·4 % (the last national representative survey in Brazil for children < 5 years, using the WHZ indicator)(4). Brazil has also undergone significant economic changes during and after the COVID-19 pandemic, with a notable increase in food insecurity indicators(58), potentially impacting childhood malnutrition. Therefore, continuous monitoring of this indicator at the population level is imperative.
Furthermore, specific policy attention is required in countries like Brazil, where the double burden of malnutrition is increasing(Reference Farias, Anjos and Freitas59). A recent systematic review consolidates evidence regarding the impact of nutrition-specific and nutrition-sensitive interventions on undernutrition and overnutrition, highlighting the associated risks and opportunities for dual-purpose actions. Interventions aimed at influencing nutrition-related behaviours in mothers, infants or schoolchildren and those focused on modifying school food environments demonstrated reduced risks of unintended outcomes and presented promising opportunities for dual-benefit strategies(Reference Escher, Andrade and Ghosh-Jerath60).
Utilising individual-level data derived from a nationally representative survey constitutes a strength of this study. The anthropometric measurements in ENANI-2019 were meticulously ascertained following standardised protocols, and the training process was uniformly conducted by qualified instructors across all regions in Brazil, in addition to the real-time electronic monitoring of children’s anthropometric data. The study’s limitations include using a qualitative assessment of dietary intake the day before the interview, which may not accurately measure dietary exposure. Nevertheless, it is noteworthy that we adopted indicators recommended by the WHO to assess young child feeding practices at the household level(27). The use of imputation is another strength of the present study. Imputation is vital in population studies to ensure sample representativeness, preventing selection bias resulting from the exclusion of observations with missing data. Additionally, given the low percentage of implausible values in our sample, the number of imputations performed was minimal, with negligible impact on the prevalence estimates. On the other hand, not performing imputation and excluding observations with missing data could result in a loss of statistical power and a reduction in sample representativeness.
Overweight (including obesity) had an alarmingly high prevalence among Brazilian children aged 6–59 months in 2019, highlighting the imperative need for targeted interventions to address this pressing public health challenge. Although only 2·6 % of Brazilian children were wasted, this prevalence has increased in the last 13 years and should be monitored, especially after the rise in food insecurity after the COVID-19 pandemic. This research highlights the need for targeted public health interventions to improve child and mother nutrition in Brazil and reduce the consumption of ultra-processed foods in Brazil.
Acknowledgements
The Brazilian Ministry of Health and the Brazilian National Research Council provided financial support for this study under process number 440890/2017-9.
D. R. F. analysed and interpreted the data and wrote the manuscript with input from all authors. D. R. F., L. A. A., P. N., T. L. B., N. A., R. M. C., J. L. C., M. B. F., P. N., L. B. V. L. and P. G. A. analysed and interpreted the data and revised the manuscript. G. K., N. A. S., I. R. R. C., E. M. A. L. and D. R. F. contributed to the study conception and design, the data interpretation and the manuscript’s revision. G. K. is the coordinator of the ENANI-2019 and participated in all phases of analysis and interpretation of the data and writing of the manuscript. All authors approved the final version of the manuscript.
Data described and the code book in the manuscript will be made publicly and freely available without restriction at https://enani.nutricao.ufrj.br. An analytical code will be made available via the corresponding author’s email upon request.
The authors declare no conflicts of interest.
The ethical review board of the Clementino Fraga Filho University Hospital of the Federal University of Rio de Janeiro approved the study under the process 89798718.7.0000.5257. Data were collected after the child’s parents or guardians signed two copies of the informed consent form, freely and spontaneously, after hearing an explanation of all the ethical issues of the study.