

Two compartment (2C) models of body composition assessment such as hydrodensitometry and air displacement plethysmography (BOD POD) separate the body into two chemically distinct compartments: fat mass (FM) and fat-free mass (FFM)( Reference Withers, Laforgia and Heymsfield 1 ). However, the application of a 2C model carries several assumptions including that the total body water (TBW) content of the FFM is 73·7 % and that FM and FFM have densities of 0·9007 g/cm3 and 1·1000 g/cm3, respectively( Reference Brožek, Grande and Anderson 2 ). As a result, these methods may contain error due to the biological variability in these assumed constants( Reference Siri 3 , Reference Santos, Silva and Matias 4 ). This is most apparent for TBW which has the lowest density, yet is the largest component of FFM( Reference Brožek, Grande and Anderson 2 ) especially in athletic resistance trained males with high levels of FFM( Reference Kerr, Slater and Byrne 5 ). A three compartment (3C) model of body composition assessment, which combines measures of body density and TBW from 2H dilution (D2O) rather than an assumed constant, affords greater validity and is shown to be closer to the reference method in body composition assessment( Reference Withers, Laforgia and Heymsfield 1 , Reference Wang and Pierson 6 ). The ability of bone health assessment technology such as dual-energy X-ray absorptiometry (DXA) to measure bone mineral content (BMC) allows the creation of a four compartment (4C) model where TBW and BMC are measured rather than assumed( Reference Wang and Pierson 6 , Reference Withers, LaForgia and Pillans 7 ).
Previous research has shown that bioelectrical impedance spectroscopy (BIS) and other 2C models such as DXA and BOD POD are highly influenced by subject presentation( Reference Bunt, Lohman and Boileau 8 – Reference Thomsen, Jensen and Henriksen 11 ). Factors such as acute food and fluid intake are known to impact on results( Reference Dixon, Ramos and Fitzgerald 9 , Reference Pietrobelli, Wang and Formica 12 – Reference Rouillier, David-Riel and Brazeau 15 ) as well as prior exercise and core body temperature( Reference Fields, Higgins and Hunter 16 ). As such, recommendations have been put forward advocating subjects present for assessment in a standardised manner, being fasted, rested and in a well-hydrated state( Reference Dixon, Ramos and Fitzgerald 9 , Reference Nana, Slater and Hopkins 10 , Reference Utter, Goss and Swan 17 ). Unfortunately, this creates logistical issues with individuals only being able to be assessed early in the morning. Accounting for technical and biological error could afford an opportunity to measure individuals anytime throughout the day, or non-standardised presentation. However, the impact of acute food and fluid intake or physical activity in 2C, 3C and 4C models of body composition assessment are still largely unknown.
The field-based method of surface anthropometry (SA) for body composition assessment includes measures of stature, body mass, skinfolds and girths; the combination of which provide valuable information regarding physique traits. To date the impact of standardised presentation on SA assessment has not been compared against different time points, or tested for reliability in individuals over the course of the day after ad libitum food, fluid ingestion and physical activity. Given the popularity of this technique, exploration of its reliability is warranted.
The aims of this study were: (1) to establish the technical error of 2C, 3C and 4C models as well as SA in body composition assessment in resistance trained male athletes, (2) to quantify typical errors of measurement for the methods, (3) to determine biological error in standardised v. non-standardised presentation on multi-compartment model interpretation of body composition, and (4) to identify the biological impact introduced from ingestion of a specified meal.
Methods
Subjects
In all, thirty-two Caucasian individuals volunteered to participate in this study who met the inclusion criteria which included male, at least 2 years resistance training experience, with a minimum BMI of ≥25. Subjects were excluded from the study if they were >190 cm tall due to the limitation of the active scanning area of the DXA bed. The characteristics of all individuals are presented in Table 1. All subjects were informed of the nature and possible risks of the investigation before giving their written informed consent. This study was conducted according to the guidelines laid down in the Declaration of Helsinki and all procedures involving subjects were approved by the Human Research Ethics Committee of the University of the Sunshine Coast (Ethics Approval no. S/12/450).
Descriptive statistics for body composition variables (Mean values and standard deviations)
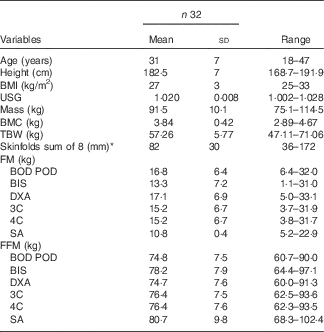
USG, urine specific gravity; BMC, bone mineral content; TBW, total body water; BOD POD, air displacement plethysmography; BIS, bioelectrical impedance spectroscopy; DXA, dual-energy X-ray absorptiometry; 3C, three compartment model; 4C, four compartment model; SA, surface anthropometry; FM, fat mass; FFM, fat-free mass.
* Triceps, subscapular, biceps, illiac crest, supraspinale, abdominal, front Thigh, medial calf.
Experimental design
Each subject underwent five identical testing sessions during a 27-h period (Fig. 1) with every measurement taken by the same technician. The sessions commenced with body mass measured in minimal clothing, a total body DXA scan immediately followed by a BIS estimation of TBW, a BOD POD test and assessment of subcutaneous FM via the skinfold technique, in that sequence. Each subject undertook tests 1 (D1T1) and 2 (D1T2) on day 1 under standardised conditions (early morning, overnight fasted, euhydrated and well rested). D1T2 was undertaken immediately after D1T1 and test 3 (D1T3) was undertaken at a random time later in the afternoon, after ad libitum food, fluid and physical activity without intervention. The fourth test session on day 2 (D2T4) was also performed under standardised conditions. Subjects were then randomly assigned to a specified meal before being retested for the fifth time (D2T5), 15 min after meal ingestion. Comparison of these testing sessions allowed the calculation of typical error of measurement (TEM), random within-day biological variability, between-day biological variability, and the impact of a predetermined quantity of food and fluid on body composition.
Study design of five testing sessions conducted over 27 h. BOD POD, POD, air displacement plethysmography. * Tests conducted in accordance with best practice guidelines.

Subject presentation
Guidance was provided on both days to ensure subject presentation was standardised for three of the tests (D1T1, D1T2 and D2T4). Subjects were required to present overnight fasted and well rested (no prior physical activity) on the mornings before D1T1 and D2T4. They were asked to wear minimal fitted clothing with metal objects and jewellery removed, plus clothing checked for metal zips or studs. Hydration status was assessed by a mid-stream sample of urine provided by the subjects early on the mornings before testing (D1T1 and D2T4). The specific gravity of the urine sample was measured using a digital refractometer (UG-Alpha; Atago Corporation). All subjects voided their bladder before tests.
Dual-energy X-ray absorptiometry
All DXA scans were undertaken in the whole body mode on a pencil beam DXA scanner (Lunar DPX; GE Healthcare) with analysis performed using GE enCORE version 13.60 software (GE Healthcare) with the combined Geelong/Lunar reference database. CV for the laboratory being 0·1, 2·2, 0·6 and 1·0 % for BM, FM, lean mass and BMC respectively. The DXA was calibrated with phantoms as per the manufacturer’s guidelines each day before measurements were taken. All scans were conducted by the same Queensland Radiation Health licensed technician using the standard thickness mode as determined by the auto scan feature in the software and all safety protocols as per the Institution’s Radiation Safety Protection Plan were adhered to.
The scans were performed according to a protocol developed that emphasises a consistent positioning of subjects on the DXA scanning bed( Reference Nana, Slater and Hopkins 10 ) as previously described( Reference Nana, Slater and Hopkins 18 ). In addition, two Velcro straps were used to minimise any subject movement during the scan as well as provide a consistent body position for subsequent scans. One strap was secured around the ankles above the foot positioning pad and the other strap was secured around the trunk at the level of the mid forearms( Reference Kerr, Slater and Byrne 19 ). All scans were analysed automatically by the DXA software but all regions of interest were reconfirmed before being included in the subsequent statistical analysis.
Bioelectrical impedance spectroscopy
Immediately after each DXA scan whilst the subjects were still positioned on the DXA scanning bed, TBW was measured using the BIS device, SFB7 (ImpediMed) device. Subject positioning was standardised to ensure they lay in the supine position on the non-conductive foam mattress without contact to the metal side supports of the DXA scanner for a minimum of 15 min before BIS measurements( Reference Ward, Isenring and Dyer 20 ). The BIS was calibrated as per the manufacturer’s instructions with each participant’s stature, body mass, age and sex programmed into the unit. Sites of attachment for the electrodes (ImpediMed) were first shaved and cleaned with alcohol wipes before the dual-tab electrodes were attached as follows: one electrode was attached centrally on the top side of the wrist in alignment with the ulnar head and 5 cm lower on the dorsal surface of the hand. The second electrode was attached centrally on the dorsal surface of the ankle between the lateral and medial malleoli and 5 cm lower on the dorsal surface of the foot which is in accordance with previous guidelines( Reference Kerr, Slater and Byrne 5 ). The SFB7 measures impedance using 256 frequencies between 4 and 1024 kHz to estimate TBW based on a Cole-Cole plot( Reference Cornish, Ward and Thomas 21 ). Three measurements were taken consecutively and the median of these used in subsequent analysis. The BIS estimates of FM and FFM from complex algorithms created a field-based 2C model of physique assessment( Reference Kyle, Bosaeus and De Lorenzo 22 ).
Air displacement plethysmography
Immediately after TBW measurement, assessment of body density was undertaken using the BOD POD (Life Measurement Instruments) following the recommended procedures of the manufacturer( Reference Dempster and Aitkens 23 ) utilising a predicted thoracic lung volume (VTG) estimation. Subjects wore Lycra clothing and a silicone swim cap, with all metal objects removed before measurement. Body density was calculated by the BOD POD’s software system (COSMED version 5.3.2) as follows:
 $$D\;\left( {{\rm density}} \right)\,{\rm {\equals}}\,Mass\;\left( {{\rm scale}} \right){\rm \,/\,}Volume\;\left( {{\rm BOD}\;{\rm POD}} \right).$$
An estimate of FM and FFM was obtained after using the simple 2C model to calculate %BF as defined by the Siri equation( Reference Siri 3 ), as follows:
 $${\rm \,\%\,}BF\,{\equals}\,\left( {497 \!\cdot \!1\,/\,body\;density} \right)-451 \!\cdot\! 9.$$
Surface anthropometry
Immediately after completion of the BOD POD assessment, duplicate skinfold measurements were taken according the International Society of the Advancement of Kinanthropometry (ISAK) technique by the same technician certified by ISAK as previously described( Reference Norton, Whittingham and Carter 24 ). The intra TEM of 0·2 mm and 0·6 % for the technician was calculated by taking the difference between the first and second measurement (d), squaring it (d 2), adding them up for each subject (d 2), dividing by 2n (where n is the number of subjects), and taking the square root. Therefore:
 $$TEM\,{\equals}\surd\left[ {\sum\_d^{2} \!/\!\left( {2n} \right)} \right].$$
The sum of eight skinfolds was determined following measurements of the triceps, biceps, sub scapulae, iliac crest, supra-spinale, abdominal, quadriceps and calf skinfold using a calibrated skinfold caliper (Harpenden; Baty International). Due to the similar procedure, equipment and population used, the 4C validated Evans equation of three skinfolds (triceps, abdominal and thigh) was utilised to calculate %BF as follows( Reference Evans, Rowe and Misic 25 ):
 $$\eqalignno{\,\%\,BF\,{\equals}\,&8 \!\cdot\! 997{\plus}0 \!\cdot\! 24658\,{\times}\left( {3SKF} \right)\,{\minus}\,6 \!\cdot\! 343\,{\times}\left( {gender} \right)\cr&{\minus}1 \!\cdot\! 998{\times}\left( {race} \right).$$
Stretch stature was measured with a stadiometer (Harpenden; Holtain Limited) to the nearest 0·1 cm. Body mass was measured on a calibrated scale to the nearest 0·01 kg (SECA GMBH).
Three and four compartment models
Utilising the body density values obtained by the BOD POD and the TBW estimations from the BIS, a 3C model was created for percent body fat calculated using the Siri equation as described by Withers et al. ( Reference Withers, LaForgia and Pillans 7 ):
 $$\eqalignno \,\%\,BF\,{\equals}\,211 \!\cdot\! 5/body\;density\!-\!78 \!\cdot\! 0\,{\times}\left( {TBW\!/\!body\;mass} \right)\!-\!134 \!\cdot\! 8.$$
Similarly for the 4C model, the additional variable of BMC measured from DXA was incorporated to calculate percent body fat using the Withers et al. equation( Reference Withers, LaForgia and Pillans 7 ):
 $$\eqalignno{ \,\%\,BF\,{\equals}\,&251 \!\cdot\! 3/body\;density-73 \!\cdot\! 9\,{\times}\left( {TBW/body\;mass} \right)\cr&{\plus}94 \!\cdot\! 7\,{\times}\left( {bone\;mineral\;mass/body\;mass} \right)\! -\!179.0 $$
Both equations were then converted to obtain estimates of FFM (kg) and FM (kg).
Meal intake intervention
After D2T4 all subjects were provided with a standard 500 g breakfast meal consisting of wholemeal toast (four slices), butter, jam or Vegemite (Mondelez International) and a Musashi (Vitaco Health Australia) P30 375 ml protein drink with a nutrient profile typical of an average meal consumed by athletes( Reference Nana, Slater and Hopkins 26 ). The total volume of fluid and food was randomly assigned to the thirty-two subjects and scaled into two different portion sizes representing a 500 g meal (62 g carbohydrate, 36 g protein, 10 g fat, 340 ml fluid) (n 16) or a 500 g meal plus 1 litre of water (n 16), respectively. D2T5 was undertaken 15 (sd 3) min after commencement of the meal for all subjects.
Statistical analysis
A customised spreadsheet (www.sportsci.org) was used to derive reliability statistics for comparing precision in the estimate of FFM and FM using the reference 4C model, with those obtained by the 2C and 3C models plus SA (FFM, FM and skinfolds sum of eight). These statistics included the difference in the mean between measurements, typical error and confidence limits. The typical error, equivalent to the technical error of measurement in this study, was inferred by test-retest technical variation (D1T1 and D1T2) and from within-subject biological error from morning to afternoon (D1T1 and D1T3), from day 1 to day 2 (D1T1 and D2T4), and from before to after the meal (D2T4 and D2T5). For all conditions, this was expressed as a CV. The determination of smallest worthwhile effect from differences in the means was calculated after the difference was standardised by dividing by the standard deviation (Cohen’s effect size). To ensure the smallest worthwhile differences in body composition were standardised, one-third of the between-subjects standard deviation was used for standardising (ΔMean/(1/3×sd))( Reference Nana, Slater and Hopkins 10 ). This is because the large standard deviation between-subjects were approximately three times greater than those previously discovered in a study using an athletic cohort( Reference Stewart and Hannan 27 ). Therefore, the magnitudes of standardised effects were categorised as follows: <0·20 trivial, <0·60 small, <1·20 moderate and <2·0 large( Reference Hopkins, Marshall and Batterham 28 ). The typical errors were deemed as substantial for the smallest worthwhile effect when the standardised value reached the tolerance for a small effect (≥0·2)( Reference Nana, Slater and Hopkins 18 ).
Results
Technical variation from standardised presentation
The change in the mean of repeated measurements (D1T1 and D1T2) in all methods for estimates of BM (kg), TBW (L), skinfolds (mm), FFM (kg) and FM (kg) to infer technical variation were trivial (Fig. 2). Typical errors associated with estimates of all values were also trivial except for TBW and the 3C model (FM) which were small, BOD POD (FM) and 4C model (FM) which were moderately larger, and BIS (FM) which was substantially larger, than the smallest worthwhile effect (Table 2).
Reliability results – change in mean and 90 % CI. (a) Standardised presentation test retest reliability – test 1 v. 2; (b) non-standardised presentation reliability – test 1 v. 3; (c) standardised presentation between-day reliability – test 1 v. 4; (d) impact of 500 g meal on reliability – test 4 v. 5; (e) impact of 500 g meal+1000 g H2O on reliability – test 4 v. 5. DXA, dual-energy X-ray absorptiometry; POD, air displacement plethysmography; BIS, bioelectrical impedance spectroscopy; 3C, three compartment model; 4C, four compartment model; SA, surface anthropometry; ![]() , fat-free mass;
, fat-free mass; ![]() , fat mass.
, fat mass.

Test-retest change in mean (ΔMean) and technical error in standardised presentation testing (Mean values and standard deviations; percentages and absolute measures)

SWE, smallest worthwhile effect; TEM, typical error of measurement expressed as a CV (%) and absolute units (g, mm, ml); SA, surface anthropometry; TBW, total body water; FFM, fat-free mass; DXA, dual-energy X-ray absorptiometry; BOD POD, air displacement plethysmography; BIS, bioelectrical impedance spectroscopy; 3C, three compartment model; 4C, four compartment model; FM, fat mass.
* Mean values and standard deviations taken from first testing session.
† Small value of ΔMean or TEM.
‡ Moderate value of ΔMean or TEM.
§ Large value of ΔMean or TEM.
Biological variation from non-standardised presentation
The change in the mean of within-day biological variation (D1T1 and D1T3) in SA (mm), SA (FFM), BOD POD (FFM, FM) and DXA (FM) were trivial but for BM and DXA (FFM) there was a small change from the smallest worthwhile effect (1 and 1·2 % respectively). For TBW, BIS (FFM, FM), 3C and 4C models (FFM, FM) and SA (FM) there were large changes in the mean from the smallest worthwhile effect. Trivial typical errors were evident for BM, SA (mm, FFM), BOD POD (FFM), 3C and 4C models (FFM) and DXA (FM) but a small typical error was found in DXA (FFM). Moderately large typical errors were identified in TBW and BIS (FFM) whereas BOD POD (FM), BIS (FM), 3C and 4C models (FM) and SA (FM) had substantially larger typical errors from the smallest worthwhile effect (Table 3).
Biological error and change in mean (ΔMean) in non-standardised presentation testing (Mean values and standard deviations; percentages and absolute measures)

SWE, smallest worthwhile effect; TEM, typical error of measurement expressed as a CV (%) and absolute units (g, mm, ml); SA, surface anthropometry; TBW, total body water; FFM, fat-free mass; DXA, dual-energy X-ray absorptiometry; BOD POD, air displacement plethysmography; BIS, bioelectrical impedance spectroscopy; 3C, three compartment model; 4C, four compartment model; FM, fat mass.
* Mean and standard deviations taken from first testing session.
† Small value of ΔMean or TEM.
‡ Moderate value of ΔMean or TEM.
§ Large value of ΔMean or TEM.
Biological variation from standardised presentation
The change in the mean of biological variation in between-day estimates (D1T1 and D2T4) were trivial in all methods for all raw values, FFM, FM estimations except for BIS (FM) where there was a substantially large change from the smallest worthwhile effect (Table 4). There were trivial typical errors associated with estimates of BM (kg), SA (mm, FFM, FM), DXA (FFM) and BOD POD (FFM). Small typical errors were found in DXA (FM), 3C and 4C models (FFM) whereas moderate errors were identified in TBW, BIS (FFM) and BOD POD (FM). Finally, BIS (FM), 3C and 4C models (FM) all produced larger typical errors than the smallest worthwhile effect (Table 4).
Biological error and change in mean (ΔMean) in between-day standardised presentation testing (Mean values and standard deviations; percentages and absolute measures)

SWE, smallest worthwhile effect; TEM, typical error of measurement expressed as a CV (%) and absolute units (g, mm, ml); SA, surface anthropometry; TBW, total body water; FFM, fat-free mass; DXA, dual-energy X-ray absorptiometry; BOD POD, air displacement plethysmography; BIS, bioelectrical impedance spectroscopy; 3C, three compartment model; 4C, four compartment model; FM, fat mass.
* Mean values and standard deviations taken from first testing session.
† Moderate value of ΔMean or TEM.
‡ Small value of ΔMean or TEM.
§ Large value of ΔMean or TEM.
Biological variation from ingestion of a 500 g meal
The change in the mean of measurement (D2T4 and D2T5) after ingestion of a 500 g meal for all body composition estimates was trivial except for BOD POD (FFM) with a small change and BIS (FM) with a substantially large change, from the smallest worthwhile effect. Typical errors that were substantially larger than the smallest worthwhile effect were identified in BOD POD (FM) and BIS (FM) whereas BM and all body composition estimates by the other methods were trivial (Table 5).
Biological error and change in mean (ΔMean) from ingestion of meal after standardised presentation testing (Mean values and standard deviations; percentages and absolute measures)

SWE, smallest worthwhile effect; TEM, typical error of measurement expressed as a CV (%) and absolute units (g, mm, ml); SA, surface anthropometry; TBW, total body water; FFM, fat-free mass; DXA, dual-energy X-ray absorptiometry; BOD POD, air displacement plethysmography; BIS, bioelectrical impedance spectroscopy; 3C, three compartment model; 4C, four compartment model; FM, fat mass.
* Mean values and standard deviations taken from first testing session.
† Moderate value of ΔMean or TEM.
‡ Small value of ΔMean or TEM.
§ Large value of ΔMean or TEM.
Biological variation from ingestion of a 500 g meal plus 1 litre of water
There were trivial changes in the mean of the measurements (D2T4 and D2T5) after ingestion of a 500 g meal plus 1 litre of water for all methods for body composition estimates except BM, DXA (FFM) and SA (FFM) with a moderately larger change, and substantially larger change in BOD POD (FM), BIS (FM), 3C and 4C models (FM), than the smallest worthwhile effect (Table 5). The typical errors for all methods after ingestion of the 500 g meal plus 1 litre of water were trivial for body composition estimates except BOD POD (FM) and BIS (FM) with moderately large errors from the smallest worthwhile effect.
Discussion
The key findings of this study were that biological variables such as TBW, acute food and fluid intake and physical activity had a substantially large impact upon 2C, 3C and 4C models of body composition assessment. When a standardised subject presentation (overnight fasted, rested, consistent hydration) and quality control protocols were implemented the change in the mean of the measurements was trivial except for BIS (FM). However, the typical errors in testing under these conditions varied from small to substantially large especially for FM. For non-standardised presentation testing the change in the mean of the measurements and typical errors were mostly moderately or substantially large from the smallest worthwhile effect for all estimates in all techniques. Furthermore, the ingestion of a meal (500 g or 500 g plus 1 litre of water) increased the errors of measurement in BM, DXA (FFM), SA (FFM) and BOD POD, BIS, 3C and 4C models (FM) for these values whereas a 500 g meal had a trivial effect on DXA (FFM, FM) and BOD POD (FFM, FM). Therefore, standardised presentation can minimise biological variables, the biggest contributor to measurement error. If reliable measures of FM and FFM are required, then DXA and BOD POD are suitable methods of assessment if standardised presentation is not possible.
Surface anthropometry
Of all the body composition assessment methods, only SA (mm) was reliable throughout all conditions including after daily activities or after ingesting a meal. In agreement, the effect of hypohydration and hyperhydration on skinfold measurements has been found to be insignificant( Reference Norton, Hayward and Charles 29 ) suggesting that SA is robust and unaffected by changes in hydration status. However, the technique of SA typically involves the measure of BM, a variable acutely influenced by a range of factors including hydration status, gastrointestinal tract contents and muscle glycogen stores( Reference Rouillier, David-Riel and Brazeau 15 ). To counter such variance, the protocol of athlete presentation for SA should follow previous recommendations of overnight fasted, post bladder and bowel evacuation with body mass measurements taken in minimal clothing( Reference Oppliger and Bartok 30 ). Nonetheless, despite being very robust, SA fails to provide an absolute measure of FM and FFM which is available through other 2C, 3C and 4C models. In addition, regression equations used to estimate %BF are not validated to track changes in body composition( Reference Silva, Fields and Quitério 31 ).
Air displacement plethysmography
BOD POD measures body density and provides estimates of FM and FFM via a 2C model using the Siri equation( Reference Siri 3 ) and guidance published by the manufacturer recommends a 2-h fast and exercise free period before testing to minimise biological error. Previous research using BOD POD technology provide results consistent with this study, with only trivial typical errors in FFM estimates from between-day testing conducted under a standardised presentation( Reference Utter, Goss and Swan 17 ). Presenting in a dehydrated state for body composition assessment via a 2C model may introduce error( Reference Bunt, Lohman and Boileau 8 ), and dehydration in BOD POD assessments has produced a small underestimation in body fat (1·1 %) which may be important when tracking longitudinal change( Reference Utter, Goss and Swan 17 ). Our study showed that when food, fluid and physical activities are unrestricted before testing, FM estimations from BOD POD are subject to large typical errors (653 g). Ingestion of 1000 ml of fluid before body composition assessment by BOD POD increased body fat measures by 1·1 %( Reference Heiss, Gara and Novotny 13 ) and a meal of 500 g plus 1 litre of water resulted in measurement errors of 660 g (FFM) and 820 g (FM). In contrast, a smaller 500 g meal produced only a small change in the mean for FFM and a trivial change for FM, suggesting that reliability of assessment is possible with either a standardised presentation or prior ingestion of a specified (<500 g) meal.
Dual-energy X-ray absorptiometry
DXA, a 2C model, provides estimates of FM and FFM via attenuation of two photons of light (X-rays) through body tissue depending on its composition. Manufacturing guidelines as well as previous research undertaken by our group recommend standardising both subject presentation and scan protocol( Reference Kerr, Slater and Byrne 19 ) in order to reduce biological and technical error. In this study, both the repeat tests and between-day testing under standardised conditions were very reliable for estimates of FFM using DXA technology. This is in agreement with previous literature reporting a CV of 0·5 and 1·5 %, respectively( Reference De Lorenzo, Andreoli and Candeloro 32 , Reference Nana, Slater and Hopkins 10 ). However, the DXA estimates of FM revealed a small typical error of 3·2 % which is higher than previous studies investigating reliability of between-day standardised presentation testing (2·1 %)( Reference Nana, Slater and Hopkins 10 , Reference Hillier, Beck and Petropoulou 33 , Reference Anderson 34 ). In addition, DXA showed a trivial change in mean for FFM and FM for the 500 g post meal condition, whereas consumption of the larger meal (500 g plus 1 litre of water) resulted in moderately substantial effect for FFM change in mean (1211 g). This suggests that DXA may be a suitable technique for reliable FM and FFM measurement if acute food and fluid intake is <500 g. However, ingesting a larger meal appears to influence biological error which, and in agreement with previous studies( Reference Thomsen, Jensen and Henriksen 11 , Reference Horber, Thomi and Casez 35 , Reference Vilaça, Ferriolli and Lima 36 ) these results suggest that scans be conducted after an overnight fast.
Bioelectrical impedance spectroscopy
BIS is a doubly indirect measurement of body composition utilising complex algorithms to estimate FM and FFM from TBW estimations, therefore, the margin for biological error is much higher than for D2O. Previous research using BIS has found that acute ingestion of fluid can overestimate FM by 3·2 %( Reference Saunders, Blevins and Broeder 37 ) and in agreement with this study, a 500 g meal increased the change in mean FM by 774 g whereas a larger meal (500 g meal plus 1 litre of water) increased FM by 1400 g. Even small amounts of fluid intake (590 ml) influences FM estimations( Reference Dixon, Ramos and Fitzgerald 9 ) so reliability of assessment is heavily dependent on subject presentation. In addition, the substantially large between-day biological error in FM and FFM estimates from BIS (1065 g, 1173 g, respectively) suggests that caution must be applied when interpreting results from a single body composition assessment session despite standardised subject presentation and testing conditions. Finally, it was unsurprising to find that non-standardised presentation testing introduced substantial fluctuations in TBW, thus confounding BIS with FM estimations recording a large typical error (879 g) and a FFM change of mean score of 2677 g. In light of these findings, it is recommended that subject presentation be meticulously standardised( Reference Kyle, Bosaeus and De Lorenzo 38 ) before utilising BIS technology.
Three and four compartment models
D2O is the reference method for laboratory-based TBW measurement in 3C and 4C models but is expensive and time consuming( Reference van Marken Lichtenbelt, Westerterp and Wouters 39 ). In contrast, BIS has been applied in both athlete and non-athletic populations being safe, non-invasive and cost effective with instantaneous TBW results( Reference Moon, Tobkin and Roberts 40 ) that have been validated against D2O( Reference Kerr, Slater and Byrne 5 , Reference Matias, Santos and Gonçalves 41 ). The 3C and 4C models in this study included measurements of TBW from BIS so intuitively we expected they would be highly influenced by these estimations. The slight fluctuation in TBW from repeat tests (D1T1 and D1T2) suggests that there is inherent machine noise as daily respiratory water losses, typically 400 ml( Reference Maughan, Shirreffs and Leiper 42 ) could not occur this rapidly between repeat measurements. Consequently, the typical errors from 3C and 4C model estimates of FM appear to be influenced by the inclusion of TBW estimations in these models which is in agreement with the literature( Reference Withers, Laforgia and Heymsfield 1 , Reference Fuller, Jebb and Laskey 43 ). In addition, despite stable body mass, the moderately large typical error from TBW values (1·5 %) for between-day estimates (D1T1 and D2T4) indicates substantial variance which has influenced the FM and FFM estimates of the 3C (5·4 %, 1·0 %) and 4C models (5·1 %, 1·0 %). Previous literature using the reference D2O technique found a within-day variability of TBW with night time crests( Reference Cugini, Salandri and Petrangeli 44 ) so our results were not unexpected.
Large resistance trained athletic males such as the subjects in this study fluctuate widely in their hydration status due to training and recovery demands. So unsurprisingly there were substantial changes in the mean BM and TBW of 890 and 1960 g, respectively, after non-standardised presentation testing. Therefore, FM estimations from 3C and 4C models were subject to large typical errors (631 g, 631 g). In addition, the large fluctuation in hydration also confounded 3C and 4C models for FFM estimates with mean change scores of 1733 and 1701 g, respectively. Fluctuations in hydration would be expected to confound estimates of body composition using 3C and 4C values more than DXA because of the inclusion of body density values in these models. The concomitant change in the measures of density of the FFM associated with changes in TBW in turn confounds estimates of FM( Reference Anderson 34 ).
In conclusion, models that included a measured TBW value from BIS (3C and 4C) were highly influenced by TBW fluctuations under non-standardised conditions than other 2C models. This means that any body composition assessment undertaken with non-standardised presentation of subjects will significantly increase biological error and thus, reduce accuracy. As the 2C models assume a constant TBW of 73·7 % this error may not be so obvious but our results of fluctuating BM, TBW and associated influence on FM and FFM under these conditions show otherwise. Therefore, biological error via acute TBW change in FFM is minimised in body composition assessment models if subjects present in an overnight fasted and rested state, with specific advice relating to optimisation of hydration status the day before assessment. Standardised presentation of subjects should be mandatory for all body composition assessment if reliable measures of FM and FFM are required. When circumstances prevent standardised presentation of subjects, then assessment via DXA and BOD POD is acceptable if acute food and fluid intake remains below 500 g. Of all the methods of body composition assessment, only SA (mm) produced trivial errors across all conditions making it ideal for longitudinal assessment despite time of day or acute physical condition of subjects.
The limitations of this study include applying a BIS estimation of TBW instead of the reference method of D2O for TBW assessment which amplified biological error in 3C and 4C models. However, due to the timeframe required for D2O (4–6 h equilibrium time) this study design would not have been possible given the repeat nature of TBW assessment. Second, initial USG testing before D1T1 and D2T4, identified several subjects with a USG >1·020, often used as a cut off for the identification of hypohydration( Reference Casa, Clarkson and Roberts 45 ), which could possibly confound results. However, no exclusions were made because according to the literature USG specificity to detect hypohydration in athletes with large FFM, similar to those in this study, is reduced( Reference Hamouti, Coso and Ávila 46 ). This may be a consequence of the positive relationship with muscle mass and urine protein metabolites and USG. Another potential limitation is that we do not know if the specified meal of 500 g would impact biological error in smaller size populations using DXA or BOD POD for assessment. The strengths of this investigation include new evidence that a standardised subject presentation can minimise biological error caused by acute food and fluid intake plus ad libitum activity. Furthermore, this reduction in error is robust despite between-day biological variability for all body composition assessment methods. Manufacturer’s recommendations for BOD POD tests require only a 2-h fast and exercise free period before testing and commercial use BIS only recommends avoiding excessive exercise 2 h prior and 12 h from excess alcohol consumption. DXA guidelines recommend overnight fasted presentation but in commercial practice this is rarely the case. The results of our study, especially for 3C and 4C models with an inclusion of TBW from BIS, clearly show biological error is particularly variable after ad libitum food/fluid and activity as well as after ingestion of an extra 1000 ml of fluid.
Acknowledgements
The authors thank the subjects who kindly volunteered their time for this study.
This research received no specific grant from any funding agency, commercial or not-for-profit sectors.
The authors’ responsibilities were as follows: A. K. and G. J. S.: study concept and design, analysis and interpretation of data; A. K.: acquisition of data, draft of manuscript, statistical analysis and had full access to all of the data in the study and takes responsibility for the integrity of the data and the accuracy of the data analysis; A. K., G. J. S. and N. B.: critical revision of the manuscript for important intellectual content; and G. J. S.: study supervision.
None of the authors has any conflicts of interest to declare.


