


INTRODUCTION
Given the significance and variety of cognitive impairment etiologies, considerable interest exists in characterizing the diagnostic accuracy of cognitive tests (e.g., Belleville et al., Reference Belleville, Fouquet, Hudon, Zomahoun and Croteau2017; Frazier, Demaree, & Youngstrom, Reference Frazier, Demaree and Youngstrom2004; Weissberger et al., Reference Weissberger, Strong, Stefanidis, Summers, Bondi and Stricker2017). While improvement in diagnostic accuracy of individual tests has been a focus of much clinical research, recent trends have taken advantage of advances in algorithmic approaches to integrate information across tests (e.g., Jak et al., Reference Jak, Bondi, Delano-Wood, Wierenga, Corey-Bloom, Salmon and Delis2009; Mechelli &Vieira, Reference Mechelli and Vieira2020). Neuropsychological assessments represent a broad-spectrum diagnostic tool because the tests can be administered flexibly to individuals across a variety of cognitive disorders. While the tests that neuropsychologists use may vary in their individual diagnostic accuracy, overall accuracy of the assessment is dependent on the approach used to interpret the testing results (Ivnik et al., Reference Ivnick, Smith, Petersen, Boeve, Kokmen and Tangalos2000).
The broad purpose of this study is to characterize a Bayesian model as a flexible, semi-automated diagnostic algorithm consistent with the standards for evidence-based neuropsychological practice (EBNP) proposed by Chelune (Reference Chelune2010). A flexible algorithm that can be applied across test batteries, clinical settings, and diagnostic questions presents an opportunity to develop a standard assessment protocol that is rooted in ENP. The first standard for EBNP is to convert referral questions into answerable questions (Chelune, Reference Chelune2010), which can be conceptualized like statistical hypotheses wherein there is concern for Type I or II errors (Franklin, Reference Franklin and Franklin2003). One may answer the question of whether a client is cognitively impaired by computing a formal difference between the client’s test scores and some control sample (e.g., Crawford, Garthwaite, & Gault, Reference Crawford, Garthwaite and Gault2007). Such tests of difference typically follow some frequentist framework. However, these methods rely on a null hypothesis test where it is not possible to accept the null that the client is nonimpaired (Lakens, Reference Lakens2017; Walker & Nowacki, Reference Walker and Nowacki2011). Additionally, the risk of Type I error increases with each additional analysis, which is problematic given the expected frequency of abnormal scores in healthy individuals (Binder, Iverson, & Brooks, Reference Binder, Iverson and Brooks2009). Bayesian methods permit accepting the null hypothesis (Rouder, Speckman, Sun, Morey, & Iverson, Reference Rouder, Speckman, Sun, Morey and Iverson2009) and can be repeated without increasing family-wise error (Gelman, Hill, & Yajima, Reference Gelman, Hill and Yajima2012), making it a preferable framework for analyzing batteries of tests.
The next standard for EBNP is the use of base rates when reporting test results. Chelune (Reference Chelune2010) recommends using likelihood ratios in reporting practices, and the ability to multiply pretest odds by a likelihood ratio to obtain posttest odds is given by Bayes’ theorem. The examined model allows users to input pretest probabilities for diagnoses of interest from which the posttest probabilities are computed given the observed test data. The final EBNP standard is the incorporation of outcomes research to guide assessments. The current model requires summary statistics corresponding to reference samples for each diagnosis of interest, thus implementation of the model necessitates appeal to the extant literature to find these summary statistics.
A Bayesian framework is well suited to clinical neuropsychological applications and has implications beyond familiar frequentist methods. As already highlighted, one such application is converting pretest probabilities to posttest probabilities via Bayes’ theorem. When applied in diagnostic models, population-level pretest probabilities (e.g., base rates, prevalence) are converted to individualized posttest probabilities by incorporating information from that individual’s test performance. Another important quality of Bayesian methods is the posterior distribution, and its use in making predictions for future observations. Briefly, a Bayesian posterior distribution combines prior information and observed data to derive an empirically-based probabilistic distribution of the parameters, and this can be extended to posterior predictive distributions where probabilistic distributions of future or otherwise unobserved data can be estimated. In this model, summary statistics from reference samples (e.g., normative data, study samples, case series) are used to make posterior predictions for test scores in the population. Posterior distributions are used for statistical inference in Bayesian methods, and with these, it is possible to extend sample-level statistics to model population distributions of scores, which would facilitate approximation of percentile scores, computing distributions of discrepancy scores, and other similar distributional summaries. The model thus aims to facilitate clinical decision making in three ways: compute the posttest probability that a test score profile belongs to a set of diagnostic possibilities, estimate how a test score profile compares scores across various diagnoses (i.e., compute z-scores for tests relative to each population), and obtain the probability of achieving individual scores, test discrepancies, or other performance-based summaries within the population of interest. Notably, these methods are all available from sample statistics, meaning that these metrics commonly reported only in normative or diagnostic studies can be derived from more prevalent resources like published studies, case series, and research databases.
In typical Bayesian workflow, appropriateness of the computational model is examined through simulation study with both the simulation study design and the computational model being informed by an understanding of the real-world process that gives rise to observed data (Gabry, Simpson, Vehtari, Betancourt, & Gelman, Reference Gabry, Simpson, Vehtari, Betancourt and Gelman2019; Gelman et al., Reference Gelman, Carlin, Stern, Dunson, Vehtari and Rubin2013; McElreath, Reference McElreath2016; Talts, Betancourt, Simpson, Vehtari, & Gelman, Reference Talts, Betancourt, Simpson, Vehtari and Gelman2018). The aim of the current study was to test the clinical utility of a model that can convert a battery of neuropsychological tests into posttest probabilities of any number of clinical diagnoses. There were three specific hypotheses regarding this model that were tested using three simulation studies:
Simulation one: parameter recovery
-
H1: the Bayesian model will produce accurate estimates of population parameters.
Simulation two: diagnostic accuracy
-
H2: the model will produce diagnostic accuracy at least equivalent to alternative methods.
Simulation three: posterior inference
-
H3: the model’s posterior predictive distribution will be equivalent to distributions in the true population.
METHODS
To address the primary aims of this study, a Monte Carlo simulation methodology was used. The statistical environment R version 4.1.1 (R Core Team, 2021) was used for all statistical analyses. Simulation of clinical data utilized the R package “MASS” (Venables and Ripley, Reference Venables and Ripley2002). The model is fit with the “rstan” package (Stan Development Team, 2020). The simulation’s R script and supporting materials are all available on github (https://github.com/w-goette/Single-Case-Classification).
Conceptual Model
A conceptual model of neuropsychological assessment was developed a priori to simulate the data generation process of typical neuropsychological practice. In this conceptual model, the problem of diagnosis is conceptualized as a finite mixture model. Here, a client is treated as a random observation from a set of various clinical populations, each having unique distributions of scores. Clinical reference samples approximate the subpopulations composing this mixture, and a diagnosis is made when the likelihood of membership in a particular subpopulation is greater than others. In sum, the key components of this conceptual model are the following: (1) individuals presenting for assessment are random draws from an underlying mixture of populations, (2) the clinician’s diagnosis aims to identify a true subpopulation to which an individual belongs, (3) reference samples from various diagnostic populations are used to compare the individual to their respective diagnostic populations, and (4) clinicians use pretest risk and base rates to inform what diagnoses are considered most likely.
Computational Model
The computational model is used to compute the probability of membership to any given underlying subpopulation (i.e., diagnostic group) based on data from an individual case against an arbitrary number of selected reference samples. Since population parameters are unknown, the reference samples are treated as the best estimates for their respective populations. The model computes the likelihood of obtaining observed scores under each subpopulation with the assumption that the case is an observation from whichever population results in the greatest likelihood. For every population of interest, the model requires the following inputs: the means and standard deviations for each test of interest, the correlation matrix (or matrices) for these tests, the size of the reference sample, and the pretest probability of the diagnosis.
The priors used in the computational model follow the standard Bayesian methods for estimating multivariate normal distributions when the population mean and variance are unknown and estimated by sample statistics (see Gelman et al., Reference Gelman, Carlin, Stern, Dunson, Vehtari and Rubin2013, pp. 64–74 for derivation). The priors deviate from the Gelman et al. (Reference Gelman, Carlin, Stern, Dunson, Vehtari and Rubin2013) methods in the evaluation of the covariance matrix. Following the recommendations in the Stan documentation (Stan Development Team, 2019), the covariance matrix is decomposed into a vector of standard deviations and a correlation matrix.
Recovery Simulation
Simulation Conditions
Six different conditions were examined in the parameter recovery simulation. Each condition altered either the reference sample size or the number of tests simulated for a single observation (see Table 1 for these conditions). All conditions were iterated 1000 times.
Sampling distributions under each condition
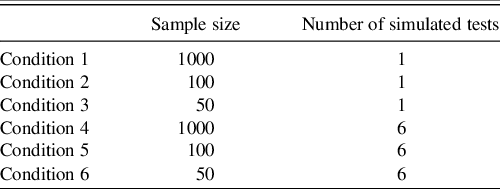
Note. Sample size corresponds to the number of individuals simulated to define the reference sample.
Simulated test scores were based on the T score metric (M = 50, SD = 10). Correlation matrices for the multivariate conditions were produced by specifying a factor model with error to make the simulated correlation matrix more realistic to clinical settings (Hong, Reference Hong1999; Tucker, Koopman, & Linn, Reference Tucker, Koopman and Linn1969). Raw scores and reference samples were generated by sampling from a multivariate normal distribution. In each iteration, the true z-score was computed based on the condition’s parameters, and the model’s prediction of the z-score and its 95% credible interval were saved.
Outcome Variables
The root mean square error (RMSE) and mean absolute error (MAE) of the model’s computed z-scores from the true z-scores were computed. These both quantify the average error in the computed and true z-scores. Pearson’s correlation coefficient and Kendall’s tau were used to measure the association between estimated and true z-scores. Kendall’s tau quantifies the concordance of the data when ranked, so high Kendall’s tau should reflect high concordance of percentile ranking even if z-score estimates are inaccurate. The final outcome computed was the empirical coverage rate (ECR) of the z-scores’ 95% credible intervals. The ECR is the proportion of true values that fall within the specified credible interval. Ideally, the ECR should be around .95 as this is what would be expected by the 95% interval.
Diagnostic Accuracy Simulation
Data Generation
To ensure that the data were clinically relevant and addressed several cognitive domains using popular neuropsychological tests, the sample descriptive data used for the model were taken from two different test manuals: the RBANS manual (Randolph, Reference Randolph2012) and the WAIS-IV Technical and Interpretive Manual (Wechsler, Reference Wechsler2008b). These tests were selected due to their popularity among neuropsychologists (Rabin, Paolillo, & Bar, Reference Rabin, Paolillo and Barr2016) and their composition of multiple indices that can be interpreted together to help inform differential diagnosis. A cognitive screening with an RBANS and abbreviated WAIS-IV may be reasonable for some settings wherein a statistically-informed diagnostic model might be useful.
For WAIS-IV subtests, the summary data are found in Table A.11 (p. 148) for the normative sample between ages 75:00–79:11 (n = 100), Table 5.31 (p. 119) for the mild cognitive impairment (MCI) group (n = 50) and Table 5.32 for the probable dementia of the Alzheimer’s type, mild severity (AD) group (n = 40). For the WAIS-IV simulation, the scaled scores for a 4-subtest abbreviated version were selected from these tables (Block Design, Similarities, Digit Span, and Coding). For the RBANS, the summary data were from Tables 4.9 (p. 67) and B.8 (p. 127), which correspond to the normative sample for individuals aged 70–79 (n = 90) and the AD clinical sample (n = 138), respectively. To be consistent with the WAIS-IV diagnostic groups, sample descriptive RBANS data from Karantzoulis et al. (Reference Karantzoulis, Novitski, Gold and Randolph2013) were used for the MCI reference. For the RBANS simulation, the standard scores for the indices and total scale scores in the tables were used.
Simulation Condition
Pretest probabilities for MCI and AD come from prevalence estimates of both disorders for individuals around the age of 77 (Petersen et al., Reference Petersen, Lopez, Armstrong, Getchius, Ganguli, Gloss, Gronseth, Marson, Pringsheim, Day, Sager, Stevens and Rae-Grant2018; Alzheimer’s Association, 2021, respectively). Coadministration data of the 4-subtest WAIS-IV and RBANS scores in all three diagnostic populations could not be found, so the posttest probabilities for each diagnosis were extracted from the WAIS-IV results and then passed as the pretest probabilities for the RBANS analysis. Thus, pretest probabilities were updated twice: once after observing the WAIS-IV scores and then again after observing the RBANS.
For each iteration of this simulation, a set of test scores for the 4-subtest WAIS-IV and full RBANS was simulated from the “normal” population. The model was then fit and the simulated test scores, true population from which the scores were simulated, and posttest probabilities for each diagnosis was saved. This was then repeated for the MCI and AD populations, and these iterations were repeated 500 times such that results are based on 1500 simulations.
Outcome Variables
The outcome of interest was the rate of correct diagnostic classification. Diagnosis was determined as whichever population resulted in the highest posttest probability for that simulated “client” after observing both the WAIS-IV and RBANS results. To contextualize this classification accuracy, linear discriminant function analysis (LDA), quadratic discriminant function analysis (QDA), multinomial logistic regression, and random forest classification were also used to determine diagnosis in the same simulated clients. These equations were trained on simulated reference samples corresponding to the WAIS-IV and RBANS data and then cross-validated on the saved simulated values generated during the simulation condition. The LDA, QDA, and random forest models used the same pretest probabilities as the Bayesian model.
Posterior Inference Simulation
Simulation Condition
Using the complete WAIS-IV data (10 core subtests), a single observation from the normative sample was generated. From this fitted model, the posterior samples predicting the population’s ten scaled scores were extracted so that they could be examined against the WAIS-IV manual’s percentiles.
Outcome Variables
Two specific outcomes were desired from the posterior analysis. The first outcome was a comparison of the posterior’s prediction of the population-level scaled scores to what the WAIS-IV norms report. This involved analysis of the posterior’s predicted percentiles for the sum of scaled scores (see Table A.7 of Wechsler, Reference Wechsler2008a, pp. 224–225) and the distribution of Digit Span and Arithmetic discrepancy scores (see Table B.4 of Wechsler, Reference Wechsler2008a, p. 238). Note that the WAIS-IV manual also includes percentiles for discrepancies between Symbol Search and Coding as well, but only one set of these scores were selected so that the final table was easier to read. All data are available to readers on the supplemental materials, so this discrepancy is easily obtainable to those interested. The second desired outcome was a demonstration of how scores may be visualized in clinical settings to display relative strengths or weaknesses across tests.
RESULTS
Results were derived from a Monte Carlo simulation design wherein each condition evaluated was iterated 1000 times. With respect to the adaptive Hamiltonian estimator used by Stan, every run of the model used four independent chains to evaluate potential issues with mixing or convergence. Each chain ran 2000 samples with 1000 warmups (4000 final samples). No warnings were generated during any of the 7501 runs of the model.
Recovery of Population Information
See Table 2 for primary results of the model’s recovery of the true z-scores. Across these conditions, the model shows relatively minimal estimation error in the true z-scores; however, as the sample size becomes smaller, there is a tendency for greater error in estimating the z-score. Despite the estimation error, in all conditions, the z-score estimates were strongly correlated (r ≥ .996, τ ≥ .96) with the true z-score estimates.
Parameter recovery results
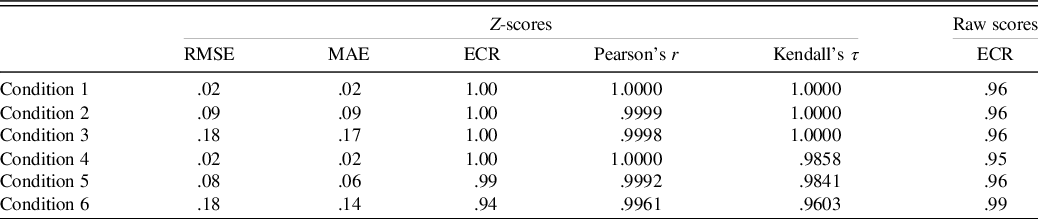
Note. The ECR is for the 95% credible interval. For Conditions 4 through 6, the smallest correlation coefficients for any of the six simulated tests are shown.
RMSE = root mean square error; MAE = mean absolute error; ECR = empirical coverage rate.
The z-score estimates and posterior predictive distributions for the raw scores produced ECRs that matched closely with the expected 95% predictive interval (see Table 2).
Classification Accuracy
The rates of correct classification for both the linear discriminant function analysis and the Bayesian model are reported in Table 3. Cochrane–Mantel–Haenszel (CMH) tests compared the 3x3 confusion matrices of predicted versus true diagnosis across the 5 classification methods. Pairwise CMH tests demonstrated that the Bayesian model produced significantly different cell frequencies than all other methods even after adjusting for multiple comparisons, and the Bayesian model produced overall greater diagnostic accuracy on the simulated brief cognitive battery than the alternative approaches.
Diagnostic accuracy results
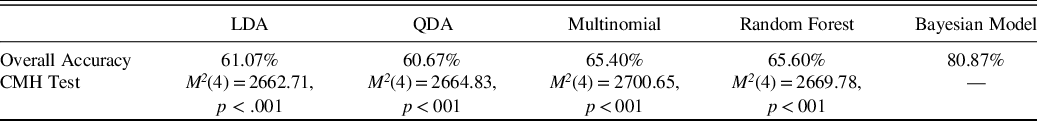
Note. The CHM test is a generalization of the McNemar test for n x n tables nested into k strata, resulting in an n × n × k array. The test follows a chi-square distribution. In this application, the 3 × 3 contingency matrices of predicted by actual diagnosis are nested into 5 different strata corresponding to the 5 different classification methods applied. Shown p-values are for specific pairwise contrast of the method in the column and the Bayesian method, and they are adjusted for multiple comparisons.
CMH = Cochrane–Mantel–Haenszel test, LDA = linear discriminant analysis, QDA = quadratic discriminant analysis, multinomial = multinomial logistic regression.
Posterior Inference
The ECR of the 95% credible intervals from the posterior predictive population raw scores were within their expected (i.e., .95) nominal rate (see Table 2). From the posterior predictive distribution of the population-level subtest scores, the sum of these subtests was computed, and the percentiles of this sum were compared to that reported in WAIS-IV manual (Table 4). Some deviation is expected as the WAIS-IV manual reports these percentiles for the whole sample while the model’s true predicted population was restricted to individuals aged 75 to 79 year.
Comparison of posterior predicted and WAIS-IV-manual reported percentiles of the sum of scaled scores
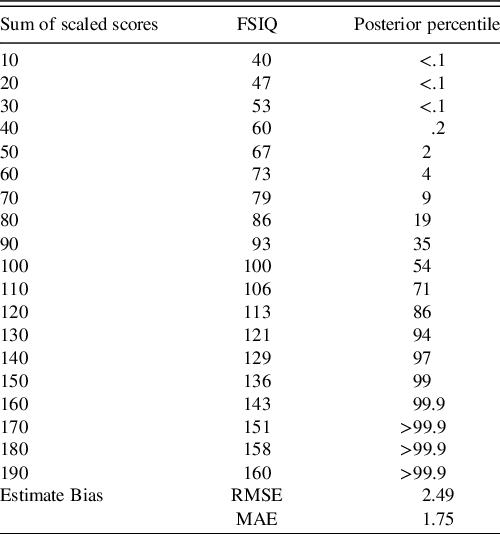
Note. To save space, sums of the scaled scores on subtests are reported in 10-point intervals. RMSE and MAE summarize average deviance from the true percentiles. Rounding conventions of the manual-reported percentiles were used in reported the posterior’s predicted percentiles. Due to copyright, readers are referred to Table A.7 of the WAIS-IV Scoring and Administration Manual for the actual percentiles (Wechsler, Reference Wechsler2008a, pp. 224–225).
FSIQ = full-scale intelligence quotient, RMSE = root mean square error, MAE = mean absolute error.
Another transformation of the posterior predictive distributions was the discrepancy analysis for the Digit Span and Arithmetic subtests. As shown in Table 5, the model again closely approximates the percentiles of the discrepancy scores with the same caveat that the posterior predictive distribution is actually predicting these discrepancy scores in the population of 75- to 79-year-olds. To clarify, the model received no direct information about this discrepancy, so this information is derived only from the summary information used to fit the model.
Comparison of posterior predicted and WAIS-IV-manual reported discrepancy scores
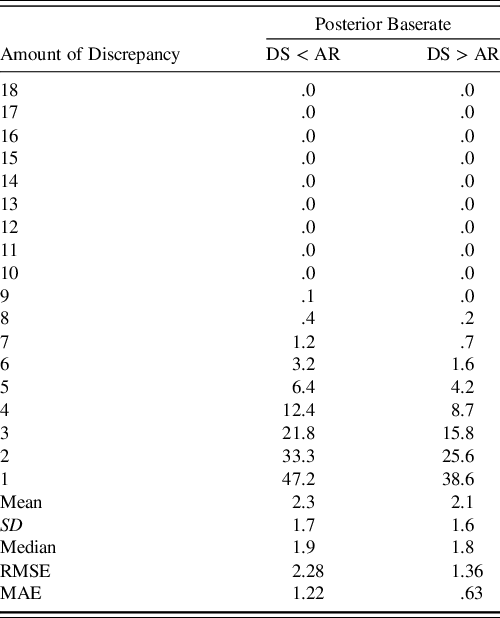
Note. Column corresponding to DS < AR indicates that the discrepancy score is negative while DS > AR indicates that it is positive. RMSE and MAE summarize average deviance from the true percentiles. Rounding conventions of the manual-reported percentiles were used in reported the posterior’s predicted percentiles. Due to copyright, readers are referred to Table B.4 of the WAIS-IV Scoring and Administration Manual for the actual percentiles (Wechsler, Reference Wechsler2008a, p. 238).
DS = digit span, AR = arithmetic, SD = standard deviation, RMSE = root mean square error, MAE = mean absolute error.
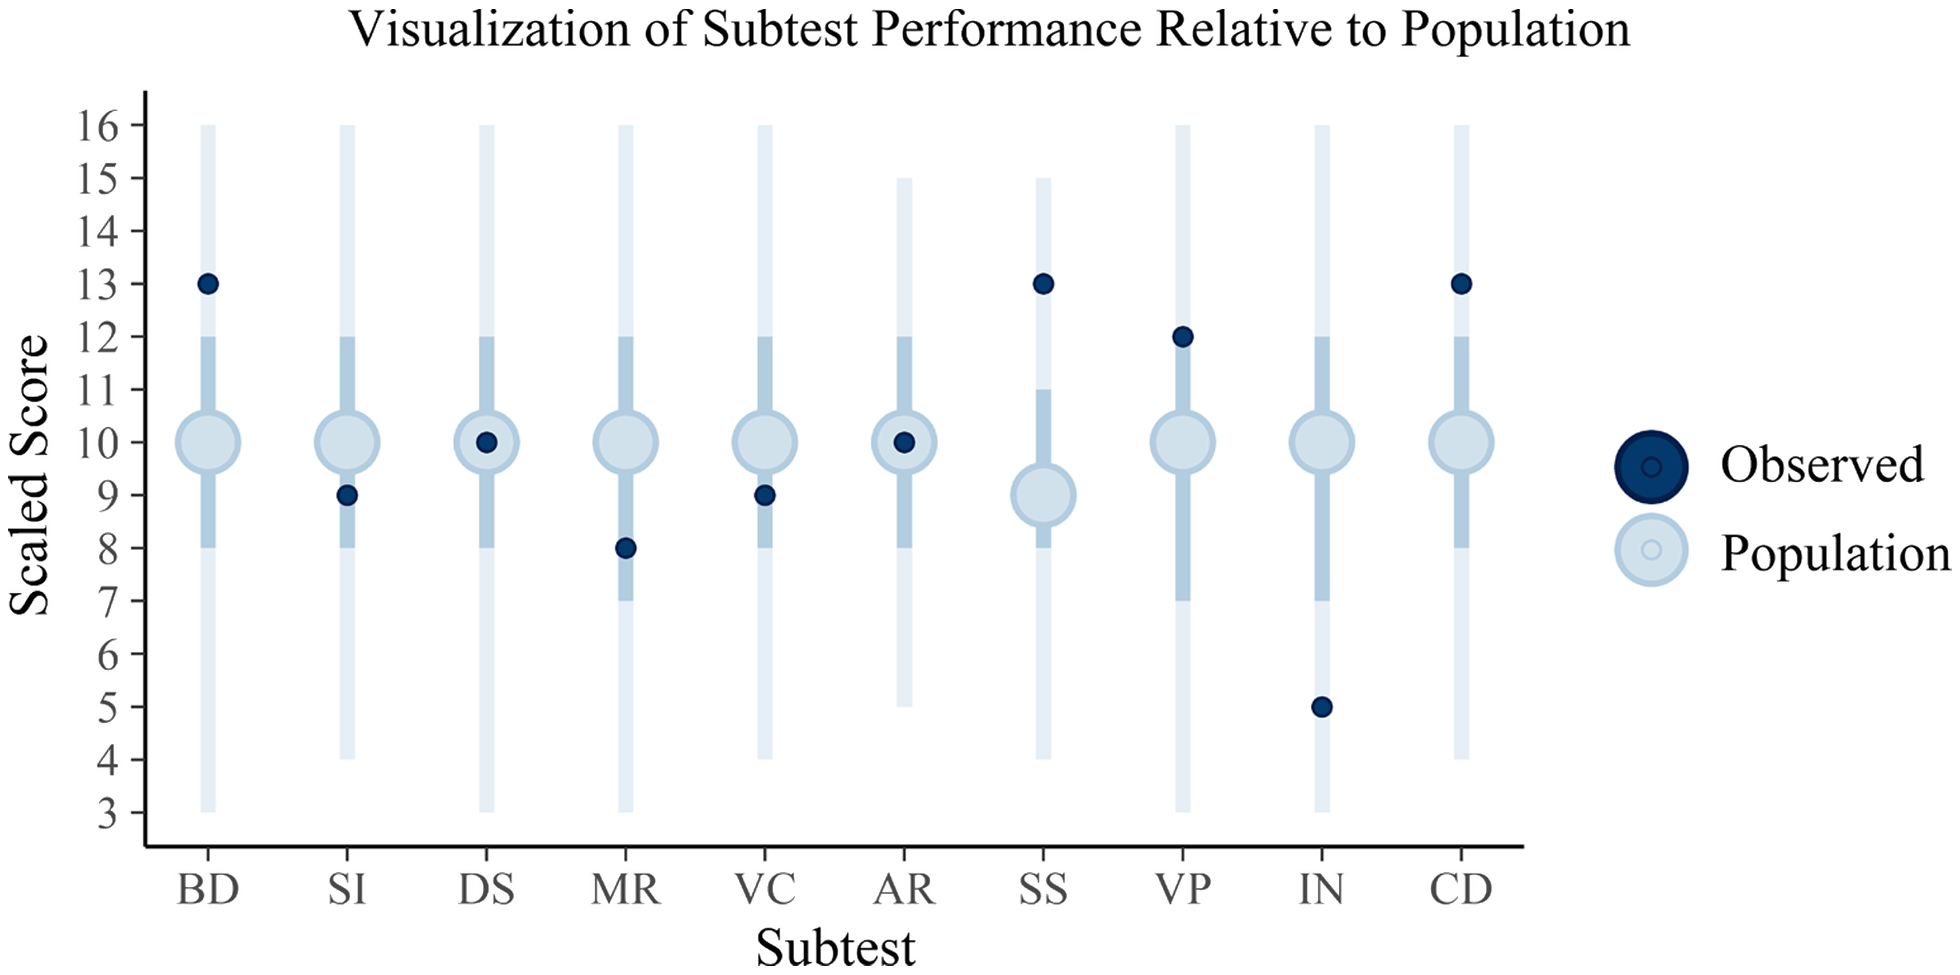
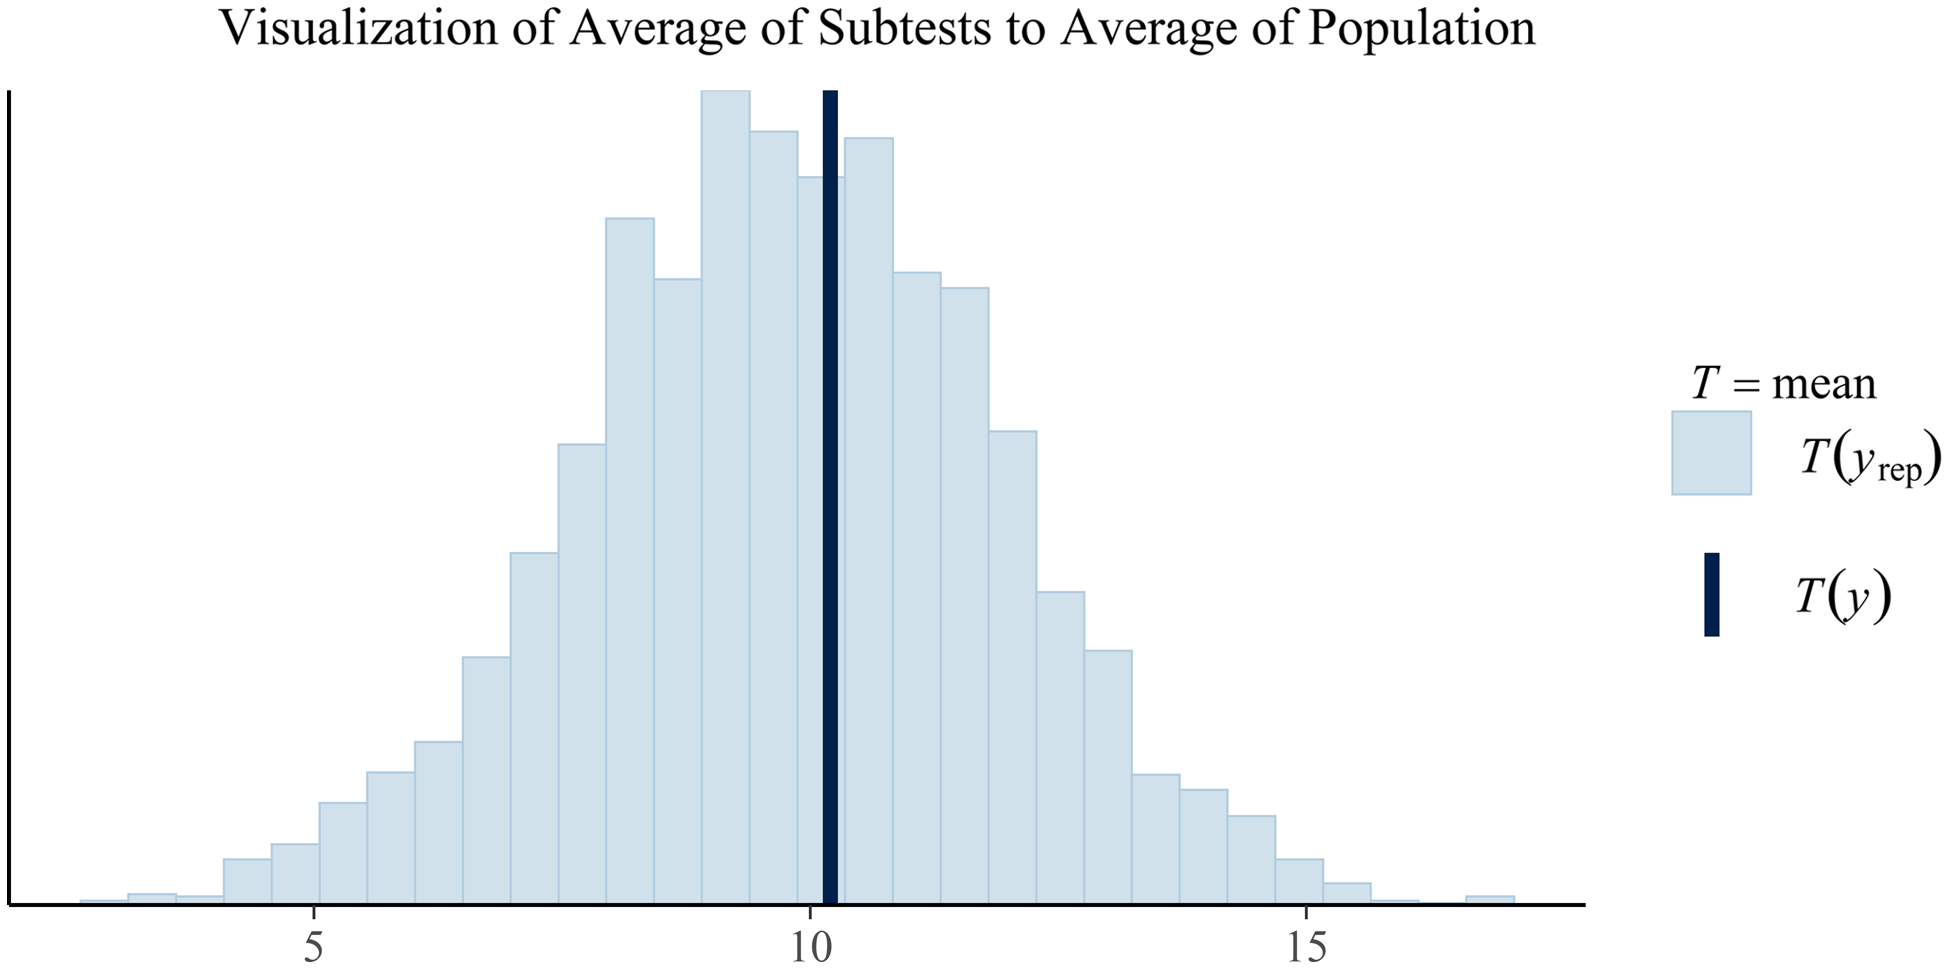
To highlight how a clinician may view these results, Figures 1 and 2 are provided to demonstrate how the simulated individual’s test scores correspond to the posterior predictive distribution’s expectations of the population’s scores. In this simulation, only a single population (the normative sample) was estimated; however, in actual practice, posterior predictive distributions for each diagnostic population of interest will be generated. As a result, clinicians can make inferences regarding not only how an individual’s scores compare to a normative sample but also to any subpopulation.
Plotted are the posterior predictions of the WAIS subtests with the full vertical lines reflecting the 95% credible interval, the darker interior interval the 50% interval, and the large circle the mean score. The dark circles plotted over these are the observed sores for the client. These intervals appear large, encompassing nearly the full range of scaled scores in some cases; however, it is important to note that some subtests range much smaller ranges and that the internal 50% credible intervals vary in their boundaries across tests, suggesting that standard qualitative cutoffs for these tests may not be particularly informative (e.g., “average” being between scaled score of 8 and 11). The individual, relative to the estimated population distribution of scores, can be said to have scored above the average on Block Design (BD), Symbol Search (SS), and Coding (CD) but then below average on Information (IN). The remaining scores for Similarities (SI), Digit Span (DS), Matrix Reasoning (MR), Vocabulary (VC), Arithmetic (AR), and Visual Puzzles (VP) may be considered to be within the average range. This interpretation is subject to clinical judgement, of course, with the current interpretations based on whether the scores fall within the 50% credible interval (and thus average) or outside of this range (and thus either above or below average).
Plotted in this figure is the average subtest scores from the posterior predictions (the histogram) and the observed average subtest score for the client. While this plot is currently limited to just the overall average, similar plots could be create by index to visualize how the client's averages compare to a population-based estimate of averages. Similarly, plots of differences could be created in similar fashion to show the posterior predicted population frequencies of certain discrepancies between average scores (e.g., Vocabulary minus average of subtests in the Verbal Comprehension Index). Any composite measure of the posterior predictions could be generated. For example, a similar plot showing the variability of subtests in the posterior predicted population against the variability of subtests in a particular client.
DISCUSSION
This study provides initial validation of the proposed flexible Bayesian diagnostic model described here. In the simulation conditions, the model demonstrated the ability to estimate z-scores, return accurate diagnoses, and approximate the population distribution of scores using only commonly reported reference sample statistics. Readers interested in using the model are encouraged to review the supplementary materials which include further overview of the simulation conditions and methods, additional exploration of the results, a detailed demonstration of how to use the model clinically, and contextualization of the model’s design.
The first hypothesis that the Bayesian model would produce accurate estimates of population parameters was strongly supported by the parameter recovery simulation study. The model produced minimal bias in estimating true z-scores, and correlations between the estimated and true z-scores demonstrated nearly perfect linear associations, supporting the notion that similar information in the true z-scores is contained in the estimated z-scores. Many neuropsychologists are familiar with the interpretation of z-scores and their clinical implications; however, true z-scores are rarely able to be computed given the need to know the actual population mean and standard deviation. Additionally, these z-scores are normalized scores given the model specification. Where some measures compute z-scores through simple linear transformation, unless the distribution of scores is normal, the z-scores themselves will not be normal, which limits the ease of their application since percentiles cannot be determined from a standard normal curve table (Crawford, Reference Crawford, Goldstein and McNeil2003). Unsurprisingly, the first simulation demonstrated that when reference sample sizes are larger, the estimation of the true z-scores was more accurate, though relatively good overall accuracy was still maintained with sample sizes as small as 50 participants.
Results from the second simulation provided strong support for hypothesis two that diagnostic accuracy of the model would be at least equivalent to alternative methods. This study’s Bayesian model outperformed all other classification methods utilized. Several competing models were compared to the model’s classification rate. These models included parametric and machine learning approaches that were selected because of the interest in defining diagnostic algorithms, particularly in cognitive screening settings. In all cases, the Bayesian model’s resulting contingency matrix of predicted versus true diagnoses were significantly different than the other classification methods. The Bayesian model also produced a correct diagnosis rate superior to the other methods despite using the same data to conduct these classifications. Notably, the Bayesian model is likely more practical than any of these other methods. The LDA, QDA, multinomial regression, and random forest methods require that a previous study has already published the formula or model derived from the same battery of tests applied to the same diagnostic contrasts that the clinician is interested in. The likelihood of this for the range of clinical needs is highly unlikely. Additionally, the model achieved high accuracy despite using an abbreviated global cognitive function and a brief neuropsychological screening test. The relative accuracy of the model is notable considering the limitation of this battery for detecting MCI.
The third hypothesis that the model’s posterior predictive distribution would be equivalent to distributions in the true population was supported by the final simulation condition. The posterior predictive distribution of “raw” scores (scaled scores in this case) closely mirrored those reported in the WAIS-IV manual. The model does not produce perfect parallelism with the WAIS-IV manual, but it is unclear the extent to which this is because the posterior was estimated only from 75- to 79-year-olds rather than the entire sample versus bias in the estimation, though both likely contribute. This finding is particularly important since all results are based on simulated data, while this condition utilized comparison to reported, empirical data in the WAIS-IV manual. The posterior distribution of predicted scores closely aligned with percentiles reported in the WAIS-IV manual, particularly in the tails of the distributions. Additionally, this parallel to the WAIS-IV manual was obtained through transformations of the posterior predictions, meaning that no information about the distribution of the sum of scaled scores or the discrepancy between Digit Span and Arithmetic were given to the model. The ability of the posterior to retain information about the correlation of scores and support valid inference on transformations of its parameters allows the model to extend simple descriptive statistics. For example, a study may just report means and standard deviations, but clinicians may be more interested in base rates of discrepancies or averages of certain tests, so an accurate posterior distribution that closely approximates these base rates or percentiles and supports such transformations is a unique advantage.
A strength of the described model is that it is highly flexible and modular in its implementation. The goal in writing the model was to ensure it used only information readily available to clinicians. Nearly any published study could be used as a reference sample in the current model because it is routine practice to publish a summary table with sample size and means and standard deviations of test performance. Neuropsychological measures are routinely factor analyzed, and correlation matrices can be readily imputed from acceptable factor models. Such a model has the potential to enable direct, quantitative comparison between an individual and any number of clinical samples that are published. The model is theoretically informed by EBNP and rooted in an extension of existing quantitative methods to operationalize diagnosis in a standard manner across test batteries, diagnostic contrasts, and settings. Such a standard can help to transition diagnostic accuracy research beyond single tests between certain diagnoses toward the accuracy of testing batteries and normative/reference samples. Additionally, the model’s modular design means that clinicians are not limited to the number of diagnostic contrasts that they want to make, unlike other kinds of diagnostic models like logistic regression which contrast only two groups.
An advantage of this model over other statistical models is that the posttest probability for various diagnoses can be chained together. Even if no published study has reported on the exact same battery as used to assess a particular client, the battery likely has common tests (e.g., Trail Making Test, verbal fluency, etc.). With the battery broken down, published literature examining these tests in a wide variety of clinical settings are readily available. The diagnostic accuracy simulation condition leveraged this strength of the model since there was not a readily available study that administered the abbreviated WAIS-IV and RBANS in all three of the same populations. Instead, data for the WAIS-IV in the three populations were used to compute an interim posttest probability that was then updated using the data for the RBANS in all three populations. The result was superior classification accuracy relative to the alternative classification methods.
This model extends the single-case tests of dissociation and difference described by Crawford and colleagues (e.g., Crawford & Garthwaite, Reference Crawford and Garthwaite2007; Crawford, Garthwaite, & Betkowska, Reference Crawford, Garthwaite and Betkowska2009; Crawford et al., Reference Crawford, Garthwaite and Gault2007). Due to the considerable influence of Crawford and colleagues’ work on evidence-based single-case methodology, it is relevant to compare and contrast with the current project. First, the current model places less emphasis on identification of dissociation between tests than some of the other single Bayesian methods described (e.g., Crawford & Garthwaite, Reference Crawford and Garthwaite2007; Crawford, Garthwaite, & Betkowska, Reference Crawford and Garthwaite2007). As highlighted earlier, however, it is possible to utilize the posterior predictive distribution to perform further analyses and answer questions related to the expected abnormality of differences between certain tests. Where methods described in Crawford et al. (Reference Crawford, Garthwaite and Gault2007) or Crawford and Garthwaite (Reference Crawford and Garthwaite2006a, Reference Crawford and Garthwaite2006b) note the need for accounting for the correlation between two measures in such contrasts of scores, the posterior samples maintain the correlations estimated by the model (McElreath, Reference McElreath2016). Second, the model extends the focus of previous single-case methods by incorporating both multivariate analyses and multiple reference samples. The current model is a natural extension of the prior work in that the model yields the same kind of z-score information and capacity to test for differences in scores while adding the ability to look at this information in the multivariate case, across multiple different reference samples, and yield some probabilistic information regarding diagnosis.
Although this model is promising, limitations exist. First, this study looked only at supporting evidence for the model in a simulation setting. Although efforts were made to make the simulations realistic, simulation is inherently overly simplified and reductionistic. Thus, this study provides no evidence that the model will generalize to clinical applications, though the results suggest applications to clinical data may be useful. Complexities of diagnosis, accounting for demographic factors, consideration of performance validity indices, and adjusting for contributing comorbidities are all missing from these simulation studies. Additionally, only a few applications of posterior predictive inferences were able to be illustrated and tested in this study despite many more being relevant to clinical practice.
Second, the model makes specific assumptions about how to best simplify the world for the sake of statistical analysis. Critical appraisal of these assumptions regarding appropriateness for various settings and applications is important. Additionally, the current simulations have treated neuropsychological test scores as unbounded and normally distributed at the population level. While the latter assumption may be acceptable in many cases, these issues are significant if the desire is to examine raw scores as these are clearly bounded and can often be significantly skewed as a result.
Third, in developing the model, some degree of precision was sacrificed for usability and flexibility. Alternative models may be considered and could be expected to produce more accurate diagnoses in certain cases. These options were not implemented simply because they require specific knowledge about the tests, battery, or diagnoses that would limit generalized utility. Readers should thus consider whether some inaccuracy with this model is worth the trade-off in comparison with other potential approaches. One such example of an alternative model is the Bayesian Multilevel Single Case (BMSC) model described by Scandola and Romano (Reference Scandola and Romano2021). In their simulation study, the BMSC model outperformed the single-case t-test approach described by Crawford and colleagues (e.g., Crawford and Garthwaite, Reference Crawford and Garthwaite2006b). The BMSC model is particularly well suited to research, where the raw data for a control group are available (or where a multilevel regression model in the control group has been reported before) and in cases where there are multiple observation by design (e.g., multiple trials of finger tapping, reaction times over varying conditions).
Finally, the idea of a “black box” approach to diagnosing a wide variety of clinical conditions could be considered controversial, especially if applied in a vacuum. Clinicians should, of course, render the final verdict in a diagnostic assessment. If clinicians omit a clinical reference sample for the true condition that a client has, then the model could never accurately arrive at that diagnosis. Additionally, if the neuropsychological test data are invalid or the reference samples are poorly defined, then the model’s results will suffer.
While the model described here may have eventual clinical applications, a potentially more immediate application could be to research studies. For example, the Jak/Bondi actuarial neuropsychological definition of mild cognitive impairment (MCI) has been validated across several studies and data sets (e.g., Jak et al., Reference Jak, Bondi, Delano-Wood, Wierenga, Corey-Bloom, Salmon and Delis2009; Bondi et al., Reference Bondi, Edmonds, Jak, Clark, Delano-Wood, McDonald and Salmon2014; Edmonds et al., Reference Edmonds, Delano-Wood, Clark, Jak, Nation, McDonald and Bondi2015; Wong et al., Reference Wong, Thomas, Edmonds, Weigand, Bangen, Eppig and Bondi2018). When the Jak/Bondi diagnostic algorithm was applied to the Alzheimer’s disease cooperative study donepezil trial, donepezil was associated with a lower rate of conversion from MCI to Alzheimer’s dementia despite the original study using an alternative diagnostic process finding no effect for the medication (Edmonds et al., Reference Edmonds, Ard, Edland, Galasko, Salmon and Bondi2018). The Bayesian model examined in this study presents a uniform, EBNP-driven diagnostic algorithm that could be easily used for diagnostic classification in research studies without any restrictions on test selection, diagnostic contrasts, or existing classification equations. For example, inclusion of participant data in a particular study may be connected to the confidence the researcher has in each participant belonging to a particular diagnostic group, so an inclusion criterion might be that the posttest probability for MCI needs to be at least some value (e.g., .70). The flexibility of the model and its emphasis on classification at the individual rather than group level makes it a potentially valuable research tool.
There remain many future studies and iterations of the model to be conducted. As noted earlier, one of the most needed studies is applying the model to clinical data rather than simulations. Another interest is expanding prior information about individual test performance by incorporating details about diversity, comorbidities, and other person-level factors. This can be done by layering over a standardized mean difference effect size to the model or including relevant reference samples and more detailed information. Another extension of the model would be to incorporate test reliability and generalizing to regression-based normative data. Though future research is needed, the initial findings of the model are encouraging and suggest that it can be used flexibly by clinicians and extend research to answer a range of questions within EBNP.
SUPPLEMENTARY MATERIAL
The supplementary material, including R code and additional methodological and results details, can be accessed on github: https://github.com/w-goette/Single-Case-Classification.
ACKNOWLEDGMENT
We want to thank the O’Donnell Brain Institute and Texas Institute for Brain Injury & Rehabilitation for their institutional support of our authors.
FINANCIAL SUPPORT
This study was made possible in part by a grant from Texas Alzheimer’s Research and Care Consortium (TARCC) funded by the state of Texas through the Texas Council on Alzheimer’s disease and related disorders.
CONFLICTS OF INTEREST
The authors have nothing to disclose.


 Open access