The importance of vitamin D in pregnancy is increasingly recognised. Vitamin D has a broad therapeutic impact during pregnancy for both the mother and the fetus, in addition to its role in the endocrine regulation of Ca and bone metabolism(Reference Wagner and Hollis1,Reference Wagner, Hollis and Jenkins2) . Many studies have reported that low maternal vitamin D increases the risk of adverse pregnancy outcomes such as preeclampsia, spontaneous pregnancy loss, gestational diabetes mellitus, preterm birth, low birth weight and small for gestational age babies(Reference Dovnik and Mujezinović3–Reference Fang, He and Mu8).
Vitamin D can be obtained from cutaneous synthesis, diet and supplements. The primary source of vitamin D is exposure to sunlight. Optimal sunlight exposure can facilitate the natural conversion of vitamin D in the skin. However, the effect is reduced by wearing a hat, using an umbrella, wearing long-sleeved clothes or using sunscreen(Reference Granlund, Ramnemark and Andersson9–Reference Libon, Courtois and Le Goff11). In many Asian and Middle Eastern countries, cultural and religious practices highly influence daily exposure to sunlight(Reference Nimitphong and Holick10,Reference Nichols, Khatib and Aburto12) . Sun-seeking behaviour is uncommon in tropical Asian populations due to the warm climate most of the year and the cultural perception that fair skin is associated with beauty(Reference Li, Min and Belk13,Reference Mithal, Wahl and Bonjour14) . Furthermore, due to increasing concern about sun exposure and skin cancer(15), people avoid it or use sun protection.
Foods rich in vitamin D are potential sources to fulfil vitamin D requirements. There are only a few good natural dietary sources of vitamin D. The main food groups contributing to vitamin D intake are typically fish, egg yolk, cheese and mushrooms. Among these, fish has the highest vitamin D content and is the major natural food source of vitamin D in many populations. Compared with other Association of Southeast Asian Nations countries in 2013, the fish consumption of Indonesia’s population (31·8 kg/cap/year) is lower than Myanmar (60·7 kg/cap/year), Malaysia (54·0 kg/cap/year), Brunei (47·0 kg/cap/year), Singapore (46·9 kg/cap/year), Cambodia (41·4 kg/cap/year) and Vietnam (34·8 kg/cap/year)(Reference Jaya, Jaiyen and Moe16). The low fish consumption among the general Indonesian population compared with other Association of Southeast Asian Nations countries may contribute to inadequate vitamin D intake among most Indonesian pregnant women (64·3 %)(Reference Lipoeto, Aji and Ayudia17).
The Indonesian Ministry of Maritime Affairs and Fisheries has carried out a movement called ‘GEMARIKAN’ (Gerakan Memasyarakatkan Makan Ikan or Movement to Promote Fish Consumption) to promote the health benefits and encourage fish consumption(18). Ensuring the availability of specific food sources like fish is crucial and depends on how the market functions locally. Like other commercial commodities, fish needs to be transported from landing sites to places where it can be sold or utilised by consumers. Previous studies in Tanzania examined the consumption of animal source foods by comparing the two regions, Morogoro and Dodoma. The Morogoro region, which is closer to the ocean and has better market access, reported higher fish consumption and was nearly twice as likely to consume fish compared to Dodoma region(Reference Bundala, Kinabo and Jumbe19).
East Lombok District is one of the districts in Lombok Island, West Nusa Tenggara Province, Indonesia. The geographical location of East Lombok District, which is adjacent to the Java Sea, Alas Strait and Hindia Ocean, provides a remarkable abundance of fishery resources. Apart from being surrounded by a large sea area, East Lombok District also has some areas that are geographically close to Mount Rinjani, introducing a challenge in the distribution of fish products. Fish is one of the most perishable foods and can easily be spoiled if not properly preserved(Reference Tavares, Martins and Fidalgo20). In rural mountainous areas where infrastructure is poor, some nutritious foods that are perishable are unlikely to be traded in markets and might be unavailable in its fresh form. One study examined the geographical factors influencing route choice of fish distribution reported that the choice of destination by fish traders is strongly influenced by route distance and transport costs, with shorter distances minimising costs and allowing for efficient operations(Reference Nyengere, Mwathunga and Dulanya21). Previous studies in mountainous and coastal area in Indonesia found that average amount of fish consumption among toddlers in coastal areas is significantly higher compared with those in mountainous areas(Reference Azkia, Suyatno and Kartini22).
Linear programming (LP) has been widely used to develop food-based recommendations (FBR) targeting pregnant women. WHO Optifood software allows users to identify population-specific dietary nutrient gaps and develop FBR based on locally available foods, which were in line with existing dietary patterns and economic accessibility(Reference Ferguson, Darmon and Fahmida23). Previous study using LP approach found out that the typical problem nutrients among pregnant women in 10 high-stunting districts in Indonesia were Fe, folate and Ca(Reference Fahmida, Pramesthi and Kusuma24). However, most previous studies did not include vitamin D in the analysis(Reference Fahmida, Pramesthi and Kusuma24–Reference Hamid, Rajikan and Elias27). Sunlight has been the primary source of vitamin D, as it enables natural synthesis in the skin(Reference Wacker and Holick28). However, factors such as cultural and religious practices, clothing choices and sun-avoidance behaviours in many Asian and Middle Eastern countries have significantly reduced sun exposure(Reference Granlund, Ramnemark and Andersson9–Reference Libon, Courtois and Le Goff11). As a result, dietary sources of vitamin D have become increasingly important in meeting vitamin D requirements.
Therefore, this study aims to map the availability of vitamin D-rich fish, identify the dietary patterns and develop FBR to promote an adequate vitamin D intake among pregnant women in East Lombok, Indonesia.
Methods
Setting
This comparative cross-sectional study is part of an observational cohort study entitled ‘UKRI − GCRF Action Against Stunting Hub (AASH)’ study. The AASH study aims to explore the causes and typologies of stunting through a whole-child approach, considering various aspects such as epigenetics, genetics, gastrointestinal health, childcare, nutrition and education from pregnancy until the child is aged 2 years. This study is expected to enrich the AASH study, especially on knowledge and practices to improve diet during pregnancy.
The study was conducted among pregnant women in the East Lombok District of West Nusa Tenggara Province, Indonesia. East Lombok was chosen as it is among the districts with the high-stunting rates in the country. Despite West Nusa Tenggara being a province with high level of fish production, fish consumption remains low. In 2022, the fish supply was 216·9 kg per capita per year, while consumption was only 40·9 kg per capita per year(29–31). This discrepancy highlights the need to study fish availability and its preferences in the community.
The recruitment of subject was started in February 2021 and completed by the end of September 2021. Data collection for pregnant women in the third trimester was conducted between June 2021 and January 2022. The mapping of vitamin D-rich fish was conducted in December 2023.
Study participants
The study population was pregnant women in four subdistricts of East Lombok, Indonesia: Aikmel, Lenek, Sikur and Sakra. The list of pregnant women was obtained from the Polindes (village health post). Based on this list, enumerators, accompanied by the village health cadres, visited each household, invited pregnant women to participate in the study and obtained their written informed consent. Eligible participants were pregnant women who met all the inclusion criteria, which were 18–40 years old, gestational age 32–36 weeks, singleton pregnancy, from the Sasak ethnic group (native to Lombok Island) and stated their willingness to participate by signing the written informed consent. Subjects of this study were excluded if they had chronic diseases or participated in another community-based intervention, including those receiving egg intervention in the main AASH study. A total of 435 pregnant women were included in the study.
Fish availability mapping
This procedure referred to the systematic process of quantifying and categorising the presence of fish naturally rich in vitamin D within a specific geographic region. The process aimed to identify various fish that contributed to vitamin D intake. The operational steps included: (1) Food Source Identification: identification of fish that were considered rich sources of vitamin D. Fish were classified as rich in vitamin D if the content was ≥ 4 µg/100 g weight (online Supplementary 1). Out of thirty-five fish identified in the twenty-five village markets in the study area, thirty fish were identified to have vitamin D of at least 1 µg /100 g weight. These vitamin D rich fish were given a weight based on the vitamin D contents, i.e. scores of 3, 2, and 1 were assigned for fish with vitamin D content of ≥ 10 µg/100 g weight, 5–10 µg /100 g weight, 1–5 µg /100 g weight, respectively. (2) Market Identification: Twenty-five village markets in the study area (Sakra, Sikur, Aikmel, and Lenek Subdistrict) were identified through the list from Trade Office of West Nusa Tenggara Province. The 24-h dietary recall data collection was spread over the period of 6 months from June 2021 until January 2022, which covered seasonal changes in both wet and dry seasons. The market survey was conducted in December 2023, and based on information from fish sellers, fish catch was stable throughout the year, with monthly fluctuation due to tidal variations. (3) Market Categorisation: categorised the markets based on the types of fish and the number of fish sellers in the markets. The score of each type of fish was multiplied by the number of fish sellers in the market. The total score was divided into four quartiles, and subsequently the market was categorised into two: first quartile as low (LD) and fourth quartile as high (HD) availability of vitamin D-rich fish markets. The markets in the second and third quartiles were excluded to ensure distinct comparison of LD and HD markets; nevertheless, 73 % of the subjects were within 2·4 km buffer zone to either LD or HD markets. Quartiles were used to classify availability zones because they provide a simple, data-driven approach that ensures balanced group sizes, especially when sample sizes are limited. Alternative methods using regression based on proximity to the market location was also tested and resulted in similar findings with the quartile-based classification. (4) Geospatial Data Collection: recording the geographic coordinates of local markets in the four subdistricts of the study area. The geographic coordinates of respondents’ residential areas were obtained from the AASH study. (5) Geospatial Analysis: This step involved using Quantum Geographic Information System software to create buffer zones within 2·4 km of the market and identify each respondents’ homes that fell into this buffer area. The cut-off of the buffer zones was adopted from a study conducted in North Carolina since this study also measured the food store environment (food availability and accessibility) among low-income women(Reference Gustafson, Sharkey and Samuel-Hodge32). Respondents who fell into one or more buffer zones of ‘high availability of vitamin D-rich fish markets’ were categorised as residing in ‘high availability vitamin D-rich fish areas’. Respondents who fell into one or more buffer zones of ‘low availability of vitamin D-rich fish markets’ were categorised as residing in ‘low availability vitamin D-rich fish areas’. Respondents who fell into buffer zones of both ‘low availability of vitamin D-rich fish markets’ and ‘high availability of vitamin D-rich fish markets’ were categorised as residing in ‘high availability vitamin D-rich fish areas’. Respondents who did not fall into any buffer zone of any market were categorised as residing in ‘low availability vitamin D-rich fish areas’. Spearman correlation analysis showed a weak but statistically significant positive correlation between respondents’ proximity to markets and fish availability area based on the quartile’s classification (r = 0·121, P = 0·012).
Structured questionnaire
The study’s background characteristics questionnaires (i.e. age, education level, employment status and household wealth index) were standard questionnaires used in national surveys in Indonesia, including the Indonesian Basic Health Survey (RISKESDAS), the National Socioeconomic Survey (SUSENAS) and an earlier cohort study conducted in East Java, Indonesia(Reference Fahmida, Htet and Ferguson33). The food taboo questionnaire was modified from Tela et al. (Reference Tela, Gebremariam and Beyene34) A list of food taboos unique to pregnancy in the Lombok setting was included after this version was piloted in the local community for additional improvement. Enumerators who collected data were Lombok natives who spoke both Indonesian and Sasak and were familiar with the research population’s cultural background. This ensured clear communication and proper delivery of questionnaire items.
Wealth index calculation
The household wealth index was calculated utilising a variety of characteristics, including dwelling amenities, household assets and mode of transportation. Each household item or asset was assigned a value of ‘1’ if it was owned and ‘0’ otherwise. These values were then multiplied by dataset-derived component score coefficients. The resulting scores for each variable were added together to calculate the overall household wealth index score, which was then divided into three equal groups (terciles): low, middle and rich. The computation was performed using the principal component analysis approach, as specified in the 2017 Indonesia Demographic and Health Survey Program guidelines(35).
Anthropometric assessment
Mid-upper arm circumference was used to determine the nutritional status of pregnant women. The measurements were performed in accordance with standard procedures on the left or right upper arm of participants (if they were right-handed or left-handed, respectively), at a point halfway between the acromion and olecranon processes, to the nearest 0·1 cm using flexible and non-stretchable measuring tapes. Pregnant women were considered undernourished/chronic energy deficiency (CED) if their mid-upper arm circumference value was less than 23·5 cm. The village health post was informed when pregnant women had CED, and these women received basic antenatal care according to the health system guidelines for women with CED.
Dietary assessment
The enumerators conducting anthropometric and dietary assessments were nutrition graduates. Training was provided before data collection, including a pilot study with evaluation and key takeaways to improve data collection techniques.
The dietary assessment was conducted via an electronic questionnaire using a four-pass 24-h dietary recall to minimise bias(Reference Htet, Fahmida and Do36). On the first pass, each pregnant woman was asked to mention all the foods and drinks she consumed the day before. Regarding fish consumption, respondents were asked to specify the type of fish consumed, including species known to be rich sources in vitamin D (e.g. sardines, mackerel, anchovy and tuna). This differentiation allowed for a more precise estimation of dietary vitamin D intake. The second pass captured data on consumption time, food and drink details (ingredients, cooking method and brand name) and additional items or condiments for each food and drink listed (for instance, sugar added to beverages). In the third pass, portion sizes were estimated by weighing a certain amount of real food (Tanita digital scale for kitchen use, model KD-160, precision ± 1 g; Tanita Corporation), using water or kinetic sand conversion, utilising food models or photographs or counting the standard units consumed. On the fourth pass, the interviewer assessed the completeness of the dietary data and inquired whether the previous day’s diet was typical and, if not, how it deviated from the usual. To ensure that all interviewers followed the same approach for determining dietary portion size, a standardised guidebook was established.
Food composition table
Food nutrient values were obtained from the Indonesian Food Composition Table (FCT) (www.panganku.org)(37). Folate, vitamin B6, vitamin B12 and vitamin D contents, which were not available in the Indonesian FCT, were borrowed from neighbouring countries, i.e. (in priority order)
-
1) Other Southeast Asian FCT, e.g. Vietnam or Thailand
-
2) Other Asian countries, e.g. Japan or Korea(38)
-
3) US Department of Agriculture Food Composition Table (https://fdc.nal.usda.gov/)(39)
Borrowed values from other countries FCT were adjusted using water adjustment, yield factor and retention factors, as appropriate following INFOODS guideline(40,Reference Bognár41) .
Data analysis
Socioeconomic characteristics and dietary data were analysed using IBM SPSS version 20. Prior data analysis, the dietary data underwent a cleaning process to ensure accuracy and consistency. Outlier detection was performed for portion sizes of food items. Unusually large portions that resulted in very high energy intake were revised after comparing them with dietary records in hard copy. After that, energy under- and over-reporting were assessed by evaluating the ratio of reported energy intake to basal metabolic rate (EI/BMR). Participants with extreme total energy intake values (e.g. below 500 kcal/d or above 4000 kcal/d) were reviewed and excluded when considered implausible.
The energy requirements were derived from the recommended nutrient intake (RNI) values for Indonesian women aged 19–29 years (body weight: 55 kg), which are 2250 kcal. For women in their third trimester of pregnancy, the energy requirement was increased by 300 kcal, resulting in a total of 2550 kcal. The mean body weight of pregnant women in this study was similar, during recruitment and in their third trimester, the weight was 54·5 (sd 10·2) kg and 61·6 (sd 10·0) kg, with light to sedentary physical activity.
The normality test using Kolmogorov–Smirnov was performed for all continuous variables. Median and quartile (Q1–Q3) were used to display the descriptive statistic. The cleaned dietary data were then used in subsequent statistical analyses to compare the median values of the two groups with a significance value of P < 0·050 using Mann-Whitney test. Categorical variables were compared between high- and low-availability vitamin D-rich fish areas using the Chi-square test/Fisher exact test.
Preparation of linear programming model parameters
The LP model parameters were prepared in Microsoft Excel 365. These parameters included a list of foods consumed by the subjects, an average serving size of each food and the weekly frequency of food consumption. The weekly frequency was estimated from the percentage of consumers for each food item, food group and food subgroup (from a one-day 24-h dietary recall)(Reference Fahmida, Pramesthi and Kusuma42).
The 24-h dietary recall data collection was spread over the period of 6 months from June 2021 until January 2022, which covered seasonal changes in both wet and dry seasons. The visit was conducted across all days of the week, incorporating weekdays and weekends (the distribution was 75 % data captured on weekdays and 25 % on weekends). The LP analysis used estimates from the 1-day dietary data to determine the weekly consumption frequency based on the percentage of consumers for each food item, food group and food sub-group(Reference Fahmida, Pramesthi and Kusuma42). Foods that were commonly consumed, such as rice, which was consumed by 100 % of respondents (falling into the category of 68–100 % of subjects who consumed the food), had a maximum estimated weekly intake frequency of 7 days per week. In contrast, mackerel tuna was consumed by 12 % of respondents, placing it in the 6–12 % category and its maximum estimated weekly intake frequency was 2 days per week. These estimates help utilise the 1-day data to capture the weekly patterns of the population.
These LP parameters were used to set up the LP models for the analysis in the WHO Optifood software V4.0.14.0. Food items were categorised into the food groups and subgroups used in Optifood. Fourteen nutrients were analysed in Optifood: protein, fat, Ca, Fe, Zn, vitamin C, thiamine, riboflavin, niacin, vitamin B6, folate, vitamin B12, vitamin A and vitamin D.
Development of food-based recommendations
The analysis was performed in three iterative modules to generate FBR for pregnant women. The first module (Check diet) aimed to verify whether the solution is feasible to develop realistic diet models within the actual dietary patterns. The target group’s dietary data (portion and frequency) could only be modified in this module and were locked in the next module(Reference Fahmida, Pramesthi and Kusuma42).
Module II (Draft recommendation) identified the two best diets for achieving nutrient goals. The two best diets consisted of one best diet within the population’s average food pattern and one best diet with a more extensive range of food patterns, which may deviate from average intake but remain within the upper and lower range which had been inputted in Optifood, called no food pattern (No FP). Both diets come as close as possible to meeting recommended nutrient intakes(Reference Daelmans, Ferguson and Lutter43). Problem nutrients and nutrient-dense food items, food subgroups and food groups were identified through this module to help design alternative sets of FBR(Reference Fahmida, Pramesthi and Kusuma42).
In Module III (Test recommendation), the diets that had the lowest (nutrient content minimised to identify the worst-case scenario) and the highest (nutrient content maximised to identify the best-case scenario) %RNI were generated without any recommendation to provide baseline levels for comparison. The nutrients that did not achieve 100 %RNI in the best diet no food pattern (No-FP) were defined as ‘problem nutrients’, and those that did not achieve 100 %RNI in the best-case scenario (module III without any recommendation) were defined as absolute problem nutrient. Nutrients that could meet 100 %RNI in the best case scenario were defined as partial problem nutrients.
Alternative sets of FBR were compared in terms of the accomplishment of a nutritionally adequate diet. A set of FBR that has the highest %RNI in the worst-case scenario for protein, fat, Ca, Fe, Zn, vitamin C, thiamin, riboflavin, niacin, vitamin B6, folate, vitamin B12, vitamin A RE, vitamin A RAE and vitamin D was selected as the final set of FBR.
The nutrients included in Optifood analysis were protein, fat, Ca, Fe, Zn, vitamin C, thiamin, riboflavin, niacin, vitamin B6, folate, vitamin B12, vitamin A and vitamin D.
Results
Fish availability mapping
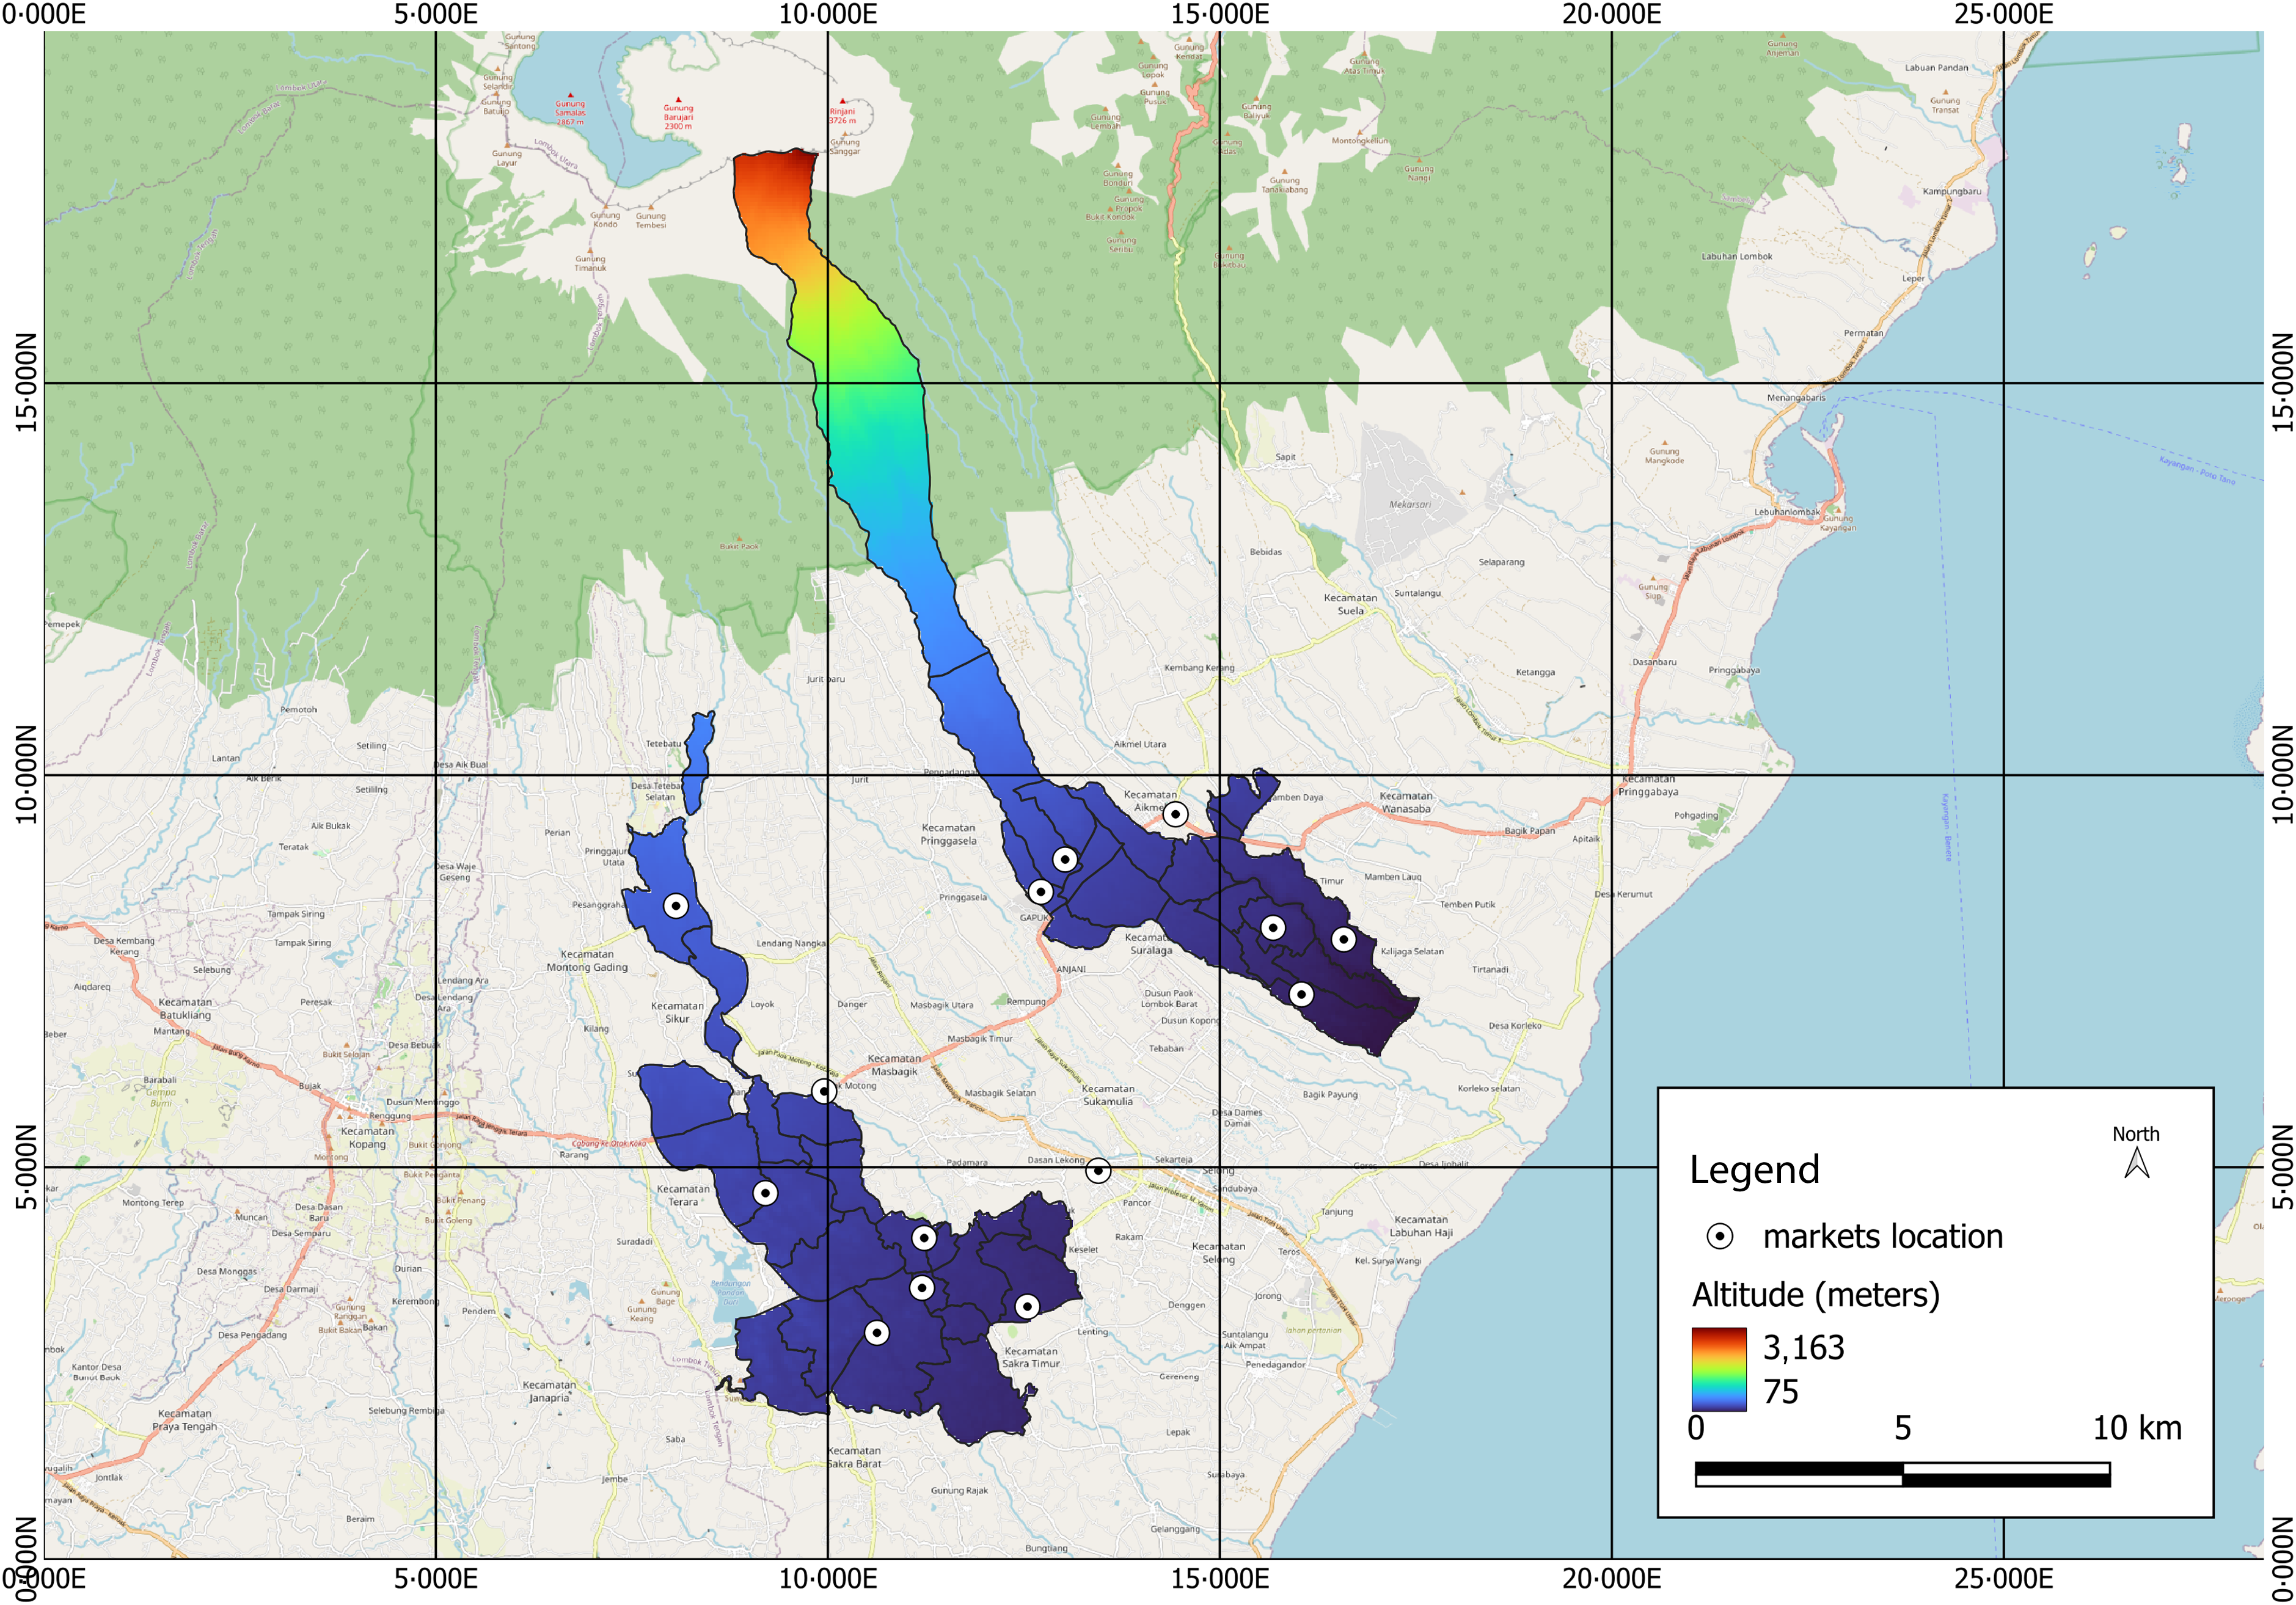
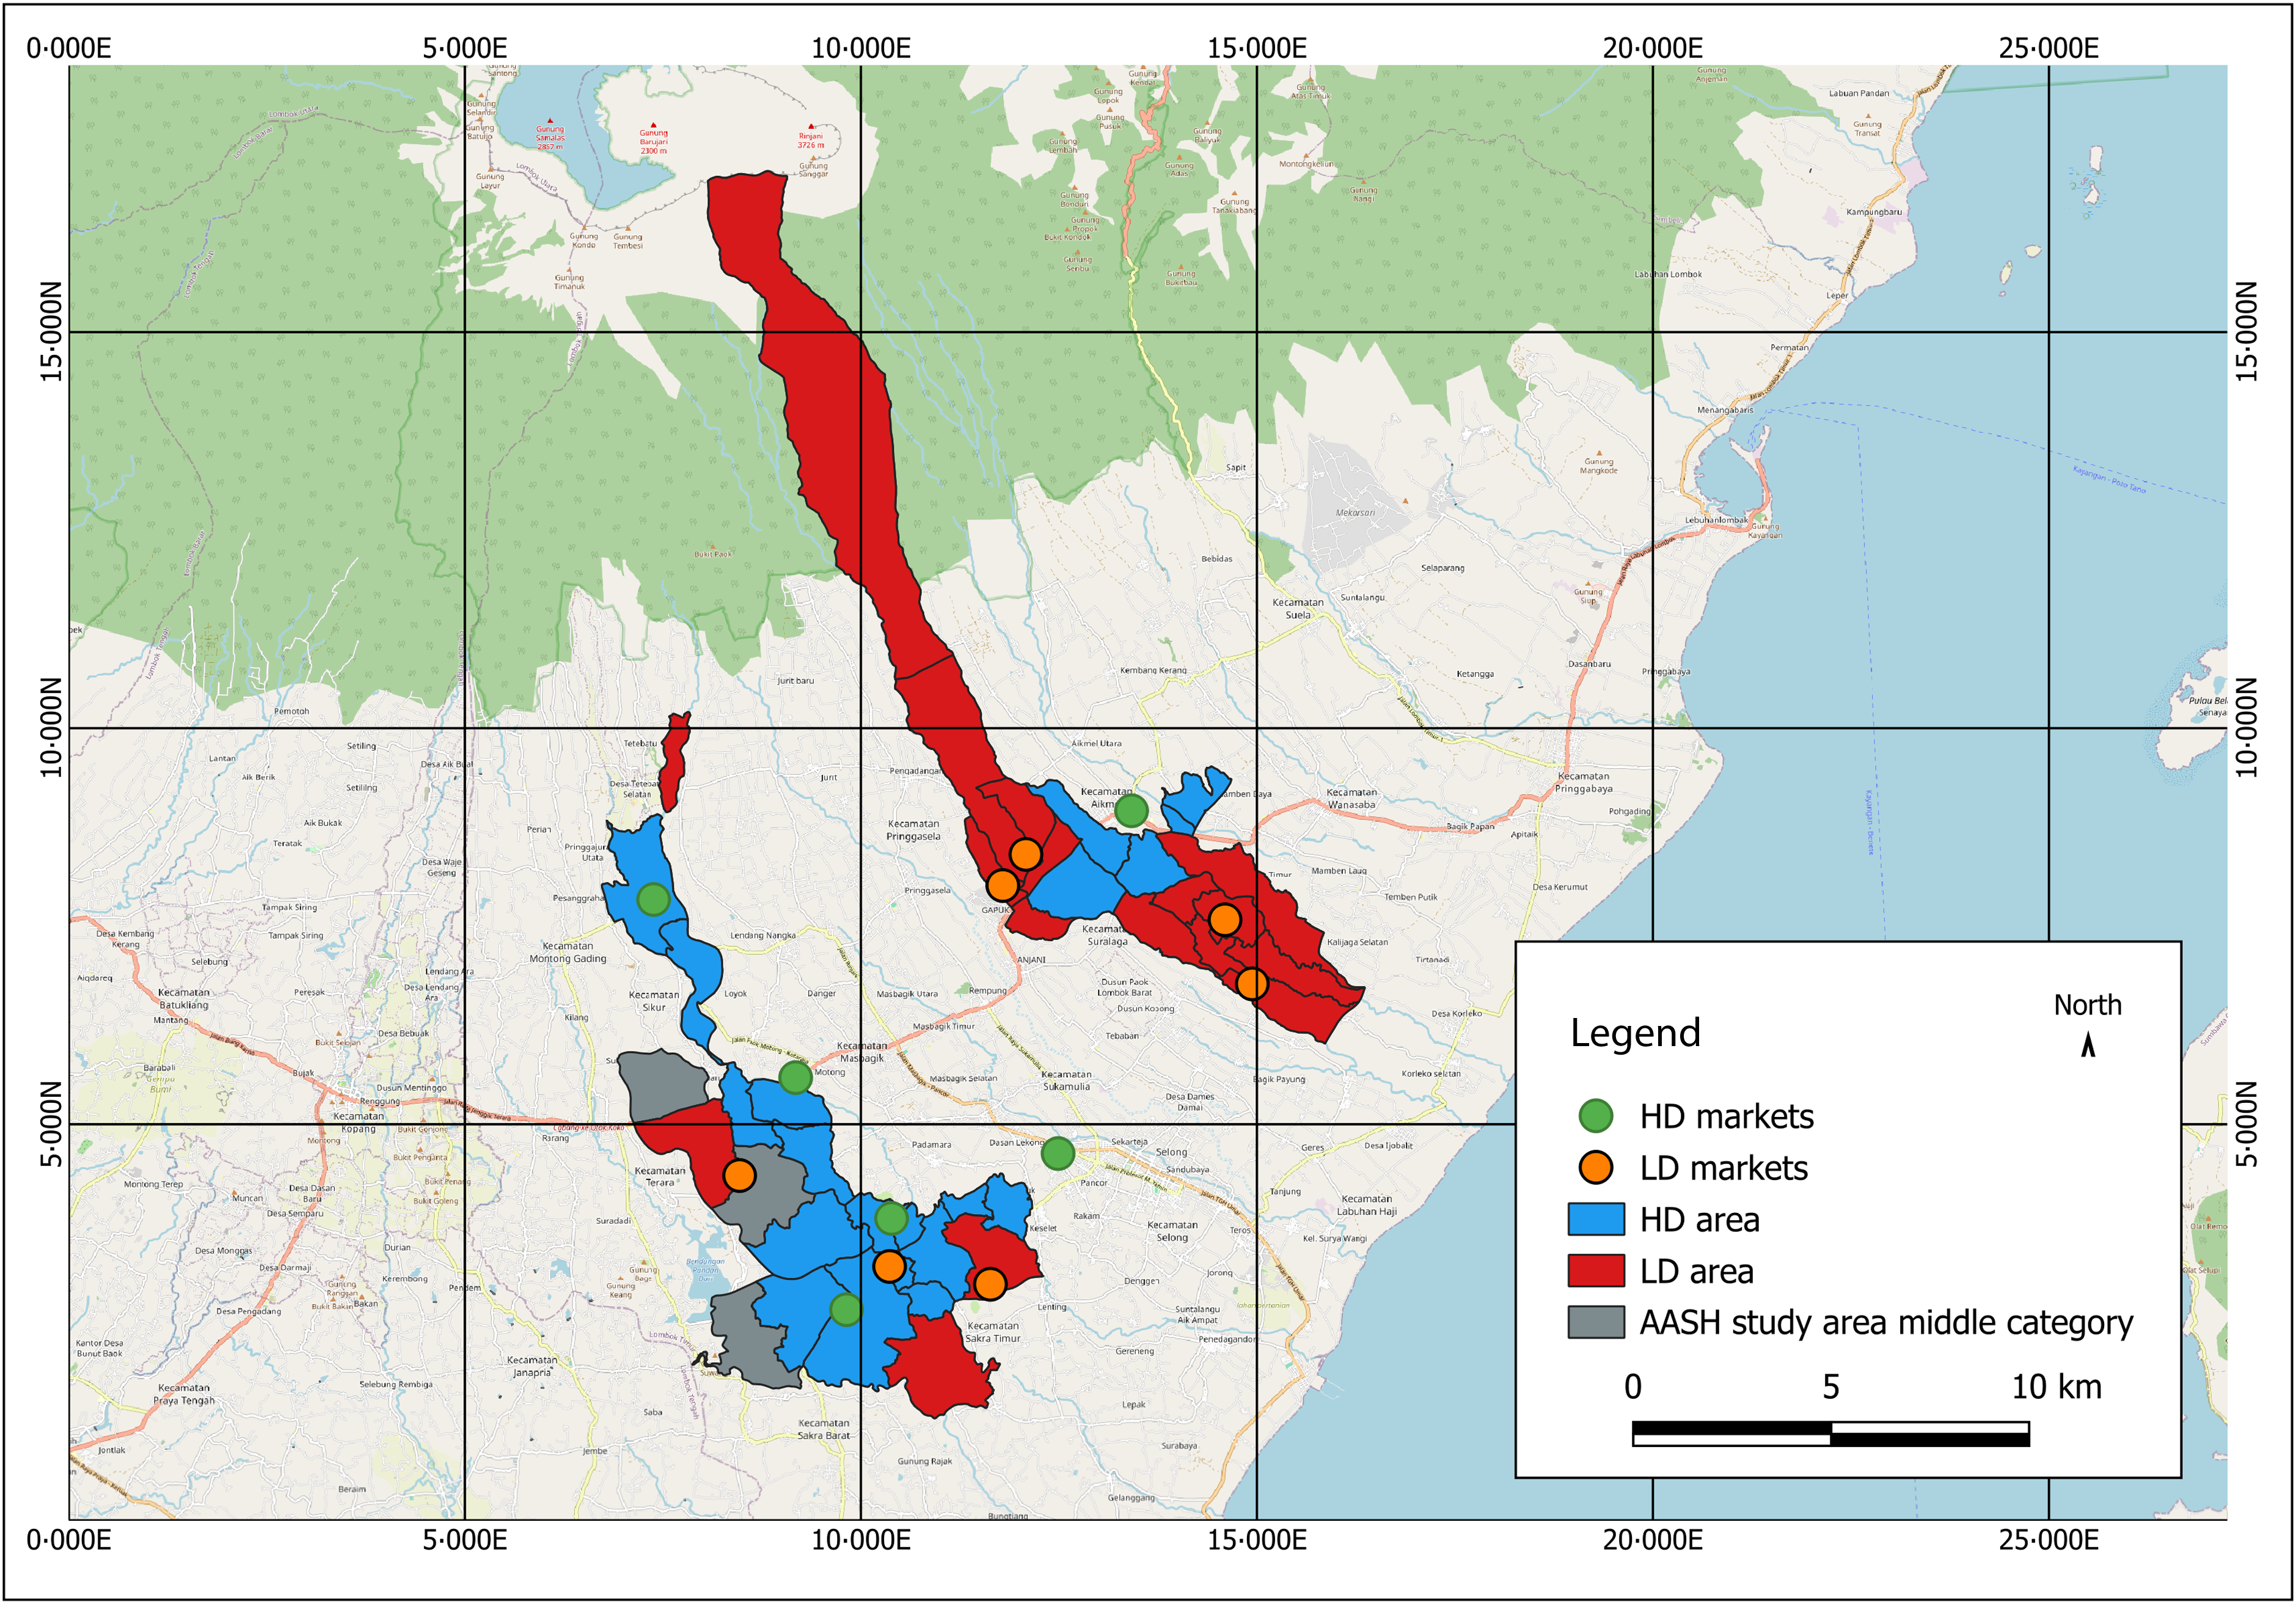
A total of twenty-five markets in the AASH study area were surveyed to determine the geographic coordinates and fish availability in the markets of the study area. Based on the altitude, study area is demonstrated in Figure 1. There are thirty-nine villages in the study area, three villages were excluded due to the market identified in that area being in the middle category (not high or low availability of vitamin D-rich fish). Twenty villages were categorised as high-availability vitamin D-rich fish (HD) areas with the median (Q1–Q3) market score was 24 (16–37), and sixteen villages were categorised as low-availability vitamin D-rich fish (LD) areas with the median (Q1–Q3) market score was 3 (0–3). HD areas were shown in blue, and LD areas were shown in red (Figure 2).
Geographic map of study area.

Fish availability mapping of high- and low-availability vitamin D-rich fish.

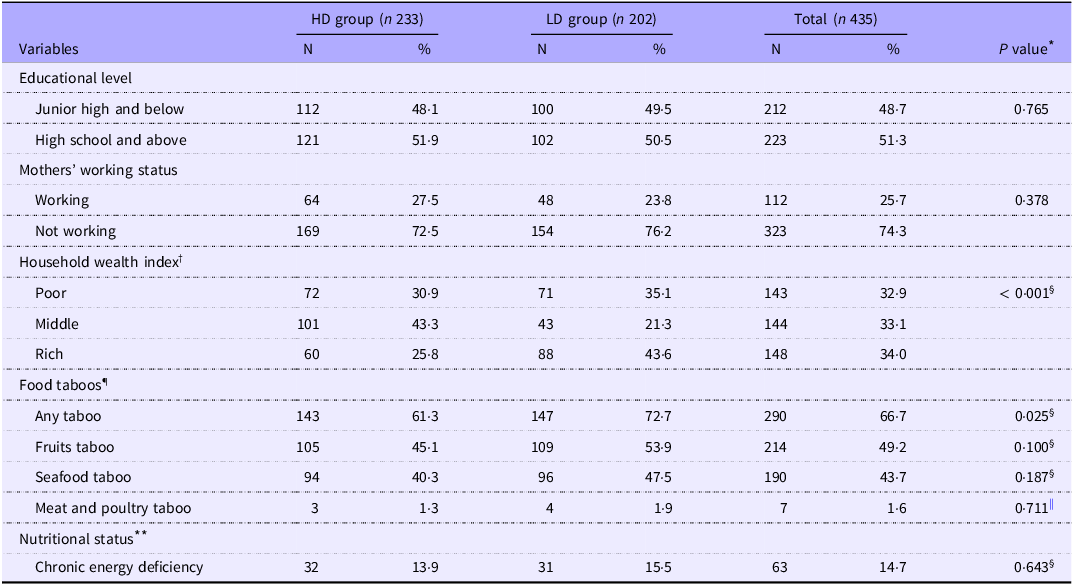
A total of 435 pregnant women were included in the study. There were statistically significant differences regarding the median age of pregnant women, Household Wealth Index and food taboo between the two groups. The median age of the HD and LD groups subjects was 29(23·5–34) and 27(22–32), respectively (P-value 0.013). Almost half of the pregnant women in the HD group (43·3 %) were in the ‘Middle’ wealth index, while almost half of the pregnant women in the LD group (43·6 %) were in the ‘Rich’ wealth index (see Table 1).
Socio-demographic characteristics and nutritional status of pregnant women in high- and low-availability vitamin D-rich fish areas

Abbreviations: HD, high availability of vitamin D-rich fish area; LD, low availability of vitamin D-rich fish area.
* Significance was tested for median rank differences between respondents in high- and low-availability vitamin D-rich fish area.
† Household wealth index was divided into tertile, poor is the lowest income, middle is the middle income and rich is the highest income.
‡ Significance was tested by the Mann–Whitney U test.
§ Significance was tested by the Chi-square test.
|| Significance was tested by the Fisher’s exact test.
¶ n 428.
** Nutritional status was determined by mid-upper arm circumference (MUAC), MUAC less than 23·5 cm was categorised as chronic energy deficiency, n 430.
Most pregnant women (66·7 %) reported any food taboos during their pregnancy, with 15·2 % reported taboo for fish during pregnancy. Food taboos are cultural restrictions on consuming specific, even nutritious foods due to beliefs (often misconceptions) about how specific foods may harm their pregnancy, which is often transmitted down the generations and becomes normative in the community(Reference Tela, Gebremariam and Beyene34,Reference Mohammed, Taye and Larijani44) . Food taboos were more commonly reported in the LD group than in the HD group (P = 0·025). However, the kind of food being avoided did not differ between the two groups.
Most of the subjects were not working (74·3 %) and had educational levels in high school and above (51·3 %). There were no significant differences in educational level and working status between pregnant women in the HD and LD groups (P > 0·05). This current study found that the prevalence of CED was 14·7 %. The prevalence of CED in the LD group (15·5 %) was not significantly different than in the HD group (13·9 %) (P = 0·643).
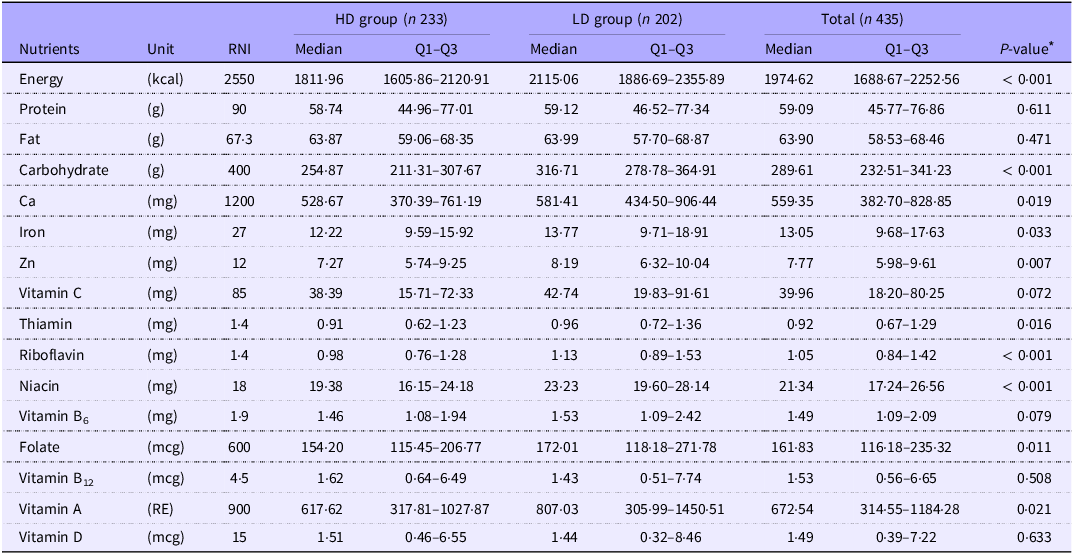
Energy and nutrient intake
The average daily energy intake among participants was 1854 (sd 499) kcal/d (See Table 2). The mean ratio of reported EI/BMR was 1·26 (sd 0·37). Based on EI/BMR classification, 85·51 % of respondents had a plausible energy intake (EI/BMR between 0·91 and 2·49).
Actual energy and nutrient intakes among pregnant women in high- and low-availability vitamin D-rich fish area

Abbreviations: RNI, recommended nutrients intake; HD, high availability of vitamin D-rich fish area; LD, low availability of vitamin D-rich fish area.
* Significance was tested using Mann–Whitney U test.
There were several differences in actual nutrient intake between pregnant women in the HD and LD groups. Compared with pregnant women in the HD group, pregnant women in the LD group had significantly higher median intakes of energy, carbohydrate, Ca, Fe, Zn, thiamine, riboflavin, niacin, folate and vitamin A (P < 0·05).
Regression analysis revealed that there was no significant association between the respondent’s proximity to the market and their vitamin D intakes (β = 0·000, P = 0·389). These results indicate that fish availability alone may not fully explain vitamin D intake patterns.
Food patterns
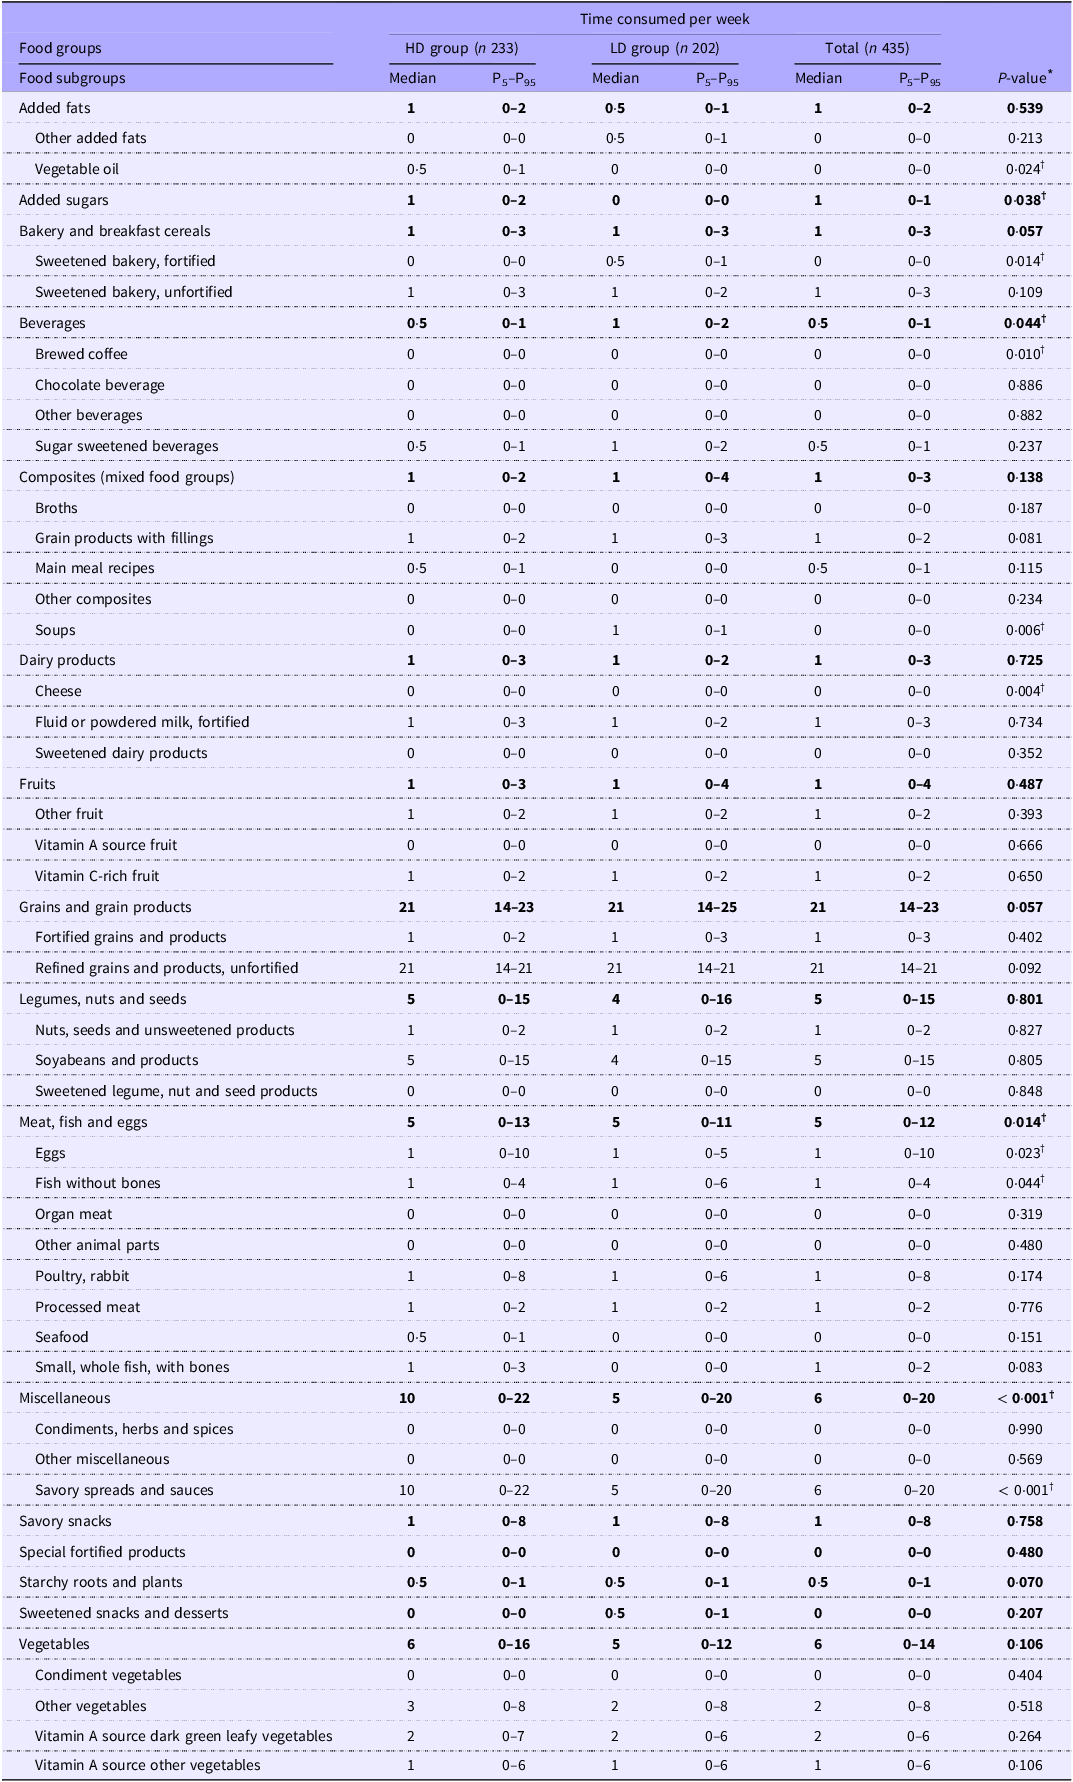
Including nutrient-dense food and food consumed by ≥ 5 % of the population, 138 and 140 food items were identified among pregnant women in the HD and LD groups, respectively. Combining food items from the two groups resulted in 163 food items, which consisted of sixteen food groups and forty-five food subgroups. Table 3 shows the weekly frequency of food groups and subgroups consumption patterns.
Weekly food frequency among pregnant women in high- and low-availability vitamin D-rich fish area

Abbreviations: HD, high availability of vitamin D-rich fish area; LD, low availability of vitamin D-rich fish area.
Values at the food group level are presented in boldface.
* Significance was tested for mean rank difference of food frequency between pregnant women in high and low availability of vitamin D-rich fish area.
† Mann–Whitney U test with significance value P < 0·05.
On average, grains and grain products, vegetables and miscellaneous were the most common food groups consumed in both groups (median: 21, 6 and 6 times per week). Detailed analysis at the food-item level showed that, white rice, fried tempeh and sambal terasi (shrimp paste chili sauce) were the most common foods consumed by subjects. This was the typical food pattern of the Indonesian population(Reference Jati, Vadivel and Nöhr45).
Based on the respondents’ group, there were several significant differences in the weekly frequency of food group and food subgroup consumption between pregnant women in the HD and LD groups. Pregnant women in the HD group consumed higher miscellaneous food groups (median: 10 and 5 times per week in the HD and LD groups, respectively; P < 0·001). The food items added during cooking or at the table as a seasoning were grouped as miscellaneous food groups, consisting of condiments, herbs, spices, savory and sweet sauces. The most common miscellaneous consumed by the subjects were sambal terasi and sambal bawang (shallot chili sauce), with a participation rate of 48 % and 42 %, respectively, in the HD group and 38 % and 36 %, respectively, in the LD group.
In terms of animal-source food consumption, the median times consumed per week were similar (5 times per week). However, pregnant women in the HD group had a higher maximum frequency of weekly animal-source food consumption (95th percentile: 13 and 11 times per week in the HD and LD groups, respectively; P = 0014). The median time consumed was the average pattern of the population. The 95th percentile represents the group’s upper food pattern; it could be mentioned as a positive deviant version.
The higher 95th percentile of animal food sources consumed by the pregnant women in the HD group could be due to the more specific food sources available in the HD group than in the LD group. Detailed analysis of food subgroups showed that the weekly frequency of eggs and fish without bones consumption were significantly different (95th percentile: 10 and 5 times per week in the HD and LD groups, respectively; P = 0·023 for eggs; 4 and 6 times per week in HD and LD group, respectively; P = 0·044 for fish without bones).
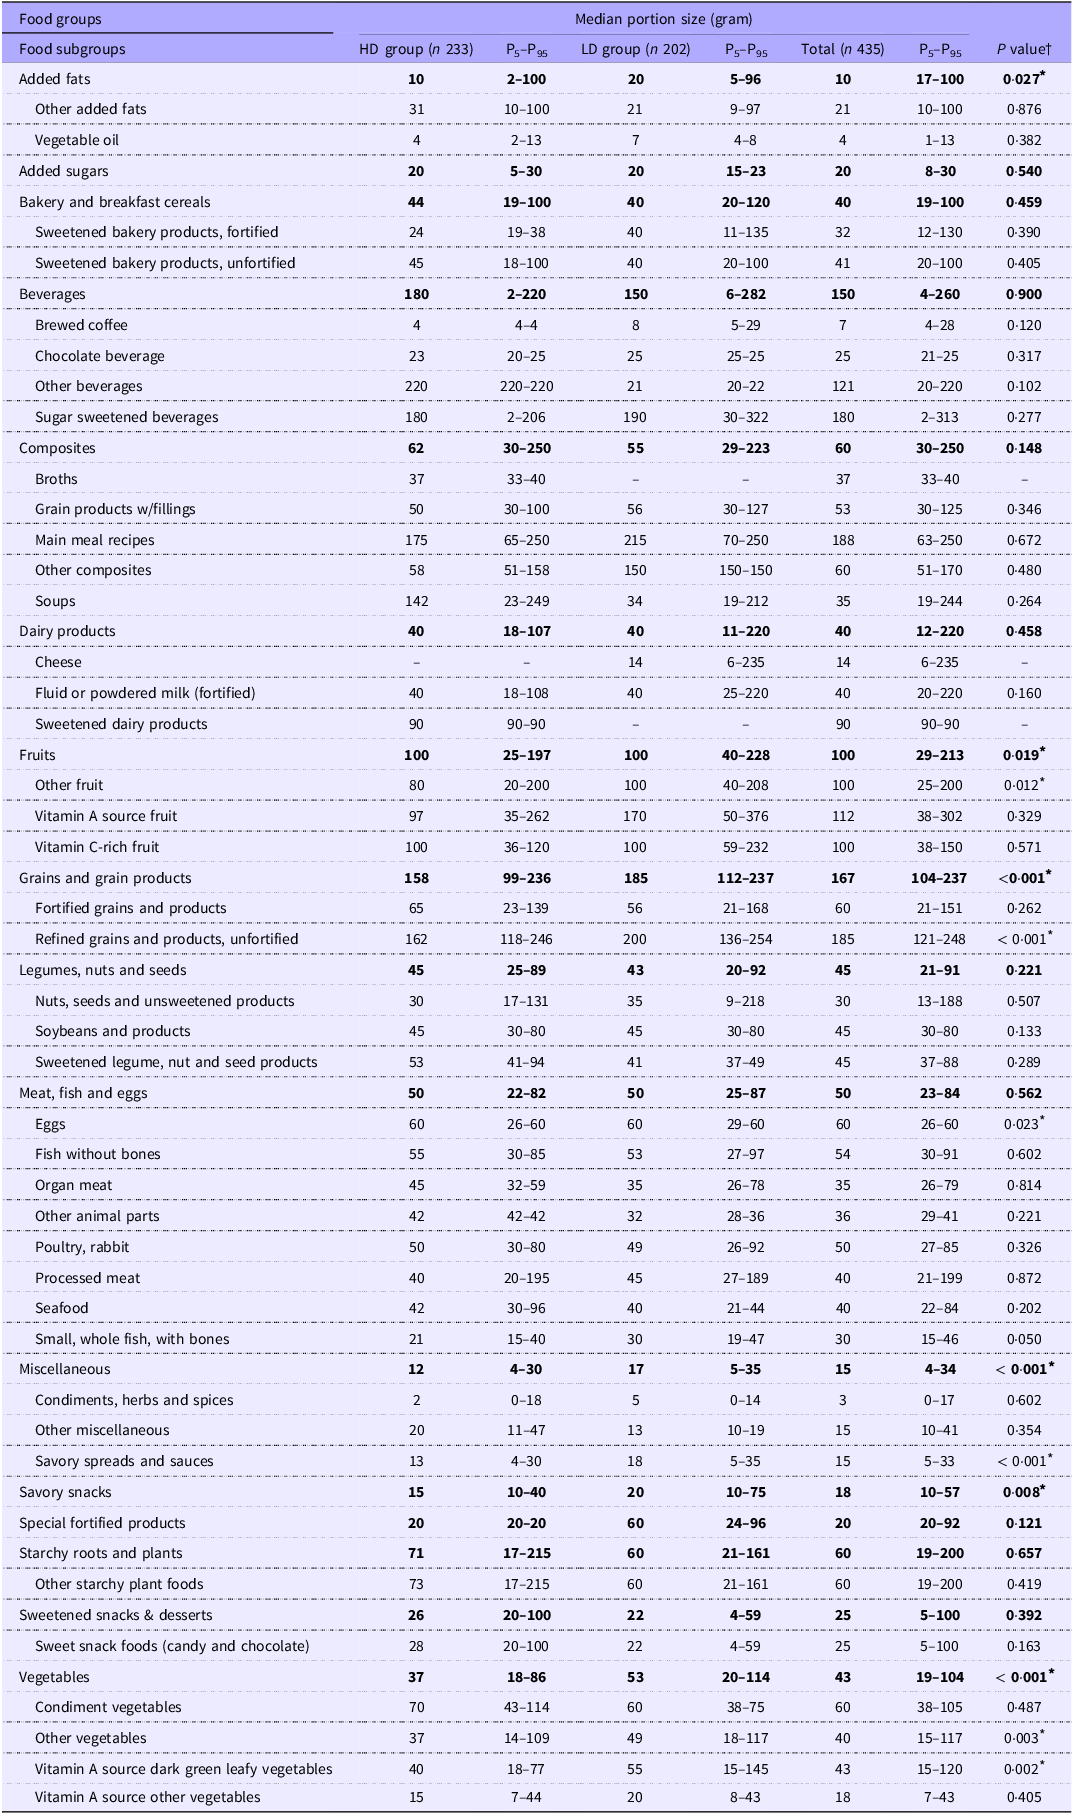
Pregnant women in the LD group tend to consume higher portions of added fats, fruits, grains and grain products, eggs, miscellaneous, savory snacks and vegetables (P < 0·05) (Table 4). Regarding fruit consumption, the median portion in the two groups was similar (100 g). However, the 5th and 95th percentiles were higher in the LD group than in the HD group. Comparable to egg consumption, the median portion was similar (60 g). However, the 5th percentile was higher in the LD group compared to the HD group (Table 4).
Portion sizes of foods consumed by pregnant women in high- and low-availability vitamin D-rich fish area

Abbreviations: HD, high availability of vitamin D-rich fish area; LD, low availability of vitamin D-rich fish area.
Values at the food group level are presented in boldface.
* Significance was tested for mean rank difference of food frequency between pregnant women in high and low availability of vitamin D-rich fish area.
† Mann–Whitney U test with significance value P < 0·05.
Problem nutrients and food-based recommendations
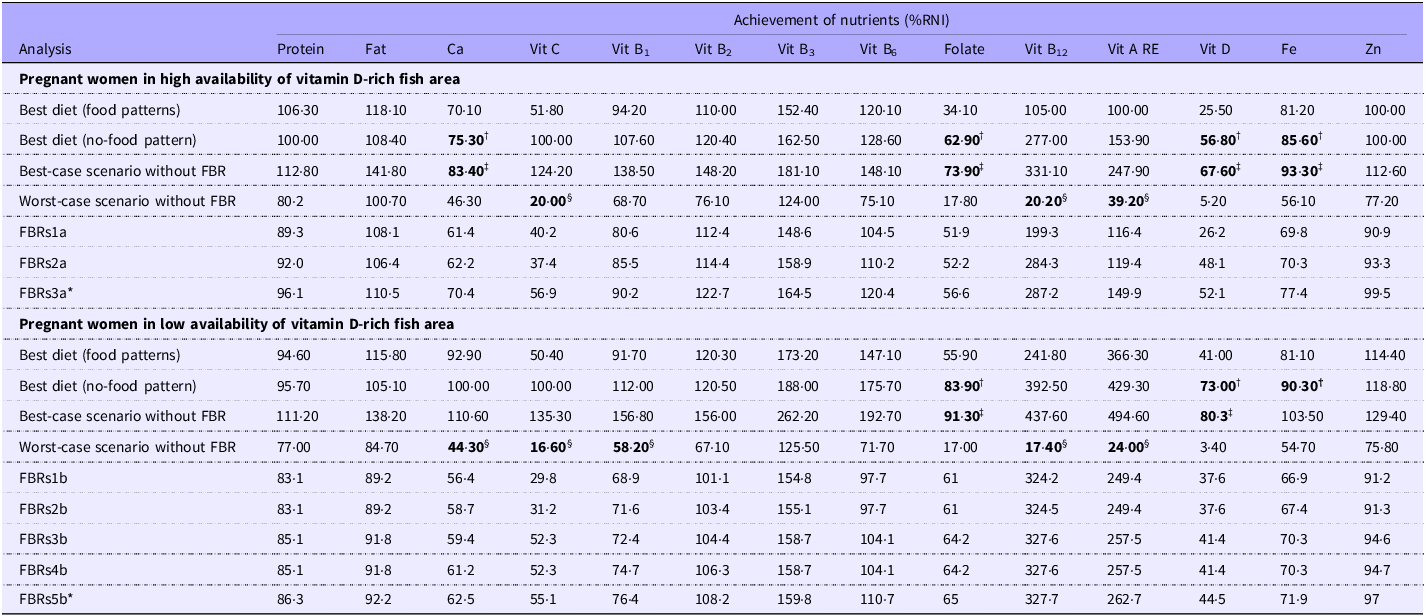
The two best diets formulated in module II showed that problem nutrients among pregnant women in the HD group were Ca, folate, vitamin D and Fe. Those four nutrients were absolute problem nutrients as they fell below 100 % RNI in the best-case scenario diet without FBR (see Table 5). Meanwhile, vitamin C, vitamin B12 and vitamin A were characterised as dietary inadequacy, given that they could not achieve 65 % of RNI in the worst-case scenario without FBR.
Comparison of nutrient levels of the two best diets (module II), worst-case and best-case scenario diets without FBR (module III) among pregnant women in high- and low-availability vitamin D-rich fish area

Abbreviations: RNI, recommended nutrient intake; FBR, food-based recommendations; Vit, vitamin.
† Bold in best diet (no-food pattern) refers to problem nutrient, which is model achievement could not meet 100 % RNI.
‡ Bold in best-case scenario refers to absolute problem nutrient, which is maximized scenario could not meet 100 % RNI.
§ Bold in Worst-case scenario refers to dietary inadequacy, which is minimized scenario could not meet 65 % RNI.
FBRs1a: MFP12, Egg2, Poultry3, Fish4, Smallfish2, Organ1 – Veg14, DGLV7 – Fruit3, VitCfruit2.
FBRs2a: MFP12, Egg2, Poultry3, Fish4, Smallfish2, Organ1 – Veg14, DGLV7 – Fish4, Mackereltuna2, Balisardinella1.
FBRs3a*: MFP12, Egg2, Poultry3, Fish4, Smallfish2, Organ1 – Veg14, DGLV7 – Fruit3, VitCfruit2 – Fish4, Mackereltuna2, Balisardinella1 – FortifMilk2 (selected FBR).
FBRs1b: Legumes11, Soybean7 – Veg12, DGLV6 – MFP10, Fish6, Smallfish1, Liver2 – Mackereltuna2.
FBRs2b: Legumes11, Soybean7 – Veg12, DGLV6 – Fortifiedmilk2 – MFP10, Fish6, Smallfish1, Liver2 – Mackereltuna2.
FBRs3b: Veg12, DGLV6 – Fruit4, VitCfruit2, VitAfruit1 – MFP10, Fish6, Smallfish1, Liver2 – Mackereltuna2.
FBRs4b: Veg12, DGLV6 – Fruit4, VitCfruit2, VitAfruit1 – Fortifiedmilk2 – MFP10, Fish6, Smallfish1, Liver2 – Mackereltuna2.
FBRs5b*: Veg12, DGLV6 – Fruit4, VitCfruit2, VitAfruit1 – Fortifiedmilk2 – MFP10, Fish6, Smallfish1, Liver2 – Mackereltuna2 – Tilapia1 (selected FBR).
Food-based recommendations formulated for pregnant women in high and low availability of vitamin D-rich fish area

Nearly identical, the identified problem nutrients among pregnant women in the LD group were folate, vitamin D and Fe. All problem nutrients were absolute problem nutrients, except for Fe, which was classified as partial problem nutrients (see Table 5). Meanwhile, Ca, vitamin C, vitamin B1, vitamin B12 and vitamin A were characterised as dietary inadequacy.
The potential nutrient-dense food subgroups that could be promoted to achieve dietary adequacy were unfortified refined grains and products, soybeans and products, organ meat, fortified special biscuits, fortified fluid or powdered milk, fish without bones, vitamin A source dark green leafy vegetables and savoury spreads and sauces. Tempeh, moringa leaves, fortified biscuits, fortified powder milk and fresh skipjack tuna fish were identified as potential nutrient-dense food sources. These food subgroups and food items were used either separately or combined with other foods to establish the optimised FBR alternatives in Module III.
In Module III, twenty-six sets of FBR were produced for pregnant women in the HD group, and forty-one sets of FBR were produced for pregnant women in the LD group (online Supplementary 2). Among those alternative FBRs, three sets of FBRs for pregnant women in the HD group and five sets of FBRs for pregnant women in the LD group are presented in Table 5. Using the LP approach, the final FBR could achieve the recommended intake of Ca, vitamin B1, B2, B3, B6, B12, vitamin A, Fe and Zn for pregnant women in the HD group. While for pregnant women in the LD group, the final FBR could achieve the recommended intake of vitamin B1, B2, B3, B6, B12, folate, vitamin A, Fe and Zn. However, the optimised FBR could not achieve ≥ 65 % RNI of vitamin C, vitamin D and folate in the HD group and vitamin C, vitamin D and Ca in the LD group. Table 6 shows the final FBR formulated to improve the intake of problem nutrients identified among pregnant women in high and low availability of vitamin D-rich fish area.
Discussion
This study was the first to map the availability of vitamin D-rich fish and analyse the different dietary patterns among pregnant women in different areas. Despite the difference in availability, we found in both groups very low vitamin D intake. Our finding highlighted the importance of specifying the vitamin D rich fish in nutrition messages to meet vitamin D adequacy in pregnant women.
In this study, the study area was categorised as having high or low availability of vitamin D-rich fish based on market survey data rather than simple geographic proximity to coastal areas. Our market data indicated significant variation in the actual availability of marine fish species high in vitamin D. This classification is further supported by our diet modelling results, which recommend sea fish consumption in high-availability areas (nearby HD markets) and freshwater fish in low-availability areas (nearby LD markets).
A study among pregnant women in mountainous and coastal populations in southern China reported that vegetables formed the main part of the diet of pregnant women in mountainous areas, whilst pregnant women in coastal areas more frequently consumed food derived from animals, especially seafood and fish(Reference Zhang, Yi and Fang46). These findings are similar to our population, where vegetables were the main part of the diet (median weekly consumption 5 and 6 times per week in LD and HD groups, respectively). Despite living in an island surrounded by the sea, in our study, fish was only consumed by 15 % and 12 % of the pregnant women in LD and HD, respectively), with the maximum weekly frequency of fish consumption being 6 and 4 times per week in the LD and HD groups, respectively.
In terms of vitamin D intake, in addition to the very low median intake of vitamin D (1·49 µg), there was no significant difference in vitamin D intake between pregnant women in the HD and LD groups. This result suggests that simply having greater market availability of vitamin D-rich fish does not necessarily translate into higher consumption. This result was in line with a systematic review that found that availability alone was not a key determinant of dietary intake(Reference Govzman, Looby and Wang47). One possible explanation is that fish consumption is influenced by affordability and personal dietary preferences rather than mere availability. Even in high-availability areas, socioeconomic factors may limit access to fish. A study conducted in New South Wales, Australia, explored pregnant women’s perceptions of consuming fish and seafood during pregnancy. It was found that fish, particularly fresh fish, was perceived as being expensive, and this was a barrier to more frequent consumption(Reference Lucas, Starling and McMahon48). In our study, the food environment analysis in the same population (will be published elsewhere) examined the constraints to afford fish. According to the food environment questionnaire administered to mothers of children aged 18–24 months (n 300), the most common barriers to obtaining sea fish were availability (41 % of respondents), affordability (22 %) and hygiene concerns (14 %).
In the study area, the potential confounding factor was the presence of mobile vendors, who helped distribute vitamin D-rich fish to respondents living far from the markets with high fish availability. This suggests that mobile vendors can contribute to increasing access to fish, making them an important potential confounding factor in the study.
Our analysis showed that the consumption of fish without bones as major vitamin D food sources was higher in the LD group. This result was contrary to the initial hypothesis, which expected fish without bones consumption to be higher among pregnant women in the HD group. The result of this study was also contrary to the study among pregnant women in West Sumatra, which reported that maternal vitamin D intake was associated with place of residence. Those women who lived in areas with limited fish as a common vitamin D food source had less adequate vitamin D intake than those who lived in areas with abundant fish(Reference Aji, Yerizel and Desmawati49). However, that study did not use any method to assess the availability of fish and only divided the place of residence based on the altitude of the area, i.e. area with altitudes of 0–15 m above sea level was identified as area with abundant fish.
The mean energy intake in this study was 1854 (sd 499) kcal/d. The ratio of reported EI/BMR was 1·26 (sd 0·37) (mean (standard deviation)). Underreporting (EI/BMR < 0·9) was observed in 14·0 % of respondents. The findings from our study were comparable to previous research among pregnant women in Indonesia reported by Winkvist et al. in which 17·6 % of pregnant women in 3rd trimester had underreported energy intake, which is a common challenge in dietary assessment studies(Reference Winkvist, Persson and Hartini50). The mean energy intake in these studies was slightly higher at 1968 (sd 484) kcal/d(Reference Persson, Winkvist and Ninuk51), with a higher EI/BMR ratio of 1·52 (sd 0·40). Generally, the percentage of underreporting in pregnant women was about 16–45 % according to the available literature, depending on the population and assessment method(Reference McGowan and McAuliffe52,Reference Nowicki, Siega-Riz and Herring53) .
The inadequate intake of energy and nutrients among pregnant women in this study may be influenced by cultural food restrictions, limited nutritional knowledge and economic constraints, which are known barriers to achieving adequate dietary intake during pregnancy. This aligns with findings from a meta-analysis, which reported that the intake of energy, macronutrients, Ca, Fe, vitamin C and vitamin D among Indonesian pregnant women did not meet national recommendations(Reference Agustina, Rianda and Lasepa54). The existence of food taboos among pregnant women regarding certain foods may hinder the consumption of these foods and increase the risk of inadequate nutrient intakes(Reference McNamara and Wood55–Reference Chahyanto and Wulansari57). It was believed that these foods caused complications and difficulties during delivery(Reference Diana, Rachmayanti and Anwar58).
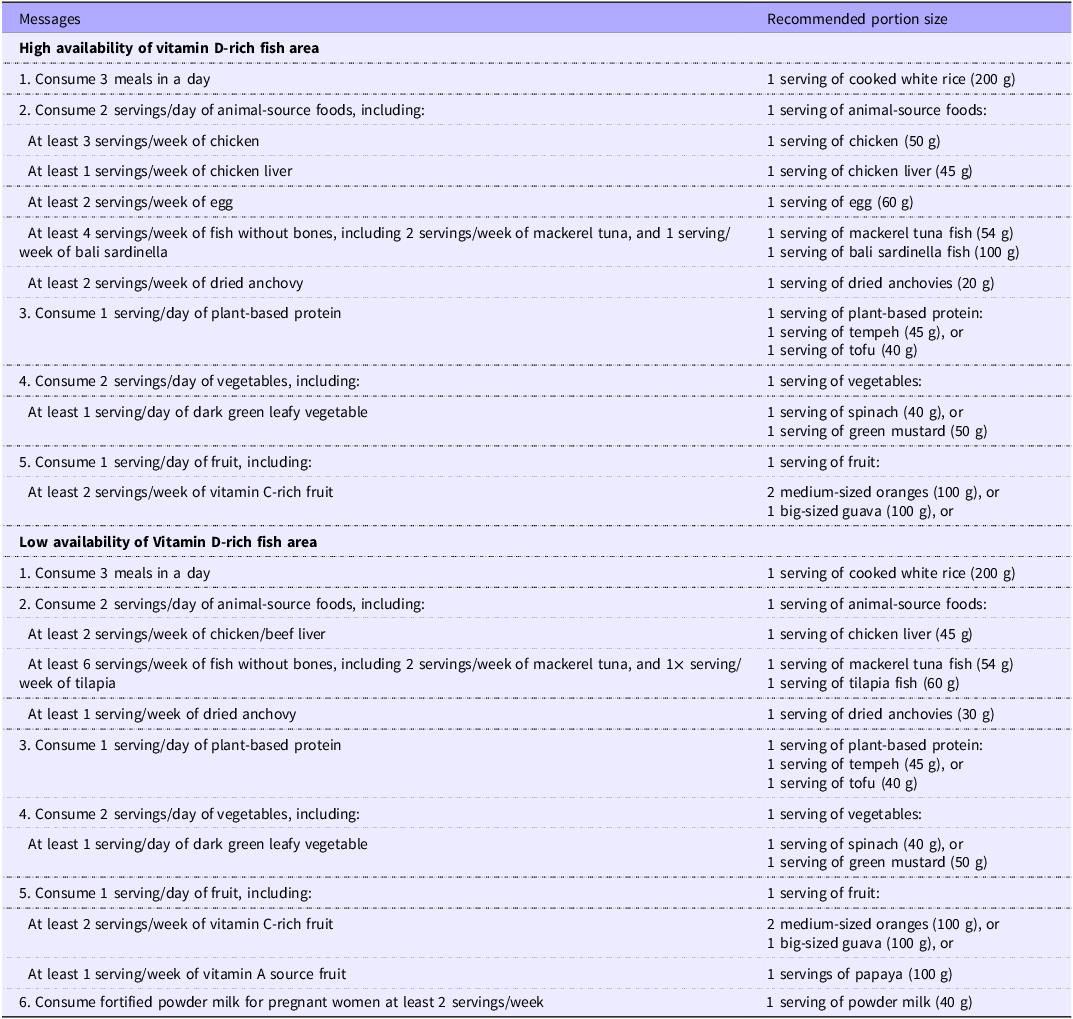
Results showed that if optimised, modelled diets could improve the intakes of problem nutrients from about 3–5 % RNI (nonoptimised diets) to 40–50 % RNI, or about 10-fold increase, by including local sea fish and small fish with bones. The observed vitamin D nutrient gap was lower among pregnant women in the HD group compared with pregnant women in the LD group (12·9 % RNI in the HD group and 20·5 % RNI in the LD group). This could explain why, when modelled diets were optimised, the HD group could consume more vitamin D-rich foods compared with the LD group. Nevertheless, diet modelling can help to identify vitamin D-rich fish and other nutritious foods to promote in FBR to increase vitamin D intake. The FBR from this study provide specific messages that help clarify and enhance the balanced food guidelines issued by the Ministry of Health in Indonesia.
The developed FBR in the HD and LD groups differ in recommendation of fish and other animal-source foods. In the HD group, the consumption of animal-source foods was more varied. The final FBR for pregnant women in the HD group recommend consuming four servings/week of fish. The recommendations included two servings/week of mackerel tuna fish and one serving/week of bali sardinella fish. The final FBR for pregnant women in the LD group recommend consuming six servings/week of fish, including two servings/per week of mackerel tuna fish and one serving/per week of tilapia fish. Bali sardinella fish is a seawater fish that is highly available in the markets in the HD group, while tilapia fish is a freshwater fish that is highly available in the LD group area. The vitamin D content in mackerel tuna, bali sardinella and tilapia fish is 18·27, 7·63 and 8·43 µg per 100 g of fish, and the addition of recommendation of fish in the FBR increases the achievement of vitamin D RNI into 33·3 % and 30·1 % in the HD and LD groups, respectively.
Comparatively, the study of FBR development for the general population in the Netherlands generated four scenarios to optimise vitamin D intake. The linear modelling program Optimeal® 2·0 (Blonk Consultants, Gouda, the Netherlands) was used to model scenarios of dietary shifts in that study. The modelling relied on vitamin D-fortified bread, milk and oil, along with increases in fish consumption. Its baseline diet consisted of 3 µg/d of vitamin D per 2000 kcal or 21 % of RNI. With the actual dietary pattern, achieving 13·4 µg/d of vitamin D was not possible unless the calorie consumption was increased twofold. The authors stated that it is impossible to obtain adequate vitamin D unless more vitamin D-fortified foods are a necessary part of the diet. The modelling shows that the addition of fish increased vitamin D by 22-fold from baseline, whereas inclusion of fortified bread and breakfast cereals increased vitamin D by 170-fold(Reference Bruins and Létinois59). This was similar to our findings, with the baseline median vitamin D intake of 1·49 µg/d or 10 % of RNI, the diet modelling with fish can only meet half of the RNI, which are 52·1 % and 44·5 %RNI in HD and LD groups, respectively.
While our mapping categorised markets based on availability of vitamin D rich fish, it is also important to note that fish especially small fish with bone is rich in Ca. Our LP analysis suggests that HD group had better improvement in meeting dietary adequacy as compared with LD group. Ca was initially a problem nutrient in the HD group but became dietary adequate in the optimised FBR (minimised %RNI was above 65 %, i.e. 70·4 %). On the other hand, Ca was dietary inadequacy in the LD group and remained inadequate in the optimised FBR (minimised %RNI was still below 65 %, i.e. 62·5 %). By promoting more consumption of fish in the optimised FBR, %RNI in the minimised scenario increased, i.e. from 46·3 % to 70·4 % in HD and from 44·3 % to 62·5 % in LD. Previous study (Knight et al. 2023) used WHO Optifood to assess whether local foods including small fish could meet Ca intake among nonpregnant and non-breast-feeding women of reproductive age in Uganda, Bangladesh and Guatemala. The final set of FBRs can achieve 47·7–143·5 % of Ca population reference intakes in the Module III minimised Ca diets(Reference Knight, Rana and Cormick60).
Small fish with bones tended to be more frequently consumed in HD group but in smaller portions than in the LD group. This was due to varied animal-source foods being available in the HD area compared with the LD area. While the study area is not in extremely mountainous or coastal regions, the high availability of fish also indicates a good distribution of other protein food sources. Dried anchovy is one of the food items in the small, whole fish, with bones food subgroup that was identified as Ca-dense food in this population. Dried anchovy was highly available in both groups; however, the median portion size of this food was higher among pregnant women in the LD group. Based on the results of trials of improved practices, which were conducted as part of this study to assess food preferences, dried anchovy was perceived as an ‘inferior’ animal-source food compared with fresh fish, chicken, beef and eggs. This perception was primarily influenced by food preference, where dried anchovy was a less desirable option despite its affordability and nutritional value. Our findings suggest that high fish availability does not always lead to high consumption.
Despite improvements of vitamin D intake in the optimised FBR, the gaps in problem nutrients remain, i.e. 12·9 % in HD and 20·5 % in LD. Development of nutrient-dense food, such as chilli sauce mixed with fish, fish balls or fish crackers, could be an option to improve vitamin D intake in the population. These nutrient gaps for vitamin D correspond to intakes of multiple micronutrient supplements (containing 33·3 % RNI for vitamin D) of 3 d/week and 5 d/week for HD and LD groups, respectively. Policymakers should consider these strategies in combination with food-based approaches to ensure adequate nutrient coverage.
To the best of our knowledge, this is the first study to develop fish availability mapping using geospatial analysis and develop FBRs to promote adequate vitamin D intake among pregnant women. The development of fish availability mapping ensures that the developed FBRs are in line with food availability and would not require drastic changes to acquire the food items.
Some limitations were identified in this study. First, the Geographic Information System mapping, while assessing the distance between respondents’ houses and markets, did not take into account the geographic features that may affect access to markets.
Second, socioeconomic differences between the two groups could introduce potential bias or confounding. Households with higher socio-economic status may have greater access to diverse and nutrient-rich foods. Studies have found that energy and protein intakes among pregnant women decreased along with decreasing economic quintiles(Reference Madanijah, Briawan and Rimbawan61).
This study focuses on food availability and food intake but does not account for economic access to food. As a result, factors such as food affordability and financial constraints that may influence food choices and consumption patterns were not considered. This limitation may affect the comprehensiveness of the findings, as economic access plays a crucial role in determining dietary intake.
The absence of mobile vendors in the analysis of this study also becomes one of its limitations. Mobile vendors were identified as one of the ways to acquire food among populations. However, due to the logistical challenges of tracking mobile vendors, their influence on food availability was not included in the initial design. Their exclusion may have led to an underestimation of vitamin D-rich fish availability, particularly in more remote areas. Moreover, nonmarket-based food sources were also found to be important in some settings in low-middle-income countries, which were not analysed in this current study.
In conclusion, in both high- and low-availability fish area, vitamin D was inadequate in the diet of pregnant women and was identified as problem nutrient. While both groups’ FBRs ensure adequacy of Fe, Zn, vitamins A, B1, B2, B3, B6 and B12, Ca remains as dietary inadequacy in the LD group, suggesting that availability plays a role in ensuring dietary adequacy. Future studies to develop nutrient-dense recipes, explore the best practice of vitamin D supplementation among pregnant women, as well as explore new methods for fish availability mapping, which consider non-static position of market (mobile vendor), are recommended. Future studies can also incorporate economic factors to provide a more holistic understanding of the relationship between food availability, accessibility and consumption.
Supplementary material
For supplementary material/s referred to in this article, please visit https://doi.org/10.1017/S0007114525000893
Acknowledgments
The authors are grateful to the enumerators, village midwives, cadres and respondents for their participation in this study.
This study was funded by the United Kingdom Research and Innovation Global Challenges Research Fund (UKRI CGRF, grant number MR/S01313X/1). The authors would like to thank the Indonesia Endowment Fund for Education (LPDP) from the Ministry of Finance Republic Indonesia for granting the scholarship and supporting this research.
C.D.H contributed to method, analysis, interpretation, visualization, drafting the manuscript. D.I contributed to method, analysis, interpretation, as resource and software support, supervision, manuscript reviewing. N.L.Z contributed to data curation, analysis, interpretation, manuscript reviewing. D.N.C contributed to method, interpretation, manuscript reviewing. M.K.H contributed to method, data curation, interpretation, project administration, supervision, manuscript reviewing. U.F contributed to conceptualization, method, analysis, interpretation, as resource and support for software, project administration, supervision, manuscript drafting, reviewing and funding acquisition.
The authors declare that there are no conflicts of interest.
Ethical clearances were obtained from Ethical Review Committee, Faculty of Medicine, Universitas Indonesia – Dr. Cipto Mangunkusumo General Hospital (FMUI-RSCM) (Reference Number: ND-914/UN2.F1/ETIK/PPM.00.02/2021) and the Ethical Review Committee, Faculty of Medicine, Universitas Mataram (Reference Number: 221/UN18.F7/ETIK/2022).