


Non-technical Summary
Fossil pollen analysis presents challenges that result from the complexity of the “open world.” It is not possible to anticipate all the taxa that will be encountered in geologic samples. Each sample has the potential to produce new species and introduce specimens with unique shapes and sizes. Pollen embodies diverse morphologies; its appearance can be altered depending on the conditions under which it was fossilized; and there is little standardization in the microscopy equipment used to image and catalog pollen images. AI applications in palynology need to address this complexity. We applied four machine learning methods (mixture-of-expert models, domain fine-tuning, continual learning, and foundation models for segmentation) to fossil pollen data to demonstrate their effectiveness in the detection and isolation of pollen specimens on a pollen sample slide and provide command line software for others to reproduce this work and apply these methods.
Introduction
Fossil pollen analysis represents a paleontological example of an “open-world” problem. The term “open world” describes uncontrolled operational environments in machine learning (Bendale and Boult Reference Bendale and Boult2015; Liu et al. Reference Liu, Miao, Zhan, Wang, Gong and Yu2019; Joseph et al. Reference Joseph, Khan, Khan and Balasubramanian2021). It stands in contrast to classic supervised learning, where all the test classes are known and have been introduced in training. The data collected by pollen analysis—like data from many other fields of paleontology—cannot be fully anticipated and modeled a priori. Specimens often represent new, extinct, and/or undiscovered species. Species abundances (sensu May Reference May, Cody and Diamond1975) naturally follow an imbalanced or long-tailed distribution, where a small number of taxa are common, while many others are rare. Images of the same taxon can vary widely, depending on the microscope, magnification, and imaging or preparation techniques. Specimens can have variable levels of preservation from sample to sample and locality to locality. Given the high level of expertise and time required for traditional pollen identifications, researchers have long sought to develop automated detection and classification pipelines for pollen specimens (Langford et al. Reference Langford, Taylor and Flenley1990). However, developing machine learning models that can generalize across the range of variability in pollen diversity, abundance, preservation, preparation, and imaging requires adopting workflows that can succeed in open-world environments.
Fossil pollen isolated from geologic sediments for paleoecological or biostratigraphic analysis are typically mounted on microscope slides (Traverse Reference Traverse2007). The first step in any automated classification process is streamlining the imaging of microscopic slides of pollen samples and detecting and segmenting pollen specimens from these scanned images. The widespread availability of slide-scanning microscopes means that entire slides can be imaged quickly and efficiently (Tetard et al. Reference Tetard, Marchant, Cortese, Gally, de Garidel-Thoron and Beaufort2020; Punyasena et al. Reference Punyasena, Haselhorst, Kong, Fowlkes and Moreno2022; Theuerkauf et al. Reference Theuerkauf, Siradze and Gillert2023; Li et al. Reference Li, Cheng, Xu, Zhao, Liu, Gao, Ye and You2024; von Allmen et al. Reference von Allmen, Brugger, Schleicher, Rey, Gobet, Mustaphi, Tinner and Heiri2024; Jaramillo et al. Reference Jaramillo, Punyasena, de Alba, Bermudez, Caballero, Cardenas and Caro2025). These scans are capable of capturing the entirety of a pollen slide—both the area of a coverslip and multiple focal planes—producing a fully three-dimensional representation of the pollen sample (Punyasena et al. Reference Punyasena, Haselhorst, Kong, Fowlkes and Moreno2022).
Accurate, consistent detection of pollen among other organic debris in these slide scans is a critical step in automating visual pollen identifications. It can be followed by segmentation to isolate the grain from its background. The final step is classification into morphological or taxonomic groupings. While an increasing number of studies have shown that classification is feasible with enough training data (Sevillano and Aznarte Reference Sevillano and Aznarte2018; de Geus et al. Reference de Geus, Barcelos, Batista and da Silva2019; Menad et al. Reference Menad, Ben-Naoum and Amine2019; Astolfi et al. Reference Astolfi, Gonçalves, Menezes, Borges, Astolfi, Matsubara, Alvarez and Pistori2020; Bourel et al. Reference Bourel, Marchant, de Garidel-Thoron, Tetard, Barboni, Gally and Beaufort2020; Sevillano et al. Reference Sevillano, Holt and Aznarte2020; Barnes et al. Reference Barnes, Power, Barber, Tennant, Jones, Lee and Hatton2023; Rostami et al. Reference Rostami, Balmaki, Dyer, Allen, Sallam and Frontalini2023), training effective detection and segmentation models remains a challenge due to the taxonomic, taphonomic, imaging, and preparation diversity within palynology. Detection in this context refers to the automated location of a pollen specimen within the X, Y, and Z coordinates of a slide scan. Segmentation refers to isolation of the detected specimen from the background. Detection is needed at two discrete stages of automated workflows. Experts can label detected pollen grains to efficiently produce training and validation data for the development of pollen classification models. Detection is also needed when applying these classification models to new samples.
We demonstrate four machine learning solutions for addressing common limitations in automated pollen detection and segmentation. Taken together, these approaches provide effective strategies for constructing robust, generalized detection models that can be applied to a wide range of palynomorphs and other paleobiological data. We first focus on detecting pollen specimens from a scanned image of a microscope slide and demonstrate how the mixture-of-experts technique can address taxonomic bias. The morphological diversity and long tail of rare species encountered in pollen samples, particularly those from the tropics, lead to detectors that are potentially biased toward the most common and distinctive morphological types. False negatives (pollen that is missed by the detector) pose a greater problem than false positives (non-pollen objects identified as pollen by the detector), as false positives can be removed at a later stage of the analysis, while bias toward false negatives will affect downstream estimates of proportional abundance. The solution is to train an expert model on small, difficult-to-detect taxa and fuse it with a more general pollen detector. This technique is used frequently in top-ranked detection methods in public machine learning challenges (Akiba et al. Reference Akiba, Kerola, Niitani, Ogawa, Sano and Suzuki2018; Guo et al. Reference Guo, Cui, Du, Meng, Wang, Liu, Zhu, Feng and Han2019; Huang et al. Reference Huang, Chen, Li, Zhang and Wang2020).
We next demonstrate how fine-tuning can be a data-efficient method for transfer learning across new imaging domains. Differences among pollen samples or images result from differences in the microscopes and objectives used, localities or ages represented, or preparation techniques applied. Detection models trained in one domain will have reduced accuracy when applied to a new domain due to differences in color, brightness, and resolution, or the taxonomic or taphonomic differences between samples. Fine-tuning previously trained models with training data from a new domain can quickly produce more generalized models. This approach is widely used in machine learning (for reviews, see Pan and Yang Reference Pan and Yang2010; Zhuang et al. Reference Zhuang, Qi, Duan, Xi, Zhu, Zhu, Xiong and He2020).
Next, we show how workflows for continual learning using human-in-the-loop annotation can address the problem of incomplete training data for pollen detection. In fossil pollen analysis, as in many other areas of paleobiological research, there is a high probability of encountering new taxa with each new sample. We inevitably begin with insufficient training data because it is not possible to curate images of all possible types. Incorporating expert feedback through human-in-the-loop annotation leverages trained models to annotate new, unlabeled data. Experts verify or revise low-confidence detections, and these new annotations are used to further fine-tune detection or classification models (Zhou et al. Reference Zhou, Shin, Zhang, Gurudu, Gotway and Liang2017; Wang et al. Reference Wang, Yang, Ma, Xu, Zhong, Deng and Gao2020; Adhikari and Huttunen Reference Adhikari and Huttunen2021; Wu et al. Reference Wu, Xiao, Sun, Zhang, Ma and He2022; Kirillov et al. Reference Kirillov, Mintun, Ravi, Mao, Rolland, Gustafson, Xiao, Whitehead, Berg, Lo, Dollár and Girshick2023). This approach provides an efficient mechanism for improving pollen detection (as well as pollen classification) models over time.
Finally, we demonstrate how newly available foundation segmentation models (Meta’s Segment Anything Model 2 [SAM-2]; Kirillov et al. Reference Kirillov, Mintun, Ravi, Mao, Rolland, Gustafson, Xiao, Whitehead, Berg, Lo, Dollár and Girshick2023; Ravi et al. Reference Ravi, Gabeur, Hu, Hu, Ryali, Ma and Khedr2024) can be incorporated into object detection pipelines of microscope images. Segmentation builds on detection results, producing masked images that follow an object’s outline. Cleanly segmented images improve future classification analyses by removing extraneous and potentially biasing information from an image background. The off-the-shelf segmentation model SAM-2 takes a user prompt, for example, a bounding box that specifies a region of interest or a cursor prompt, and outputs a valid segmentation mask. SAM-2 is trained on a segmentation dataset of more than 1 billion masks, 1 million still images, and 51,000 videos, allowing the model to segment general objects of interest on diverse images and videos (Ravi et al. Reference Ravi, Gabeur, Hu, Hu, Ryali, Ma and Khedr2024).
We review these four foundational and emerging techniques to demonstrate their application to palynological analysis and specifically to the critical first step of pollen detection and segmentation from scanned slide images. Our hope is to encourage and guide other researchers in developing robust deep learning workflows. All Python code used to process slide scans into image stacks, annotate image stacks, train and evaluate detection models, and apply segmentation is available through our GitHub repositories, and we provide command line interface (CLI) Python software so that others can easily integrate these techniques into their own research (see Data Availability Statement). The NDPI Tile Cropper CLI as written can only be applied to Hamamatsu NanoZoomer Digital Pathology Images (NDPI) images (Puthanveetil Satheesan et al. Reference Puthanveetil Satheesan, Feng, Kong and Punyasena2025a), but the source code shared in our GitHub repository can be modified to open other microscope images using the python-bioformats library, a wrapper for Bio-Formats Open Microscopy Environment software (Linkert et al. Reference Linkert, Rueden, Allan, Burel, Moore, Patterson and Loranger2010).
Methods
Pollen Samples Source
We imaged pollen from two high-resolution sediment cores extracted from Laguna Pallcacocha, in El Cajas National Park, Ecuadorian Andes. The first core, PAL 1999, (Moy et al. Reference Moy, Seltzer, Rodbell and Anderson2002) extends through the Holocene (11,600 cal yr BP–present). The second parallel core, PAL IV (Hagemans et al. Reference Hagemans, Nooren, de Haas, Córdova, Hennekam, Stekelenburg, Rodbell, Middelkoop and Donders2021; Hagemans et al. Reference Hagemans, Donders, Nooren, Scheper, Stekelenburg, Theunissen and Minderhoud2023) spans the twentieth century. The vegetation surrounding the lake is dominated by cushion plants and patches of páramo shrubs (Hagemans et al. Reference Hagemans, Tóth, Ormaza, Gosling, Urrego, León-Yánez, Wagner-Cremer and Donders2019). Volumetric samples were spiked with Lycopodium clavatum and prepared following standing protocols, including acetolysis and heavy liquid flotation (Faegri and Iversen Reference Faegri, Iversen, Faegri, Kaland and Krzywinski1989). Samples from PAL IV were mounted using glycerin, and samples from PAL 1999 were mounted in a permanent mount.
Imaging
We imaged 19 slides from the PAL IV core and three slides from the PAL 1999 core using two different microscopes (Fig. 1, Table 1). PAL IV slides were imaged at 630× magnification (0.146 μm/pixel resolution) with a Leica DM 6000 B, an upright transmitted light microscope fit with a halogen light source, an automated XYZ stage, and LAS 4.12 PowerMosaic software for the creation of image tile grids (Fig. 1B). One to three scans measuring 3698 μm × 2790 μm were taken from each slide. Each scan was composed of 400 image stacks of 1040 × 1392 pixel tiles, with 7 or 9 focal planes imaged at increments of 3 or 4 μm. A total of 2986 image stacks contained palynomorphs; these were used for model training. The three samples from the PAL 1999 core were imaged at 400× magnification (0.225 μm/pixel resolution) with a Hamamatsu NanoZoomer 2.0 HT slide-scanning microscope. Nine focal planes were imaged in 3 μm increments for a focal depth range of 24 μm. Slide scans (NDPI file format) were processed into 1040 × 1392 pixel image stacks (PNG file format) using the Bio-Formats Python library (Linkert et al. Reference Linkert, Rueden, Allan, Burel, Moore, Patterson and Loranger2010). Three hundred randomly selected image stacks, approximately 5% of the total slide area, were exported from each slide.
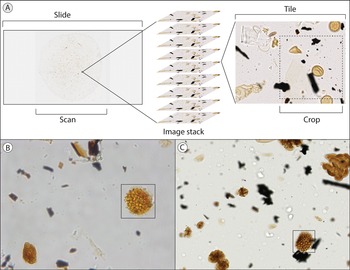
A, Example of a slide scan (~20.5 × 20.5mm), image stack (7 or 9 focal planes with 3 or 4 μm step size), image tile (1040 × 1392 pixels), and crop (800 × 800 pixels). Comparison of 1040 × 1392 pixel image tiles taken with a (B) standard upright microscope (0.146 μm/pixel) and (C) slide-scanning microscope (0.225 μm/pixel). The 40 × 40 μm boxes highlight Lycopodium spores in each image for comparison. Noticeable differences include color, brightness, and scale. The upright microscope domain was used in training the general pollen detection model (GPDM) and small-grain detection model (SGDM), and the slide-scanning microscope domain was used for domain fine-tuning and continual learning.

Summary of the two different slide imaging and image tiling methods used in this paper, identifying several variables: the sediment core source for the pollen sample, the techniques described in the paper used on those samples, the number of slides used in the analysis, the microscope used for imaging, the lens magnification and image resolution, the number of focal planes in the image stacks, the image stack focal plane step size, the focal depth range of the image stack, the slide image tiling method, and the tile dimensions. Samples were imaged using two different but comparable bright-field microscopy methods, making use of the available institutional resources at Utrecht University and the University of Illinois, Urbana-Champaign. GPDM, general pollen detection model

Annotation
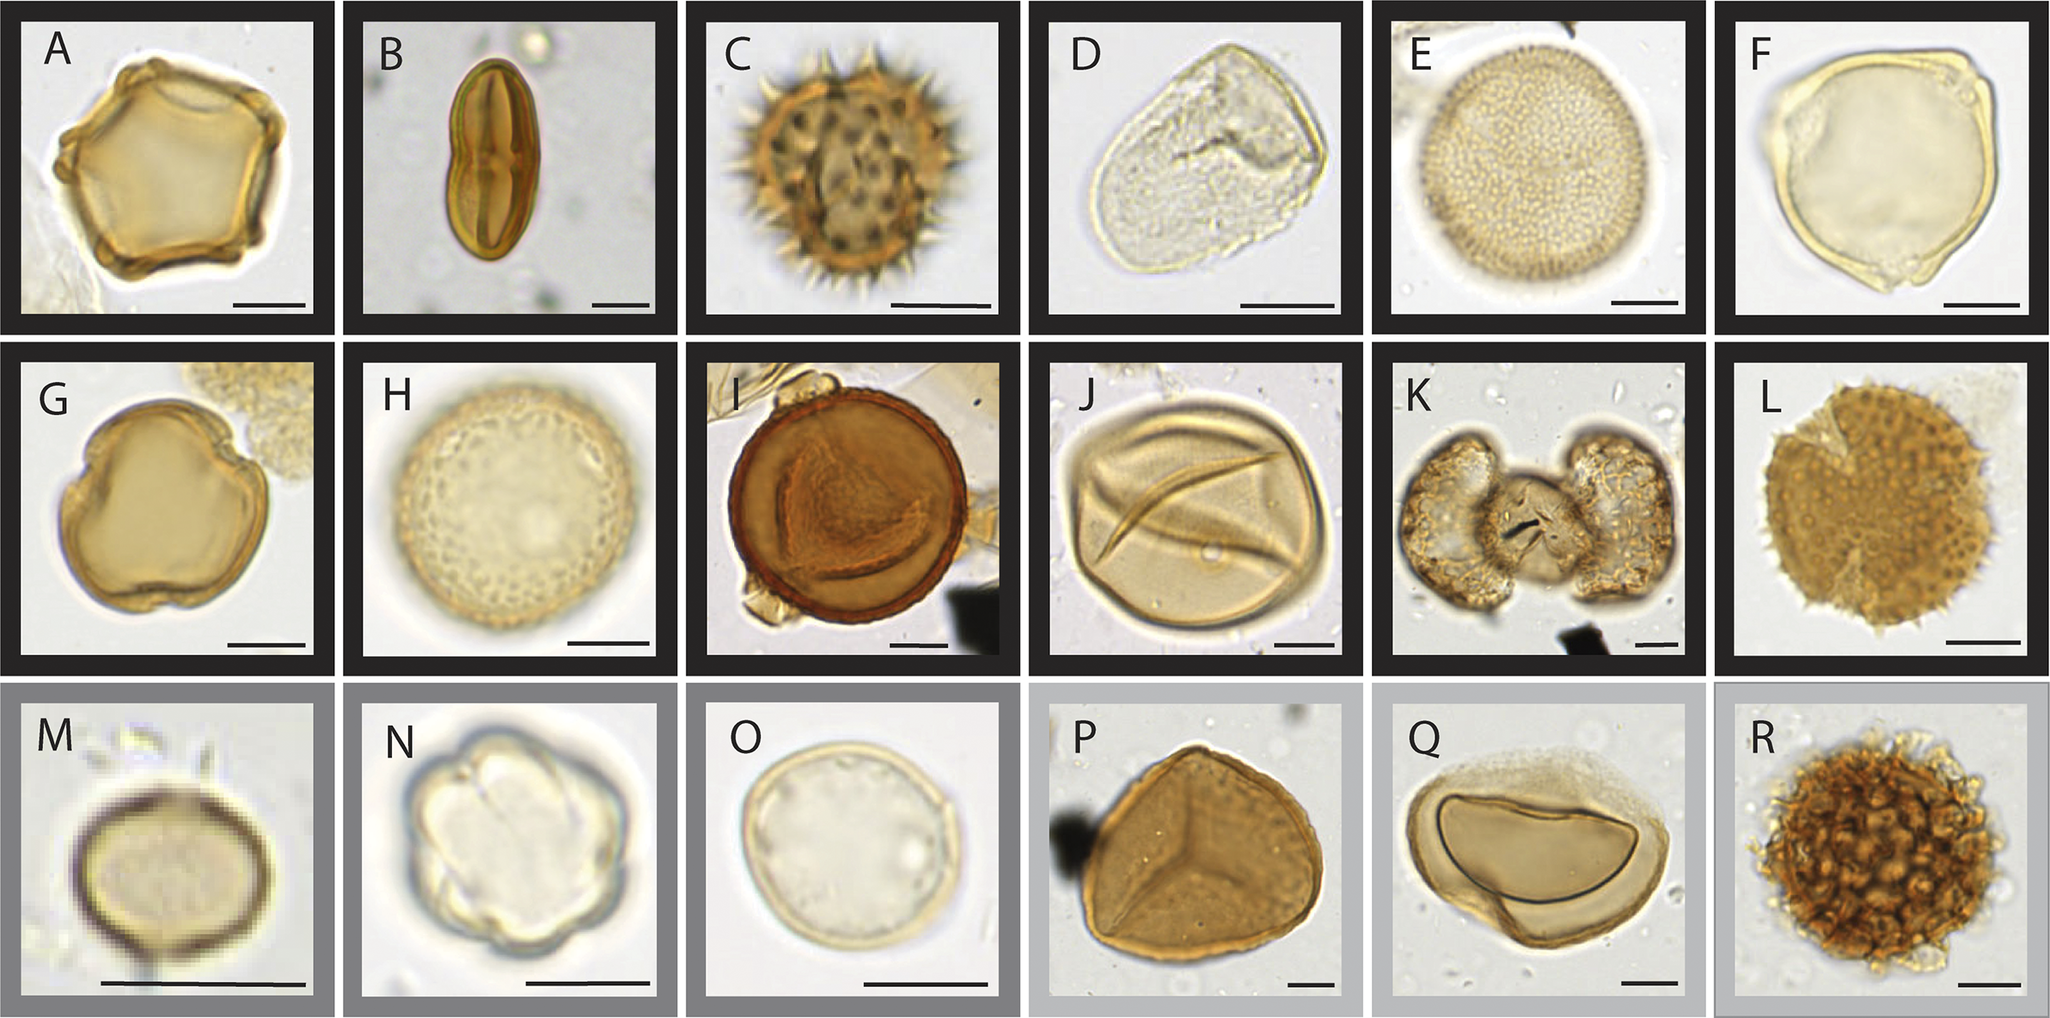
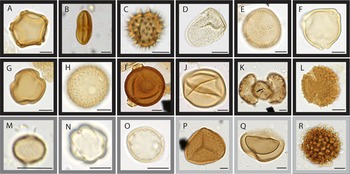
For every annotated pollen grain or spore, we defined its X,Y,Z coordinates using bounding boxes converted to inscribed circles (PAL IV images) or directly as circles (PAL 1999 images) on the plane of the image stack that captured the equatorial cross section of the pollen grain or spore. When these annotations fell at the edge of the image, annotations were corrected manually to identify the center of the grain. We annotated the PAL IV images using a MATLAB script, modified from Punyasena et al. (Reference Punyasena, Haselhorst, Kong, Fowlkes and Moreno2022), and annotated the PAL 1999 images using Labelme (Wada et al. Reference Wada, mpitid, Zhang Ch, なるみ and Martin Kubovčík2021) and the Hamamatsu NanoZoomer NDP.view2 software. All three methods produced the same annotation metadata: a center and radius that defined the location of a pollen grain. We annotated 3191 PAL IV and 794 PAL 1999 specimens as one of 129 taxonomic types (Feng et al. Reference Feng, van den Berg, Donders, Kong, Satheesan and Punyasena2025). The 18 most common palynomorphs accounted for 92% of the total dataset (Fig. 2). We excluded algae and fungal spores, but included plant spores from ferns and lycopods, such as Huperzia (Fig. 2P), Isoetes (Fig. 2Q), and the exote marker Lycopodium clavatum (Fig. 2R). The excluded algae were primarily Pediastrum, which is much larger and lighter than pollen and morphologically distinct. Similarly, the excluded fungal spores are much smaller and darker than pollen and likewise morphologically distinct.
The 18 most common palynomorphs (>20 training examples, representing 92% of the total dataset): A, Alnus; B, Apiaceae; C, Asteraceae Tubuliflorae-type; D, Cyperaceae; E, Hedyosmum; F, Myrica; G, Myrsine; H, Plantago; I, Polylepis spp.; J, Poaceae; K, Podocarpus; L, Valeriana; M, Cecropia; N, Melastomataceae; O, Urticaceae-Moraceae; P, Huperzia; Q, Isoetes; and R, Lycopodium clavatum (exote marker). Black borders indicate taxa with medium to large pollen grains (A–L), medium-gray borders indicate taxa with small grains (M–O), and light gray borders indicate plant spores included in the annotated dataset (P–R). Scale bars, 10 μm.
General Pollen Detection Model (GPDM) Architecture and Training
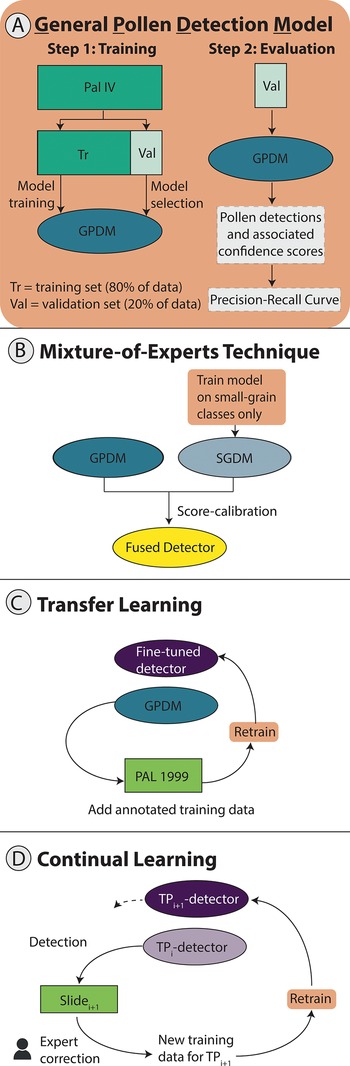
Convolutional neural networks (CNNs) have learnable parameters that are optimized to output the desired prediction for a given input. A CNN model is trained using a set of images and their associated annotations. Annotations refer to human expert labels or tags of specimens and their bounding box coordinates. This is the “ground truth.” From the training set, a random selection of images is forward passed through the model, which outputs detection results. The detection results are compared with the ground-truth annotations of these images, producing a loss that measures the difference between detection results and annotations. Then, an optimization algorithm updates the model’s parameters by minimizing the cost value. This procedure iterates over batches of the whole training data, for multiple epochs (where an epoch is a single pass over all the training data). Intermediate models are saved after each epoch or saved under different training hyperparameters, and we select the model that produces the smallest cost value on a held-out validation set (Fig. 3A).
Setups for: A, the general pollen detection model (GPDM), B, the mixture-of-experts technique, C, transfer learning across imaging domains, and D, continual learning with human-in-the-loop annotation. A, The process of training the GPDM by splitting the annotated dataset into training and validation sets, used respectively for training the model and for model selection. The validation set was then passed through the model to obtain a list of detections and associated confidence scores. Using the detections, we drew a precision–recall curve for model evaluation. B–D are variations on A. In B, we trained a small-grain detection model (SGDM) on a subset of the PAL IV data, selecting only image stacks that contained Urticaceae-Moraceae, Melastomataceae, or Cecropia grains and revising the masks to only represent these taxa. The SGDM was then fused with the GPDM into a single pipeline. In C, we fine-tuned the GPDM on slides from a new domain, PAL 1999. In D, we implemented a continual learning workflow. We used Slide 1 to fine-tune the GPDM in TP0, producing the TP1 detector, then used the TP1 detector to detect pollen in image stacks from Slide 2. In the fine-tuning stage, experts manually verified detections so that the detections served as new training data to fine-tune detectors. The process was repeated continually in subsequent time steps.

In our case, our input is image stacks from slide scans, and our desired prediction is pollen detections (determining whether image pixels represent “pollen” or “not pollen”). We used ResNet34 (He et al. Reference He, Zhang, Ren and Sun2016) as the backbone of our GPDM, encoding the input image stacks as a feature map, which assembles per-pixel feature vectors. Over the feature map, we built a decoder (Kong Reference Kong2022; Punyasena et al. Reference Punyasena, Haselhorst, Kong, Fowlkes and Moreno2022) that transformed the feature map to a detection heat map, with each pixel denoting a confidence score for the pixel belonging to a pollen grain.
We used the PAL IV dataset in developing the GPDM. The model was trained on 800 × 800 pixel crops of the original 1040 × 1392 pixel image tiles (Fig. 1A). During training, crops were taken randomly, and the location of the crop varied with each epoch. During evaluation, four overlapping crops were taken of each image stack, covering the entire image tile. We divided the annotated image stacks into a training set (80%) and a validation set (20%). We augmented the training data using random rotations and flips of the original image stacks. We set the number of images in each batch of training data to four, trained the model for 30 epochs, and set the learning rate (the degree of model weight adjustment for each weight update) to 0.0005. We stopped the training at 30 epochs when the model improvement plateaued.
We created circular binary masks to indicate where pollen was present using our circular annotations. From these, we created distance transform masks where values for pixels inside each circle or partial circle represented the number of pixels to the nearest edge (Fig. 4B). Binary masks were used to train the model to recognize pixels in an image as “pollen” or “not pollen,” while the distance transform masks were used to train the model to recognize the centers of pollen grains. Use of the distance transform masks creates a spatially aware detection, allowing for the separation of overlapping detections and cleaner segmentations (e.g., Punyasena et al. Reference Punyasena, Haselhorst, Kong, Fowlkes and Moreno2022). The final loss sums the detection loss and the distance transform loss.
The detection workflow. A, One plane of the image stack, overlaid with the original square annotations. B, The ground-truth distance transform mask, created from the annotations. C, The softmax layer, one of the model outputs. D, The predicted distance transform mask, a second model output. E, The predicted pollen grain centers, determined by calculating the peaks in the distance transform mask. F, The detection mask, created using the predicted pollen grain centers and radii, overlaid on the image with confidence scores below each detection. The detection mask was thresholded at a confidence score of 0.025. Note that a single image is used solely to illustrate our workflow. In our study, training and evaluation images were not duplicated.

Detection Model Outputs
For each image in an image stack, the detection model outputs softmax layers (normally distributed probabilities of whether a pixel is within a pollen grain) (Fig. 4C) and predicted distance transform layers of pollen pixels from the edge of a pollen grain (Fig. 4D). Local peaks in the distance transform layer identified the mass centers of pollen detections (Fig. 4E). We next used the maximum radius of the largest connected component as the predicted radius. The predicted center and radius defined the circular binary detection mask (Fig. 4F). Softmax was used to determine the confidence of the detection (Punyasena et al. Reference Punyasena, Haselhorst, Kong, Fowlkes and Moreno2022).
Detection Model Evaluation
We evaluated detections by determining the overlap with the closest annotated pollen grain (Fig. 4A) using their intersection over union (IoU) (Padilla et al. Reference Padilla, Passos, Dias, Netto and da Silva2021). If an IoU was above a predefined IoU threshold (heuristically chosen as 0.3 for this study, or an overlap of 30%), the detection was considered as a true positive (Fig. 4F), otherwise it was a false positive. If an annotation did not overlap with any detections above the IoU threshold, it was considered a false negative. IoU values of true positives were consistently lower than 1, because the masks defined by machine detections and human annotations were rarely the same size and shape.
We used confidence scores to rank all the detections. Increasing the confidence threshold keeps only high-confidence detections but removes true positive detections with lower confidence. It also potentially increases the percentage of true positives in the retained detections. Therefore, tuning the confidence threshold introduces a trade-off between the percentage of kept true positives over all annotations (termed “recall”) and the percentage of kept true positives over the kept detections (termed “precision”). We define precision and recall, respectively:
 $$ precision=\frac{true\ positives}{true\ positives+ false\ positives} $$
 $$ recall=\frac{true\ positives}{true\ positives+ false\ negatives} $$
We calculated the values for precision and recall at varying confidence thresholds and plotted a precision–recall curve from these results. The area under the curve is the mean average precision (mAP), which we can then use to evaluate model performance (Everingham et al. Reference Everingham, Van Gool, Williams, Winn and Zisserman2010; Lin et al. Reference Lin, Maire, Belongie, Bourdev, Girshick, Hays, Perona, Ramanan, Zitnick and Dollár2014). Within an image stack, there may be multiple detections for the same grain. We used non-maximum suppression to remove duplicates when the IoU of two detections was ≥0.3, retaining only the detection with the highest confidence score.
Mixture-of-Experts
In our samples, small grains (<20 μm in diameter) were only 6.8% of the total dataset, so taxonomic bias in the data distribution included a morphological bias against the detection of small grains. We used an expert model trained specifically on smaller pollen grains (a small-grain detection model [SGDM]) alongside GPDM detections to improve our detection results (Fig. 3B). This is known as a mixture-of-experts approach (Nowlan and Hinton Reference Nowlan, Hinton, Lippman, Moody and Touretzky1990).
We fine-tuned the GPDM exclusively on three small-grained taxa: Urticaceae-Moraceae (132 image stacks for training and 32 for validation, with each image stack representing a single pollen grain), Cecropia (19 training/4 validation), and Melastomataceae (25 training/4 validation). The fine-tuned model is our SGDM. We fine-tuned the SGDM for 80 epochs. (We needed more epochs to train the SGDM than the GPDM due to the greater challenge of learning to detect smaller grains from high-resolution tiles). We reserved examples from three other small-grained taxa—Acalypha, Vallea, and Weinmannia—as a held-out validation set to assess the ability of SGDM to detect novel taxa with similar characteristics. We used this validation set to evaluate both SGDM and GPDM in terms of detecting small pollen grains.
The SGDM and GPDM produced independent sets of detections with different confidence score distributions. To fuse their detections, we first calibrated their confidence scores using the method in Platt (Reference Platt1999) for score calibration. Specifically, we adjusted the confidence score (s) of an SGDM’s detection towards the calibrated score (S) by tuning two hyperparameters (α and β) in the sigmoid function below:
 $$ S=\frac{1}{1+{e}^{-S\ast \alpha +\beta }} $$
We tuned the hyperparameters by sweeping over a range (3.0, 6.0) for α and β, with step sizes of 0.1, with a goal of maximizing mAP over our validation set. We derived the final hyperparameter at α = 5.5 and β = 4.9 used in our work. We fused overlapping detections from the GPDM and SGDM.
Transfer Learning across Imaging Domains
We next fine-tuned our GPDM, originally trained on PAL IV images, to new imaging domains, that is, the PAL 1999 images. Because the taxonomic composition of the two cores was identical, differences between the two image datasets were primarily in the image resolution, color, and contrast (Hagemans et al. Reference Hagemans, Urrego, Gosling, Rodbell, Wagner-Cremer and Donders2022, Reference Hagemans, Donders, Nooren, Scheper, Stekelenburg, Theunissen and Minderhoud2023). The PAL 1999 dataset included 300 image stacks from each of three slides; 80% were used as the training set and 20% as the validation set. The GPDM was trained on PAL 1999 image stacks and annotations (Fig. 3C), until we observed no additional model improvement (120 epochs). Although the PAL IV images had a resolution 0.146 μm/pixel and PAL 1999 images had a resolution of 0.225 μm/pixel, we did not rescale the images to simulate a more challenging domain gap. We evaluated the fine-tuned model performance by comparing the precision–recall curves for the slide-scanner validation data before and after fine-tuning. To provide a performance baseline for comparison, we also trained a GPDM model trained from scratch on the PAL 1999 image stacks and annotations.
Continual Learning with Human-in-the-Loop
We simulated a human-in-the-loop workflow that would allow us to train models when starting with incomplete data. Instead of training on all 900 images at once as in our transfer learning experiments, we split the images at the slide level into three sets of training and validation data to be used at three time periods (TP0, TP1, and TP2). We measured model performance as the decrease in the number of false positives and an increase in the recall rate. We manually verified true positives and false positives in our detection results from each time period and used these new labels to further fine-tune our models (Fig. 3D).
In TP0, we fine-tuned the GPDM on the TP0 training set and used the TP0 validation set to select the best-performing detector, which we called the TP0 detector. In TP1, we used the TP0 detector to help us annotate the TP1 training set. We ran the TP0 detector on the TP1 training set to get a set of detections. Next, we simulated human-in-the-loop verification of the detections by using the ground-truth annotations. If a ground-truth annotation and a predicted detection had an IoU > 0.3, we considered the detection a true positive and included it in the set of cleaned annotations for the TP1 training set. Otherwise, the detection was considered a false positive and was eliminated. We did not include missed detections in the cleaned annotations for the TP1 training set. We fine-tuned the TP0 detector on a training set composed of [TP0 training set + TP1 training set] and selected the best model using the TP1 validation set. We called this detector the TP1 detector. In TP2, we repeated the process of using the TP1 detector to annotate the current TP2 training set, then cleaning up the annotations. We fine-tuned the TP1 detector on a training set composed of [TP0 training set + TP1 training set +TP2 training set] and selected the best model using the TP2 validation set. We called this detector the TP2 detector.
Zero-Shot Segmentation
The shape of a pollen grain outline varies with orientation, preservation, and species morphology. Not all pollen grains are circular in cross section. As a result, circular detection masks can include extraneous background material, such as organic debris or adjacent grains. Equally, portions of the grain can be excluded when pollen shape deviates significantly from circular. New foundation segmentation models like SAM-2 allow segmentation of pollen grains without needing pollen images to fine-tune, that is, “zero-shot segmentation” (Ravi et al. Reference Ravi, Gabeur, Hu, Hu, Ryali, Ma and Khedr2024). To evaluate the efficacy of SAM-2 with palynological images, we applied it to our pollen detections to produce more-contoured segmentation masks that followed the true outlines of detected grains. We used the pollen grain center and the cropped pollen image output by our detection models as input for SAM-2. We also experimented with adding four points near the four corners of the detection mask as negative prompts to SAM-2 to unambiguously differentiate foreground from the background.
Workflow Modules Development, Deployment, and Testing
Finally, we developed CLIs of the individual modules of the pollen analysis workflow described in this paper to allow others to reproduce the analysis and adopt the image extraction and detection workflows (listed in the Data Availability Statement). Written in Python, the CLIs are for tile cropping Hamamatsu NDPI, running trained pollen image detection models, and post-processing with SAM-2 segmentation. The NDPI Tile Cropper CLI is written specifically for opening and processing NDPI images, but can be modified to open other microscope images.
There are several advantages to employing the CLIs. These include the ability to: switch between running in serial and parallel mode; install and manage dependencies using Docker or Apptainer software on high-performance computing (HPC) systems; access optional parameters; and produce user feedback logs. We developed, deployed, and tested the CLIs using different computing environments (e.g., laptop, HPC, and cloud computing) and provide detailed documentation on installation and usage in our GitHub repositories (Puthanveetil Satheesan et al. Reference Puthanveetil Satheesan, Feng, Kong and Punyasena2025a,Reference Puthanveetil Satheesan, Feng, Kong and Punyasenab,Reference Puthanveetil Satheesan, Kong and Punyasenac; see Data Availability Statement).
Results
GPDM
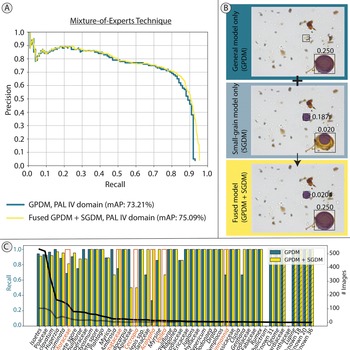
We achieved a maximum detection recall rate of 93% and mAP of 73.21% with the full PAL IV image dataset (Fig. 5A). We set the threshold for the desired precision of our model output to 20% to remove the majority of false detections. At 20% precision, we achieved ~90% recall across our experiments. The GPDM underdetected smaller, more transparent pollen grains such as Urticaceae-Moraceae, Cecropia, Melastomataceae, Acalypha, Vallea, and Weinmannia (Fig. 5C). For example, although Cecropia was a more common pollen type, with 19 training examples (Fig. 2M), none of the four images in the validation set were detected at the 20% precision level. In contrast, the larger and darker grains of Polylepis spp. (Fig. 2I), of which there were also 19 training examples, had 100% recall.
Results of general pollen detection model (GPDM), application of the mixture-of-experts technique, and application of transfer learning. A, For the mixture-of-experts technique, comparison of the blue (GPDM) and yellow (fused model) curves shows how the addition of an expert model trained only on small pollen grains improves maximum model recall from 93% to 95%. B, Comparison of detections from the general model, the small-grain model, and the fused model. Boxes in each panel indicate ground-truth labels, and circles indicate detections. The color of the detections is arbitrary. Confidence scores are shown adjacent to each detection. small-grain detection model (SGDM) confidence scores in the fused model have been calibrated as described in the text. A validation-set image stack containing a Cecropia pollen grain and Isoetes spore was fed into the two models. The GPDM detected the Isoetes spore with high confidence but missed the Cecropia grain. The SGDM was able to detect the Cecropia grain but had poor localization accuracy and low confidence for the Isoetes spore. The fused model kept both detections. C, Blue and yellow bars indicate model recall by taxon for the GPDM and the fused (GPDM + SGDM) models respectively (left y-axis). The black and gray lines indicate the abundance distribution of taxa in the GPDM training and validation datasets, respectively (right y-axis). Both models were thresholded at the confidence value that yielded 20% precision. The taxa highlighted in orange are particularly small-grained taxa, which have low rates of detection relative to the number of training examples. Hatched bars indicate taxa that had no training examples but were in the validation set and detected by the detector. mAP, mean average precision; PAL IV.

Mixture-of-Experts Technique
Fusing the SGDM with the GPDM increased maximum recall by 2% and increased mAP from 73.21% to 75.09% (Fig. 5A). Recall at the 20% precision level increased for Urticaceae-Moraceae from 69% to 81%, Melastomataceae from 75% to 100%, and Cecropia from 0% to 50% (Fig. 5C). Acalypha, Vallea, and Weinmannia, the three remaining taxa with small, transparent pollen grains, also showed improvement, despite not being included as SGDM training examples (Fig. 5C). The fused SGDM + GPDM model shows an increase in model precision within a large range of recall in (0.1, 0.9), indicating that the SGDM added some high-confidence small-pollen detections (Fig. 5A). The increase in maximum recall shows that the SGDM added detections that are missed by the GPDM (Fig. 5A,B).
Transfer Learning across Imaging Domains
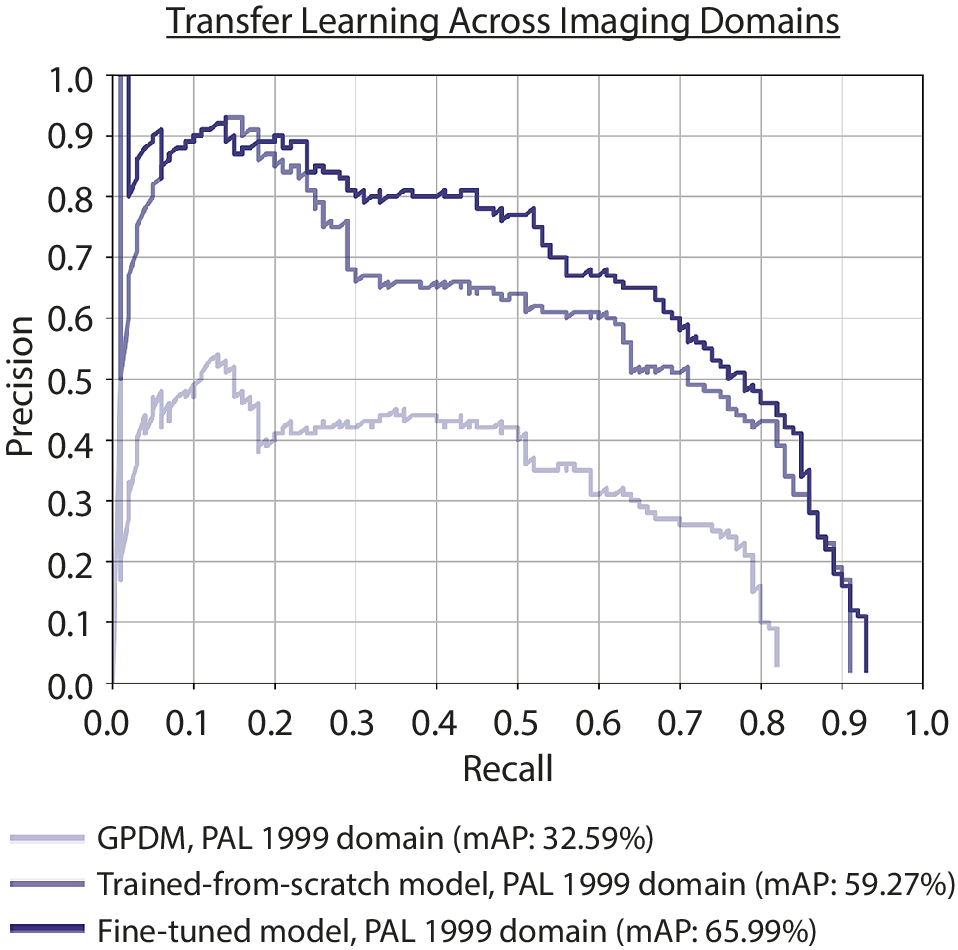
We achieved a mAP of 32.56%, maximum recall of 82%, and 10% precision at the 80% recall level when we forward-passed the PAL 1999 (slide-scanner) images through the GPDM trained on PAL IV (upright microscope) images. The low performance demonstrated the extent to which the detection models were sensitive to domain differences caused by illumination, optical resolution, and camera property offsets. After fine-tuning the model with 900 PAL 1999 training images, we achieved a mAP of 65.99% and precision increased from 10% to 46% at the 80% recall level (Fig. 6). Maximum recall increased from 82% to 93%. The model trained from scratch on the 900 PAL 1999 images achieved a mAP of only 59.27% (Fig. 6).
Comparison of the lightest and darkest purple curves shows the improvement of the model after fine-tuning. Maximum recall increased from 82% to 93% and precision increased from 10% to 46% at the 80% recall level. The medium purple curve, representing the performance of a model trained from scratch on the PAL 1999 domain, shows that training from scratch on a small dataset is not as effective as fine-tuning.

Continual Learning with Human-in-the-Loop
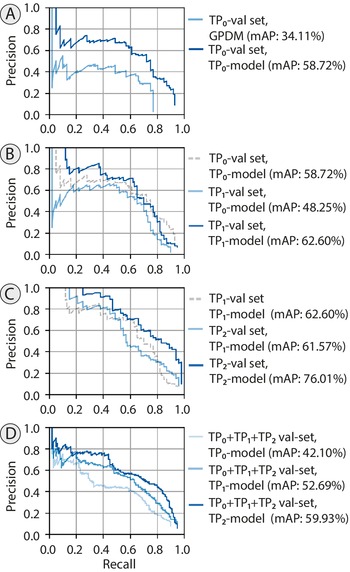
Human-in-the-loop fine-tuning increased mAP with each iteration, from 34.11% to 58.72% in TP0, from 48.25% to 62.60% in TP1, and from 61.57% to 76.01% in TP2 (Fig. 7). To compare model performance across all three time periods, we also evaluated each model on a common validation set (composed of the TP0 + TP1 + TP2 validation sets). Against this common validation set, mAP increased from 41.10% with the TP0 model to 59.93% using the TP2 model (Fig. 7D).
A–C, The improvement in model performance from fine-tuning in three time periods. A, The light blue curve represents the performance of the general pollen detection model (GPDM) on the TP0 validation set. The darker blue line shows the increase in model performance after fine-tuning on the TP0 training set with ground-truth annotations. B, The second time step, TP1. The dashed gray curve is the same as the dark blue curve in A. Comparing the dashed gray curve with the light blue curve shows the drop in model performance when switching slides and introducing a domain gap. Comparing the light and dark blue curves, we see that fine-tuning on the expert-verified TP0 model detections of the TP1 training set improves model performance again. C, A similar pattern is shown in the next time step, TP2. D, A comparison of the performance of the three models on the same validation set. Here, the TP0 + TP1 + TP2 validation set. mAP, mean average precision.

Zero-Shot Segmentation
The SAM-2 segmentation masks with the highest probability scores closely followed pollen grain shape (Fig. 8). We used a single point, the center of the original detection bounding box, to prompt SAM-2. Because the detection bounding box tightly bounds the detection, the center of the detection mask identified the region of interest and provided a clean input prompt for SAM-2. Adding four points near the four corners of the detection mask as negative prompts did not improve the results. This may be because the image background significantly differs from the pollen. However, in situations where the foreground and background have less color difference, this approach could be used. Notably, SAM-2 was able to recognize nearly the entirety of a pollen grain, although the foundation model had not been trained on pollen images. To completely capture the pollen wall, we applied dilation (an image processing morphological operation; 5 × 5 kernel over 1 iteration) to expand the area captured by the segmentation mask and ensure that the mask completely captured the pollen wall and external ornamentation.
Illustration of segmentation of cropped and detected pollen images using Segment Anything Model 2 (SAM-2). Top row shows the cropped pollen grain images produced by our U-Net convolutional neural networks (CNN) pollen detection model. Taxon identifications from left to right: Amaranthaceae, Lycopodium, Alnus, Poaceae. Bottom row shows the grain segmented with SAM-2 using an input prompt. The prompt is generated by the detection model and is illustrated with a small green cross.

Discussion
Rapid slide imaging is possible with the commercial availability of automated stages and slide-scanning microscopes (e.g., Punyasena et al. Reference Punyasena, Haselhorst, Kong, Fowlkes and Moreno2022; Theuerkauf et al. Reference Theuerkauf, Siradze and Gillert2023). Efficient object detection in scanned slide images will streamline the process of annotating and curating training data, and effective generalized detectors will lower barriers to the adoption of machine learning in palynology and other fields of microfossil research.
Several studies have developed detection and classification methods for analyzing environmental pollen on slides (e.g., Battiato et al. Reference Battiato, Ortis, Trenta, Ascari, Politi and Siniscalco2020; Kubera et al. Reference Kubera, Kubik-Komar, Kurasiński, Piotrowska-Weryszko and Skrzypiec2022; Punyasena et al. Reference Punyasena, Haselhorst, Kong, Fowlkes and Moreno2022; Tešendić et al. Reference Tešendić, Krstićev, Matavulj, Brdar, Panić, Minić and Šikoparija2022; Gimenez et al. Reference Gimenez, Joannin, Pasquet, Beaufort, Gally, de Garidel-Thoron and Combourieu-Nebout2024; Li et al. Reference Li, Cheng, Xu, Zhao, Liu, Gao, Ye and You2024; for a review, see Buters et al. Reference Buters, Clot, Galán, Gehrig, Gilge, Hentges and O’Connor2022), and instruments for detecting and classifying airborne pollen are commercially available (Oteros et al. Reference Oteros, Weber, Kutzora, Rojo, Heinze, Herr, Gebauer, Schmidt-Weber and Buters2020). Additionally, imaging flow cytometry can process particles rapidly, and some instruments are capable of simultaneously taking bright-field and fluorescence images of particles. The autofluorescence of pollen grains are used to visually isolate them (Dunker et al. Reference Dunker, Motivans, Rakosy, Boho, Mäder, Hornick and Knight2021; Barnes et al. Reference Barnes, Power, Barber, Tennant, Jones, Lee and Hatton2023).
However, fossil pollen detection presents its own unique challenges. Pollen morphology is altered by the processes of fossilization, which introduce taphonomic artifacts and morphological distortions that vary with taxonomic composition and depositional environments (Cushing Reference Cushing1967; Delcourt and Delcourt Reference Delcourt and Delcourt1980; Campbell Reference Campbell1999). Fossil samples may also contain more inorganic sediment, a larger number of unknown plant taxa, and a greater diversity of non-pollen organic debris, all of which introduce noise to automated analyses. Most fossil pollen material is mounted on slides. Automated detection methods compatible with traditional counting and archival material rely on scanning slides using multiple focal planes (12 to 5 planes, spaced <3 to 8 μm; Theuerkauf et al. Reference Theuerkauf, Siradze and Gillert2023; Gimenez et al. Reference Gimenez, Joannin, Pasquet, Beaufort, Gally, de Garidel-Thoron and Combourieu-Nebout2024; von Allmen et al. Reference von Allmen, Brugger, Schleicher, Rey, Gobet, Mustaphi, Tinner and Heiri2024).
While previous studies fused the sharpest portions of the image stacks into a single 2D image using focus stacking algorithms, the detection model described in our analysis is trained directly on unfused image stacks. This approach retains the spatial information contained in all focal planes and allows post hoc selection of the most in-focus plane or the entire image stack for downstream analyses. We use the mAP metric to evaluate and benchmark model performance because it is agnostic to IoU and confidence thresholds. That is, at different IoU and confidence thresholds, recall and precision will differ, but by using precision–recall curves, we can evaluate the relationship between the two metrics at all confidence thresholds. The confidence threshold can be set by the user depending on the application. In most cases, a high recall rate is preferable, because false detections can be further eliminated during classification or manual post-processing (Theuerkauf et al. Reference Theuerkauf, Siradze and Gillert2023; von Allmen et al. Reference von Allmen, Brugger, Schleicher, Rey, Gobet, Mustaphi, Tinner and Heiri2024).
The choice of CNN architecture can vary. We used ResNet34 (He et al. Reference He, Zhang, Ren and Sun2016). Von Allmen et al. (Reference von Allmen, Brugger, Schleicher, Rey, Gobet, Mustaphi, Tinner and Heiri2024) used CenterNet Hourglass104 (Duan et al. Reference Duan, Bai, Xie, Qi, Huang and Tian2019). Theuerkauf et al. (Reference Theuerkauf, Siradze and Gillert2023) used Faster R-CNN (Ren et al. Reference Ren, He, Girshick and Sun2016). Gimenez et al. (Reference Gimenez, Joannin, Pasquet, Beaufort, Gally, de Garidel-Thoron and Combourieu-Nebout2024) used the joint detection and classification model YOLOv5 (Zhang et al. Reference Zhang, Guo, Wu, Tian, Tang and Guo2022). These previous studies achieved detection accuracies >90%, but with a limited number of taxa (10 to 11 pollen types). They demonstrate that while high recall rates are possible within a small number of taxa, the diversity and long-tail distribution of pollen taxa within paleontological samples makes detecting rare and unusual morphotypes difficult. Theuerkauf et al. (Reference Theuerkauf, Siradze and Gillert2023) addressed this imbalance by undersampling majority classes and von Allmen et al. (Reference von Allmen, Brugger, Schleicher, Rey, Gobet, Mustaphi, Tinner and Heiri2024) by selectively balancing training data.
We also found that the GPDM underdetected taxa with small, transparent grains: Urticaceae-Moraceae, Cecropia, Melastomataceae, Acalypha, Vallea, and Weinmannia (Fig. 5C). These smaller-grained taxa were not only rare but also differed morphologically from the majority of the training data. In contrast, rare taxa that were similar in size, shape, and color to taxa in the training set were easily detected by the GPDM. For example, Ericaceae, Rumex, and Lupine were detected with 100% recall in the test set (Fig. 5C), despite having 10 or fewer training examples.
The mixture-of-experts technique (Nowlan and Hinton Reference Nowlan, Hinton, Lippman, Moody and Touretzky1990) allowed us to address taxonomic bias without additional annotated data. Fusing an expert SGDM with the GPDM increased detections of rare, small-grained taxa. Three taxa that were not included as SGDM training examples (Acalypha, Vallea, and Weinmannia) also showed improvement (Fig. 5C). This suggests that the SGDM-learned features were transferable across taxa with similar morphologies. However, taxa with few training examples can still be missed stochastically based on which images are included in training and validation. For example, two rarer taxa, Loranthaceae and Thalictrum, were entirely missed by both the GPDM and SGDM (Fig. 5C). At 20% precision, we achieved ~90% recall across our experiments. Lowering the precision threshold increased detections and recall but introduced a greater percentage of false detections. Threshold selection, therefore, is ultimately dependent on the application and tolerance for missed versus false detections and will likely need to be determined on a case-by-case basis. Previous work has demonstrated that the abundance of a particular pollen taxon, the abundance of a particular pollen morphology, and the degree of morphological similarity to organic debris all contribute to detection errors (Theuerkauf et al. Reference Theuerkauf, Siradze and Gillert2023; Gimenez et al. Reference Gimenez, Joannin, Pasquet, Beaufort, Gally, de Garidel-Thoron and Combourieu-Nebout2024).
Including reference specimens in model training is a potential solution to increasing the taxonomic diversity represented within detection and classification models. Barnes et al. (Reference Barnes, Power, Barber, Tennant, Jones, Lee and Hatton2023) successfully applied classification models trained on images of modern pollen samples acquired using imaging flow cytometry to fossil material. However, Durand et al. (Reference Durand, Paillard, Ménard, Suranyi, Grondin and Blarquez2024) found that differences in the preservation quality and processing of fresh reference specimens limited the model generalizability to fossil pollen analysis.
Differences in sample preparation and imaging practices create domain gaps among image datasets. Previous work has shown that transfer learning is effective in pollen classification (Rostami et al. Reference Rostami, Balmaki, Dyer, Allen, Sallam and Frontalini2023; von Allmen et al. Reference von Allmen, Brugger, Schleicher, Rey, Gobet, Mustaphi, Tinner and Heiri2024), and we demonstrate that transfer learning is also effective in the context of detection. This allows us to deal with domain gaps introduced by different microscope models and scanning conditions. Detection models need to work with multiple imaging sources, as standardizing imaging across large imaging projects is not always feasible, manual annotations are costly in terms of expert time, and training new models for every dataset is not always possible. However, it is possible to fine-tune pretrained detection models on relatively small amounts of training data from new imaging domains. We needed to annotate only 5% of images from a new imaging and sampling domain to increase mAP from 32.56% to 65.99% (Fig. 6), while training from scratch on the new domain alone achieved a mAP of 59.27% (Fig. 6).
Collaboration between institutions with different microscopes and imaging equipment is therefore a feasible (and potentially desirable) approach, as diverse training data will aid in the development of large, robust pollen analysis pipelines. The creation and maintenance of accessible and discoverable image databases and adoption of best practices for imaging and data curation will be an important step in advancing pollen analysis (Jaramillo et al. Reference Jaramillo, Punyasena, de Alba, Bermudez, Caballero, Cardenas and Caro2025). The initial investment can be high in terms of personnel time, equipment purchases, and data storage. However, public dissemination and long-term archival of image data support the mandate of many museums and research institutes and increase the societal value of their collections (Jaramillo et al. Reference Jaramillo, Punyasena, de Alba, Bermudez, Caballero, Cardenas and Caro2025).
With slide scanners that can scan an entire slide in under 1 hour and detection and classification models that can be trained in days (e.g., Punyasena et al. Reference Punyasena, Haselhorst, Kong, Fowlkes and Moreno2022; Theuerkauf et al. Reference Theuerkauf, Siradze and Gillert2023), annotation remains the primary bottleneck in automated pollen analysis workflows. Continual learning—with human-in-the-loop annotations and iterative fine-tuning—allows models to improve as new images and new data are introduced. Confidence scores can be used to efficiently annotate false detections manually or using semi-automated methods. New annotations can be used to further fine-tune models, and these models can improve over time with expert feedback on model results. Strategies for effective human-in-the-loop data annotation are worth studying as a stand-alone problem, as for instance, Gimenez et al. (Reference Gimenez, Joannin, Pasquet, Beaufort, Gally, de Garidel-Thoron and Combourieu-Nebout2024) has done for studying the effect of labeling specificity on model performance.
Finally, as foundation segmentation models like SAM-2 become incorporated into analysis workflows, procedures for detection and segmentation will become further streamlined. These foundation models can efficiently segment objects within an image with a single prompt (e.g., a mouse click, a coarse bounding box, or a coarse mask obtained from an upstream task), producing clean segmented images for training classification models. However, for palynological samples, trained detection models may still be needed to distinguish pollen and other specimens of interest from the diverse organic material that can be found on a palynological slide. However, once detected, foundation segmentation models are able to use a single set of coordinates to produce the clean contoured images needed for machine learning classification analyses.
Conclusions
Working in open-world scenarios means that we do not know a priori the full diversity that we will encounter in our analyses, so we need methodological approaches in which we continually improve both detectors and classifiers. Mixture-of-experts techniques, domain fine-tuning, and continual learning allow researchers to build upon shared generalized machine learning models, allowing each new generation of machine learning models to become more powerful than the last. The mixture-of-experts technique allows us to build models that are more resilient to changes in data distribution, and the small-grain detection described in our study is just one example of how the method can work with an unbalanced training dataset. Fine-tuning allows us to efficiently apply general models to new domains. These general models will also help annotate new data in new domains, using human-in-the-loop annotation to efficiently build large and diverse pollen image datasets. Developing automated analysis pipelines for fossil pollen analysis in the open world will mean adapting and continually updating the detection and classification models produced by the community to new samples and new images. Data sharing and open-source software will play a vital role in creating the momentum needed to address the challenges of training models capable of handling the unique biases of fossil data.
Efficient object detection in scanned slide images will streamline the process of annotating and curating training data, and effective generalized detectors will lower barriers to the adoption of machine learning in palynology and other fields of microfossil research. While the underlying architecture of machine learning models may change, incorporating open-world methods will result in flexible and adaptable workflows that are accessible to all paleobiologists.
Acknowledgments
Thanks to K. Hagemans (formerly at Utrecht University) and T. van den Berg (University of Hull, formerly at Utrecht University) for preparing, annotating, and imaging the PAL IV samples; G. Dammers (Utrecht University) for his supervision in preparing the samples; D. Tcheng (formerly at the National Center for Supercomputing Applications, University of Illinois) for developing the MATLAB annotation script used for the PAL IV samples; and E. Bennink (Utrecht University) for modifications and updates to the annotation script. Funding for this research was provided by the University of Illinois Campus Research Board (grant RB22079 to S.W.P.), the University of Illinois School of Integrative Biology Francis M. and Harlie M. Clark Research Support Grant to J.T.F., the Dutch Research Council (NWO) (grant 824.14.018 to T.H.D.), and the Institute of Collaborative Innovation and the University of Macau (grant SRG2023-00044-FST to S.K.) and FDCT (grant 0067/2024/ITP2 to S.K.). This research was also supported in part by the Illinois Computes project through the University of Illinois Urbana-Champaign and the University of Illinois System. This work used the National Center for Supercomputing Applications’ (NCSA) Delta computing platform, through allocation EES240072 from the Advanced Cyberinfrastructure Coordination Ecosystem: Services & Support (ACCESS) program, which is supported by U.S. National Science Foundation grants 2138259, 2138286, 2138307, 2137603, and 2138296 and the NCSA private cloud computing service Radiant. We thank associate editors A. Leslie and C. Stromberg and the reviewers for feedback that substantially improved the article.
Competing Interests
The authors declare no competing interests.
Data Availability Statement
Image stacks, annotation data, and trained detection models are archived through the Illinois Data Bank (Feng et al. Reference Feng, van den Berg, Donders, Kong, Satheesan and Punyasena2025). We developed Python-based CLIs that are containerized using Docker for easy installation and provide many features like serial and parallel processing modes, storing output in different forms (folders or zip files), and optional parameters for customizing the runs of the applications and for interacting with the underlying software. The developed CLIs were successfully tested on MacOS (Apple M Chips and Apple Intel Chips) and NCSA’s Delta HPC system using Apptainer. Source code for the described analysis (tagged with specific versions) is available on GitHub under Apache 2.0 open-source license at https://github.com/paleopollen/ndpi-tile-cropper-cli/tree/v1.2.0 (Puthanveetil Satheesan et al. Reference Puthanveetil Satheesan, Feng, Kong and Punyasena2025a), https://github.com/paleopollen/pollen-detection-cli/tree/v1.1.0 (Puthanveetil Satheesan et al. Reference Puthanveetil Satheesan, Feng, Kong and Punyasena2025b), and https://github.com/paleopollen/post-processing-cli/tree/v1.0.0 (Puthanveetil Satheesan et al. Reference Puthanveetil Satheesan, Kong and Punyasena2025c). The original set of Jupyter Notebooks are available at: (https://github.com/paleopollen/open_world_pollen_detection).


 Open access