


1 Introduction
Plasma disruption (Lehnen, Aleynikova & Aleynikov Reference Lehnen, Aleynikova, Aleynikov, Campbell, Drewelow, Eidietis, Gasparyan, Granetz, Gribov and Hartmann2015; Tang, Zeng & Chen Reference Tang, Zeng, Chen, Sun, Zhao, Zhou, Ti, Lin, Zhou and Zhu2021) is almost inevitable in the operation of the tokamak. One of the most dangerous hazards of plasma disruption is the generation of large amounts of runaway electrons (REs) (Paz-Soldan, Cooper & Aleynikov Reference Paz-Soldan, Cooper, Aleynikov, Pace, Eidietis, Brennan, Granetz, Hollmann, Liu and Lvovskiy2017; Breizman et al. Reference Breizman, Aleynikov, Hollmann and Lehnen2019; Tinguely, Izzo & Garnier Reference Tinguely, Izzo, Garnier, Sundström, Särkimäki, Embréus, Fülöp, Granetz, Hoppe and Pusztai2021). The underlying reason is that the friction force decreases with increasing speed for fast electrons (Dreicer Reference Dreicer1959). The electrons can then be accelerated by an electric field without limitation (Aleynikov & Breizman Reference Aleynikov and Breizman2015; Stahl et al. Reference Stahl, Hirvijoki, Decker, Embréus and Fülöp2015), which is now known as the runaway phenomenon. Thus, it is possible that a small population of REs becomes a large current carrier (Chen, Huang & Luo Reference Chen, Huang, Luo, Tang, Dong, Zeng, Tong, Wang, Wei and Wang2016; Cai et al. Reference Cai, Zhang, Yang, Chen, Zhang, Rao, Zhang, Wei, Tong and Pan2021). In recent years, both experiments and simulations have illustrated that REs have an impact on plasma instability (Cai & Fu Reference Cai and Fu2015; Liu, Hirvijoki & Fu Reference Liu, Hirvijoki, Fu, Brennan, Bhattacharjee and Paz-Soldan2018a; Spong, Heidbrink & Paz-Soldan Reference Spong, Heidbrink, Paz-Soldan, Du, Thome, Van Zeeland, Collins, Lvovskiy, Moyer and Austin2018; Liu, Zhao & Jardin Reference Liu, Zhao, Jardin, Ferraro, Paz-Soldan, Liu and Lyons2021). The energy of the RE is close to several tens to hundreds of MeV. Attention should be paid to the following points: the relativistic effect is significant; the radiation reaction (Finken, Watkins & Rusbüldt Reference Finken, Watkins, Rusbüldt, Corbett, Dippel, Goebel and Moyer2011; del Castillo-Negrete et al. Reference del Castillo-Negrete, Carbajal, Spong and Izzo2018; Hoppe et al. Reference Hoppe, Embréus, Tinguely, Granetz, Stahl and Fülöp2018; Zhang, Zhou & Hu Reference Zhang, Zhou, Hu, Chen, Chao and EAST2018, Reference Zhang, Zhou, Hu, Chen, Chao, Zhang and Li2021) is important; when the inductive electric field becomes strong enough, the runaway avalanche (Nilsson et al. Reference Nilsson, Decker, Peysson, Granetz, Saint-Laurent and Vlainic2015; Svensson et al. Reference Svensson, Embreus, Newton, Särkimäki, Vallhagen and Fülöp2021) develops after the thermal quench. Without proper control, these energetic REs will eventually hit the first wall of the device in a localized manner, posing a serious threat to the safe operation of the device.
In a recent investigation (Liu, Wang & Qin Reference Liu, Wang and Qin2016), collisionless pitch-angle scattering was found to be much stronger than collisional scattering and invalidates the first-order guiding-centre model for REs. Taking synchrotron radiation, the loop electric field and the magnetic field into account, the phase space of REs has been studied by using the full orbit model. The energy increases until the synchrotron drag balances the electric field. When the parallel momentum becomes dozens of times $m_0c$ ($m_0$
 is the rest mass of an electron, and c is the speed of light), the absolute magnitude of the perpendicular momentum changes a lot during one gyro-period, i.e. fast oscillations. The term ‘fast’ relates to the large change of the perpendicular momentum in one gyro-period of approximately $10^{-12}\sim 10^{-10}\,\mathrm {s}$
 , compared with the bounce period of REs, which is close to $10^{-7}\sim 10^{-6}\,\mathrm {s}$
 . With fast oscillations, the perpendicular momentum grows with increasing parallel momentum. This phenomenon is called ‘collisionless pitch-angle scattering’. It is a way in which the parallel momentum is converted to perpendicular momentum in the absence of collisions. However, for the long-term simulation of REs, the computing costs of the full orbit model are nearly unacceptable.
According to the results in Liu, Qin & Hirvijoki (Reference Liu, Qin, Hirvijoki, Wang and Liu2018b), a new expression for the magnetic moment is introduced, where the magnetic moment $\mu$ can still be considered as a good adiabatic invariant. The magnetic moment $\mu$
 is decided not only by the perpendicular momentum but also by the parallel momentum and the magnetic-field-line curvature vector $\boldsymbol {\kappa }$
 , thus providing the aforementioned collisionless momentum transfer. Based on the adiabatic invariant, the Hamiltonian high-order equations of motion were derived. However, for more realistic simulation of REs, the radiation term needs to be considered.
In this paper, focusing on synchrotron radiation, we investigate the dynamics of relativistic REs by utilizing different models in the Chinese Fusion Engineering Testing Reactor (CFETR) steady-state scenario via a particle tracing code (PTC) (Wang et al. Reference Wang, Zhao, Wang, Zhang, Lin, Liu and Team2021), which was developed recently. The code includes both the full orbit and guiding-centre orbit models to track charged particles in a tokamak with a three-dimensional field. In PTC, the computational domain is divided into two regions: the core region and the scrape-off-layer region. The meshes are generated by a constrained Delaunay triangulation method. On each flux surface, the vertices are placed at equidistant arc lengths in the poloidal section. With the unstructured triangle mesh, the geometry of the tokamak poloidal section can be described precisely, and the flux coordinate can be interpolated conveniently. From the g-eqdsk file, bicubic interpolation on a uniform grid is used to obtain the first derivative of the magnetic field of the vertices of the triangular meshes. Bilinear finite element methods are used to calculate the second derivative of the magnetic field at any point. It now also includes a relativistic (Wimmel Reference Wimmel1983) and high-order modification. Extensive numerical verifications of the validity of the high-order guiding-centre theory are given for simulations involving REs. The simulation results prove that the high-order guiding-centre approach (HGSA) is more appropriate than the first-order guiding-centre approach for REs. HGSA reproduces the ‘collisionless pitch-angle scattering’, but the first-order approach cannot. The perpendicular momentum is the dominant factor of the synchrotron radiation. Synchrotron radiation plays an essential role in the life cycle of REs. The energy of REs first increases and then becomes saturated until the electric field acceleration is balanced by the radiation dissipation. HGSA has reproduced the basic physical process of energy saturation. Since the time scale of the energy saturation of REs is close to seconds, the computational cost becomes significant. Avoiding unnecessary waste of calculation costs, an analytical formula is derived to calculate the balance time. In certain test cases, the provided formula has been numerically verified. Test calculations reveal that HGSA is admittedly favourable for exploiting the dynamics of REs in tokamak plasmas.
In § 2.1, we use the relativistic full orbit model to advance the test particle in the six-dimensional phase space. We give some physical explanations for the details of the development of the perpendicular momentum. In § 2.2, we carry out the work by using the high-order guiding-centre model, calculate the radiation effect and derive the analytical formula to estimate the energy balance time. In § 2.3, we analyse the relationship between the conservation of the magnetic moment and the change of magnetic field in one gyro-period and then discuss the applicability of the high-order guiding-centre equations. Finally, in § 3, we conclude our work.
2 Methods and results
2.1 Relativistic full orbit model
To analyse the phase-space characteristics of energetic particles, the test particle method is an effective numerical method. Based on this method, many important physical results have been produced (Sommariva et al. Reference Sommariva, Nardon, Beyer, Hoelzl, Huijsmans and van Vugt2017; Hao, Chen & Cai Reference Hao, Chen, Cai, Li, Wang, Wu, Wang, Chen, Wang and Gao2020; Zhao, Wang & Wang Reference Zhao, Wang, Wang, Hao and CFETR2020). The method advances the particle motion through time-dependent orbital equations, while the electromagnetic fields are not solved self-consistently. Two kinds of particle motion equation are used currently, one is the standard guiding-centre equations, i.e. the first-order guiding-centre equations, and the other is to use the Lorentz orbital equations, i.e. the full orbit equations. Considering computational efficiency, the guiding-centre model could be made more applicable by averaging out the fast gyro-motion. However, the first-order guiding-centre model may not be suitable for the simulation of REs (Liu et al. Reference Liu, Wang and Qin2016).
For the relativistic full orbit calculation, the equations of motion can be written as

where $\boldsymbol {x},\ \boldsymbol {v},\ \boldsymbol {p}=\gamma m_0 \boldsymbol {v}$ represent the physical location, velocity and mechanical momentum of the particle respectively, $\boldsymbol {E}$
 and $\boldsymbol {B}$
 denote the electric and magnetic fields and the Lorentz factor $\gamma$
 is given as

Here, $c$ is the speed of light in a vacuum, v is the velocity of the particle. The toroidal electric field is given as $\boldsymbol {E}=E_l R_0/R\boldsymbol {e}_\phi$
 . The major radius of CFETR is $R_0=7.2\,\mathrm {m}$
 , the central magnetic field is $B_0=6.5\,\mathrm {T}$
 and $E_l$
 is given as $E_l=10.0\,\mathrm {V}\,\mathrm {m}^{-1}$
 . Now we include a test energetic electron. The initial physical location is $R=8.0\,\mathrm {m},\ \phi = 0, Z=0\,\mathrm {m}$
 , and the initial momentum is $p_{\parallel 0}=5m_0 c, p_{\bot 0}=m_0 c$
 . The time step of the simulation is set to be $\delta T =0.01T_{ce}$
 , $1\,\%$
 of the gyro-period $T_{ce}$
 .
.
Figure 1 shows the phase space of the RE. In a real tokamak, the evolution trend is consistent with the results in an ideal magnetic geometry in Liu et al. (Reference Liu, Wang and Qin2016). Without radiation, figure 1(a) depicts the increase of the parallel momentum due to the electric field. Figure 1(b) demonstrates the evolution trend of the perpendicular momentum. Zooming in, we see that the time scale is approximately $10^{-8}$ s, and it is clear that the interval between the two maximum values of $p_\bot$
 is approximately $10^{-9}$
 s. Hence, the oscillation of $p_\bot$
 can be regarded as a fast oscillation. The amplitude increases until the minimum of the perpendicular momentum reaches a zero point. As time goes by, the perpendicular momentum becomes greater than zero and oscillates at an almost fixed amplitude. When considering the magnetic fluctuations or the ripple fields in a real tokamak, this changes the radiation effects of REs (Martín-Solís, Sánchez & Esposito Reference Martín-Solís, Sánchez and Esposito1999; Liu et al. Reference Liu, Qin, Wang, Yang, Zheng, Yao, Zheng, Liu and Liu2016). Figure 1(c) depicts that the lowest magnetic moment $\mu _0$
 increases and oscillates, which is against the assumptions of the first-order guiding-centre model. The lowest-order magnetic moment is no longer conservative for REs.
Evolution of (a) the parallel momentum, (b) the perpendicular momentum and (c) the lowest magnetic moment of the electron.

The asymptotic expansion is $\mu =\mu _0 + \epsilon \mu _1 + \cdots$ , where $\mu _1$
 represents the first-order correction that explicitly involves the non-uniformity of the magnetic field (Burby, Squire & Qin Reference Burby, Squire and Qin2013). In Liu et al. (Reference Liu, Qin, Hirvijoki, Wang and Liu2018b), keeping to the second order, a new expression was derived under the limit $p_\parallel \gg p_\bot$
 . The expression consists of three terms


where $\boldsymbol {\kappa }$ is the curvature vector defined by $\boldsymbol {\kappa }=\boldsymbol {b}\boldsymbol {\cdot }\boldsymbol {\nabla }\boldsymbol {b}$
 , and the unit vector $\boldsymbol {b}=\boldsymbol {B}/B$
 . Furthermore, an approximate value $\widetilde {p_\bot }$
 is given by solving (2.3) and ignoring the cross-product,

Figure 2(a) shows that $\mu _0$ is no longer conservative, but $\mu$
 still holds as an adiabatic invariant; figure 2(b) depicts the advancement of $p_\bot ^2$
 and $\widetilde {p_\bot }^2$
 , which demonstrates that the evolution trend is consistent with ‘collisionless pitch-angle scattering’.
Evolution of (a) the lowest magnetic moment $\mu _0$ and the new magnetic moment $\mu$
 , and (b) $p_\bot ^2$
 and $\widetilde {p_\bot }^2$
 .
.

In (2.3), the fraction includes the vectors $\boldsymbol {p}_\bot$ and $\boldsymbol {p}_C=-p_\parallel ^2\boldsymbol {\kappa }\times \boldsymbol {b}/q B$
 . The latter is the curvature drift. To better understand the collisionless pitch-angle scattering, we can consider an ideal and simple physical model. We can treat the complete perpendicular momentum vector $\boldsymbol {p}_\bot$
 as the sum of $\boldsymbol {p}_{\bot 0}$
 and $\boldsymbol {p}_C$
 , where $\boldsymbol {p}_{\bot 0}$
 spans a symmetric circle around $\boldsymbol {b}$
 . (While the value of the parallel momentum is not so large, $\boldsymbol {p}_{\bot 0}$
 is almost the initial perpendicular momentum.) The conservative magnetic moment becomes $\mu =|\boldsymbol {p}_\bot -\boldsymbol {p}_C|^2/(2 m_0 B)=|\boldsymbol {p}_{\bot 0}|^2/(2 m_0 B)$
 . With the increase of the parallel momentum, $\boldsymbol {p}_C$
 grows and becomes comparable to $\boldsymbol {p}_{\bot 0}$
 , so we cannot merely regard $\boldsymbol {p}_C$
 as the result of drift precession; it greatly changes the perpendicular momentum all the time and breaks the conservation of the lowest magnetic moment.
In CFETR, $\boldsymbol {\kappa }\times \boldsymbol {b}$ mainly tilts towards the $Z$
 -direction. The perpendicular momentum is almost in the $R$
 –$Z$
–$Z$ plane. In the beginning, the minimum is decided by $|\boldsymbol {p}_{\bot }|_{\min }=|(\boldsymbol {p}_{\bot 0}+\boldsymbol {p}_C)|_{\min }=|\boldsymbol {p}_{\bot 0}|-|\boldsymbol {p}_C|$
 and the maximum is $|\boldsymbol {p}_{\bot }|_{\max }=|(\boldsymbol {p}_{\bot 0}+\boldsymbol {p}_C)|_{\max }=|\boldsymbol {p}_{\bot 0}|+|\boldsymbol {p}_C|.$
 The minimum and the maximum of the perpendicular momentum also mainly tilt towards the $Z$
 -direction. The amplitude $A_{mp}$
 is decided by $A_{mp}=|\boldsymbol {p}_{\bot }|_{\max }-|\boldsymbol {p}_{\bot }|_{\min }=2|\boldsymbol {p}_C|$
 . With the increase of the parallel momentum, $|\boldsymbol {p}_{\bot }|_{\min }$
 decreases, $|\boldsymbol {p}_{\bot }|_{\max }$
 and $A_{mp}$
 continues to grow until $|\boldsymbol {p}_{\bot }|_{\min }$
 reaches zero and $|\boldsymbol {p}_C|$
 equals $|\boldsymbol {p}_{\bot 0}|$
 . As time goes by, $|\boldsymbol {p}_{\bot }|_{\min }$
 increases and becomes greater than zero. $|\boldsymbol {p}_{\bot }|_{\min }$
 becomes $|\boldsymbol {p}_C|-|\boldsymbol {p}_{\bot 0}|$
 and then $|\boldsymbol {p}_{\bot }|_{\min }$
 and $|\boldsymbol {p}_{\bot }|_{\max }$
 increase and the amplitude $A_{mp}$
 becomes almost a constant, i.e. $A_{mp}=2|\boldsymbol {p}_{\bot 0}|$
 . In Wang, Qin & Liu (Reference Wang, Qin and Liu2016), when the pitch angle is in the range $[-0.5,0.5]$
 , $A_{mp}$
 is almost a constant, this is because $A_{mp}$
 is nearly proportional to $p_{\perp 0}$
 , which changes a little,varying in the range around $[0.87,1]$ $p_0$
$p_0$ . In figure 3 we reveal the diagram for the rotations of the momentum when the parallel momentum of the particle is $200 m_0 c$
 . The red solid line is the motion of the cyclotron centre of the electron, and it moves from point A to point B. The coloured line denotes the endpoint of the vector of the momentum, which starts from the red line. The distance of the corresponding points between the two lines represents the relative value of the momentum. Figure 3(a,b) plots $\boldsymbol {p}_\bot$
 and panels (c,d) plot $(\boldsymbol {p}_\bot -\boldsymbol {p}_C)$
 . Clearly, the amplitude is approximately $A_{mp}= 2p_{\bot 0}=2 m_0 c$
 . In figure 3(c,d), the track of the vector $(\boldsymbol {p}_\bot -\boldsymbol {p}_C)$
 spans a symmetric circle around $\boldsymbol {b}$
 , which is the same as the rotation of $\boldsymbol {p}_{\bot 0}$
 . In figure 4(a), outputting data every $10^9$
 steps shows that the $Z$
 -component of the perpendicular momentum keeps growing, which is the result of the increase of $p_\parallel$
 . In figure 4(b), comparing the absolute value with the $Z$
 -component value of the perpendicular momentum, we demonstrate that the ranges of the perpendicular momentum and the $Z$
 -component are almost the same, which means the extremum appears while $\boldsymbol {p}_\bot$
 mainly slants towards the $Z$
 -direction.
Diagram for the rotations of the momentum vector. The red solid line is the motion of the cyclotron centre, and it moves from point A to point B. The coloured line denotes the endpoint of the vector, which starts from the red line. The distance of the corresponding points between the two lines represents the relative value of the momentum.

Evolution of (a) the $Z$ -component of the perpendicular momentum, and (b) the perpendicular momentum and the absolute value of the $Z$
 -component of the perpendicular momentum.

2.2 High-order guiding-centre orbit model with synchrotron radiation
Synchrotron radiation plays a key part in REs during their entire life cycles. More than that, in the generation of REs, experiments (Martín-Solís, Sánchez & Esposito Reference Martín-Solís, Sánchez and Esposito2010) show that the synchrotron radiation increases the threshold electric field. For a relativistic particle, the radiation-reaction force (RR-force) (Pauli Reference Pauli1958) is

and for the relativistic full equation, the RR-force can be simplified to (Hirvijoki et al. Reference Hirvijoki, Decker, Brizard and Embréus2015)

where the Larmor frequency is $\varOmega =eB/\gamma m_0$ . The characteristic time for the RR-force is

where $\epsilon _0$ is the permittivity of a vacuum. After a series of algebraic treatments of the formula, the components for the guiding-centre radiation reaction force in magnetic-field non-uniformity are derived (Hirvijoki et al. Reference Hirvijoki, Decker, Brizard and Embréus2015).
Based on the non-canonical Hamiltonian mechanics approach using the Lie perturbation method, the high-order relativistic guiding-centre equations (Liu et al. Reference Liu, Qin, Hirvijoki, Wang and Liu2018b) are derived. Besides, in Appendix A, by separating the perpendicular momentum, the equations are derived from some other physical perspectives. The high-order relativistic guiding-centre equations with synchrotron radiation are

where

and the components for the guiding-centre RR-force are

The magnetic field-line twist parameter $\tau _B$ is $\tau _B=\boldsymbol {b}\boldsymbol {\cdot }\boldsymbol {\nabla }\times \boldsymbol {b}$
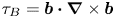 . The parallel and perpendicular gyro-radii and the modified gyro-frequency are separately defined as

We perform the simulation of the test particle under three models without radiation. The initial values are the same as section § 2.1. The energy of the electron in the snapshot of figure 5 is approximately 70 MeV after the acceleration. This signifies the comparison of the orbital trajectory of an electron with different models in one bounce period. The high-order guiding-centre model is consistent with the full orbit. Figure 6 depicts the comparison of the momentum evolution. It demonstrates that HGSA reproduces the ‘collisionless pitch-angle scattering’ phenomenon. The results confirm the applicability of the high-order guiding-centre model in a real magnetic configuration of the tokamak. Note that the evolution of the perpendicular momentum has a great influence on the process of the energy balance because of the radiation, and the modification of the perpendicular momentum is significant. Thus, for the simulation of REs, the high-order guiding-centre model is more appropriate.
Comparison of the orbital trajectory of an electron. The light blue solid line plots the relativistic full orbit, the dark blue dashed line plots the high-order guiding-centre orbit and the red solid line plots the first-order guiding-centre orbit.

Comparison of the evolution of the momentum of an electron. The light blue line plots the relativistic full orbit, the dark blue circle (hollow) points plot the high-order guiding-centre orbit and the red solid points plot the first-order guiding-centre orbit.

The perpendicular momentum is dominant for the radiation effect at a finite pitch angle (Martín-Solís et al. Reference Martín-Solís, Alvarez, Sánchez and Esposito1998). To see a clearer radiation effect, we perform a test particle simulation in which the initial momentum is set to be $p_{\bot 0}=1.7m_0 c$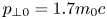 and $p_{\parallel }=200m_0 c$
 in the high-order guiding-centremodel, while $|\boldsymbol {p}_{\bot }|=|\boldsymbol {p}_{\bot 0}+\boldsymbol {p}_C|=2.4m_0 c$
 and $p_{\parallel }=200m_0 c$
 in the full orbit model. The parallel radiation could be considered as an effective electric field. Figure 7 indicates the comparison of the advancement of (a) the perpendicular momentum, (b) the equivalent electric field of parallel radiation and (c) the kinetic energy loss of an electron in the equilibrium magnetic field of the CFETR without the electric field, where the kinetic energy is $T=(\gamma -1)m_0c^2$
 . In figure 7(b), in detail, the real radiation of the electron motion has zero points, but the high-order guiding-centre model aims to decouple the motion, such that it cannot accurately simulate the details. Figure 7(c) demonstrates the kinetic energy loss separately through the full orbit model and the high-order guiding-centre model. It is clear that, under the two models, the loss is approximately equal.
Comparison of the evolution of (a) the perpendicular momentum, (b) the equivalent electric field of parallel radiation, (c) the kinetic energy loss of an electron in the equilibrium magnetic field of the CFETR without an electric field. The initial momentum is $p_{\bot 0}=1.7m_0 c,\ p_{\bot }=2.4m_0 c$ and $p_{\parallel }=200m_0 c$
 .
.

Now we carry out the simulation work including the radiation effect and the accelerating electric field. The parameter of the loop electric field is $E_l=10.0\,\textrm {V}\,\textrm {m}^{-1}$ . For a RE in CFETR, the initial momentum of the RE is $p_{\parallel 0} = 500m_0 c$
 and $p_{\bot 0} = 7.5m_0 c$
 . The initial physical location is $R=8.0\,\mathrm {m},\ \phi = 0,\ Z=0\,\mathrm {m}$
 . Figure 8 reveals the evolution of (a) the parallel momentum, (b) the equivalent electric field of parallel radiation and (c) the kinetic energy of an electron in the equilibrium magnetic field of the CFETR and the loop electric field. It shows that the basic physical process of the energy balance is consistent under the two models.
Comparison of the evolution of (a) the parallel momentum, (b) the equivalent electric field of parallel radiation, (c) the kinetic energy of an electron in the equilibrium magnetic field of the CFETR with an electric field. The initial momentum of the RE is $p_{\parallel 0} = 500m_0 c$ and $p_{\bot 0} = 7.5m_0 c$
 .
.

In the simulation work, generally, we need to set up a simulation stop time first, and this greatly affects the calculation cost. It is meaningful if the energy balance time of the electron can be calculated. For REs, we set $p_\bot /p_\parallel =\epsilon$ . We keep to the zero order in the following calculation work.
In (2.9) and (2.11), only considering energy gain and radiation dissipation, we can obtain

For the radiation dissipation term, we divide it into three parts,

First of all, we have

where $L$ is the magnetic-field non-uniformity length scale. When the radiation effect becomes dominant, the parallel momentum is far more than $m_0c$
 , giving the approximation $\gamma =\sqrt {1+(p/(m_0c))^2}\approx p_\parallel /(m_0c)$
 . We keep to zero order, i.e. keeping $part\ a$
 of the radiation term. The approximate perpendicular momentum is given in (2.5). The equation (2.13) turns out to be

Assuming that $E = E_l,B = B_0$ are constants, we can obtain the analytic solution in mathematics

The solution of (2.17) is

where $p_\parallel$ is a number that is a multiple of $m_0c$
 , and $t_0$
 is the integration constant, with $t = 0,\ p_\parallel = p_{\parallel {0}}$
 . The parameters $c_1$
 and $c_2$
 include information on the electric and magnetic fields, the geometric parameters of the device and so on. According to the asymptotic theory, taking $t \rightarrow +\infty$
 , we can figure out that the limit of $p_{\parallel \max }$
 is approximately $p_\parallel = c_1^{{1}/{4}}/c_2^{{1}/{4}}$
 . The energy saturation time can be solved by giving $p_\parallel = f p_{\parallel \max }$
 , where $f$
 is an estimation factor based on computation needs, say $f=0.9$
 or $f=0.99$
 . In figure 9, we show the comparison of the analytical solutions and simulation results under two electric fields, and they are consistent with each other. Hence, (2.18) can be used to calculate the energy saturation time and other related physical quantities.
The comparison of the momentum (kinetic energy) balance process between the simulation and analysis. The different colours show the electric fields. The points are the simulation results, and the lines represent the analytical solutions.

2.3 Applicability
This section separately focuses on the greatest variation of the following three quantities: the magnetic field $\delta \boldsymbol {B}=|(\boldsymbol {B}_{t=t_0}-\boldsymbol {B}_{t=0})|/|\boldsymbol {B}_{t=0}|$ , the maximum amplitude of the lowest magnetic moment $\delta \mu _0 =(\mu _{0t=t_0}-\mu _{0t=0})/\mu _{0t=0}$
 , i.e. the conservation of $\mu _0$
 , and the maximum amplitude of the magnetic moment $\delta \mu =(\mu _{t=t_0}-\mu _{t=0})/\mu _{t=0}$
 in one gyro-period. From the above, we know that the collisionless pitch-angle scattering is greatly influenced by the curvature of the device. For a typical configuration for the tokamak field, the smaller the major radius $R_0$
 is, the bigger the curvature is, and thus the more obvious the phenomenon is. In this section, we carry out the simulation in Experimental Advanced Superconducting Tokamak, in which the major radius is $R_0= 1.85\,\mathrm {m}$
 . The three sampling kinetic energy values are chosen as $T= 168.4\,\mathrm {MeV}(\gamma = 400)$
 , $T= 126.3\,\mathrm {MeV}(\gamma = 300)$
 and $T= 41.8\,\mathrm {MeV}(\gamma = 100)$
 . The pitch angle $p_\parallel /p_0$
 is in the range $[0,1]$
 . In figure 10, $\delta \boldsymbol {B}$
 and $\delta \mu _0$
 increase as pitch angle grows. This means that, when the parallel motion scale is close to the perpendicular motion scale (pitch $\approx 0$
 and $\approx 1$
 ), the change in the magnetic field caused by the former is more pronounced. The value of $\delta \mu$
 increases with energy, but has little to do with pitch angles. For the highly energetic particles ($\gamma = 400$
 and 300), the $\delta \boldsymbol {B}$
 values are all above $30\,\%$
 , and in our perception, this breaks the condition of conservation of the lowest magnetic moment. However, the results turn out to not quite fit with the theoretical analysis in figure 11. For the two points 0 and 1 in which the $\delta \boldsymbol {B}$
 values are both almost $40\,\%$
 , the value of $\delta \mu _0$
 is just a few per cent when the pitch approaches zero (point 0), i.e. $\mu _0$
 is still an adiabatic invariant; the value of $\delta \mu _0$
 reaches $20\,\%$
 when the pitch is around $0.5$
 (point 1), breaking the conservation of $\mu _0$
 . In fact, although the perpendicular motion has a great influence on the change of magnetic field (point 0), it has little impact on the conservation of the lowest magnetic moment. From the above, it is clear that the curvature drift leads to the fact that the parallel motion has an obvious effect on $\mu _0$
 . To sum up, in a small size tokamak, for REs, in the general energy range (probably $100\,\mathrm {MeV}$
 ), it is appropriate to use the high-order guiding-centre equations; for the very highly energetic electrons ($150\,\mathrm {MeV}$
 or more), if the pitch angle is nearly zero, the first-order guiding-centre equations are still applicable; for the case where the parallel and perpendicular momenta are both so large that the conservation of $\mu _0$
 is broken and the condition of the high-order guiding-centre equations cannot be met, the full model is more accurate.
The greatest variation of magnetic field $\delta \boldsymbol {B}$ , the maximum amplitude of the lowest magnetic moment $\delta \mu _0$
 and the maximum amplitude of the magnetic moment $\delta \mu$
 during one gyro-period. The different colours stand for different energies. The light blue points represent $p_0 =400m_0c$
 or $T=168.4\,\mathrm {MeV}$
 , the dark blue points represent $p_0 =300m_0c$
 or $T =126.3\,\mathrm {MeV}$
 and the light coral points represent $p_0 =100m_0c$
 or $T =41.8\,\mathrm {MeV}$
 .
.

Theoretical analysis of $\delta \boldsymbol {B}$ versus $\delta \mu _0$
 . The different colours stand for different energies. The light blue points represent $p_0 =400m_0c$
 or $T=168.4\,\mathrm {MeV}$
 , the dark blue points represent $p_0 =300m_0c$
 or $T =126.3\,\mathrm {MeV}$
 .
.

3 Conclusion
In this paper, focusing on synchrotron radiation, extensive numerical verifications of the validity of the high-order guiding-centre theory are given for simulations involving REs. The electron energy keeps growing until the radiation loss is balanced by the electric field acceleration. First, we push a test particle by applying the full orbit model in CFETR. The non-conservation of the lowest magnetic moment $\mu _0$ means the breakdown of the first-order guiding-centre model, but this has been addressed by considering the higher-order correction terms depending on $p_\parallel$
 and the magnetic-field curvature. Then, we mainly study the magnetic moment and the perpendicular momentum. The results show that the new expression $\mu$
 is still a good adiabatic invariant. After the analysis of the relation between the variation of the magnetic field $\delta \boldsymbol {B}$
 and the conservation of the magnetic moment, we show that the breakdown of the conservation of $\mu _0$
 is not merely the result of the large variation of $\delta \boldsymbol {B}$
 , but is the combination of $p_\parallel$
 and the large variation of $\delta \boldsymbol {B}$
 . We analyse the applicable conditions of the high-order guiding-centre equations. By dividing the perpendicular momentum into $\boldsymbol {p}_{\bot }=\boldsymbol {p}_{\bot 0}+\boldsymbol {p}_C$
 , where $\boldsymbol {p}_{\bot 0}$
 is the vector spanning a symmetric circle around $\boldsymbol {b}$
 and $\boldsymbol {p}_C$
 is the curvature drift, we explain the details of the advancement of the perpendicular momentum, especially the extremum and the amplitude, and derive the high-order guiding-centre equations in Appendix A.
The significant reason why we choose the high-order guiding-centre equations instead of the first-order guiding-centre equations lies in the radiation of the gyro-motion. Taking the synchrotron radiation into consideration, we simulate the energy saturation process of an electron under the high-order guiding-centre model. It is found that the HGSA can effectively produce the collisionless pitch-angle scattering, which dominantly affects synchrotron radiation. Synchrotron radiation plays an essential role in the life cycle of REs. The energy of REs first increases and then becomes saturated until the electric field acceleration is balanced by the radiation dissipation, and HGSA can precisely represent this process. Since the time scale of the energy saturation of REs is close to seconds, the computational cost becomes significant. In order to save costs, an analytical estimate is derived for the time it takes for synchrotron drag to balance an accelerating electric field and the provided formula has been numerically verified. Test calculations reveal that HGSA is favourable for exploiting the dynamics of REs in tokamak plasmas.
Acknowledgements
The authors acknowledge the Supercomputer Center of Dalian University of Technology for providing computing resources.
Editor Tünde Fülöp thanks the referees for their advice in evaluating this article.
Funding
This research is supported by the National Key R&D Program of China (Grant No.2022YFE03090000); the National Natural Science Foundation of China (Grant Nos. 11975068), (Grant Nos. 11925501); the Fundament Research Funds for the Central Universities (Grant No. DUT22ZD215); and U. S. Department of Energy (Grant No. DE-AC02-09CH11466).
Declaration of interests
The authors report no conflict of interest.
Appendix A
For REs, we set $p_\bot /p_\parallel =v_\bot /v_\parallel =\epsilon$ . From the simulation above, we know that the curvature drift $\boldsymbol {v}_C$
 due to the magnetic field-line curvature becomes comparable to the initial perpendicular velocity, and in one gyro-period it needs to be considered, so we treat the perpendicular velocity as the vector summation of $\boldsymbol {v}_{\bot 0}$
 and the $\boldsymbol {v}_C$
 . Besides, the grad-B drift $\boldsymbol {v}_{\boldsymbol {\nabla } B}$
 is also caused by the non-uniformity of the magnetic field, which is decided by $\boldsymbol {v}_{\boldsymbol {\nabla } B}=1/2 q v_\bot r_\bot (\boldsymbol {B}\times \boldsymbol {\nabla } B)/B^2=-1/2 v_\bot ^2 (\boldsymbol {\kappa }\times \boldsymbol {b})/{B}$
 . So, for $v_{\boldsymbol {\nabla } B}/v_\bot =\epsilon ^2$
 , the perpendicular momentum in one gyro-period is hardly affected by the grad-B drift.
For relativistic REs, in phase space $(\boldsymbol {X},p_\parallel ;\mu,\xi ;t)$ , we begin with the Lagrangian of a charged particle in an electromagnetic field,

with $\boldsymbol {B}=\boldsymbol {\nabla }\times \boldsymbol {A}$ , and the Hamiltonian is given as $H=\gamma m_0 c^2+q\varPhi (\boldsymbol {x},t)$
 . Now we explicitly separate the motion along the field from the cross-field motion through

with $\boldsymbol {b}=\boldsymbol {B}/B, \boldsymbol {c}=-\sin {\xi }\boldsymbol {e}_1-\cos {\xi }\boldsymbol {e}_2$ , in which the unit vectors $\boldsymbol {e}_1$
 and $\boldsymbol {e}_2$
 are orthogonal to $\boldsymbol {B}$
 and to each other, so that $\boldsymbol {e}_1\times \boldsymbol {e}_2=\boldsymbol {b}$
 , $\xi$
 is the gyro-phase corresponding to the $w\boldsymbol {c}$
 motion and $w$
 denotes the magnitude of $\boldsymbol {p}_{\bot 0}$
 . Defining the particle gyro-centre through

with $\boldsymbol {a}=\cos {\xi }\boldsymbol {e}_1-\sin {\xi }\boldsymbol {e}_2$ , all quantities on the right and the drift due to the magnetic-field-line curvature are evaluated at the guiding centre $\boldsymbol {X}$
 . The Lagrangian then becomes

Taking an expansion in the small parameter $\rho$ , we write

and substitute into the Lagrangian, giving


After similar treatment in White (Reference White2001), for $L_1$ , we can reduce it to

For $L_2$ , with

and the direction of $\boldsymbol {v}_C$ almost unchanged, averaging over the fast gyro-motion time scale, the $\boldsymbol {p}_C\boldsymbol {\cdot }\rm {d}(w\boldsymbol {a}/Bq )/\rm {d} t$
 term vanishes. Finally, we can obtain

from which we conclude that $w^2/2 m_0B=p_{\bot 0}^2/2 m_0B=|\boldsymbol {p}_\bot -\boldsymbol {p}_C|^2/(2 m_0 B)\equiv \mu$ is a constant of the motion.
The guiding-centre phase-space Lagrangian can be written as,

and the guiding-centre Hamiltonian is given by

where $\mu =p_{\bot 0}^2/2 m_0 B$ is a constant of the motion. For $p_\bot /p_\parallel =\epsilon$
 , we take a Taylor expansion in the small parameter $\epsilon$
 , and the approximate perpendicular momentum is given in (2.5)

With $\gamma$ approximately equalling $\sqrt {1+{p_\parallel ^2}/{m_0^2 c^2}}$
 , the gradient of the Hamiltonian is

Following from the phase-space Euler–Lagrange equations $(\textrm {{d}}/\textrm {{d} t})({\partial L}/{\partial \dot {\boldsymbol {X}}})-{\partial L}/{\partial \boldsymbol {X}}=0$ , we obtain,


where the effective electromagnetic fields

are defined in terms of the effective electromagnetic potentials

We obtain the rate of change of the variable $p_\parallel$ by taking the scalar product of (A17) with the effective magnetic field $\boldsymbol {B}^\ast$
 ,
,

where $B_\parallel ^\ast \equiv \boldsymbol {b}^\ast \boldsymbol {\cdot }\boldsymbol {B}^\ast$ . The guiding-centre velocity $\dot {\boldsymbol {X}}$
 comes from the vector product of (A17) with $\boldsymbol {b}^\ast$
 ,
,

with

and finally

where


