
The family Procyonidae was the first group of carnivorans to reach South America after the marine barrier separating North and South America disappeared ca. 4–2.5 Ma (see Woodburne et al. Reference Woodburne, Cione, Tonni, Carranza-Castañeda and Lindsay2006; Soibelzon & Prevosti Reference Soibelzon, Prevosti, Pons and Vicens2007, Reference Soibelzon, Prevosti, Ruiz-garcia and Shostell2012; O'Dea et al. Reference O'Dea, Lessios, Coates, Eytan, Restrepo-Moreno, Cione, Collins, de Queiroz, Farris, Norris, Stallard, Woodburne, Marie-Pierre Aubry, Berggren, Budd, Cozzuol, Coppard, Duque-Caro, Finnegan, Gasparini, Grossman, Johnson, Keigwin, Knowlton, Leigh, Leonard-Pingel, Marko, Pyenson, Rachello-Dolmen, Soibelzon, Soibelzon, Todd, Vermeij and Jackson2016). The presence of this family in South America is recorded from the Late Miocene to recent times; with six extinct genera described, but only two considered as valid at the present time: †Cyonasua Ameghino, Reference Ameghino1885, recorded from the Late Miocene to Early Pleistocene; and †Chapalmalania Ameghino, Reference Ameghino1908, during the Pliocene. †Cyonasua is endemic to South America and comprises ten formally named species: †C. argentina Ameghino, Reference Ameghino1885; †C. brevirrostris (Moreno & Mercerat Reference Moreno and Mercerat1891); †C. longirostris (Rovereto Reference Rovereto1914); †C. pascuali Linares, Reference Linares1981; †C. groeberi Kraglievich & Reig, Reference Kraglievich and Reig1954; †C. lutaria (Cabrera Reference Cabrera1936); †C. clausa (Ameghino Reference Ameghino1904); †C. robusta; †C. argentinus (Burmeister Reference Burmeister1891); and †C. meranii (Ameghino & Kraglievich Reference Ameghino and Kraglievich1925) (Soibelzon Reference Soibelzon2011). Despite the large number of †Cyonasua species, specimens are relatively scarce and most remain unpublished (Soibelzon Reference Soibelzon2011).
It is noteworthy that the fossil record of Procyonidae in South America has a gap of 0.9 Ma. between the early Pleistocene, when †Cyonasua is recorded for the last time, and the latest Pleistocene, when Procyon and Nasua are first recorded (Soibelzon Reference Soibelzon2011). Extant South American procyonids represent a second invasion from North or Central America occurring during the latest Pleistocene–Holocene, and are not directly related to †Cyonasua or †Chapalmalania (Soibelzon Reference Soibelzon2011; Forasiepi et al. Reference Forasiepi, Soibelzon, Gomez, Sánchez, Quiroz, Jaramillo and Sánchez-Villagra2014).
Extant procyonids are represented by six genera (Bassaricyon Allen, Reference Allen1876; Bassariscus Coues, Reference Coues1887; Nasuella Hollister, Reference Hollister1915; Potos Geoffroy Saint-Hilaire & Cuvier, Reference Geoffroy Saint-Hilaire and Cuvier1795; Procyon Storr, Reference Storr1780 and Nasua Storr, Reference Storr1780), ranging from 1–10 kg (Wilson & Mittermeier Reference Wilson and Mittermeier2009). They occupy diverse habitats, except deserts (Grzimek et al. Reference Grzimek, Schlager, Olendorf and McDade2004), and display a variety of locomotor habits and substrate preferences (McClearn Reference McClearn1992; Nowak Reference Nowak2005; Fulton & Strobeck Reference Fulton and Strobeck2007; Wilson & Mittermeier Reference Wilson and Mittermeier2009). All are able to climb; Procyon (P. cancrivorus, 8.5 kg, Canevari & Vaccaro Reference Canevari and Vaccaro2007 and P. lotor, 6.4 kg, Jones et al. Reference Jones, Bielby, Cardillo, Fritz, O'Dell, Orme, Safi, Sechrest, Boakes, Carbone, Connolly, Cutts, Foster, Grenyer, Habib, Plaster, Price, Rigby, Rist, Teacher, Bininda-Emonds, Gittleman, Mace and Purvis2009), Nasua (N. nasua, 4.3 kg, Gompper & Decker Reference Gompper and Decker1998 and N. narica Gompper, Reference Gompper1995) and Nasuella (1.34 kg, Jones et al. Reference Jones, Bielby, Cardillo, Fritz, O'Dell, Orme, Safi, Sechrest, Boakes, Carbone, Connolly, Cutts, Foster, Grenyer, Habib, Plaster, Price, Rigby, Rist, Teacher, Bininda-Emonds, Gittleman, Mace and Purvis2009) spend most of their inactive time on trees but forage on the ground (McClearn Reference McClearn1992); Bassariscus (1.01 kg, Jones et al. Reference Jones, Bielby, Cardillo, Fritz, O'Dell, Orme, Safi, Sechrest, Boakes, Carbone, Connolly, Cutts, Foster, Grenyer, Habib, Plaster, Price, Rigby, Rist, Teacher, Bininda-Emonds, Gittleman, Mace and Purvis2009) are specialised for climbing to find food and homes, but also move along cliffs and rocky outcrops (Wilson & Mittermeier Reference Wilson and Mittermeier2009); whereas Potos (3 kg, Grzimek et al. Reference Grzimek, Schlager, Olendorf and McDade2004) and Bassaricyon (1.4 kg, Helguen et al. Reference Helgen, Pinto, Kays, Helgen, Tsuchiya, Quinn and Wilson2013) are exclusively arboreal (Wilson & Mittermeier Reference Wilson and Mittermeier2009). Procyon uses its forefeet to locate and handle prey and Nasua frequently digs holes to capture subterranean prey (McClearn Reference McClearn1992; Gompper & Decker Reference Gompper and Decker1998). Because of this ecological diversity, procyonids represent an interesting model for morphofunctional analysis of their postcranial skeleton. In particular, the forelimbs which, as in other carnivores, participate not only in locomotion (including swimming and/or climbing), but also in other activities such as digging and foraging, including prey capture and manipulation (Iwaniuk et al. Reference Iwaniuk, Pellis and Whishaw1999; Andersson Reference Andersson2004; Nowak Reference Nowak2005; Fabre et al. Reference Fabre, Cornette, Slater, Argot, Peigné, Goswami and Pouydebat2013; Martín-Serra et al. Reference Martín-Serra, Figueirido and Palmqvist2014). Thus, forelimbs are potentially significant to link morphological features to ecological traits.
Furthermore, the patterns observed in an ecologically diverse sample of living Carnivora can subsequently be applied to draw inferences about the substrate preferences, locomotory mode and potential capacities of extinct taxa, such as †Cyonasua. These inferences could be drawn from morphometric analyses of the relationship between shape and function (e.g., Van Valkenburgh Reference Van Valkenburgh1987; Vizcaíno & Milne Reference Vizcaíno and Milne2002; Andersson Reference Andersson2003, Reference Andersson2004; Elissamburu & Vizcaíno Reference Elissamburu and Vizcaíno2004; Toledo et al. Reference Toledo, Bargo, Cassini and Vizcaíno2012; Samuels et al. Reference Samuels, Meachen and Stacey2013). However, there have been no extensive studies of the ecomorphological diversity of the procyonid forelimb, either in living or extinct members of the family (Andersson Reference Andersson2003; Tarquini et al. Reference Tarquini, Soibelzon and Toledo2012; Fabre et al. Reference Fabre, Cornette, Slater, Argot, Peigné, Goswami and Pouydebat2013, Reference Fabre, Goswami, Peigné and Cornette2014, Reference Fabre, Salesa, Cornette, Antón, Morales and Peigné2015; Martín-Serra et al. Reference Martín-Serra, Figueirido and Palmqvist2014; Junior et al. Reference Junior, Dos Santos, Nogueira, Abidu-Figueiredo and Santos2015) and, thus, potentially informative features have not been explored.
The goal of this work is to perform a morphometric analysis of the forelimb morphology of the extinct procyonid †Cyonasua for the first time in the context of a wide sample of living carnivorans. Preliminary body size estimations, based on allometric regression of postcranial linear dimensions (Tarquini et al. Reference Tarquini, Morgan, Soibelzon and Toledo2015), have yielded values around 19 kg. Based on their body size estimates and overall morphology, our working hypothesis is that the habits of †Cyonasua would have been similar to those of the living Procyon species; i.e., not strongly specialised for any given locomotory mode or substrate preference.
1. Materials and methods
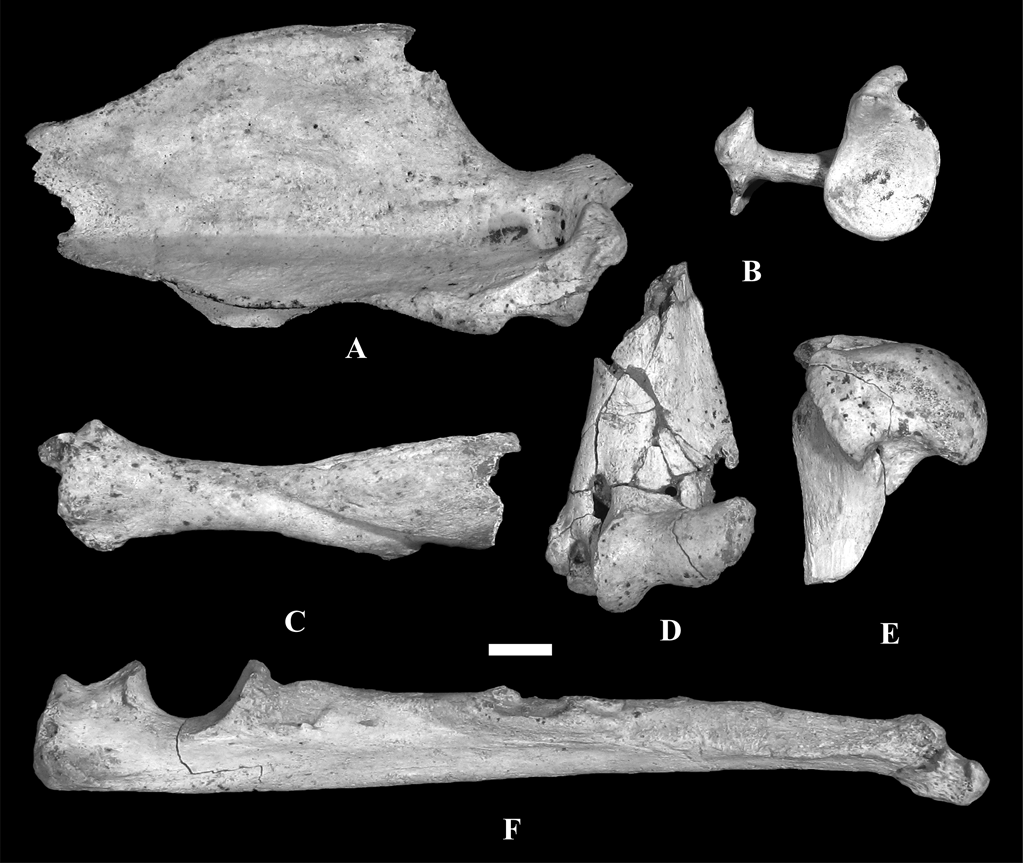
We studied the scapula, humerus, ulna and radius of MLP 04-VI-10-1 assigned to †Cyonasua sp. (Fig.1). Specimen MLP 04-VI-10-1 was recovered from a fallen block of sediment lying on the beach adjacent to a cliff in a locality known as “Alambrados”, at Miramar, Buenos Aires province, Argentina (38° 14′ 26.17″ S, 57° 45′ 48″ W; Fig. 2). Sedimentological analyses (X-rays made at Centro de Investigaciones Geológicas, UNLP-CONICET, Argentina) indicate that MLP 04-VI-10-1 comes from the lower level of the cliff and, thus, is Chapadmalalan (Late Pliocene) in age.
Remains of forelimb and pectoral girdle of †Cyonasua sp. MLP 4-VI-10-1, studied in this work: (A) right scapula, lateral view; (B) right scapula, proximal view; (C) left radius, anterior view; (D) left humerus, anterior view of distal epiphysis; (E) right humerus, medial view of proximal epiphysis; (F) left ulna, medial view. Scale bar = 1 cm.
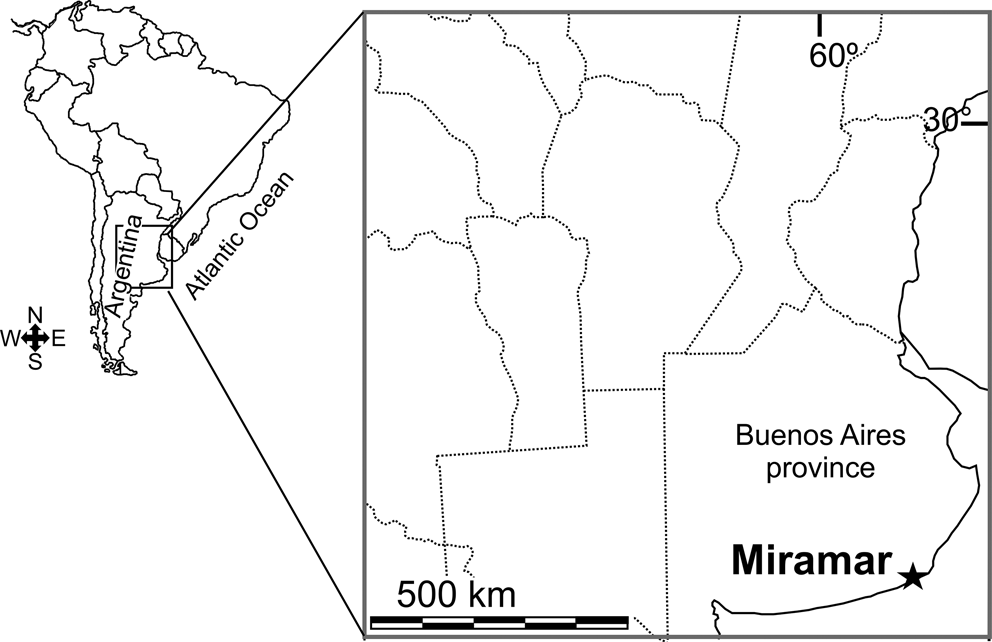
Map of South America showing the Miramar area (star) where †Cyonasua sp. was recovered.
The comparative sample consists of 87 specimens of extant mammals from 19 species belonging to seven families of the Carnivora that are representative of the ecological diversity of the order (Ewer Reference Ewer1973; Van Valkenburgh Reference Van Valkenburgh1985; Nowak Reference Nowak2005; Wilson & Mittermeier Reference Wilson and Mittermeier2009).
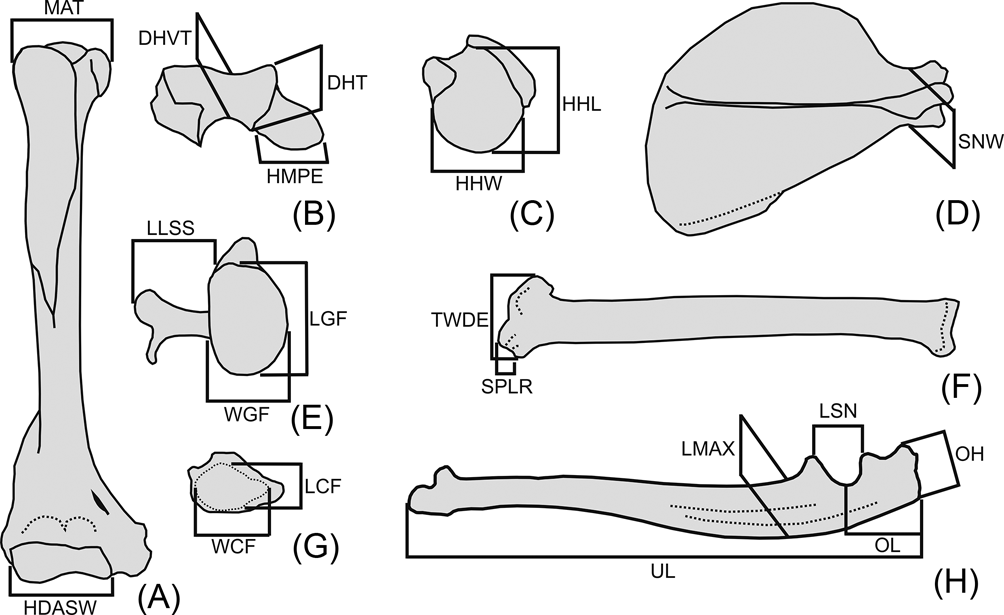
Twenty linear measurements were selected on the forelimb and pectoral girdle skeleton, based on both their availability in the fossil specimen and their potential functional significance (Fig. 3). Measurements were taken with digital calipers; geometric mean size adjustment was applied to raw measurements for size normalisation (i.e., for each individual, each raw value is divided by the geometric mean of all its measurements; Mosimann Reference Mosimann and James1979). The size-normalised data were analysed by principal component analysis (PCA) of the correlation matrix of all taxa, to explore shape variation and segregation in the morphospace.
Abbreviations and definition of osteological measurements used in this work. (A) right humerus, anterior view; (B) right humerus, distal view with anterior aspect upward; (C) right humerus, proximal view with anterior aspect upward; (D) right scapula, lateral view; (E) right scapula, glenoid view; (F) right radius, anterior view; (G) right radius, distal view with anterior aspect upward; (H) left ulna, medial view. Abbreviations: Humerus (A–C): DHT = depth of humeral trochlea; DHVT = depth of the humeral trochlear valley; HDASW = humeral distal articular surface width; HHL = humeral head length; HHW = humeral head width; HMPE = medial protrusion of medial epicondyle; MAT = maximum breath between tubercles. Scapula (D, E): LGF = length of the glenoid fossa; LLSS = lateral length of the scapular spine; SNW = scapular neck width; WGF = width of the glenoid fossa. Radius (F, G): LCF = antero-posterior length of carpal fossa; SPLR = length of styloid process of the radius; TWDE = transverse width of the distal radial epiphysis; WCF = latero-medial width of carpal fossa. Ulna (H): LMAX = antero-posterior maximum length at midshaft of the ulna; LSN = proximo-distal length of semilunar notch; OH = olecranon height; OL = olecranon length; UL = ulnar length.
Each taxon was classified a priori by locomotor mode and substrate preference (six categories), grasping ability (four categories) and digging ability (two categories), based on available behavioural information (Table 1). Locomotor and substrate preferences (L & SP) modes were adapted from Hildebrand (Reference Hildebrand1988), Schutz & Guralnick (Reference Schutz and Guralnick2007) and Van Valkenburgh (Reference Van Valkenburgh1987) as follows:
(1) tree-dweller: species that spend the majority of time on trees;
(2) scansorial or semi-arboreal: species that spend time both on trees and on the ground without a clear preference for either one;
(3) terrestrial-climber: species that spend the majority of their time on the ground and only climb for refuge or eventual feeding;
(4) terrestrial-generalist: species that move on the ground but without any specialization, rarely or never climb or run fast;
(5) terrestrial-cursorial: species that travel far or fast on the ground; and
(6) semi-aquatic: species that swim skillfully and can dive underwater.
List of species used in the analyses with respective substrate preference and locomotory mode, grasping ability and digging ability. References: 1Canevari & Vaccaro Reference Canevari and Vaccaro2007; 2Castillo et al. Reference Castillo, Luengos Vidal, Caruso, Lucherini and Casanave2013; 3Fabre et al. Reference Fabre, Cornette, Slater, Argot, Peigné, Goswami and Pouydebat2013; 4Gommper 1995; 5Gompper & Decker Reference Gompper and Decker1998; 6Grzimek et al. Reference Grzimek, Schlager, Olendorf and McDade2004; 7Helguen et al. Reference Helgen, Pinto, Kays, Helgen, Tsuchiya, Quinn and Wilson2013; 8Jones et al. Reference Jones, Bielby, Cardillo, Fritz, O'Dell, Orme, Safi, Sechrest, Boakes, Carbone, Connolly, Cutts, Foster, Grenyer, Habib, Plaster, Price, Rigby, Rist, Teacher, Bininda-Emonds, Gittleman, Mace and Purvis2009; 9Kasper et al. Reference Kasper, Soares and Freitas2012; 10McClearn Reference McClearn1992; 11Presley Reference Presley2000; 12Poglayen-Neuwall & Toweill Reference Poglayen-Neuwall and Toweill1988; 13Salesa et al. Reference Salesa, Siliceo, Antón, Abella Pérez, Montoya Bello and Morales2006; 14Trapp Reference Trapp1972; 15Van Valkenburg Reference Van Valkenburgh1987; 16Wilson & Mittermeier Reference Wilson and Mittermeier2009. When no reference is indicated, category is based on personal observations.
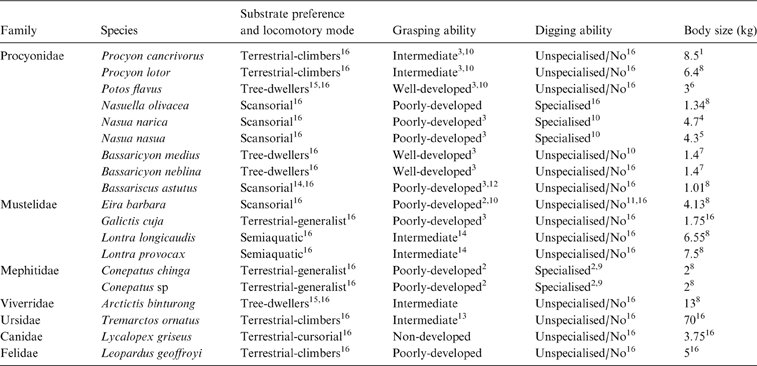
Regarding grasping ability (GA), taxa were grouped into four categories as described by Fabre et al. (Reference Fabre, Cornette, Slater, Argot, Peigné, Goswami and Pouydebat2013), following published information (e.g., Poglayen-Neuwall & Toweill Reference Poglayen-Neuwall and Toweill1988; Taylor Reference Taylor and Gittleman1989; McClearn Reference McClearn1992; Presley Reference Presley2000; Castillo et al. Reference Castillo, Luengos Vidal, Caruso, Lucherini and Casanave2013). GA categories are:
(1) well-developed GA: species that can grasp objects using only one hand;
(2) intermediate GA: species able to grasp objects only by using both forefeet at once, and have fine control of digit movements;
(3) poorly-developed GA: species with little or no manipulation of food with their forefeet alone; they frequently use their paws in combination with the ground to achieve manipulation and grasp is mainly used for climbing; and
(4) non-developed GA: species with no grasping ability.
The categories considered for digging ability (DigA) are:
(1) specialised DigA: species that dig for prey and, also, to build their burrows, with well-developed forelimbs armed with long claws;
(2) unspecialised/no DigA: species able to dig in soft ground to build their burrows, but without morphological specialisation, and species with no DigA.
The classification of studied taxa according to these variables is detailed in Table 1.
Significant differences between L & SP categories across taxa were assessed using multivariate analysis of variance (MANOVA) and a posteriori multiple comparisons made using Bonferroni correction. Multivariate canonical analysis (discriminant analysis, DA) was used to evaluate the contribution of the morphometric variables considered to the differentiation among L & SP, GA and DigA categories, and to obtain probable category assignments for †Cyonasua sp. regarding each of these abilities. Analyses were carried out using the software PAST 3.04 (Hammer et al. Reference Hammer, Harper and Ryan2001) and Statistica 7.0 (StatSoft Inc.). Graphics for Figure 4 were performed in R with package “ggplot2” (Wickham Reference Wickham2009).
1.1. Carnivorans used for comparisons
1.1.1. Repository abbreviations
AMNH, American Museum of Natural History, New York, USA; EMG, Colección privada de “Enrique Manuel Gonzalez”, Sección Mamíferos del Museo Nacional de Historia Natural (MNHN, Montevideo, Uruguay); MACN, Museo Argentino de Ciencias Naturales ‘Bernardino Rivadavia’; Ciudad Autónoma de Buenos Aires, Argentina; MLP, Departamento Científico de Paleontología de Vertebrados, Museo de La Plata, La Plata, Argentina; MNHN, Museo Nacional de Historia Natural, Montevideo, Uruguay; USNM, National Museum of Natural History, Smithsonian Institution, Washington, DC, USA; ZOOBA-M, Zoológico de Buenos Aires, sección Mamíferos, Ciudad Autónoma de Buenos Aires, Argentina; ZVC-M, Facultad de Ciencias, Universidad de la República, Montevideo, Uruguay.
1.1.2. Specimens
Procyonidae: Procyon cancrivorus MACN 32254, MLP 2110, MLP 1.I.03.25, MNHN 1229, MNHN 1268, MNHN 2714, MNHN 3146, MNHN 3264, MNHN 3285;
Procyon lotor AMNH 135185, AMNH 237438, AMNH 238271, AMNH 245498, AMNH 245620, MACN 23573;
Potos flavus AMNH 266597, AMNH 266599, AMNH 267050, AMNH 267607, AMNH 267608, MLP 1740, ZVC-M 5730;
Nasuella olivacea USNM 372855;
Nasua narica AMNH 14062, USNM A 22810, USNM 49644, USNM 257314;
Nasua nasua AMNH 134007, AMNH 255871, AMNH 30203, MACN 5.12, MACN 33269, MACN 25862, ZOOBA-M-0084, ZOOBA-M-0085;
Bassaricyon medius USNM 305748, USNM 305749, USNM 310666, USNM 307037, USNM 598997;
Bassaricyon neblina USNM 598996;
Bassariscus astutus AMNH 135963, AMNH 135965, AMNH 135966, AMNH 137030, AMNH 137053.
Mustelidae: Eira barbara MLP 1013, MNHN 5518, AMNH 95374, AMNH 133953;
Galictis cuja MACN 23519, MLP 2020, MLP 15.V.97.42, MNHN 1158, MNHN 2548, MNHN 2696, MNHN 3233;
Lontra longicaudis EMG 1971, MACN 71, MACN 47218, MLP 1959;
Lontra provocax MACN 20821.
Mephitidae: Conepatus sp. MLP 1015, MLP 1.II.95.1;
Conepatus chinga MACN 28.20.
Viverridae: Arctictis binturong AMNH 22906, AMNH 35469, AMNH 90279, AMNH 119600, AMNH 197252.
Ursidae: Tremarctos ornatus MLP 1.I.03.62.
Felidae: Leopardus geoffroyi MLP 1884, MLP 1998, MLP 9.X.92.1, MLP 20.V.02.1, MLP 27.XII.01.18, MLP 27.XII.01.17, MLP 27.Xll.01.22.
Canidae: Lycalopex gymnocercus MACN 23910, MACN 24259, MACN 33267, MACN 34317, MLP 190, MLP 1967, MLP 15.V.96.5;
Lycalopex griseus MLP 1889, MLP 1903.
2. Results
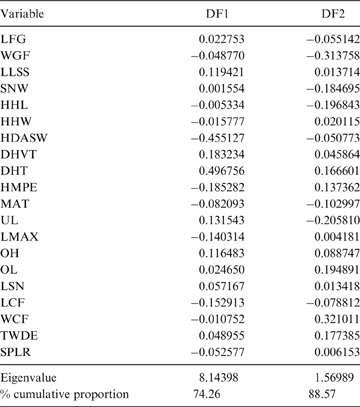
The first two principal components (PC) explain 38.64 % of the total variation of the sample (PC1: 21.57 %; PC2: 17.07 %; Table 2); the relatively small proportion of explained variance is to be expected because of the size-normalisation employed. As presented in Table 2, the variables with highest loading on PC1 were depth of the humeral trochlear valley (depth of humeral distal articular surface, DHTV), proximodistal length of the semilunar notch (LSN), maximum anteroposterior length of the ulnar diaphysis (LMAX) and depth of the humeral trochlea (DHT). Thus, the taxa with positive scores on this axis possess humeri with relatively broad humeral valleys and more distally projected trochlea, and ulnae with relatively wide semilunar notches and anteroposteriorly narrower diaphysis; whilst those with negative scores have opposite features. With respect to PC2, the variables with higher loading were humeral distal articular surface width (HDASW) and ulnar length (UL). Thus, the taxa with positive scores on the second axis have relatively wide humeral distal articular surfaces and relatively short ulnae, whilst those with negative scores present opposite features. In the morphospace of the first two PCs, most taxa were clearly grouped by genus, and generally separated from the others, except the overlapping scansorial and tree-dwelling species. Furthermore, the distribution of taxa shows that neither PC is correlated with body size; for instance, on Figure 4 it can be observed that along PC1, Tremarctos ornatus (70 kg) is near the small kinkajou Potos flavus (3 kg).
Contribution of the variables to each principal component (PC).
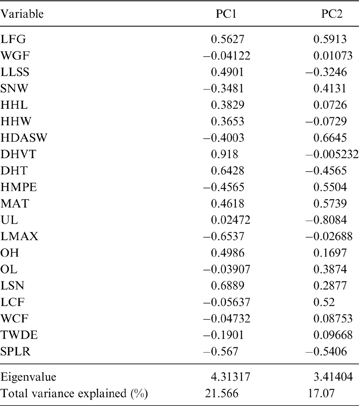
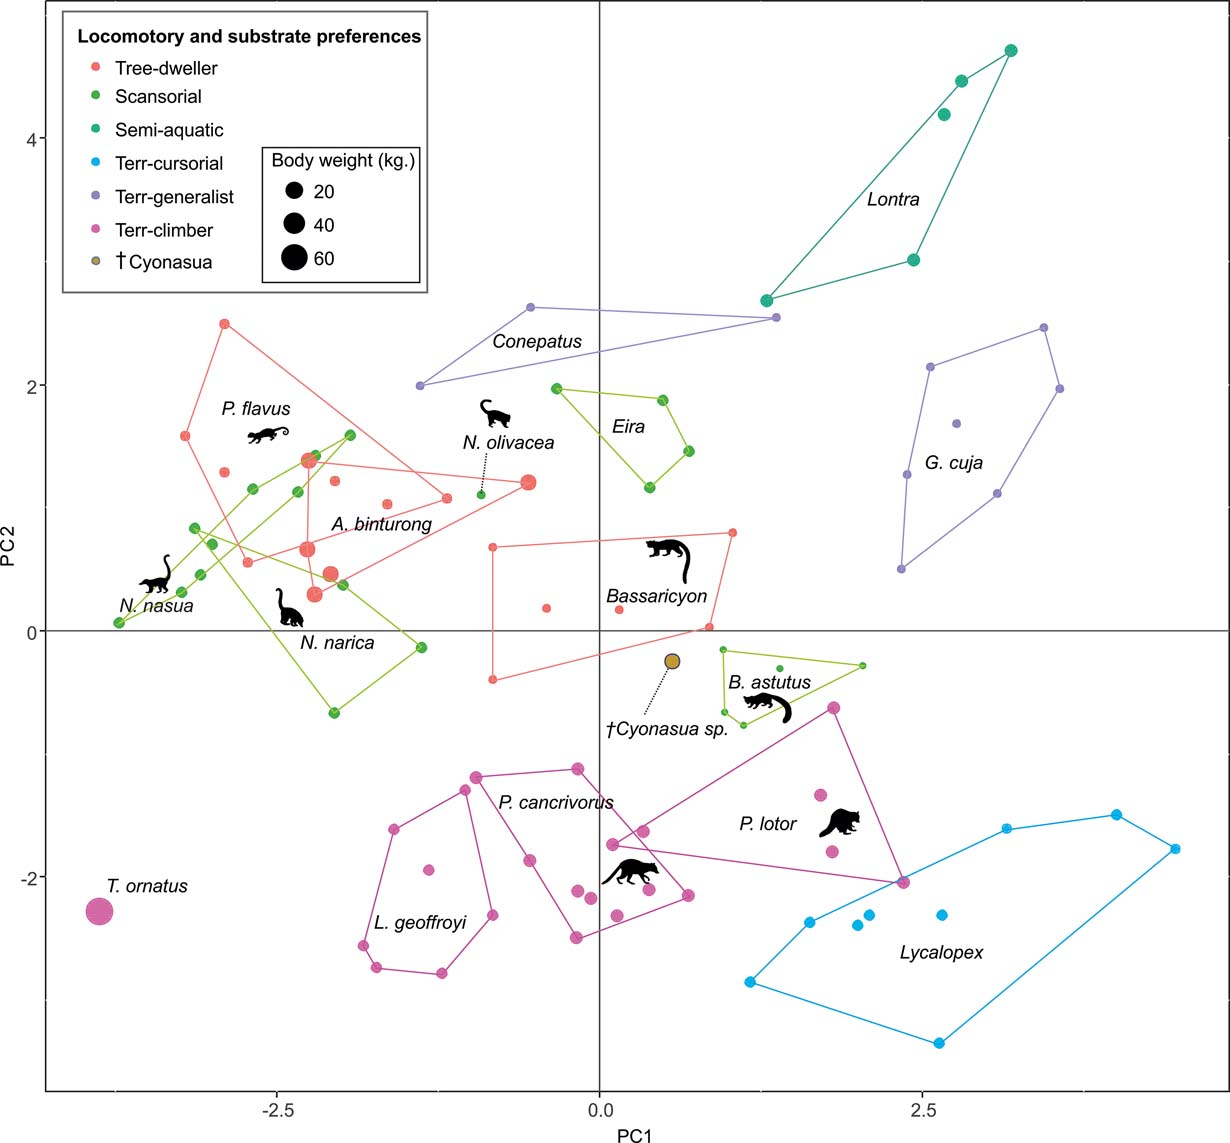
Results of PCA of living carnivorans and †Cyonasua sp. MLP 4-VI-10-1. Polygons group genera or species with their scientific names. Members of Procyonidae are identified by their silhouettes. Body mass represented by the size of circles; locomotor and substrate preferences mode are indicated by different colours (see key).
2.1. Locomotor and substrate preferences
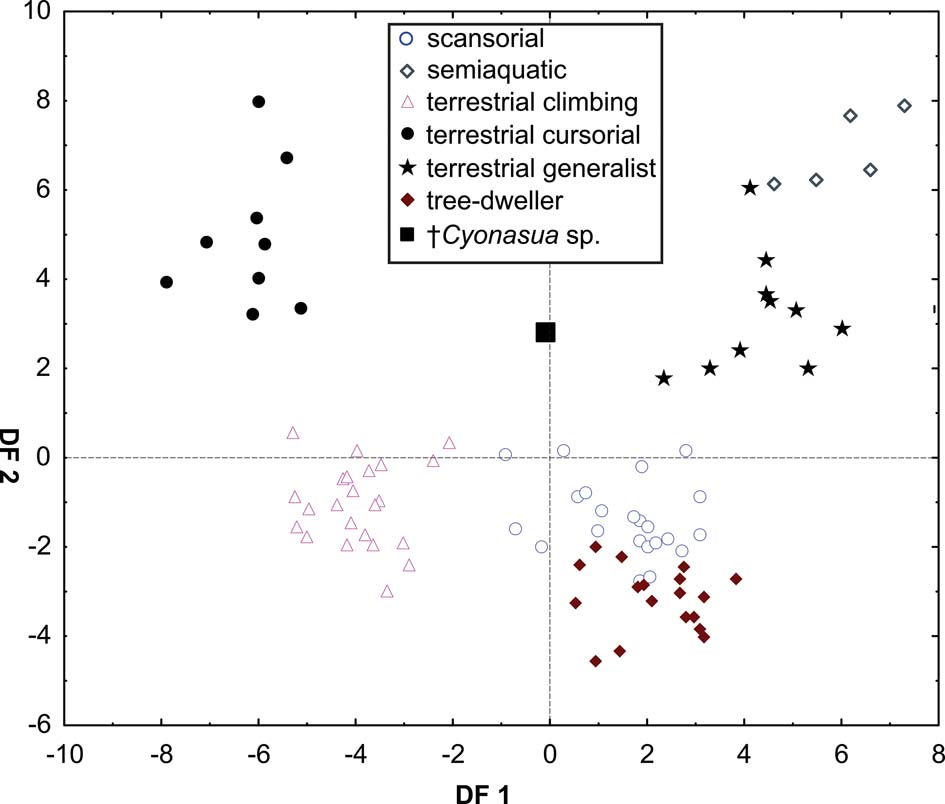
The taxa were arranged in a gradient from terrestrial-cursorial (positive PC1 and negative PC2 scores) to tree-dwelling and scansorial forms (negative PC1 and positive PC2 scores), with terrestrial-climbing, terrestrial-generalist and semi-aquatic taxa distributed between these extremes; without any visible pattern related to body size. Positive PC1 values were occupied by the terrestrial-cursorial Lycalopex griseus and Ly. gymnocercus, the terrestrial-generalist G. cuja and the semiaquatic Lontra longicaudis and Lo. provocax; and negative values were occupied mostly by tree-dwellers (Potos flavus, Arctictis binturong), the scansorials Nasua nasua and N. narica and terrestrial-climbing taxa (Tremarctos ornatus, Leopardus geoffroyi). Taxa with a variety of substrate preference and locomotory modes, including the terrestrial-generalist Conepatus, the terrestrial-climbing Procyon cancrivorus, the scansorial Eira barbara and the tree-dweller Bassaricyon, presented near-zero scores on this axis. Along PC2, two distinct major groups include, on the one hand and towards positive values, semiaquatic, terrestrial-generalist, and several scansorial and tree-dwelling genera (Fig. 4); on the other hand, terrestrial-climbers and terrestrial-cursorials had negative PC2 scores. In this context, †Cyonasua sp. occupied a unique position in the morphospace; its humerus, with a relatively wide trochlear valley and a distally projected trochlea, is combined with a moderately narrow ulna that presents a medium-width semilunar notch. Its position was among other procyonids such as the scansorial Bassariscus and the tree-dwelling Bassaricyon and, at the same time, relatively near to the terrestrial-climbing Procyon species.
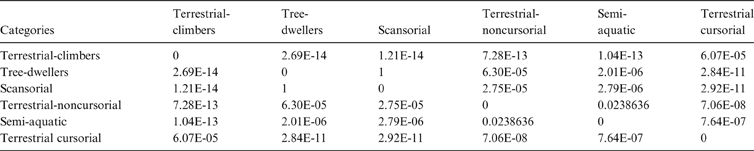
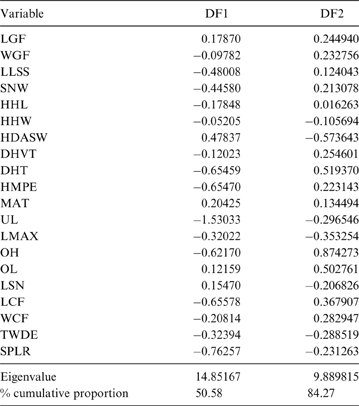
The MANOVA showed statistically significant differences among L & SP (Wilks' lambda = 0.054, p < 0.001); pairwise comparisons demonstrated significant differences between the terrestrial-climbing, terrestrial-generalist, terrestrial-cursorial and semi-aquatic categories, but not between tree-dwellers and scansorials (see Table 3). In agreement with these results, the DA showed good differentiation between terrestrial-cursorial, terrestrial-climbing, terrestrial-generalist and semiaquatic categories, but overlapping between the scansorial and tree-dwelling taxa. The variables that most contributed to the discrimination of categories were ulnar length (UL), length of the radial styloid process (SPLR), antero-posterior length of the carpal fossa (LCF), depth of the humeral trochlea (DHT) and medial protrusion of the humeral medial epicondyle (HMPE) (first root), and olecranon height (OH) (second root) (Table 4). Posterior probabilities classified †Cyonasua sp. as terrestrial-generalist (terrestrial-generalist: ∼0.8; terrestrial-climber: ∼0.1 and scansorial: ∼0.1) (Fig. 5).
Pairwise comparisons among substrate preferences and locomotory modes. Wilks' lambda = 0.054; P < 0.0001
Standardised discriminant coefficients for substrate preferences and locomotory mode.
Scatterplot of first two axes of a discriminant analysis of substrate preference and locomotory modes.
2.2. Grasping ability
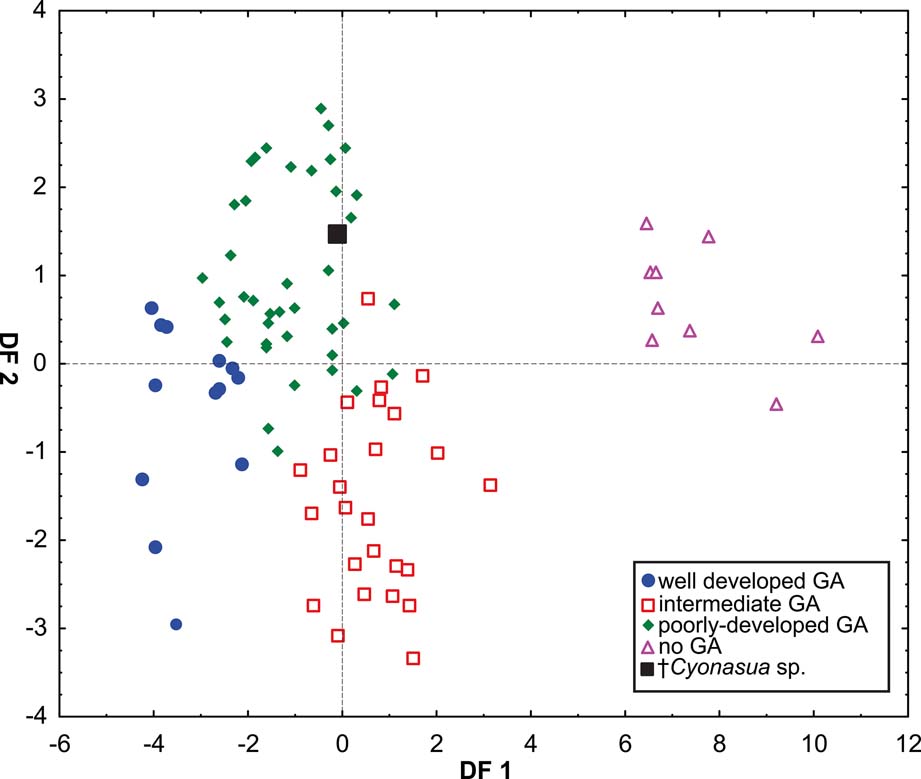
The DA showed differences amongst all GA categories (Wilks' Lambda: 0.0188837, p < 0.0001) Fig 6). The variables that most contributed to the discrimination were depth of the humeral trochlea (DHT), width of the humeral distal articular surface (HDASW) (first root), and latero-medial width of the carpal fossa of the radius (WCF) (second root) (Table 5). Posterior probabilities assigned †Cyonasua sp. to the poorly developed GA category (p >0.99).
Scatterplot of first two axes of a discriminant analysis of grasping ability.
Contribution of the variables to each discriminant function for grasping ability.
2.3. Digging ability
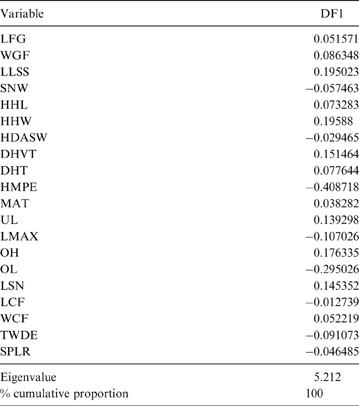
The two DigA categories were well differentiated (Wilks' Lambda = 0.1609736, p < 0.00001), with no overlap. The variables that most contributed to discrimination were medial protrusion of the humeral medial epicondyle (HMPE) and olecranon length (OL) (Table 6). The taxa with greater digging ability (specialised-DigA: Nasuella olivacea, Nasua nasua, N. narica and Conepatus) occupied extreme negatives scores (from −6.6 to −3.4) and were associated with a well-protruding medial epicondyle and long olecranon; the unspecialised (no-DigA) taxa had near zero and positive scores (from −1.04 to 3.53), reflecting a scarcely protruding medial epicondyle and shorter olecranon. Posterior probabilities assigned †Cyonasua sp. to the no-DigA category (p = 1).
Contribution of each variable to discriminant function for digging ability.
3. Discussion
3.1. Locomotory and substrate preference
Although several authors (see Grzimek et al. Reference Grzimek, Schlager, Olendorf and McDade2004; Nowak Reference Nowak2005) have classified procyonids as good climbers with a generalised morphology, this analysis showed morphological differences related to their substrate preferences and locomotory mode. As mentioned above, body size was not detected as being a primary influence for substrate preference patterns. The skeletal morphology of Procyon and Nasua shows features well suited for terrestrial locomotion and, to a lesser extent, for climbing and moving in trees. In particular, Procyon has an elongated ulna and narrow distal humeral articular surface, which have been primarily related to ground locomotion (Andersson Reference Andersson2004; Samuels et al. Reference Samuels, Meachen and Stacey2013). However, in Nasua, traits such as the medium distal extension of the humeral trochlea, the moderately deep trochlear valley of the humerus and the dimensions of the semilunar notch, differ from the condition observed in forms whose forelimbs are used primarily for running and optimised for parasagittal movement (e.g. Lycalopex). In addition, Nasua, considered as both scansorial and a ground-dweller (McClearn Reference McClearn1992; Glaston Reference Glaston1994; Beisiegel Reference Beisiegel2001), presents certain features similar to those of tree-dwellers (e.g., Potos), including a wide antero-posterior ulnar shaft, required for insertion of several flexor muscles that function in both climbing and digging (Stalheim-Smith Reference Stalheim-Smith1984; Vizcaíno & Milne Reference Vizcaíno and Milne2002; Toledo et al. Reference Toledo, Bargo and Vizcaíno2013).
The intermediate position of †Cyonasua sp. in the PCA morphospace reflects a morphology associated with some stability of the elbow articulation and relatively restricted lateromedial mobility; but not as much as the condition of cursorials, in which movements are restricted to the antero-posterior plane (hinge-like elbow joint) (Taylor Reference Taylor1974; Andersson Reference Andersson2004). Although it does not possess full scansorial and tree-dweller features, the moderately thick ulnar diaphysis of †Cyonasua sp. suggests considerable surface area for attachment of carpal and digital extensor and flexor muscles which are, as mentioned above, involved in arboreal locomotion and/or active use of the forefeet (Davis Reference Davis1964; Fleagle Reference Fleagle1998; Evans & De Lahunta Reference Evans and De Lahunta2013). The pairwise comparisons and DA showed that no significant differences exist between tree-dwellers and scansorial taxa, at least regarding the traits measured in this work. This could be a reflection of the fact that the forelimb and pectoral girdle do not provide enough information to separate categories with intermediate features (Samuels et al. Reference Samuels, Meachen and Stacey2013); indeed, similar results have been obtained in previous studies (Ercoli et al. Reference Ercoli, Prevosti and Álvarez2012). In addition, as previously mentioned, climbing and digging activities are, to some extent, associated with similar musculoskeletal morphological features (Stalheim-Smith Reference Stalheim-Smith1984; White Reference White, Kay, Madden, Cifelli and Flynn1997; Argot Reference Argot2001; Sargis Reference Sargis2002; Candela & Picasso Reference Candela and Picasso2008).
†Cyonasua sp. does not fall into any of the previously defined morphospaces regarding L & SP groups, although our results suggest that its capabilities could be similar to those of the terrestrial-generalists Galictis cuja and Conepatus. Its known skeletal morphology presents similarities to species that occupy a variety of habitats, and whose forelimbs are moderately specialised for running, galloping and digging and, to a lesser extent, for climbing and manipulating prey (Yensen & Tarifa Reference Yensen and Tarifa2003; Donadio et al. Reference Donadio, Di Martino, Aubone and Novaro2004; Wilson & Mittermeier Reference Wilson and Mittermeier2009; Ercoli et al. Reference Ercoli, Álvarez, Stefanini, Busker and Morales2014). It is worth noting that the variables contributing to the separation between locomotory and substrate preference modes are not easy to integrate into a straightforward morphofunctional interpretation. Features associated with the tree-dweller and scansorial categories, such as the medial protrusion of the medial epicondyle, were associated in the discriminant analysis with traits related to cursorial habits, such as ulnar length and depth of the humeral trochlea. This is partly to be expected, as the forelimb, which has often been used as a good indicator of locomotor ecology (Gonyea Reference Gonyea1978; Van Valkenburgh Reference Van Valkenburgh1987; Argot Reference Argot2001; Croft & Anderson Reference Croft and Anderson2008), also participates in other activities, as discussed below.
3.2. Grasping ability
In addition to playing important roles in posture and locomotion, the forelimb also participates in foraging and other activities. In this sense, manual dexterity and joint stability during locomotion appear to be mutually exclusive functions (Andersson Reference Andersson2004). The use of the forelimbs for grasping is very common among carnivorans, especially in those that show an arboreal life (Fabre et al. Reference Fabre, Cornette, Slater, Argot, Peigné, Goswami and Pouydebat2013). Thus, it should be expected that species with tree-dwelling (e.g. P. flavus, B. neblina, B. medius and A. binturong), scansorial (N. nasua, N. narica, amongst others) and terrestrial-climbing (P. cancrivorus, P. lotor and L. geoffroyi) locomotory modes are also capable of grasping to some extent.
Our results show that species without grasping ability (non-GA ability, such as pampas foxes) are wide apart from those able to grasp, which are also, significantly, those that show some association with arboreal substrates. Discrimination was mostly correlated with variables associated with elbow joint stability (DF1); thus, tree-dwellers (Potos and Bassaricyon) with well-developed grasping ability showed traits related to a poorly stabilised joint and pronation–supination capability (Fabre et al. Reference Fabre, Cornette, Slater, Argot, Peigné, Goswami and Pouydebat2013). On the other hand, the non-grasping forms, which included the cursorial Lycalopex, were associated with a narrower and deeper humeral articular surface, indicating a stabilised joint and restricted pronation–supination movements. The second discrimination axis (DF2) was associated mainly with the width of the distal radial articular surface, which is involved in wrist movement and pronation–supination movements (Andersson Reference Andersson2003). This factor separated species with poor or no grasping ability, which were associated with a medio-laterally wide articular surface for the scapholunar that could reduce the medio-lateral deviation of the wrist (Lynch Reference Lynch2012). Given that the variables that contributed to group separation are concordant with this morphofunctional interpretation, it is possible to infer, with some confidence, that †Cyonasua sp. would present a moderately stabilised elbow joint and restricted (at least latero-medially) wrist movement and, thereby, poorly-developed grasping ability, but not so limited as to allow it to be classified as no-GA.
3.3. Digging ability
The majority of species in our comparative sample display some degree of digging ability, either in building sheltering burrows or for foraging (Nowak Reference Nowak2005). Thus, we established only two categories (specialised vs. non-specialised) to better understand the reflection of this specialisation on skeletal morphology. It was easy to differentiate DA and DigA amongst the groups. The variables (medial protrusion of medial epicondyle and olecranon length), which present negative loads, are strongly associated with mechanical advantage of the muscles involved in elbow extension and manual and digital flexion (Taylor Reference Taylor1974; Vizcaíno et al. Reference Vizcaíno, Fariña and Mazzetta1999) which, in turn, are directly related to development of forces during digging (Elissamburu & Vizcaíno Reference Elissamburu and Vizcaíno2004). Accordingly, specialised diggers such as Nasua and Conepatus occupied high negative values, whilst all other species (unspecialised/no-DigA) had low negative to positive scores. Thus, the position of †Cyonasua sp. suggests unspecialised digging ability.
3.4. Summary
In summary, all the analyses performed here point to the interpretation of †Cyonasua sp. as having a moderately stabilised elbow joint with poor pronation–supination capabilities, although some climbing skills, associated with its restricted grasping ability, cannot be ruled out. Although †Cyonasua was larger than any recent procyonid species, eventual climbing for some activities (e.g., rest, protection or foraging) was allowed for by its locomotor apparatus. We propose that †Cyonasua sp. could have had generalised habits. This agrees with a previous analysis (Tarquini et al. Reference Tarquini, Soibelzon and Toledo2012), in which †Cyonasua sp. was found to be similar to the extant Procyon, as both genera were close in terms of substrate preference and locomotory mode, as well as grasping ability, and both are non-specialised diggers.
The capabilities hypothesised herein for †Cyonasua are in agreement with what it is known about the plant community occurring during the Chapalmalalan. Erra et al. (Reference Erra, Osterrieth, Morel, Fernández Honaine, Ballent, Artabe and Tortello2010) reported palaeocommunities dominated by palms (Arecaceae), as well as by C4-type Gramineae and Ulmaceae, Celtidaceae and Moraceae from silicophytoliths in palaeosoils in the upper section of the Chapadmalalan. These plants would indicate bushy savannas with a dry season and a temperature of over 10°C in the cold season. The Chapadmalalan fauna is very diverse, indicating disparate environments; e.g., the presence of argyrolagid marsupials and abundance of fossorial rodents, interpreted as indicators of arid and semi-arid conditions, as well as certain didelphid marsupials related to conditions similar to the current ones, but rainier and with the presence of gallery forests or forest patches (Cione et al. Reference Cione, Gasparini, Soibelzon, Soibelzon, Tonni, Rabassa, Lohman, Notholt, Mysak and Unnithan2015).
4. Conclusions
– Our analysis shows that the forelimb and pectoral girdle features of carnivorans studied in this work allow for differentiation of most of the a priori categories used in this work.
– †Cyonasua sp. occupied a unique position in the PCA morphospace, which suggests that its forelimb was somewhat different in morphofunctional patterns as compared to the extant carnivorans included in our sample.
– According to the analyses of substrate preference and locomotory mode, †Cyonasua was not a specialised form but, rather, generalised. However, it would have possessed some degree of grasping ability compatible with climbing.
– Although †Cyonasua seems not to have been a specialised digger, its morphology does not rule out some digging capacity.
5. Acknowledgments
We thank A. I. Olivares and M. Reguero (MLP), D. Flores and S. Lucero (MACN), E. M. González (MNHN), S. Riverón, Facultad de Ciencias (Udelar), E. Westwig (AMNH) and D. P. Lunde and J. Ososky (NMNH) for kindly providing access to the collections under their care. We also thank R. Fariña and S. Vizcaíno for valuable suggestions on an early version of this MS. JT would like to thank the American Museum of Natural History's Theodore Roosevelt Memorial Fund for financial support of the research on North American mammals and CONICET for grant support. This is a contribution to projects PICT 0804 and PIP 0436.


