

Beverage intake can play an important role in total energy intake and also in regard to dietary quality and nutrient intake in general( Reference Dennis, Flack and Davy 1 – Reference Paulsen, Myhre and Andersen 4 ). Several food surveys including beverage intake have been published in Sweden( 5 – Reference Ax, Lemming and Becker 12 ), but only a few have analysed the choice of beverage per meal and their contribution to energy intake( Reference Ax, Lemming and Becker 6 ). Beverages such as milk are important for the intake of calcium( Reference Huth, Fulgoni and Keast 13 – Reference Coudray 15 ), while sugar-sweetened beverages (soft drinks) contribute to the intake of added sugars( Reference Huth, Fulgoni and Keast 13 ). During recent years, researchers in several countries have shown that the contribution of beverage energy to overall energy intake can be increasing the risk of ill health( Reference Paulsen, Myhre and Andersen 4 , Reference Rothenberg, Tognon and Lissner 14 , Reference Nikpartow, Danyliw and Whiting 16 – Reference An 20 ). Previous studies have also shown different patterns for weekend days and weekdays( Reference Paulsen, Myhre and Andersen 4 ) and by gender( Reference Nikpartow, Danyliw and Whiting 16 , Reference Gibson and Shirreffs 19 , Reference An 20 ). Consumption data on drinks have also been published from different sources showing an increasing consumption of sugar-sweetened beverages in Sweden while milk consumption is decreasing( Reference Statens Jordbruksverk 21 ). High alcohol intake is associated with different health problems( Reference Rehm, Baliunas and Borges 22 ). Alcohol consumption in Sweden has gone down by 8 % in the period 2007 to 2016( 23 ) to a total consumption of 9·04 litres of pure alcohol per year.
Recent reviews point towards beverages providing an increasing proportion of the energy in the Westernized diet over the past 20 years( Reference Poppitt 24 – Reference Wirfalt, Drake and Wallstrom 26 ). Previous publications on energy intake from foods and drinks reveal alarmingly high proportions of daily energy originating from drinks( Reference Poppitt 24 , Reference Kumar, Pan and Park 27 ).
The consumption of soft drinks (sugar-sweetened beverages including sodas and cordials) has increased during the last decade( 5 ) in the Western world and up to 9 % (USA) of total energy intake( Reference Wang, Lemon and Olendzki 17 ) originates from sugar-sweetened beverages or soft drinks. Soft drinks are thus significant sources of energy in the diet( Reference Wang, Lemon and Olendzki 17 , Reference An 20 ). They can contribute to obesity and non-communicable diseases, such as type 2 diabetes and CVD, related to their excess content of added sugars and energy( Reference Malik, Popkin and Bray 28 ). Also, according to previously published data from the Riksmaten 2010–11 study( 5 ), the Swedish population consumed a mean of 112 (sd 196) ml of soft drinks daily and the total mean sugar intake from drinks was 7·7 % of total energy. This is an amount that contributed significantly to the total sugar intake, which was above the recommended level( 29 ). An increased consumption of water has also been shown, especially bottled water( Reference Popkin 30 ). In Norway it was recently shown that women and young age groups had a high consumption of bottled water( Reference Paulsen, Myhre and Andersen 4 ). Moreover, previous studies using Riksmaten 2010–11 data have pointed to the importance of beverages as nutrient sources, such as juice as a source of folate in Sweden and milk as an important source of several nutrients( 5 , Reference Monteagudo, Scander and Nilsen 31 ).
Wine and beer consumption has been increasing in Sweden over the last decades( 32 ), while the total consumption of alcohol has gone down( 23 ). In a previous report from Riksmaten 2010–11, the total mean alcohol intake for the Swedish adult population amounted to 13·0 (sd 16·9) and 7·3 (sd 10·5) g/d in men and women, respectively( 5 ).
The objective of the present paper was to describe the beverage consumption, the contribution of beverage energy to total energy intake as well as the alcohol intake, according to gender, region, meal type and day, for a Swedish adult population taking part in the Riksmaten study (2010–11).
Materials and methods
Study population
A secondary analysis was made on national data from the survey Riksmaten (2010–11) collected by the Swedish National Food Agency( 5 ). This survey included 5000 individuals in its sampling frame and was described in detail previously in reports from the National Food Agency, Sweden( 5 , 33 ) and in published papers( Reference Ax, Lemming and Becker 6 – Reference Ohrvik, Lemming and Nalsen 10 , Reference Winkvist, Hornell and Hallmans 12 ). In brief, a total of 1797 Swedish adults (56 % women) aged 18–80 years contributed with a food record during four consecutive days( Reference Ax, Lemming and Becker 6 ). The food record was web-based and specified portion size, meal type, time point, day of the week and venue, data that were used to estimate the consumption of beverages, beverage energy and alcohol intake. Riksmaten 2010–11 also included questionnaire data regarding educational level, age, gender, geographic location and region characteristics. Household measures, number of portions (cups, glass, pieces, slices) and grams were proposed by the Swedish National Food Agency to estimate the amounts eaten( Reference Warensjo Lemming, Nalsen and Becker 8 ). A validation study on the Riksmaten methodology was performed( Reference Nybacka, Forslund and Wirfält 34 ). We excluded 115 individuals who did not complete the questionnaire, hence the study population for the current analysis included 1682 participants (57 % women; Table 1).
General characteristics of the nationally representative population of Swedish adults, Riksmaten 2010–11 national dietary survey

The study was conducted according to the guidelines laid down in the Declaration of Helsinki. The Regional Ethical Review Board of Uppsala approved the Riksmaten study, and all participants gave oral informed consent before entering the study.
Estimation of beverage intake, beverage energy and alcohol intake
Total energy intake was split into two groups: energy from beverages such as milk, juice, coffee, tea, soft drinks and alcohol-containing beverages (wine, beer and spirits); and energy from foods. All fluid food items consumed through drinking (such as a glass of milk or milk in coffee) were included as beverage energy, while those consumed by eating (such as milk used in cooking) were categorized as food energy. Where difficulties arose in the interpretation of whether registered fluid food items contributed to energy from beverages or from solid foods, notes were taken on how the categorization was made to ensure consistency. For example, whereas milk recorded together with porridge or fruit compote was categorized as eaten, as were all soups (sweet and savoury), smoothies were categorized as drinks, although yoghurt with fruit was categorized as a solid food.
To analyse beverage consumption and its contribution to total energy intake, the beverages were categorized into twelve groups: (i) juice, (ii) coffee, (iii) tea, (iv) soft drinks, (v) diet soft drinks, (vi) wine, (vii) beer, (viii) cider, (ix) spirits, (x) low-alcohol beer, (xi) water and (xii) milk, based on food groups described by Ax et al. ( Reference Ax, Lemming and Becker 6 ) in a previous analysis of Riksmaten 2010–11 data. The ‘soft drinks’ group contained soft drinks, lemonade, sports and energy drinks, and non-alcoholic cider, while ‘diet soft drinks’ contained sugar-free soft drinks and light drinks. For alcohol-containing beverages, those types of cider containing alcohol were included in alcohol-containing drinks and the group ‘spirits’ also contained liqueurs (Cointreau, Bailey’s etc.).
Beverage intake was given as volume (ml), energy (kcal) and percentage of total energy intake. Furthermore, beverage intake was analysed according to gender, regional characteristics, type of meal (breakfast, lunch, dinner and other meals) and day (weekdays and weekend days). Monday to Thursday were considered weekdays, while Friday to Sunday were categorized as weekend days( Reference Paulsen, Myhre and Andersen 4 ). Regional characteristics (H-regions) were used to categorize type of region based on population density( 5 ). The H-regions were dichotomized into: (i) the three biggest cities (Stockholm, Gothenburg and Malmö); and (ii) all other types of regions.
Data analysis
Means and sd were calculated for beverage consumption, energy and alcohol intakes. Gender, region and weekday v. weekend day differences were studied using the Mann–Whitney U test due to non-parametric variables (energy intake, beverage consumption and alcohol intake). Furthermore, adjustment for total beverage intake was made to compare and confirm the results. This was done by dividing individual intake of each beverage category in ml/d by total beverage intake. As multiple comparisons are made and can result in chance findings, P values are provided to indicate if a comparison is statistically significant or not, to facilitate evaluation. All statistical analyses were conducted using the statistical software package IBM SPSS Statistics version 23. Significance level was set at P<0·05.
Results
Beverage consumption
Beverage consumption (ml/d and kcal/d) is described by gender in Table 2. The most consumed beverage in volume (ml/d) was water, followed by coffee for men as well as women. For both genders, the largest energy intake (kcal/d) came from milk, including milk in coffee. We found gender differences for juice, soft drinks, beer, spirits and low-alcohol beer where men had a higher consumption (counted as ml/d and kcal/d), and for tea and water where women had a higher consumption (ml/d); still, neither water nor tea, coffee or diet soft drink contributes to energy (Table 2). Furthermore, when adjusting for total beverage intake, the results were similar to those for gender differences between beverage categories. All categories, except for juice, kept gender differences compared with not adjusting for total beverage intake.
Beverage consumption, expressed as mean and sd and percentiles of volume (ml/d) and energy (kcal/d), by gender, among the nationally representative population of Swedish adults and women, Riksmaten 2010–11 national dietary survey
To convert to kJ/d, multiply kcal/d value by 4·184.
† Gender differences by the Mann–Whitney U test.
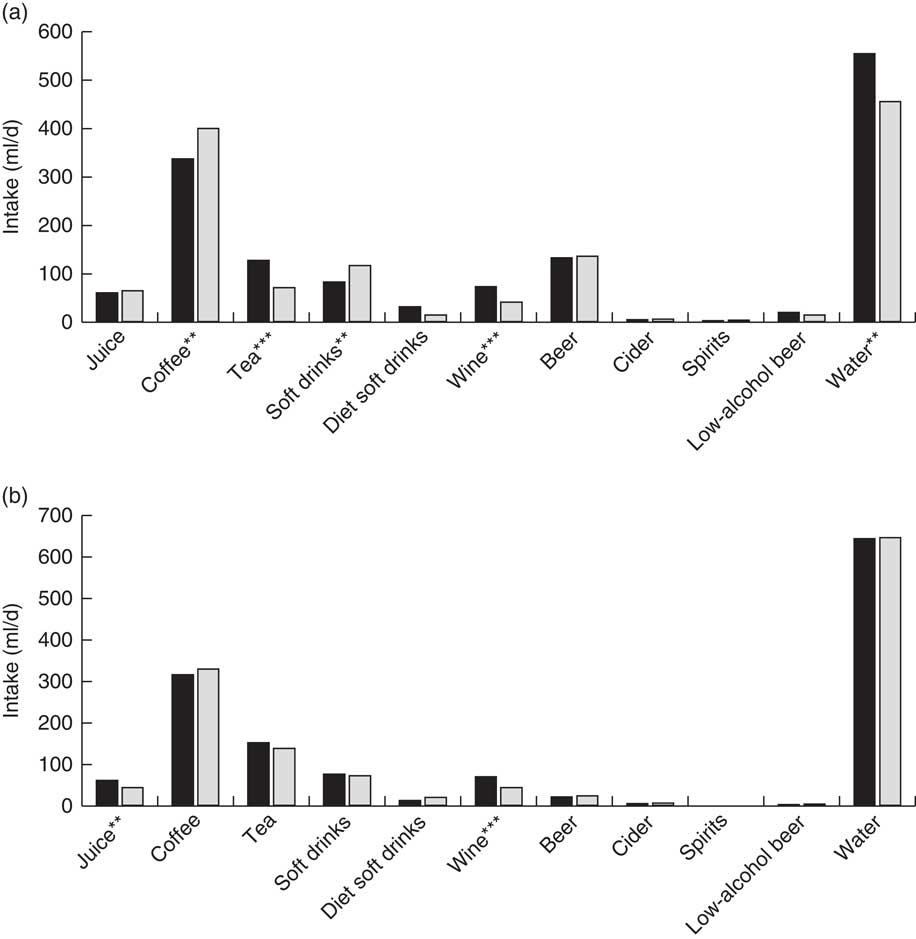
Figure 1 shows the beverage consumption according to H-region. Wine consumption was significantly higher for both genders in the biggest cities. Men from the biggest cities had a higher consumption of tea and a lower consumption of coffee and soft drinks than men from the other types of regions. Furthermore, women from the biggest cities had a higher consumption of juice than women from other regions. When adjusting for total beverage intake, the results were similar to those for regional differences between beverage categories, for both men and women (P<0·05).
Beverage consumption according to H-region (![]() , the three biggest cities (Stockholm, Gothenburg and Malmö);
, the three biggest cities (Stockholm, Gothenburg and Malmö); ![]() , all other types of regions) among the nationally representative population of Swedish adults, Riksmaten 2010–11 national dietary survey: (a) men; (b) women. H-region differences by Whitney–Mann U test: *P<0·05, **P<0·01, ***P<0·001
, all other types of regions) among the nationally representative population of Swedish adults, Riksmaten 2010–11 national dietary survey: (a) men; (b) women. H-region differences by Whitney–Mann U test: *P<0·05, **P<0·01, ***P<0·001
Energy intake and beverage contribution to energy per meal
Total energy intake, energy from foods and energy from beverages were significantly higher during weekend days than weekdays for both genders and for each meal (except breakfast for men, P=0·226; Table 3). Beverage energy percentage describes beverage energy in relation to individual energy intake in each meal category and the full day. Men had higher intake of total energy, energy from foods as well as energy from beverages than women for all weekdays/weekend days and meals. The highest energy intake from beverages was during dinner on weekend days for both genders. Men and women had a lower energy intake from beverages in the category ‘other meals’ during weekdays. However, the highest energy intake from beverages, as a percentage of total energy intake, stemmed from ‘other meals’ and the lowest percentage was during lunch for both genders (weekdays and weekend days).
Daily energy intake from beverages and foods per meal, expressed as mean and sd, by gender and weekday/weekend day, among the nationally representative population of Swedish adults, Riksmaten 2010–11 national dietary survey

E%, percentage of total energy.
To convert to kJ, multiply kcal value by 4·184.
Gender differences for
† weekdays and
‡ weekend days, by the Mann–Whitney U test.
Alcohol consumption
The highest alcohol intake stemmed from beer for men and wine for women (Table 4). Men had a significantly higher alcohol intake from beer, spirits and low-alcohol beer. Men also reported a significantly higher total alcohol intake (g/d and kcal/d) than women. Out of the total sample, 26 % of men and 28 % of women had a mean alcohol intake of >20 and >10 g/d, respectively. Also, 5 % of men and 3 % of women had alcohol intake above 48 and 36 g/d, respectively. Alcohol intake was higher in the biggest cities (P=0·002; data not shown).
Alcohol intake per beverage type and in total, expressed as mean and sd and percentiles, by gender, among the nationally representative population of Swedish adults and women, Riksmaten 2010–11 national dietary survey

To convert to kJ/d, multiply kcal/d value by 4·184.
† Gender differences by the Mann–Whitney U test.
Discussion
Beverage consumption
Our results showed that this Swedish adult population presented significant variations in beverage intake according to gender, type of day (weekdays v. weekend days), type of meal and region of living. Men reported a higher intake of almost all beverages and, therefore, a higher alcohol intake. Women reported a higher intake of water and tea.
We compared our results with the suggested intake of drinks included in the definition of the Nordic Diet as described by Adamsson et al. ( Reference Adamsson, Reumark and Cederholm 35 ), where juice and low-alcohol beer consumption was suggested as no more than 4 dl/week (60 ml/d) and 33 cl/d (330 ml/d), respectively. About 30 % of men had a juice consumption higher than this suggested level, but for low-alcohol beer the suggestions from Adamsson et al. ( Reference Adamsson, Reumark and Cederholm 35 ) were rather similar to our results.
The present results showed that tea, wine, water and juice consumption was higher for participants from the biggest cities, while consumption of coffee and soft drinks was higher in smaller cities. To our knowledge, a small number of international studies have documented geographic or regional differences in beverage consumption and these were focused on the comparison between rural and urban areas. For instance, Sharkey et al. ( Reference Sharkey, Johnson and Dean 36 ) found that soft drink consumption was significantly greater among rural adults from Texas compared with urban counterparts. We found geographic differences regarding alcohol consumption. Alcohol intake was significantly higher for residents from the biggest cities. A study of alcohol consumption across the urban and rural areas of the USA showed that abstinence was particularly common in the rural South( Reference Borders and Booth 37 ). According to Booth and Curran( Reference Booth and Curran 38 ), these variations can be explained by social and cultural factors, especially related to religious norms which could be more established in rural areas or smaller cities in American society( Reference Booth and Curran 38 ).
Compared with the Nordic Nutrition Recommendations( 29 ), we found that participants of both genders were equally at risk of having consumption higher than 20 or 10 g/d (75th percentile) for men or women, respectively (Table 4). A rather large proportion of the study population was also at risk of being above the recommended daily intake counted as alcohol intake contributing more than 6 or 4 % of total energy intake (corresponds to 75th percentile) for men or women, respectively. The alcohol energy percentage should, according to Nordic Nutrition Recommendations( 29 ), not be higher than 5 %. As many as 26 % of men and 28 % of women had a mean alcohol intake of >20 and >10 g/d, respectively, and also 5 % of men and 3 % of women had an alcohol intake above 48 and 36 g/d on occasions, which is seen as a high-risk consumption level( Reference Andréasson, Allebeck and Leifman 39 ). The alcohol intake mainly came from wine (9 g/d) for women and beer (7 g/d) and wine (9 g/d) for men (Table 4). This is in agreement with previous studies among adults where wine consumption for men and women was similar and men also added beer to the consumption( Reference Paulsen, Myhre and Andersen 4 , Reference Nikpartow, Danyliw and Whiting 16 , Reference Gibson and Shirreffs 19 , Reference An 20 , Reference Drewnowski, Rehm and Constant 40 ). The Swedish consumption of alcohol has been reported as below average in Europe( 41 ).
Energy intake and beverage contribution to energy per meal
Men and women differed in total energy intake from foods and beverages for all meals, during weekdays as well as weekend days (kcal/meal), which is reasonable as men generally have higher energy requirements than women( 29 ). Men had a higher energy intake from beverages, as kcal/d and percentage of total energy. This energy came from sugar and alcohol, like ‘empty calories’ from soft drinks and alcohol-containing beverages, and from protein and fat from milk and natural sugars in juice. Almost a third of beverage energy intake came from milk (31 % for men and 30 % for women). Sweden is a milk-drinking society( Reference Larsson, Virtamo and Wolk 42 ) and a large proportion of the daily intake of calcium, riboflavin and vitamin D stems from dairy products( 5 ). According to our results, a lot of the milk was consumed in coffee. Compared with the global consumption, Sweden is following the decreasing trend of milk consumption, but Sweden is still one of the highest milk-consuming populations the world( Reference Singh, Micha and Khatibzadeh 43 ). Concerning intakes of no-energy beverages such as water, coffee, tea and diet sodas, women had a higher intake of both water and tea than men, which was confirmed in a previous Swedish study( Reference Ax, Lemming and Becker 6 ).
The energy intake from foods as well as beverages was higher on weekend days than weekdays for all meal categories for both genders, which is consistent with a study of US adultsReference An (20) . The highest mean beverage energy intake occurred during dinner for both genders (on weekdays as well as weekends). This is also consistent with recently published data on Norwegian adults who had the highest consumption of soft drinks and wine at dinner( Reference Paulsen, Myhre and Andersen 4 ). Women had the lowest mean beverage energy intake at lunch (weekdays and weekend days) and men had the lowest mean beverage energy intake at weekend breakfast and weekday lunch. The highest mean beverage energy as a percentage of total energy intake stemmed from the category ‘other meals’ for both genders and the lowest percentage was during lunch (weekdays and weekend days). Both Paulsen et al. ( Reference Paulsen, Myhre and Andersen 4 ) and the Nordic Nutrition Recommendations (29) point out that there are national differences between countries with regard to beverage consumption and that it is therefore important to evaluate each country separately for dietary and public health guidelines.
There were some difficulties in interpreting intake as beverage or food energy. Milk, for example, is considered a beverage but if it was consumed with porridge or fruit compote, the energy was categorized as food. This was also the case when milk or other liquids were used in cooking. All soups have been categorized as eaten, for example fruit soup (blueberry or rosehip soup) or tomato soup. Smoothies were categorized as beverage but yoghurt with fruit has been categorized as food. Sugar logged together with coffee or tea was categorized as beverage energy. In some cases we had no information on amount or type of milk added, e.g. to latte or cappuccino or smoothies since only coffee had been reported with a generic name, and we relied on the version that had been selected in the database when coding the survey data( 33 ).
To facilitate the registration of data, pictures of different cup sizes were available to the informants( 5 ) to assist in the estimation of beverage consumption. This could have introduced an error since wine or beer glasses can be of very different sizes and the portion sizes might have been underestimated.
The alcohol content of alcohol-containing drinks was not asked for in the survey and in the national food database the average of alcohol content for wine and beer was restricted to very few choices. The alcohol content in the database was also probably too low for red wine (12 %), since the mean alcohol content for red wine was 13·5 % according to figures from the Swedish Monopoly describing sales( Reference Adamsson, Reumark and Cederholm 35 ). The alcohol content for white wine and beer in the national food database was 12·5 and 5·5 %, respectively; while the mean alcohol content according to the Swedish Monopoly was 12·2 % for white wine and 5·5 % for beer, with huge variations, from 5·5 to ≤20 % (for wine) and from 3·5 to ≤18·2 % (for beer). This means that the true value when it comes to alcohol intake might be considerably higher than our estimates, due to portion size underestimation, under-registration to socially acceptable level as well as alcohol content underestimates in the database. So, for a mean consumption of 5 g alcohol/d from red wine and a 1·5 % higher alcohol content, this would amount to 0·075 g more alcohol per day. Potential underestimation of alcohol intake due to this discrepancy in the food database was calculated and shown to be 1·0 and 1·6 % less than the actual alcohol (as a percentage of total energy) for women and men, respectively( 33 ). Still under-registration is one of the methodological problems in food registration( Reference Nybacka, Forslund and Wirfält 34 ).
Different levels of dilution of e.g. cordial, lemonade and juices could not be taken into account due to lack of information and we used the nutritional data from the national food database for beverages also here.
A decreased willingness to report unhealthy intakes might also have affected the results, to provide a more health-conscious intake. Furthermore, low participation rate was observed in Riksmaten 2010–11, which might have jeopardized the representativity of the study. Among the advantages of using data from Riksmaten 2010–11, we can mention the large number of participants, the use of a validated methodology for data collection, the registration of time points for intake and meal type, as well as the gathering of data over a full year to avoid seasonal effects.
Choice of beverages is an important part of choosing a healthy diet. It is important to increase awareness of the contribution of beverages to overall energy intake for populations, especially when new trends appear, such as the increased consumption of sugar-sweetened beverages described above. As stated by Duffey and Popkin( Reference Duffey and Popkin 44 ), there is probably a correlation between a healthier dietary pattern and beverage consumption pattern. We would say that new drinks and ways of serving drinks introduce new problems for researchers, such as the rising alcohol content in beer and wine, and the portion sizes in bottles purchased or glasses served.
Micronutrients in milk and juice v. energy contribution
When considering the high folate content of some fruit juices, the consumption of juice certainly could contribute to the intake of folate, even though other foods have been shown to be more important as folate sources in Riksmaten 2010–11, such as pulses, vegetables and fruit( Reference Monteagudo, Scander and Nilsen 31 ). There is some ambivalence concerning high juice intakes due to the relatively high content of natural sugars, but our results showed low intakes of juice in general. Also, the relatively high contribution of energy from milk should be discussed in accordance with its contribution of micronutrients.
Conclusions
A rather large proportion of the total energy intake of Swedish adults came from beverages. Higher intakes of beverage, food and total energy on weekend meals were identified. Also, men had a higher percentage of beverage energy than women, identified as alcohol-containing beverages and soft drinks. Beverages including wine, beer and soft drinks may contribute to a more enjoyable diet, but at the same time provide energy, sugar and alcohol. The challenge is to understand how beverages can be part of a healthy diet without contributing too much energy, sugar and alcohol. The public probably needs to be more aware of the contribution from sugar- and alcohol-containing beverages to total energy intake. More studies on beverage choice are needed to describe the patterns of intake, to understand the mechanisms behind beverage choice and portion size, in different settings and cultural situations.
Acknowledgements
Acknowledgements: The authors are most grateful to the Swedish National Food Agency for permitting the use of data from Riksmaten 2010–11. Financial support: This research received no specific grant from any funding agency in the public, commercial or not-for-profit sectors. This work is part of the first author’s PhD studies supported by an internal grant from Örebro University. The data collection was paid for by the National Food Agency of Sweden. The National Food Agency is an agency under the Ministry of Agriculture of Sweden and has national funds. Conflict of interest: None of the co-authors had funds from industry, they were all hired by different public universities. Authorship: H.S. wrote the paper, with supervision by A.Y. C.M. and R.N. helped with the method and designing the statistical analysis. R.T. together with A.Y. worked on drafting the article and revising it critically for important intellectual content. All authors gave final approval of the version to be published. Ethics of human subject participation: The Riksmaten study was conducted according to the guidelines laid down in the Declaration of Helsinki and all procedures involving human subjects were approved by the Regional Ethical Review Board of Uppsala. All subjects gave oral informed consent before entering the study.


